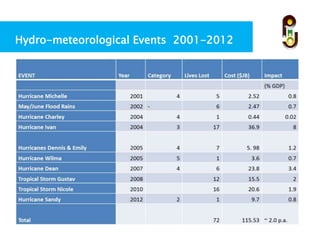
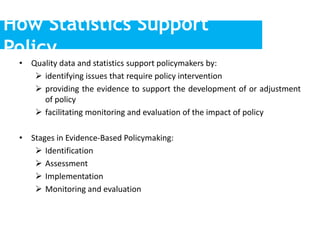
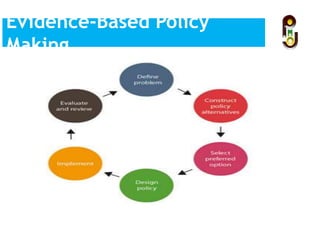
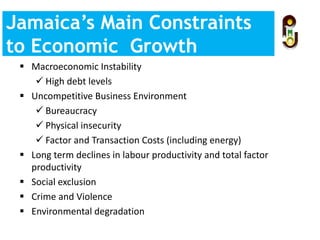
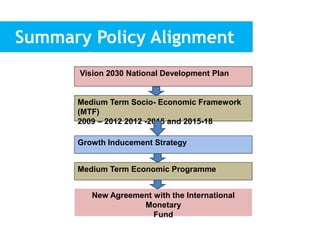
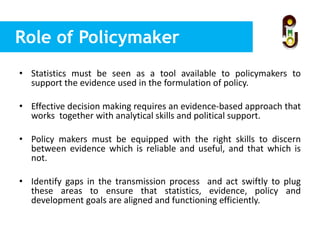
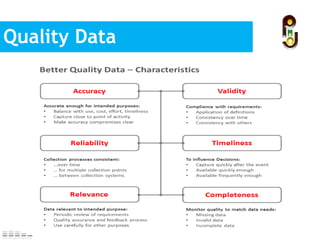
STATISTICS IN SUPPORT
OF POLICY
Presenter : Colin Bullock
Planning Institute of Jamaica
October 29, 2015
Outline
• Policy failure reinforcing the imperative for quality
statistics
• The dimensions of integrating statistical analysis with
policy
• The importance of quality statistics to policy
• Jamaica’s policy environment and challenges
• The consequences of misuse or ignorance
• The importance of analyst familiarity with data sources
• Strengthening capacity to generate and utilize quality
statistics.
Background
• Global thrust towards developing a culture of
evidence-based decision increasing the importance
of data and statistics.
• Underpinned by a results-based management
framework which situates information as
fundamental tools for planning, implementation
and monitoring and evaluation.
• Predicated on identified weaknesses in the
processes of policy formulation, resource
allocation, project and programme design,
implementation, management, monitoring and
evaluation.
Background
• Evolving focus of development and the methods
and tools utilized in achieving development
goals and targets.
• Millennium Development Goals (MDGs) and the
Sustainable Development Goals (SDGs) for the
post-2015 development agenda.
• Today, the definition of development includes
focus on inclusiveness, sustainability.
• Pursuit of change in the social, economic, socio-
cultural and political spheres and in
environmental resilience to man and climate
change.
Definitions
Statistics
• The science of learning from (or making sense out of) data.
• The theory and methods of extracting information from
observational data for solving real-world problem.
• The science of collecting and analyzing numerical data in
large quantities, especially for the purpose of inferring
proportions in a whole from those in a representative
sample.
Data
• numbers, words or images that have yet to be organized or
analyzed to answer a specific question.
Snapshot of Statistical
Analysis
6
Statistical
Analysis Data
Analysis
Data
Collection
Forecasting
Statistical Analysis Tools
and Methods• Threshold 21
– Designed to support long-term planning, which integrates,
economics, social and environment factors.
• Computable General Equilibrium
– Used to evaluate the impact of economic and policy shocks -
particularly policy reforms. It is a completely-specified model
of an economy including all production activities.
• Input-Output
– Used to assess/predict the impact of changes in one industry
on other industries
• Econometric models
– Used to forecast future developments in the economy
Importance of Quality Data and
Statistics• Evidence-based decision making, supported by
quality data and statistics has been recognized
as a necessity to formulate policies that are
technically sound, politically relevant and
results-based oriented.
• It has been predicated on identified weaknesses
in the processes of :
– Policy formulation
– Resource Allocation
– Project and Programme Design
– Implementation
– Management
– Monitoring and Evaluation
How Statistics Support
Policy
• Quality data and statistics support policymakers by:
 identifying issues that require policy intervention
 providing the evidence to support the development of or adjustment
of policy
 facilitating monitoring and evaluation of the impact of policy
• Stages in Evidence-Based Policymaking:
 Identification
 Assessment
 Implementation
 Monitoring and evaluation
Evidence-Based Policy
Making
• For a government to plan and monitor the impact of its
policies, it must be able to benchmark data and see year on
year progress. Comparing progress across countries is
important – shared indicators and statistical frameworks help
countries see how they are doing in comparison to others.
• Tracking progress on new goals will increase the demands on
often hard-pressed National Statistical Offices to collect and
analyse data in new areas. This in turn will require increasing
resources for the statistical system and building statistical
capacity, with the support of the international community.
Tracking Progress
 Fifty two years after independence Jamaica is still
challenged by:
 anaemic growth ( average growth of approximately 1.7 per
cent 1962-2013)
 poverty (largely rural)
 unplanned urbanization and
 high unemployment
 An interdependence between protracted low
economic growth and a heavy burden of public
indebtedness.
12
Evidence-Based Policy
Making
Jamaica’s History of
Underperformance
 Macroeconomic Instability
 High debt levels
 Uncompetitive Business Environment
 Bureaucracy
 Physical insecurity
 Factor and Transaction Costs (including energy)
 Long term declines in labour productivity and total factor
productivity
 Social exclusion
 Crime and Violence
 Environmental degradation
Jamaica’s Main Constraints
to Economic Growth
Vision 2030 Jamaica National
Development Plan– Jamaica’s first long-term National Development plan
– Developed using the Threshold 21 model which
supports:
• the integration of economic, environmental and
social elements of the society
• provides scenarios of future long term outcomes;
and
• project consequences of different strategies
across a range of indicators.
– Implemented through a series of 3-yearly Medium Term
Socio-Economic Policy Frameworks (MTFs)
– Underpinned by a results-based monitoring and
evaluation mechanism that establishes specific
indicators and targets to measure and track
performance.
• version of the
Summary Policy Alignment
Framework
Medium Term Economic Programme
New Agreement with the International
Monetary
Fund
Medium Term Socio- Economic Framework
(MTF)
2009 – 2012 2012 -2015 and 2015-18
Growth Inducement Strategy
Vision 2030 National Development Plan
Role of Policymaker
• Statistics must be seen as a tool available to policymakers to
support the evidence used in the formulation of policy.
• Effective decision making requires an evidence-based approach that
works together with analytical skills and political support.
• Policy makers must be equipped with the right skills to discern
between evidence which is reliable and useful, and that which is
not.
• Identify gaps in the transmission process and act swiftly to plug
these areas to ensure that statistics, evidence, policy and
development goals are aligned and functioning efficiently.
Taking a closer Look at
Statistics
• Statistics is woven into the fabric of evidence-
based policymaking, overlapping at each
stage, to create a seamless transmission of
quality statistics to policymakers to inform
decision making.
Quality Data
Assessing the Quality of
Statistics
Questions to consider in assessing the quality of data:
• What are the priority issues?
• Which statistics/indicators are needed to measure the
issues?
• Do the statistics/indicators exist?
• Are the data readily available?
• What are the data sources?
• How are the data collected?
• What is the data coverage?
• What is the periodicity of data collection?
• What is the quality of the data?
Statistics in the 21st
Century
• Technological advancements has changed how we interact
with statistics.
• The rise of mobile technology has facilitated improvements in
the timeliness and accuracy of data collection.
• Example
– “The Rapid Mobile Phone-based survey (RAMP)”, which relies on
a mobile phone-based software, allows surveys to be done
remotely using software that allows data to be uploaded onto
mobile phones or tablets.
– Completed survey are fed back to a server that allows real time
viewing of the data being collected.
Statistics in the 21st Century :
Data Collection
Visual Statistics
• Numerous software packages have been created and adopted by
practitioners in the areas of research, especially in the fields of economics,
sociology, political science and medicine.
• The capabilities of some these software packages include data
management, statistical analysis, graphics, simulations, regression
analysis, and custom programming.
Types and Sources of
Errors
• Any measurement process that generate statistical data is subject to error. Hence,
It is important for a researcher to be aware of these errors, in particular non-
sampling errors, so that they can be either minimised or eliminated from the data
collected.
• There are two types of errors:
1. Non-sampling errors
 These are errors that arise during the course of all data collection
activities.
2. Sampling errors.
 These are errors that arise because data has been collected from a part,
rather than the whole of the population. It refers to the difference
between the estimate derived from a sample survey and the 'true' value
that would result if a census of the whole population were taken under
the same conditions
Misuse, Non-use and
Misinterpretations• Notwithstanding errors that can occur during the statistical process,
statistics can be misused. The misuse of statistics can produce subtle, but
serious errors in description and interpretation.
Misuse, Non-use and
Misinterpretations
Statistical Literacy
• Skepticism and misunderstanding of statistics is commonly
associated with the quotation.
"There are three kinds of lies: lies, damned lies, and statistics".
• It is paramount for citizens to understand material presented
in publications such as newspapers, television, and the
Internet to be able to differentiate between unreliable and
reliable statistics.
• This is particularly important as the frequency and methods
in which people interact with statistics is evolving at a rapid
pace.
The Great Debate 1
The Great Debate 2
• Time series of global mean sea level
(deviation from the 1980-1999 mean)
in the past and as projected for the
future.
• For the period before 1870, global
measurements of sea level are not
available.
• The grey shading shows the uncertainty
in the estimated long-term rate of sea
level change.
• The red line is a reconstruction of
global mean sea level from tide
gauges, and the red shading denotes
the range of variations from a smooth
curve. The green line shows global
mean sea level observed from satellite
altimetry.
• The blue shading represents the range
of model projections for the SRES A1B
scenario for the 21st century, relative
to the 1980 to 1999 mean, and has
been calculated independently from the
observations.
Estimates, Projections and Forecasts
Sea level rise
• Global sea level rose about 17 centimeters (6.7 inches)
in the last century. The rate in the last decade, however,
is nearly double that of the last century.
• Due to the close proximity to the equator, Caribbean sea
level rise may be higher than in other regions.
• Caribbean coral reefs ‘will be lost
within 20 years’ without protection
• A comprehensive analysis by 90
experts of more than 35,000
surveys conducted at nearly 100
Caribbean locations since 1970
shows that the region’s corals have
declined by more than 50%.
• The earth’s average temperature has
increased by 0.74°C over the past
century.
Global
Warming
Projected land loss from sea
level rise at Hope Bay,
Portland.
Melting Ice
Caps
Overcrowded
Schools
Overcrowded
Hospitals
And on the Other Hand
Under-populated schools
Underutilized clinics
Abandoned and vandalized
community centres
Neglected sports facilities
Empty transportation
centres
0.00
50.00
100.00
150.00
200.00
250.00
PercentageofGDP
Debt to GDP Profile
Domestic Debt External Debt Total Stock of Debt
Domestic Debt
External Debt
TOTAL STOCK OF
DEBT
Constraints of Debt Service (Budget)
Hydro-meteorological Events 2001-2012
A Forecast of The Way Forward
• The need to improve the dialogue between policymakers
and the statistician community
• Whilst it may be unrealistic for professional decision-
makers and practitioners to be competent doers of
statistics, it is both reasonable and necessary for
policymakers to be able to understand and use statistics
in their professional practice
A Forecast of The Way Forward…continued
• Statisticians often need to ‘translate’ statistics
into a language that is useful to the users of
evidence, without distorting or misrepresenting
data.
• Improve ownership and uptake of evidence, in
both policy and practice, developing better,
ongoing interaction between evidence providers
and evidence users.
A Forecast of The Way Forward…continued
• Strengthen national and regional information and
statistical and analytical services relevant to sustainable
development polices and programmes.
• Analysts, forecasters and policymakers to support
adequate resource base for statisticians.
• Statisticians to be less passive in accepting results and
implications of resource inadequacy.
Conclusion
• Successful integration of evidence with policy
process depends on
 quality statistics
Sound data collection, processing, forecasting
and analysis
ensuring that policy makers have a discriminatory
familiarity with source data
H0 : The cost of neglecting quality statistics
exceeds that of investing in and properly
utilizing quality statistics.

Statistics in Support of Policy

  • 1.
    STATISTICS IN SUPPORT OFPOLICY Presenter : Colin Bullock Planning Institute of Jamaica October 29, 2015
  • 2.
    Outline • Policy failurereinforcing the imperative for quality statistics • The dimensions of integrating statistical analysis with policy • The importance of quality statistics to policy • Jamaica’s policy environment and challenges • The consequences of misuse or ignorance • The importance of analyst familiarity with data sources • Strengthening capacity to generate and utilize quality statistics.
  • 3.
    Background • Global thrusttowards developing a culture of evidence-based decision increasing the importance of data and statistics. • Underpinned by a results-based management framework which situates information as fundamental tools for planning, implementation and monitoring and evaluation. • Predicated on identified weaknesses in the processes of policy formulation, resource allocation, project and programme design, implementation, management, monitoring and evaluation.
  • 4.
    Background • Evolving focusof development and the methods and tools utilized in achieving development goals and targets. • Millennium Development Goals (MDGs) and the Sustainable Development Goals (SDGs) for the post-2015 development agenda. • Today, the definition of development includes focus on inclusiveness, sustainability. • Pursuit of change in the social, economic, socio- cultural and political spheres and in environmental resilience to man and climate change.
  • 5.
    Definitions Statistics • The scienceof learning from (or making sense out of) data. • The theory and methods of extracting information from observational data for solving real-world problem. • The science of collecting and analyzing numerical data in large quantities, especially for the purpose of inferring proportions in a whole from those in a representative sample. Data • numbers, words or images that have yet to be organized or analyzed to answer a specific question.
  • 6.
    Snapshot of Statistical Analysis 6 Statistical AnalysisData Analysis Data Collection Forecasting
  • 7.
    Statistical Analysis Tools andMethods• Threshold 21 – Designed to support long-term planning, which integrates, economics, social and environment factors. • Computable General Equilibrium – Used to evaluate the impact of economic and policy shocks - particularly policy reforms. It is a completely-specified model of an economy including all production activities. • Input-Output – Used to assess/predict the impact of changes in one industry on other industries • Econometric models – Used to forecast future developments in the economy
  • 8.
    Importance of QualityData and Statistics• Evidence-based decision making, supported by quality data and statistics has been recognized as a necessity to formulate policies that are technically sound, politically relevant and results-based oriented. • It has been predicated on identified weaknesses in the processes of : – Policy formulation – Resource Allocation – Project and Programme Design – Implementation – Management – Monitoring and Evaluation
  • 9.
    How Statistics Support Policy •Quality data and statistics support policymakers by:  identifying issues that require policy intervention  providing the evidence to support the development of or adjustment of policy  facilitating monitoring and evaluation of the impact of policy • Stages in Evidence-Based Policymaking:  Identification  Assessment  Implementation  Monitoring and evaluation
  • 10.
  • 11.
    • For agovernment to plan and monitor the impact of its policies, it must be able to benchmark data and see year on year progress. Comparing progress across countries is important – shared indicators and statistical frameworks help countries see how they are doing in comparison to others. • Tracking progress on new goals will increase the demands on often hard-pressed National Statistical Offices to collect and analyse data in new areas. This in turn will require increasing resources for the statistical system and building statistical capacity, with the support of the international community. Tracking Progress
  • 12.
     Fifty twoyears after independence Jamaica is still challenged by:  anaemic growth ( average growth of approximately 1.7 per cent 1962-2013)  poverty (largely rural)  unplanned urbanization and  high unemployment  An interdependence between protracted low economic growth and a heavy burden of public indebtedness. 12 Evidence-Based Policy Making Jamaica’s History of Underperformance
  • 13.
     Macroeconomic Instability High debt levels  Uncompetitive Business Environment  Bureaucracy  Physical insecurity  Factor and Transaction Costs (including energy)  Long term declines in labour productivity and total factor productivity  Social exclusion  Crime and Violence  Environmental degradation Jamaica’s Main Constraints to Economic Growth
  • 14.
    Vision 2030 JamaicaNational Development Plan– Jamaica’s first long-term National Development plan – Developed using the Threshold 21 model which supports: • the integration of economic, environmental and social elements of the society • provides scenarios of future long term outcomes; and • project consequences of different strategies across a range of indicators. – Implemented through a series of 3-yearly Medium Term Socio-Economic Policy Frameworks (MTFs) – Underpinned by a results-based monitoring and evaluation mechanism that establishes specific indicators and targets to measure and track performance. • version of the
  • 15.
    Summary Policy Alignment Framework MediumTerm Economic Programme New Agreement with the International Monetary Fund Medium Term Socio- Economic Framework (MTF) 2009 – 2012 2012 -2015 and 2015-18 Growth Inducement Strategy Vision 2030 National Development Plan
  • 16.
    Role of Policymaker •Statistics must be seen as a tool available to policymakers to support the evidence used in the formulation of policy. • Effective decision making requires an evidence-based approach that works together with analytical skills and political support. • Policy makers must be equipped with the right skills to discern between evidence which is reliable and useful, and that which is not. • Identify gaps in the transmission process and act swiftly to plug these areas to ensure that statistics, evidence, policy and development goals are aligned and functioning efficiently.
  • 17.
    Taking a closerLook at Statistics • Statistics is woven into the fabric of evidence- based policymaking, overlapping at each stage, to create a seamless transmission of quality statistics to policymakers to inform decision making.
  • 18.
  • 19.
    Assessing the Qualityof Statistics Questions to consider in assessing the quality of data: • What are the priority issues? • Which statistics/indicators are needed to measure the issues? • Do the statistics/indicators exist? • Are the data readily available? • What are the data sources? • How are the data collected? • What is the data coverage? • What is the periodicity of data collection? • What is the quality of the data?
  • 20.
    Statistics in the21st Century • Technological advancements has changed how we interact with statistics. • The rise of mobile technology has facilitated improvements in the timeliness and accuracy of data collection. • Example – “The Rapid Mobile Phone-based survey (RAMP)”, which relies on a mobile phone-based software, allows surveys to be done remotely using software that allows data to be uploaded onto mobile phones or tablets. – Completed survey are fed back to a server that allows real time viewing of the data being collected.
  • 21.
    Statistics in the21st Century : Data Collection
  • 22.
    Visual Statistics • Numeroussoftware packages have been created and adopted by practitioners in the areas of research, especially in the fields of economics, sociology, political science and medicine. • The capabilities of some these software packages include data management, statistical analysis, graphics, simulations, regression analysis, and custom programming.
  • 23.
    Types and Sourcesof Errors • Any measurement process that generate statistical data is subject to error. Hence, It is important for a researcher to be aware of these errors, in particular non- sampling errors, so that they can be either minimised or eliminated from the data collected. • There are two types of errors: 1. Non-sampling errors  These are errors that arise during the course of all data collection activities. 2. Sampling errors.  These are errors that arise because data has been collected from a part, rather than the whole of the population. It refers to the difference between the estimate derived from a sample survey and the 'true' value that would result if a census of the whole population were taken under the same conditions
  • 24.
    Misuse, Non-use and Misinterpretations•Notwithstanding errors that can occur during the statistical process, statistics can be misused. The misuse of statistics can produce subtle, but serious errors in description and interpretation.
  • 25.
  • 26.
    Statistical Literacy • Skepticismand misunderstanding of statistics is commonly associated with the quotation. "There are three kinds of lies: lies, damned lies, and statistics". • It is paramount for citizens to understand material presented in publications such as newspapers, television, and the Internet to be able to differentiate between unreliable and reliable statistics. • This is particularly important as the frequency and methods in which people interact with statistics is evolving at a rapid pace.
  • 30.
  • 31.
  • 32.
    • Time seriesof global mean sea level (deviation from the 1980-1999 mean) in the past and as projected for the future. • For the period before 1870, global measurements of sea level are not available. • The grey shading shows the uncertainty in the estimated long-term rate of sea level change. • The red line is a reconstruction of global mean sea level from tide gauges, and the red shading denotes the range of variations from a smooth curve. The green line shows global mean sea level observed from satellite altimetry. • The blue shading represents the range of model projections for the SRES A1B scenario for the 21st century, relative to the 1980 to 1999 mean, and has been calculated independently from the observations. Estimates, Projections and Forecasts
  • 33.
    Sea level rise •Global sea level rose about 17 centimeters (6.7 inches) in the last century. The rate in the last decade, however, is nearly double that of the last century. • Due to the close proximity to the equator, Caribbean sea level rise may be higher than in other regions.
  • 34.
    • Caribbean coralreefs ‘will be lost within 20 years’ without protection • A comprehensive analysis by 90 experts of more than 35,000 surveys conducted at nearly 100 Caribbean locations since 1970 shows that the region’s corals have declined by more than 50%.
  • 35.
    • The earth’saverage temperature has increased by 0.74°C over the past century. Global Warming
  • 36.
    Projected land lossfrom sea level rise at Hope Bay, Portland.
  • 37.
  • 39.
  • 40.
  • 41.
    And on theOther Hand Under-populated schools Underutilized clinics Abandoned and vandalized community centres Neglected sports facilities Empty transportation centres
  • 42.
    0.00 50.00 100.00 150.00 200.00 250.00 PercentageofGDP Debt to GDPProfile Domestic Debt External Debt Total Stock of Debt Domestic Debt External Debt TOTAL STOCK OF DEBT
  • 43.
    Constraints of DebtService (Budget)
  • 44.
  • 45.
    A Forecast ofThe Way Forward • The need to improve the dialogue between policymakers and the statistician community • Whilst it may be unrealistic for professional decision- makers and practitioners to be competent doers of statistics, it is both reasonable and necessary for policymakers to be able to understand and use statistics in their professional practice
  • 46.
    A Forecast ofThe Way Forward…continued • Statisticians often need to ‘translate’ statistics into a language that is useful to the users of evidence, without distorting or misrepresenting data. • Improve ownership and uptake of evidence, in both policy and practice, developing better, ongoing interaction between evidence providers and evidence users.
  • 47.
    A Forecast ofThe Way Forward…continued • Strengthen national and regional information and statistical and analytical services relevant to sustainable development polices and programmes. • Analysts, forecasters and policymakers to support adequate resource base for statisticians. • Statisticians to be less passive in accepting results and implications of resource inadequacy.
  • 48.
    Conclusion • Successful integrationof evidence with policy process depends on  quality statistics Sound data collection, processing, forecasting and analysis ensuring that policy makers have a discriminatory familiarity with source data H0 : The cost of neglecting quality statistics exceeds that of investing in and properly utilizing quality statistics.

Editor's Notes

  • #7 Collection Data that conforms to high quality standards It is conventional to begin with a statistical population or a statistical model process to be studied. In the absence of census data, statisticians collect data by developing specific experiment designs and survey sample. Representative sampling assures that inferences and conclusions can safely extend from the sample to the population as a whole. Analysis Two main statistical methodologies are used in data analysis: Descriptive statistics: summarizes data from a sample using indexes such as the mean or standard deviation Inferential statistics: draws conclusions from data that are subject to random variation (e.g., observational errors, sampling variation). Forecasting the process of making predictions of the future based on past and present data and analysis of trends. Depends on the availability and quality of data Long-term forecast will be less accurate as compared to short-term forecast Based on specific assumptions. Subject to estimation error.