Download to read offline
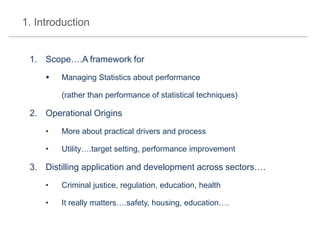
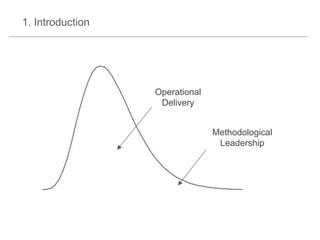


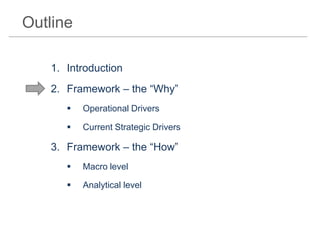
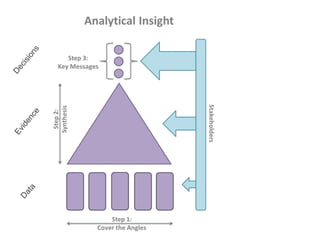
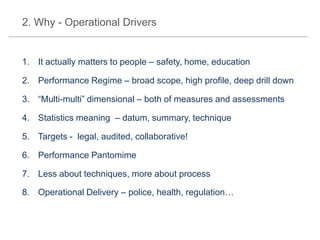


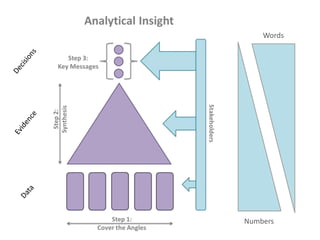
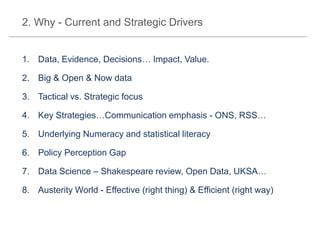


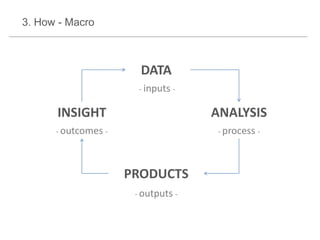
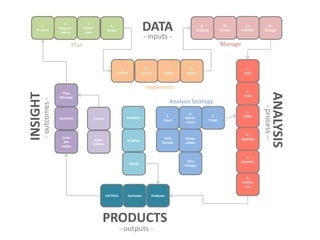

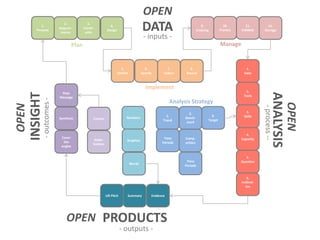
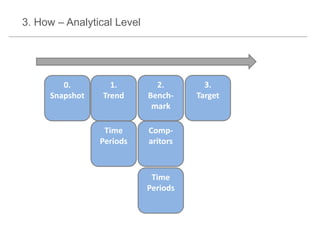
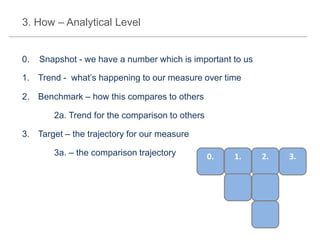
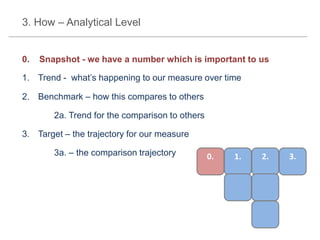
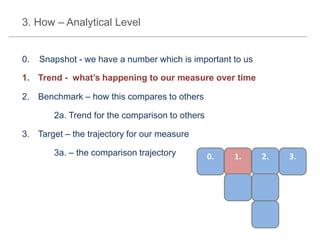
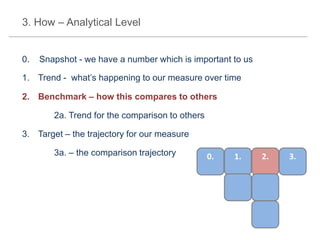
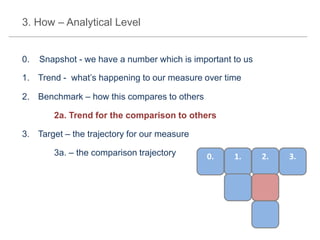
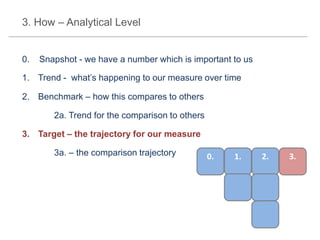
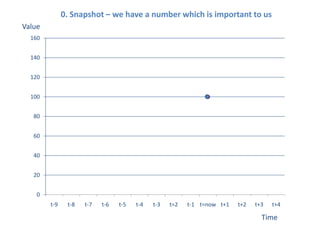
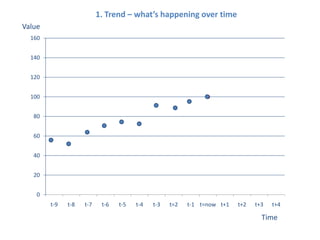
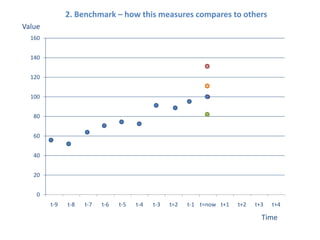
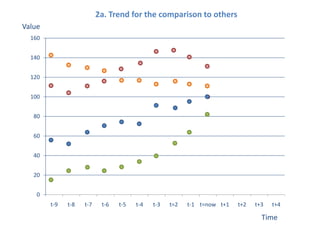
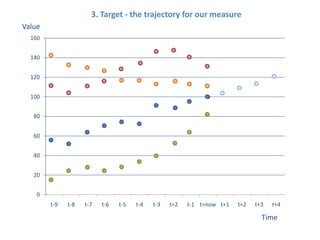
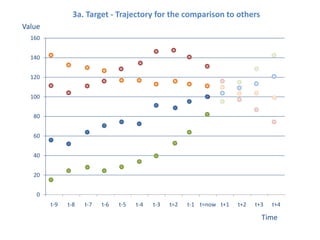
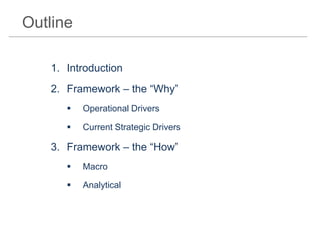

The document presents a framework for understanding statistical performance. It outlines operational and strategic drivers for managing statistics about performance. Operationally, performance is important to outcomes like safety and education. Strategically, there is more data and emphasis on using data for decisions. The framework provides a macro level overview of the data, analysis, insight, and product cycle. It also details an analytical level approach involving a snapshot, trend, benchmark, and target analysis to understand a measure over time and versus comparisons. The goal is to extract insight from data to improve performance.