This document summarizes tourism trends globally and in specific regions or countries. Some key points:
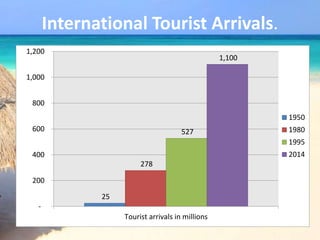
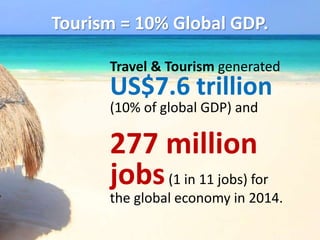
- Tourism has grown significantly over the last 60 years and is now one of the largest economic sectors worldwide, contributing 10% to global GDP. International tourist arrivals grew from 278 million in 1980 to over 1 billion in 2014.
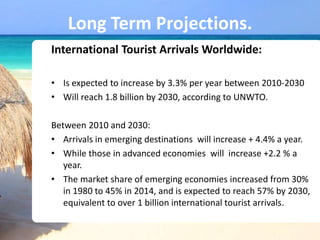
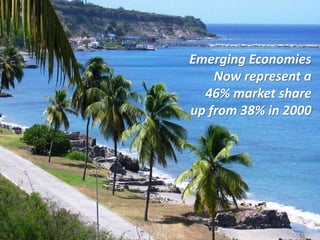
- Emerging markets are growing more quickly and now represent 46% of international tourist arrivals, up from 30% in 1980. By 2030, 57% of arrivals are projected to be in emerging markets.
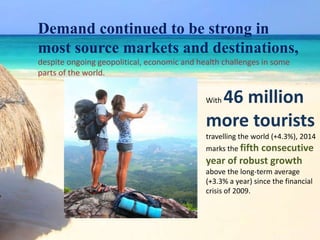
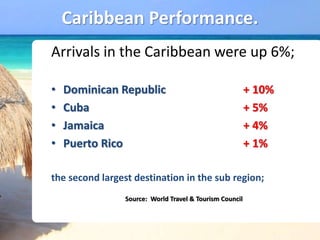
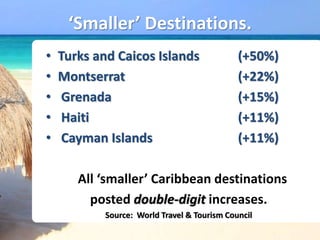
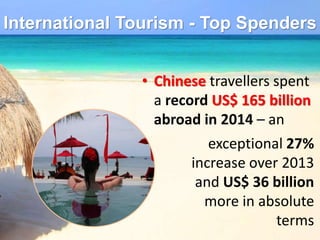
- Top spending countries on international tourism in 2014 were China at $165 billion and the United States at $111 billion, showing China's growing importance. Many regions experienced strong tourism growth