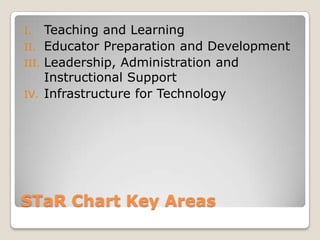
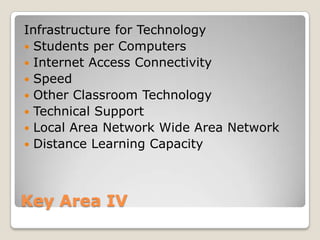
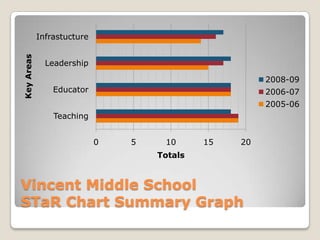
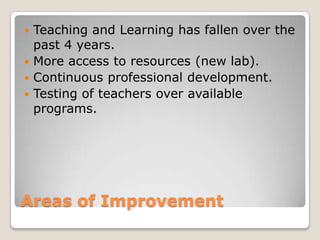
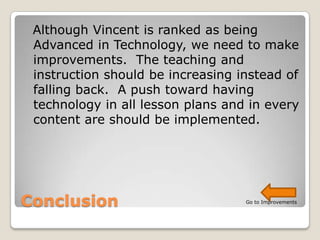
Vincent Middle School
 STaR Chart Summary
                                 By:
                        Ethel Mathew


            Click picture for school website
Agenda


   STaR Chart Introduction
   Four Key Areas Defined
   Yearly Comparison
   Areas of Improvement
   Conclusion
   STaR Charts are          Determining the
    used to determine a       level of need for
    schools needs and         professional
    usage of                  development in
    technology.               schools.
   State guidelines         Administrators
    mandate that              analyze their
    technology                school’s technology
    instruction be            status and focus on
    increased.                growth.


Purpose
I.   Teaching and Learning
II. Educator Preparation and Development
III. Leadership, Administration and
     Instructional Support
IV. Infrastructure for Technology


STaR Chart Key Areas
Teaching and Learning
 Patterns of Classroom Use
 Frequency/Design of Instructional Setting
 Content Area Connections
 Technology Applications (TA) TEKS
  Implementation
 Student Mastery of Technology
  Applications
 Online Learning


Key Area I
Educator Preparation and Development
 Professional Development Experiences
 Models of Professional Development
 Capabilities of Educators
 Access to Professional Development
 Levels of Understanding and Patterns of
  Use
 Professional Development for Online
  Learning


Key Area II
Leadership, Administration and
  Instructional Support
 Leadership and Vision
 Planning
 Instructional Support
 Communication and Collaboration
 Budget
 Leadership and Support for Online
  Learning


Key Area III
Infrastructure for Technology
 Students per Computers
 Internet Access Connectivity
 Speed
 Other Classroom Technology
 Technical Support
 Local Area Network Wide Area Network
 Distance Learning Capacity


Key Area IV
Infrastucture
Key Areas


              Leadership

                                                       2008-09
                Educator                               2006-07
                                                       2005-06
                Teaching


                            0   5    10      15   20
                                    Totals


Vincent Middle School
STaR Chart Summary Graph
 Teaching and Learning has fallen over the
  past 4 years.
 More access to resources (new lab).
 Continuous professional development.
 Testing of teachers over available
  programs.


Areas of Improvement
Although Vincent is ranked as being
 Advanced in Technology, we need to make
 improvements. The teaching and
 instruction should be increasing instead of
 falling back. A push toward having
 technology in all lesson plans and in every
 content are should be implemented.


Conclusion                         Go to Improvements

Star Chart Presentation

  • 1.
    Vincent Middle School STaR Chart Summary By: Ethel Mathew Click picture for school website
  • 2.
    Agenda  STaR Chart Introduction  Four Key Areas Defined  Yearly Comparison  Areas of Improvement  Conclusion
  • 3.
    STaR Charts are  Determining the used to determine a level of need for schools needs and professional usage of development in technology. schools.  State guidelines  Administrators mandate that analyze their technology school’s technology instruction be status and focus on increased. growth. Purpose
  • 4.
    I. Teaching and Learning II. Educator Preparation and Development III. Leadership, Administration and Instructional Support IV. Infrastructure for Technology STaR Chart Key Areas
  • 5.
    Teaching and Learning Patterns of Classroom Use  Frequency/Design of Instructional Setting  Content Area Connections  Technology Applications (TA) TEKS Implementation  Student Mastery of Technology Applications  Online Learning Key Area I
  • 6.
    Educator Preparation andDevelopment  Professional Development Experiences  Models of Professional Development  Capabilities of Educators  Access to Professional Development  Levels of Understanding and Patterns of Use  Professional Development for Online Learning Key Area II
  • 7.
    Leadership, Administration and Instructional Support  Leadership and Vision  Planning  Instructional Support  Communication and Collaboration  Budget  Leadership and Support for Online Learning Key Area III
  • 8.
    Infrastructure for Technology Students per Computers  Internet Access Connectivity  Speed  Other Classroom Technology  Technical Support  Local Area Network Wide Area Network  Distance Learning Capacity Key Area IV
  • 9.
    Infrastucture Key Areas Leadership 2008-09 Educator 2006-07 2005-06 Teaching 0 5 10 15 20 Totals Vincent Middle School STaR Chart Summary Graph
  • 10.
     Teaching andLearning has fallen over the past 4 years.  More access to resources (new lab).  Continuous professional development.  Testing of teachers over available programs. Areas of Improvement
  • 11.
    Although Vincent isranked as being Advanced in Technology, we need to make improvements. The teaching and instruction should be increasing instead of falling back. A push toward having technology in all lesson plans and in every content are should be implemented. Conclusion Go to Improvements