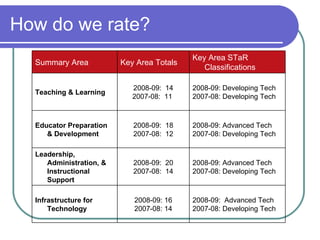
Texas STaR Chart AGENDA Why do we do it? What does it mean? How does it affect SME? Key Areas of Chart How do we rate? What’s our future?
What is STaR Chart? S chool  T echnology  a nd  R eadiness Chart Online resource tool for self-assessment of our campus’ and district’s efforts to effectively integrate technology across the curriculum. Shows alignment with the Long-Range Plan for Technology, 2006-2020.
Why Do It? No Child Left Behind Act of 2001 emphasizes student achievement and assessment of fundamental knowledge and skills.  NCLB requires that students be technology literate by the end of the eighth grade. NCLB requires that teachers be technology literate and integrate technology across the curriculum. (Technology Proficiencies) Schools and districts must comply with federal and state requirements in regards to technology application standards.
How it Affects Sorters Mill STaR Chart is a tool designed for use in technology planning, budgeting or resources, and evaluation of progress in local technology projects. All applications for state funded technology grants must complete the STaR Chart.
What are the Ratings? Early Tech (Score of 6-8) Developing Tech (Score of 9-14) Advanced Tech (Score of 15-20) Target Tech (Score of 21-24)
Teaching and Learning Total = 14 DEVELOPING TECH 2 3 2 3 2 2 Online Learning Student Mastery of Technology Applications Technology Applications TEKS Implementa-tion Content Area Connections Frequency/Design of Instructional Setting Using Digital Content Patterns of Classroom Use
Educator Preparation and Development Total = 18 advanced TECH 3 3 3 4 2 3 Professional Development for Online Learning Levels of Understand-ing and Patterns of Use Access to Professional Development Capabilities of Educators Models of Professional Development Professional Development Experiences
Leadership, Administration, and Instructional Support Total = 20 advanced TECH 4 3 4 3 3 3 Leadership and Support for Online Learning Budget Communication and Collabora-tion Instructional Support Planning Leadership and Vision
Infrastructure for Technology Total = 16 advanced TECH 2 3 3 2 4 2 Distance Learning Capacity Local Area Network Wide Area Network Technical Support Other Classroom Technol-ogy Internet Access Connectiv-ity Speed Students per Computers
How do we rate? 2008-09:  Advanced Tech 2007-08: Developing Tech 2008-09: 16 2007-08: 14 Infrastructure for Technology 2008-09: Advanced Tech 2007-08: Developing Tech 2008-09:  20 2007-08:  14 Leadership, Administration, & Instructional Support 2008-09: Advanced Tech 2007-08: Developing Tech 2008-09:  18 2007-08:  12 Educator Preparation & Development 2008-09: Developing Tech 2007-08: Developing Tech 2008-09:  14 2007-08:  11  Teaching & Learning Key Area STaR Classifications Key Area Totals Summary Area
What’s our Future? Focus needs to be on Teaching and Learning! Use technology in teacher led and some student-centered learning experiences to develop higher-order thinking skills. Provide opportunities for collaboration with content, experts, peers, parents, and community. Student evaluate and analyze data to solve problems. Have regular weekly access to use of technology and digital resources in various instructional settings. Consistently use Technology Applications TEKS as appropriate for content area and grade level. Create web-based lessons which include on-line TEKS based content, resources, learning activities, and interactive communications that support learning objectives.
Links for More Information http://starchart.esc12.net/ http://www.sbec.state.tx.us/SBECOnline/standtest/standards/techapps_allbegtch.pdf http://www.iste.org http://www.ed.gov/nclb

Star Chart

  • 1.
  • 2.
    Texas STaR ChartAGENDA Why do we do it? What does it mean? How does it affect SME? Key Areas of Chart How do we rate? What’s our future?
  • 3.
    What is STaRChart? S chool T echnology a nd R eadiness Chart Online resource tool for self-assessment of our campus’ and district’s efforts to effectively integrate technology across the curriculum. Shows alignment with the Long-Range Plan for Technology, 2006-2020.
  • 4.
    Why Do It?No Child Left Behind Act of 2001 emphasizes student achievement and assessment of fundamental knowledge and skills. NCLB requires that students be technology literate by the end of the eighth grade. NCLB requires that teachers be technology literate and integrate technology across the curriculum. (Technology Proficiencies) Schools and districts must comply with federal and state requirements in regards to technology application standards.
  • 5.
    How it AffectsSorters Mill STaR Chart is a tool designed for use in technology planning, budgeting or resources, and evaluation of progress in local technology projects. All applications for state funded technology grants must complete the STaR Chart.
  • 6.
    What are theRatings? Early Tech (Score of 6-8) Developing Tech (Score of 9-14) Advanced Tech (Score of 15-20) Target Tech (Score of 21-24)
  • 7.
    Teaching and LearningTotal = 14 DEVELOPING TECH 2 3 2 3 2 2 Online Learning Student Mastery of Technology Applications Technology Applications TEKS Implementa-tion Content Area Connections Frequency/Design of Instructional Setting Using Digital Content Patterns of Classroom Use
  • 8.
    Educator Preparation andDevelopment Total = 18 advanced TECH 3 3 3 4 2 3 Professional Development for Online Learning Levels of Understand-ing and Patterns of Use Access to Professional Development Capabilities of Educators Models of Professional Development Professional Development Experiences
  • 9.
    Leadership, Administration, andInstructional Support Total = 20 advanced TECH 4 3 4 3 3 3 Leadership and Support for Online Learning Budget Communication and Collabora-tion Instructional Support Planning Leadership and Vision
  • 10.
    Infrastructure for TechnologyTotal = 16 advanced TECH 2 3 3 2 4 2 Distance Learning Capacity Local Area Network Wide Area Network Technical Support Other Classroom Technol-ogy Internet Access Connectiv-ity Speed Students per Computers
  • 11.
    How do werate? 2008-09: Advanced Tech 2007-08: Developing Tech 2008-09: 16 2007-08: 14 Infrastructure for Technology 2008-09: Advanced Tech 2007-08: Developing Tech 2008-09: 20 2007-08: 14 Leadership, Administration, & Instructional Support 2008-09: Advanced Tech 2007-08: Developing Tech 2008-09: 18 2007-08: 12 Educator Preparation & Development 2008-09: Developing Tech 2007-08: Developing Tech 2008-09: 14 2007-08: 11 Teaching & Learning Key Area STaR Classifications Key Area Totals Summary Area
  • 12.
    What’s our Future?Focus needs to be on Teaching and Learning! Use technology in teacher led and some student-centered learning experiences to develop higher-order thinking skills. Provide opportunities for collaboration with content, experts, peers, parents, and community. Student evaluate and analyze data to solve problems. Have regular weekly access to use of technology and digital resources in various instructional settings. Consistently use Technology Applications TEKS as appropriate for content area and grade level. Create web-based lessons which include on-line TEKS based content, resources, learning activities, and interactive communications that support learning objectives.
  • 13.
    Links for MoreInformation http://starchart.esc12.net/ http://www.sbec.state.tx.us/SBECOnline/standtest/standards/techapps_allbegtch.pdf http://www.iste.org http://www.ed.gov/nclb