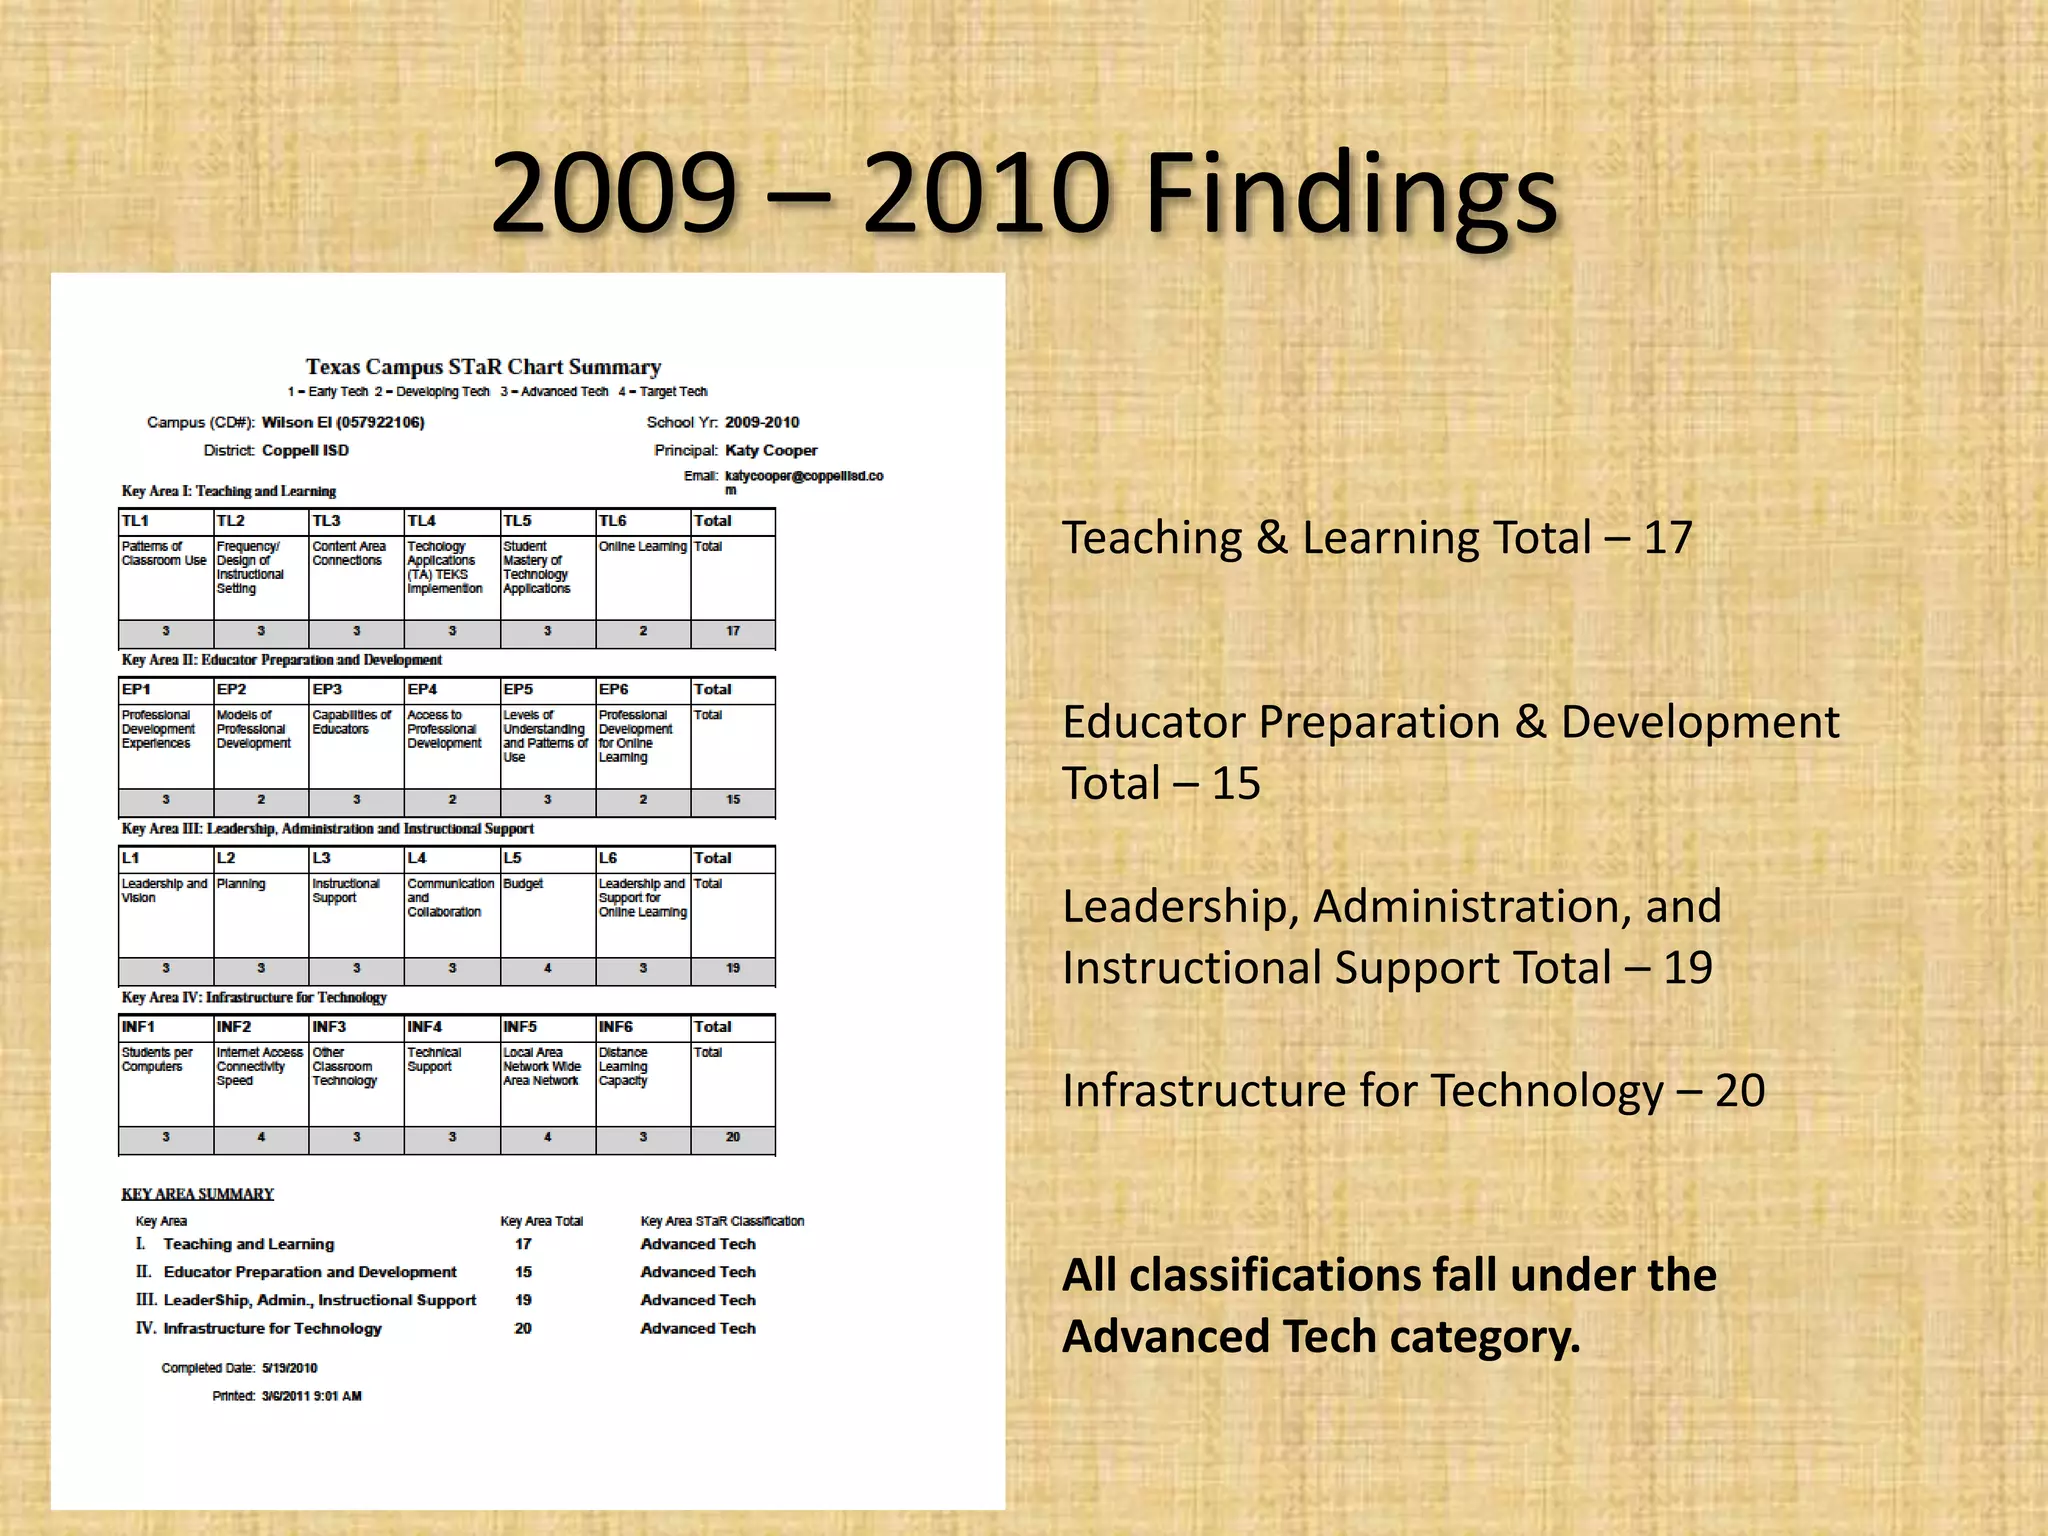
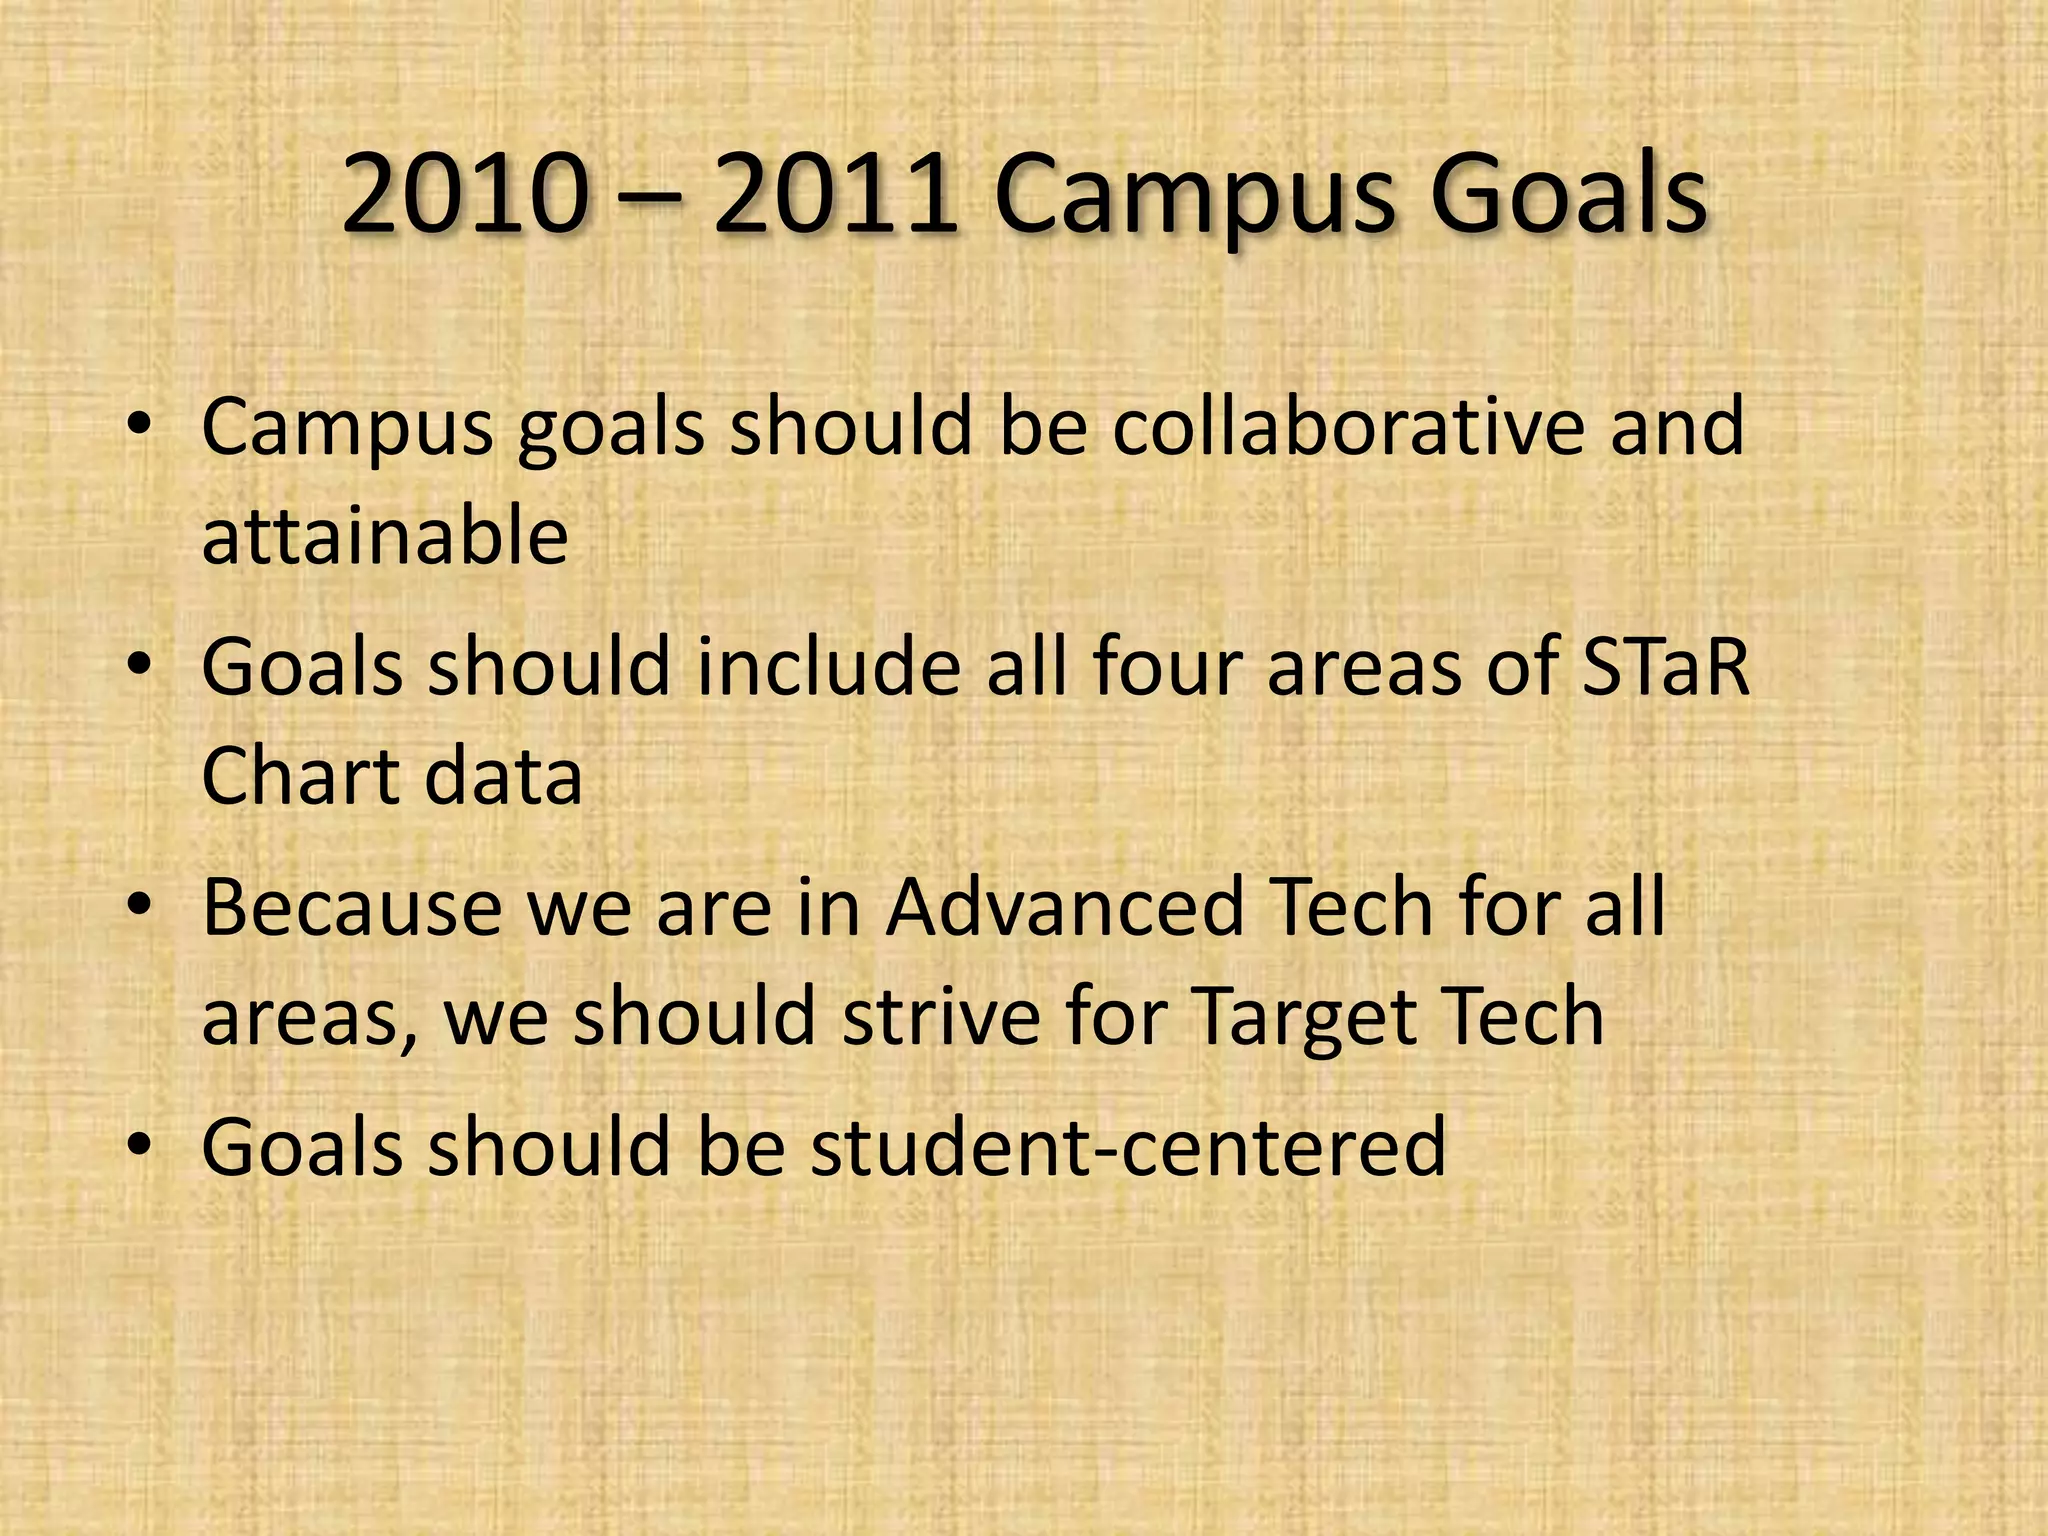
2009 – 2010 STaR ChartsWilson ElementaryMarch 7th, 2011
AgendaIntroductionSTaR Chart Analysis Explanation2009 – 2010 Findings2010 – 2011 GoalsStudent-Created STaR ChartSummary
IntroductionSTaR Chart: School Technology and ReadinessThe STaR Chart is required by the Texas Long-Range Plan for technology. It collects and analyzes data in regards to the technological progress being made on individual campuses.
ExplanationSTaR Chart is done annually. The results are reported to the state for the Texas Long-Range Plan progress report.Also aligned with the National Educational Technology Plan. Results always available to public.
2009 – 2010 FindingsTeaching & Learning Total – 17Educator Preparation & Development Total – 15Leadership, Administration, and Instructional Support Total – 19Infrastructure for Technology – 20All classifications fall under the Advanced Tech category.
2010 – 2011 Campus GoalsCampus goals should be collaborative and attainableGoals should include all four areas of STaR Chart dataBecause we are in Advanced Tech for all areas, we should strive for Target TechGoals should be student-centered
Self-Created STaR Chart
Hyperlink to DataTo access STaR Chart data, simply click HERE. To view campus data, select Campus Data Search, and enter in district name, then school name.
SummaryCampus is continually improvingGoals must be set for further growthNeeds assessment should be in place, and given to campus administrationStaff development should be utilized for further training and preparation

2009 – 2010 s ta r charts

  • 1.
    2009 – 2010STaR ChartsWilson ElementaryMarch 7th, 2011
  • 2.
    AgendaIntroductionSTaR Chart AnalysisExplanation2009 – 2010 Findings2010 – 2011 GoalsStudent-Created STaR ChartSummary
  • 3.
    IntroductionSTaR Chart: SchoolTechnology and ReadinessThe STaR Chart is required by the Texas Long-Range Plan for technology. It collects and analyzes data in regards to the technological progress being made on individual campuses.
  • 4.
    ExplanationSTaR Chart isdone annually. The results are reported to the state for the Texas Long-Range Plan progress report.Also aligned with the National Educational Technology Plan. Results always available to public.
  • 5.
    2009 – 2010FindingsTeaching & Learning Total – 17Educator Preparation & Development Total – 15Leadership, Administration, and Instructional Support Total – 19Infrastructure for Technology – 20All classifications fall under the Advanced Tech category.
  • 6.
    2010 – 2011Campus GoalsCampus goals should be collaborative and attainableGoals should include all four areas of STaR Chart dataBecause we are in Advanced Tech for all areas, we should strive for Target TechGoals should be student-centered
  • 7.
  • 8.
    Hyperlink to DataToaccess STaR Chart data, simply click HERE. To view campus data, select Campus Data Search, and enter in district name, then school name.
  • 9.
    SummaryCampus is continuallyimprovingGoals must be set for further growthNeeds assessment should be in place, and given to campus administrationStaff development should be utilized for further training and preparation