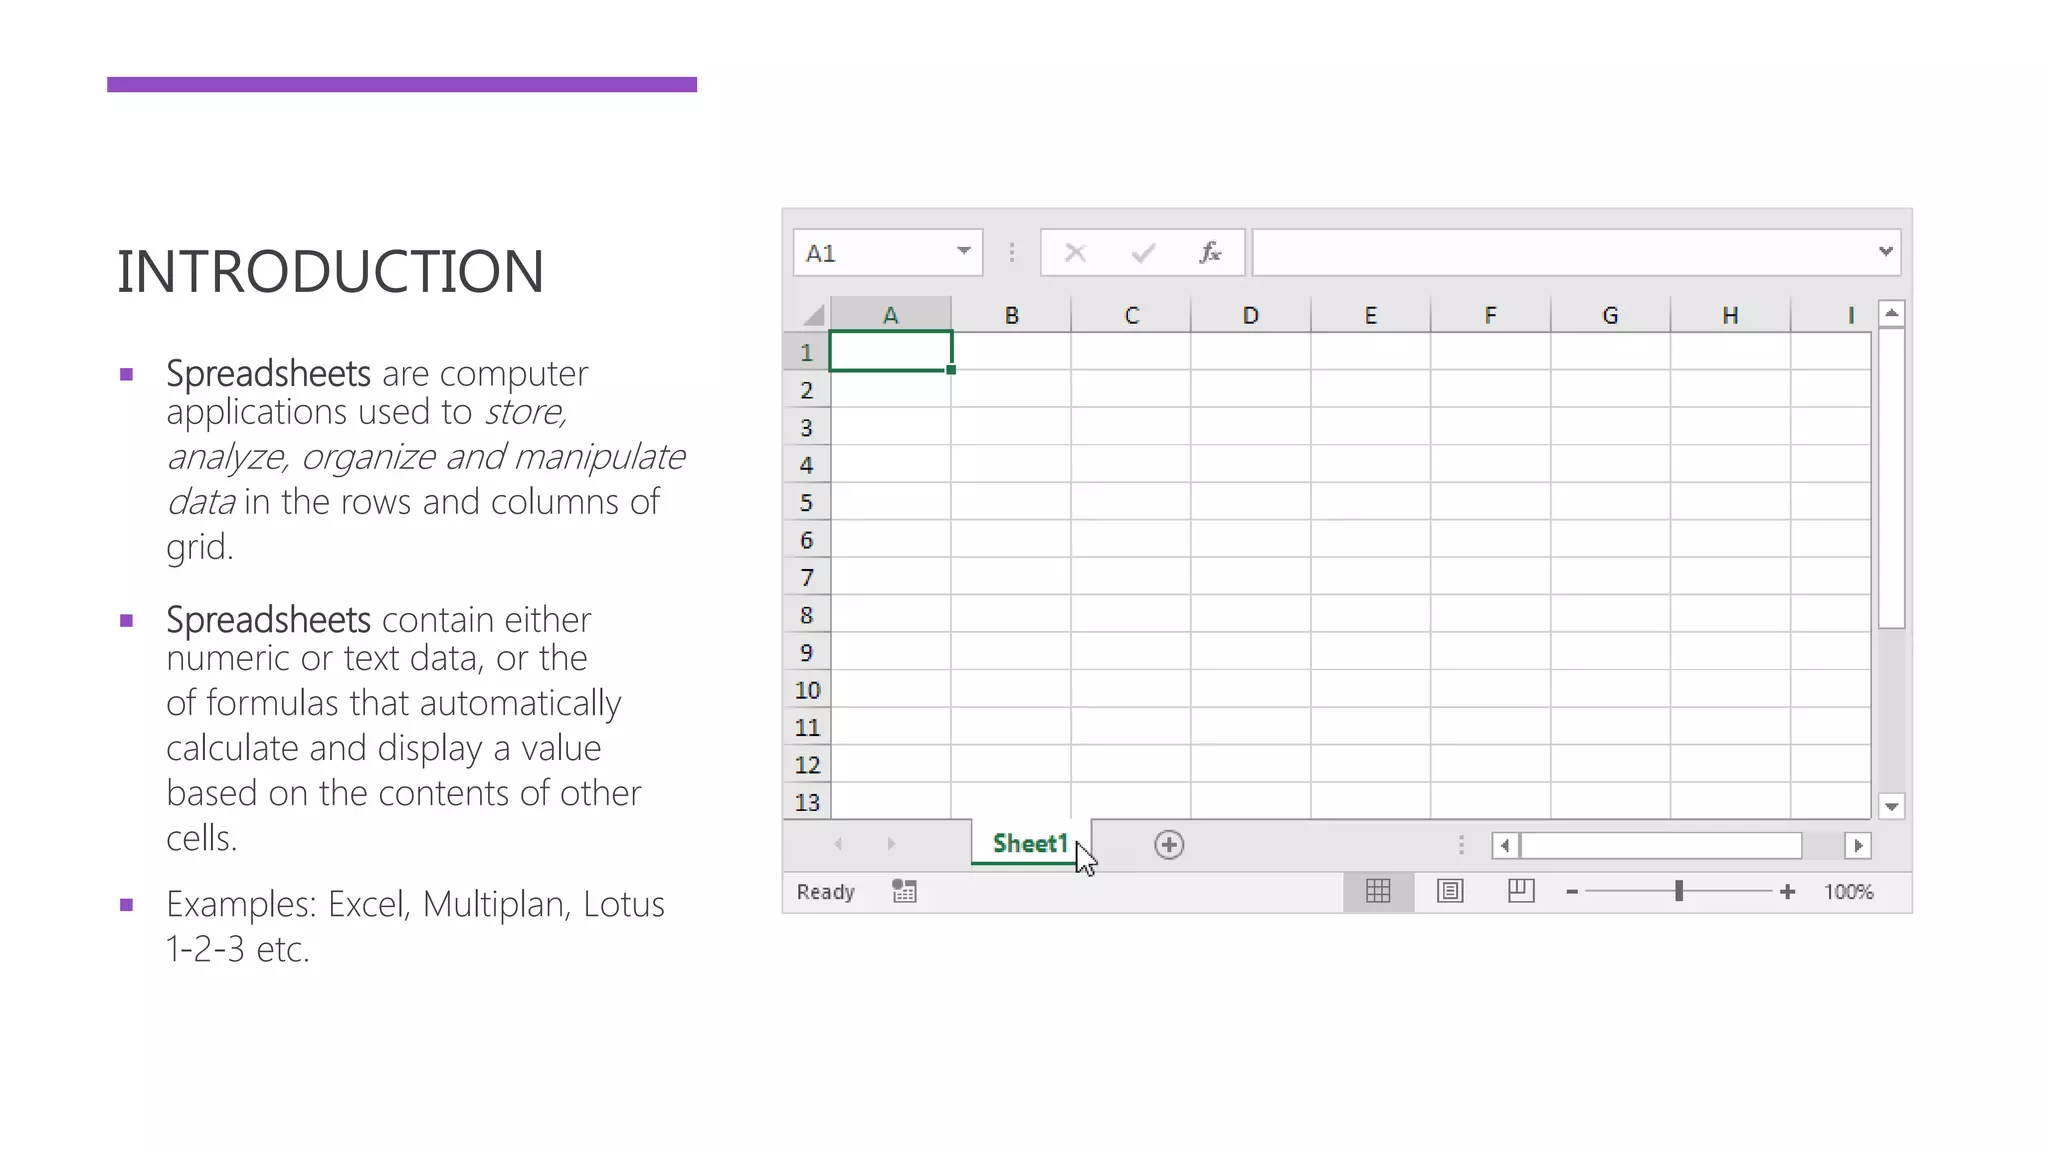
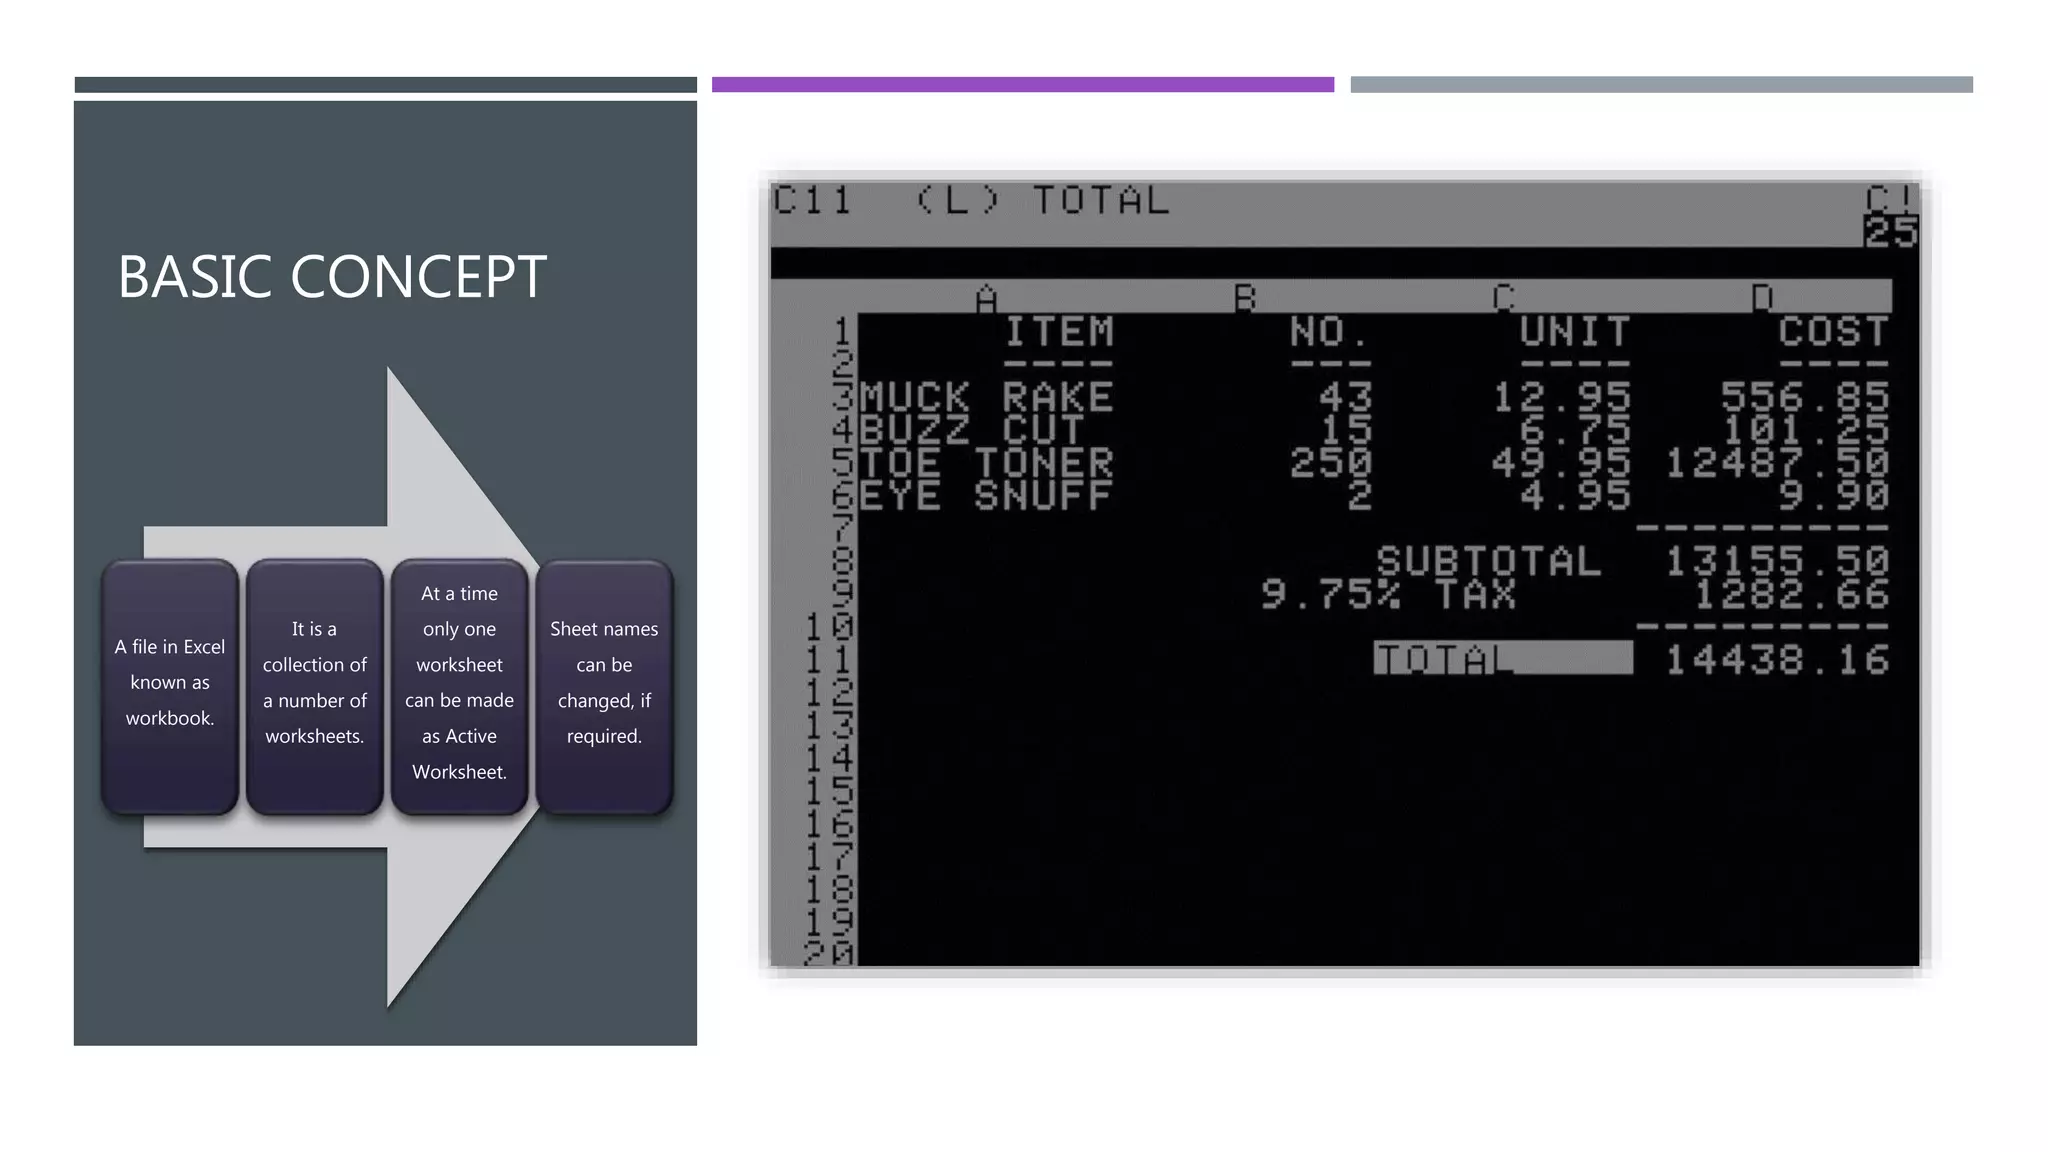
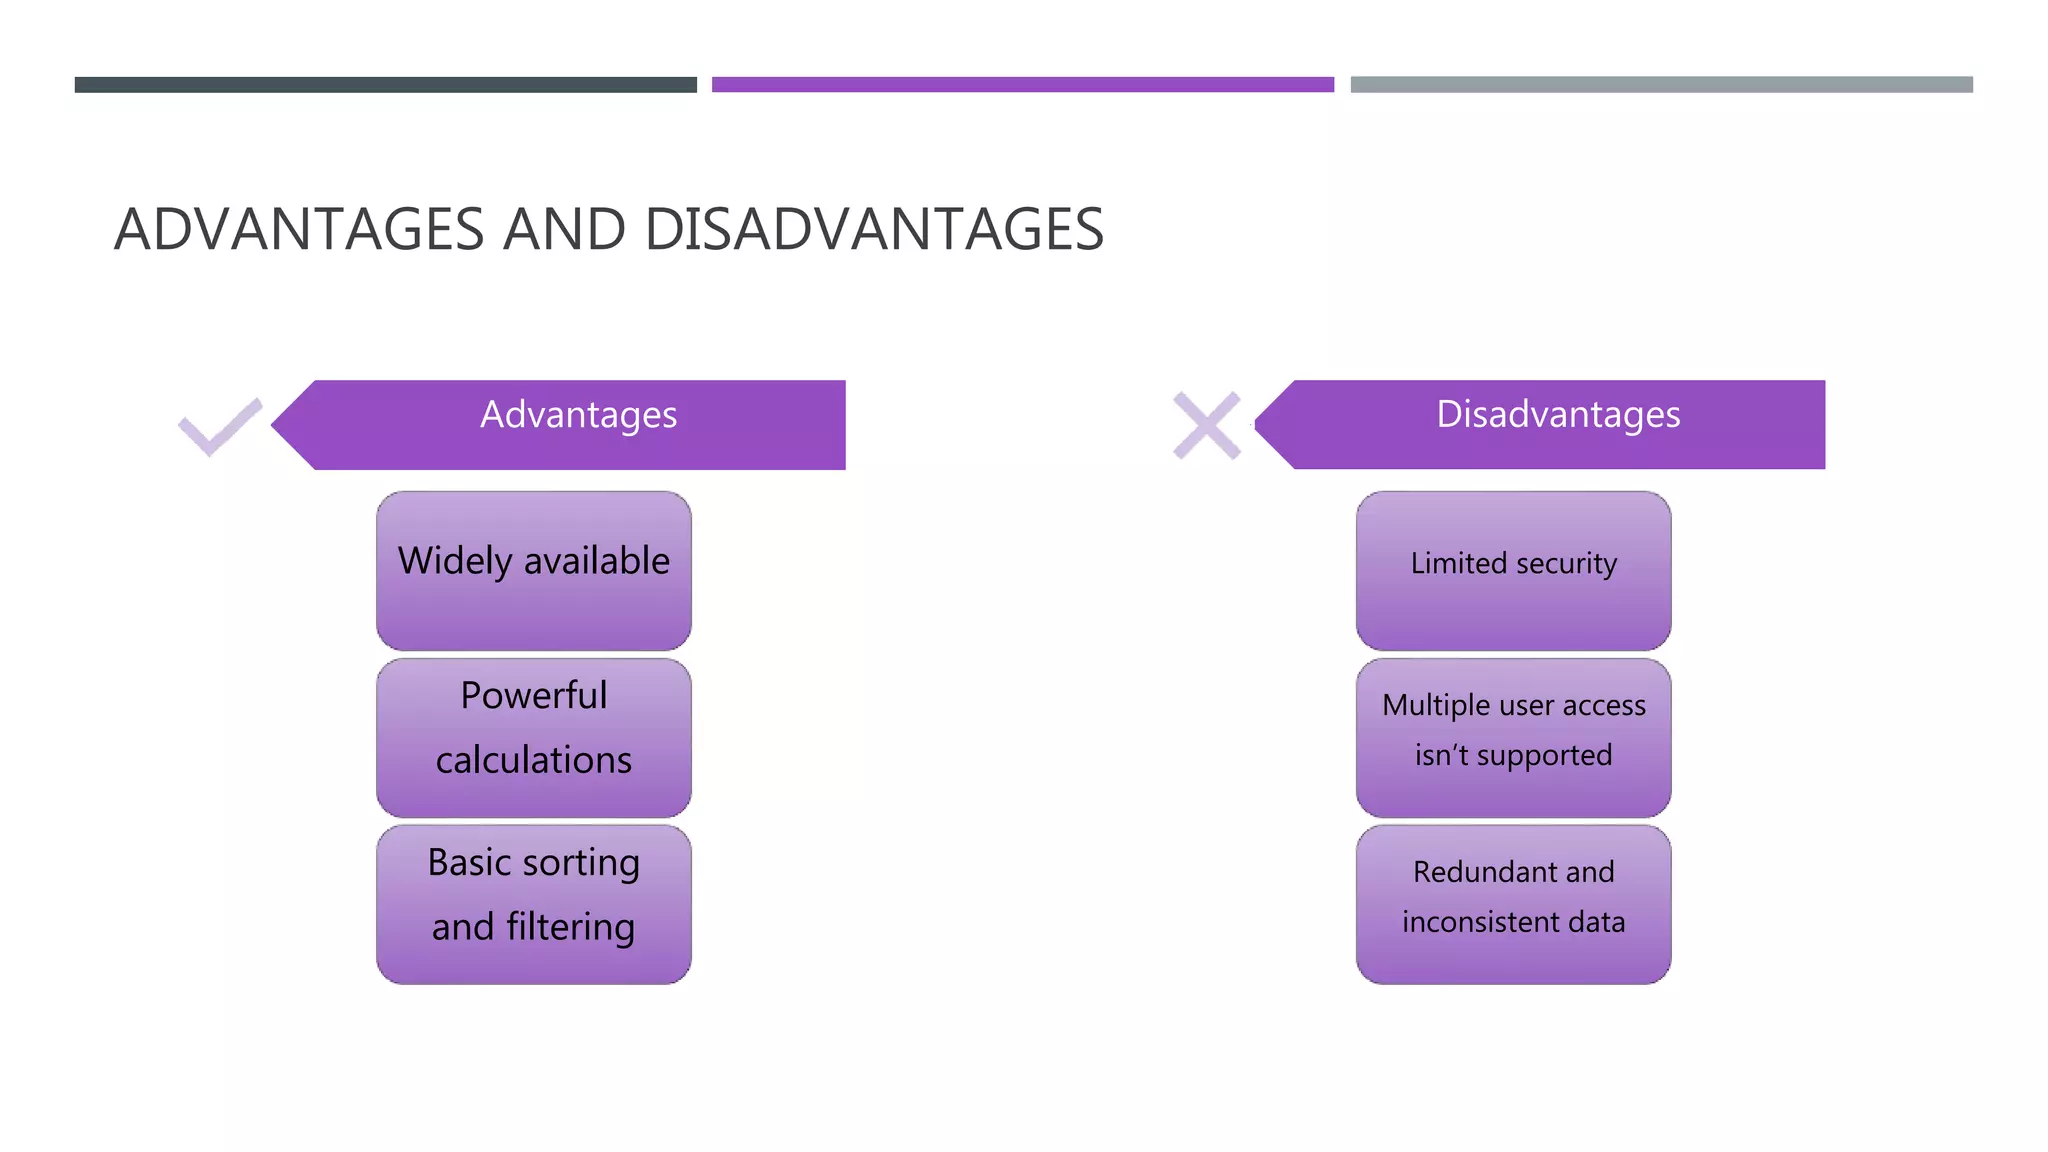
In this presentation i try to communicate with slow and featurely
so i used pointwise and easy language so this will definitely help you to understand ...
This document provides an introduction to creating and using spreadsheets in the classroom. It defines what a spreadsheet is, including rows, columns, cells and formulas. It discusses Microsoft Excel as the dominant spreadsheet application and includes a sample classroom spreadsheet analyzing student data. It also lists resources and example classroom projects using spreadsheets and outlines next steps to download sample spreadsheets and complete a U.S. Census assignment.
A spreadsheet is a computer application that displays multiple cells in a grid of rows and columns, with each cell containing either text or numeric values. A cell may also contain a formula to calculate its contents based on other cells, and spreadsheets are useful for financial information because changing one cell will automatically re-calculate the entire sheet.
Excel is a spreadsheet program used to organize and analyze data in rows and columns. It allows users to perform calculations using formulas and functions, and create charts and graphs from worksheet data. The Excel window displays the active cell, ribbon, formula bar, and worksheet tabs. The worksheet is a grid made up of columns designated by letters and rows designated by numbers, with each cell address defined by its column and row.
This document provides an overview of spreadsheet concepts and features. It discusses what a spreadsheet is, how to create and enter data into a spreadsheet, different types of cell references, using charts and what-if analysis, and how spreadsheets can be used on the web. The document is a presentation on spreadsheet concepts presented by Group K, which includes four group members. It covers these topics over 15 slides.
There are many educational uses of spreadsheets that encourage higher-order thinking and help visual learners. And, they are useful in a variety of subject areas in addition to mathematics.
Devry bis 155 week 3 quiz data analysisshyaminfo104
bis 155 week 3 ilab data analysis with spreadsheets with lab,bis 155 week 3 quiz data analysis with spreadsheets with lab,devry bis 155 week 3,bis 155 week 3,devry bis 155,bis 155,devry bis 155 week 3 tutorial,devry bis 155 week 3 assignment,devry bis 155 week 3 help
SPREADSHEETS AND DATABASES
Spreadsheet basics: A spreadsheet program helps you manage personal and business finances. They are mathematical tables which show figures in rows or columns. A cell can hold three types of data: text, numbers, and formulae.
Row Horizontal lines for data in a spreadsheet. Identified with Numbers. Column Vertical lines for data in a spreadsheet. Identified with Letters. Cell The individual intersections between rows and columns. Labeled by the Row Number and Column Letter. Active Cell The cell that is currently being edited. Marked by a think black boarder around the cell.
Uses for databases
Prepare budgets/ Maintain students grades/ Prepare financial statements/
Analyze numbers/Manage inventory/ Make forecasts
PARTS OF A DATABASE
A data base is a computerized record-keeping system. It is a system designed to store information in a way that makes it easy to locate later. A database software allows users to store, organize, and manipulate information including bot text and numerical data. Each unit of information you create is called a record and each record is made up of a collection of fields.
There are different data types:
Text: hold letters and numbers not used in calculations. Number: can only hold numbers used in calculations and reports. Memo: can store long texts. Data/Time: a date or time or combination of both.
Auto Number: assigns a number to each record. OLE Object: holds sounds and pictures. Yes/No: for alternative values like/true false, yes/no, on/off, etc.
Hyperlink: ads a link to a website. Once you have added data to a set of records, indexes must be created to help the database find specific records and classify records faster. Relational Databases: Two databases files can be related as long as they hold a piece of data in common. Extracting information from a database is known as performing a query.
GRAPHICS AND DESIGN
Types of graphics software
Computer graphics are pictures created, changed or processed by computers.
There are two categories: Bitmapped Graphics represent images as bitmaps; they are stored as pixels and can become a bit distorted when they are manipulated. The density of dots, known as the resolution and expressed in dots per inch, determine how sharp the image is. Vector Graphics represent images as mathematical formulae; so they can be changed or scaled without losing quality.
Image manipulations programs: let you edit your favorite images. Painting and drawing programs: offer facilities for freehand drawing, with a wide choice of pens and brushes, colors and patterns. Business graphics programs: let you create pie charts, bar charts, and line graphs of all kinds for slide shows and reports.
Computer aided-design (CAD): is used by engineers and architects to design everything from cars and planes to buildings and furniture. Desktop publishing (DTP): is based around a page layout program, which lets you import text from a word processor and images f
This document introduces key concepts and vocabulary related to spreadsheets. It defines a spreadsheet as a computer program that arranges data into columns and rows for calculations. A workbook contains one or more worksheets, each made up of cells located at the intersection of rows and columns. Cells can contain values, labels, or formulas beginning with an equal sign. Functions are preset formulas that perform calculations using arguments within parentheses. Other concepts covered include the formula bar, data types, autosum, charts, formatting cells, and sorting data.
Spreadsheets allow users to enter and organize tabular data in a grid of rows and columns. Cells can contain numbers, text, or formulas. Formulas like SUM, AVERAGE, IF, and MAX allow calculations on cell values. To create a spreadsheet, the user opens a program like Excel and enters data into cells. Formulas update automatically when cell values change. Spreadsheets are useful for tasks like accounting, financial reports, contact lists, and more.
A spreadsheet is a grid of rows and columns used to organize and analyze numerical data in cells. A workbook contains one or more spreadsheets and allows users to perform calculations on the data. Spreadsheets are commonly used for household budgets, grades, finances, and payroll in businesses. A spreadsheet displays data in cells that are identified by their column letter and row number. A range refers to a group of adjacent cells, while the cell address specifies a single cell's location using its column and row.
How Do We Solve The World's Spreadsheet Problem? - Velocity NY 2018Alex Rasmussen
In the past five years, I have spent a lot of time trying to get high-integrity data out of spreadsheets and into databases. In this talk, I explore common data integrity problems when dealing with spreadsheet data, investigate whether those integrity problems are inescapable, and share ongoing work to mitigate them.
This document provides an overview of data structures. It defines data structures as a way to organize and store data to allow for effective operations. The document outlines common data structure operations like traversing, searching, insertion, and deletion. It also categorizes data structures as primitive, non-primitive, linear, and non-linear. Linear structures discussed include stacks and queues. Non-linear structures covered are trees and graphs. Details are provided on representing graphs and trees.
This document discusses key concepts about spreadsheets including worksheets, rows and columns, cells, cell addressing, ranges, and formulas. It explains that a worksheet contains cells organized into rows and columns. A cell's address identifies its location using column letters and row numbers. Formulas in cells can perform calculations using values from other cells. Graphs can also be inserted to visualize numeric data from the worksheet.
Excel is an application used to perform numeric calculations, analyze data, and present results. It contains worksheets made up of cells organized into rows and columns that can hold numbers, text, formulas, or a combination. Each cell is identified by its row and column address. Users can enter or edit data directly into cells or with formulas and select ranges of multiple cells to perform actions on groups of cells at once.
Module 3 comp 312 - computer fundamentals and programmingdiosdadamendoza
This document provides an overview of electronic spreadsheets and Microsoft Excel. It discusses the history and development of early electronic spreadsheets like VisiCalc and Lotus 1-2-3. It then focuses on Excel, describing its functions as an electronic spreadsheet including budgeting, bidding, and investments. The document outlines Excel components like workbooks, rows, columns, cells, and formulas. It provides examples of arithmetic, comparison, and text operators used in formulas. Finally, it describes how to start Excel and its basic screen layout.
The document provides a summary of the history and development of database management systems (DBMS) and the SQL query language. It discusses how DBMS originated in the 1960s and the relational model was proposed in 1970 by E.F. Codd. Major prototypes in the 1970s included Ingres and System R, which used early versions of SQL. The SQL standard was developed in the 1980s. The document also outlines the founders and versions of DBMS and SQL, as well as features, advantages, and examples of different database concepts.
This document introduces spreadsheets and their history. It defines a spreadsheet as a document containing rows and columns of text and numbers. An electronic spreadsheet is a computerized version that can be created and edited using spreadsheet programs. The world's first electronic spreadsheet program, VisiCalc, was invented in 1978 by Daniel Bricklin. It drove adoption of personal computers when it was released commercially in 1979. Since then, Microsoft Excel and other popular programs have been released and spreadsheets have become a mainstay for organizing and analyzing numerical data.
This document provides definitions for 25 computing-related terms, including bit, integrated circuit, computer, hardware, printer, link, Excel, toolbar, column headings, row titles, name box, formulas, cell, navigation and sheet tabs, Word, office button, toolbar shortcuts, title bar, band of options, scroll bar, status bar, and view the document. It explains concepts like the basic unit of digital information (bit), electronic circuits that integrate components (integrated circuit), and how a computer receives and executes instructions. It also defines software like Excel and Word, and interface elements within them like the toolbar, formulas bar, and sheet tabs.
1. The document introduces databases and their history, from early data storage and retrieval to modern database management systems.
2. It discusses Edgar Codd's invention of the relational database model in 1970 which changed the field by separating data from application code for easier modification and generalization.
3. The document outlines what a database management system does, including managing large amounts of data, supporting efficient and concurrent access, and providing security.
Microsoft Excel is a spreadsheet program developed by Microsoft as part of the Microsoft Office suite. It was originally released in 1985 for Macintosh and later for Windows in 1987. Excel features calculation, graphing, and data organization tools. It allows users to perform arithmetic operations on data in a grid of cells and display results in charts and graphs. Common features include formulas, functions, formatting options, and data analysis tools. Excel has become one of the most popular spreadsheet programs due to its power and flexibility in organizing and analyzing various types of data.
Spreadsheets have evolved from simple paper ledgers used by merchants to complex computer programs like Excel. The first electronic spreadsheet was VisiCalc, created in 1979. It popularized the grid-based interface and was succeeded by Lotus 1-2-3 in 1983. Microsoft Excel, first released in 1985, became the dominant spreadsheet as it transitioned to Windows. Excel continues advancing with new data analysis tools and versions that work on mobile devices, ensuring spreadsheets remain a key tool for organizing and calculating data.
This document provides an introduction to computer skills for nurses. It discusses the definition of a computer, the role of computers in nursing including uses like medical records and patient monitoring. It also covers the evolution of computers from mechanical to electronic eras. The document classifies computers and describes their core components including the system unit, motherboard, processor, memory, storage, input, output and other hardware. It discusses computer networks like the internet and intranet. Measurement units for computer storage are defined. The document concludes with an overview of typing tutors to improve keyboard skills.
Microsoft Excel is a widely used spreadsheet program that allows users to store, organize, and manipulate data. In Excel, data can be organized into tables and sorted or filtered. Formatting options allow users to change font styles and colors. Excel makes it easy to store large amounts of data, perform calculations with formulas, and recover or find specific data. Multiple worksheets can be added to a single Excel file, allowing data to be organized in one central location. The layout and formatting of spreadsheets in Excel helps to clearly display information for analysis.
This document provides background information on Ace Training, a company that teaches courses and needs a database system. It details requirements for the database such as storing student, tutor, and course information. Students can enroll via tutor upload, online form, or themselves online with tutor authorization. Tutors have more privileges like adding course resources and assessing students with quizzes. The database needs to track student progress and knowledge. User details cannot be deleted but marked inactive, while inactive courses can be removed. Duplicate student enrollments should be prevented.
The document discusses a new data modeling architecture called the Atomic Information Resource (AIR) data model, which is the basis of the AtomicDB database management system. The AIR model replaces database tables and records with atomic information resources that are not bound by data structures and know their own context and relationships. It also describes how the model was conceptualized based on earlier patented works and demonstrates how concepts, models, and data can be modeled and stored in AtomicDB without the limitations of traditional table-based approaches. The key advantage is that data sets are not duplicated and the same data can be referenced by multiple concepts.
Importance of Data - Where to find it, how to store, manipulate, and characterize it
Artificial Intelligence (AI)- Introduction to AI & ML Technologies/ Applications
Machine Learning (ML), Basic Machine Learning algorithms.
Applications of AI & ML in Marketing, Sales, Finance, Operations, Supply Chain
& Human Resources Data Governance
Legal and Ethical Issues
Robotic Process Automation (RPA)
Internet of Things (IoT)
Cloud Computing
The document provides an overview of database management systems (DBMS) and structured query language (SQL). It discusses that a DBMS allows for the creation, maintenance and control of access to a database. It also describes the basic processes supported by a DBMS, including storing, manipulating, querying and updating database content. The document then covers how data is organized in a database through concepts like database files, tables, records, fields and data types. It provides examples to illustrate these concepts. Finally, it describes the different types of SQL statements like data definition language, data manipulation language and database control language statements.
This document provides an overview of databases and Microsoft Access. It defines what a database is and its key components like fields, records and tables. It describes the two main types of databases: flat file and relational. The document outlines the main database objects in Access: tables, queries, forms and reports. It provides instructions on how to create a blank database or one using templates in Access. It also briefly discusses career opportunities in database administration.
Normalization is the process of organizing data in a database to minimize redundancy and dependency. It involves separating large tables into smaller tables and linking them together through relationships. There are various normal forms that organize data in increasingly efficient ways, starting with first normal form, which structures data into tables without repeating groups. Higher normal forms like second and third further reduce redundancy between tables through techniques like separating one-to-many relationships.
The document provides a history of spreadsheets, from early counting devices like the abacus to modern spreadsheet programs like Excel. It describes how VisiCalc was the first electronic spreadsheet program in the late 1970s and was later succeeded by Lotus 1-2-3 in the 1980s. Microsoft Excel was launched in 1985 and eventually overtook Lotus as the dominant spreadsheet program due to its easier interface and transition to Windows. The document outlines key enhancements in various Excel versions over time.
A spreadsheet is a grid that organizes data into columns and rows and allows for formulas to calculate and manipulate the data. The earliest predecessors were manual accounting ledgers and the abacus, while the first electronic spreadsheet was VisiCalc in the 1970s. It popularized the concept of a value in one cell affecting others via formulas. Lotus 1-2-3 soon overtook VisiCalc's market share in the 1980s due to its power and features. Microsoft Excel now dominates the market after its 1987 debut brought the spreadsheet to Windows PCs. It has continued evolving with new features and capabilities over numerous versions.
Third normal form (3NF) requires that there are no functional dependencies of non-key attributes on something other than a candidate key.
A table is in 3NF if all of the non-primary key attributes are mutually independent
That is, there are NO transitive dependencies
Spreadsheets originated as paper ledgers organized into columns and rows. The abacus was one of the earliest counting devices. VisiCalc was the first electronic spreadsheet application, released in 1978. It organized data on a grid that allowed for formulas. Lotus 1-2-3 was the dominant spreadsheet through the 1980s, but Microsoft Excel, first released for Windows in 1987, became the most popular with its improved features and interface. Excel has continued evolving with new capabilities and versions released approximately every three years. It remains the dominant spreadsheet program today.
A database management system (DBMS) is software that allows organizations to develop databases for applications and control their creation, organization, and use. A DBMS consists of a collection of persistent data and programs to access, update, and manage that data. Early DBMS used hierarchical and network data models, while most modern DBMS are relational and use SQL. A DBMS provides data independence, security, integrity, and concurrent access. It addresses issues like data redundancy, inconsistency, and isolation that arise without a DBMS.
Your LinkedIn Success Starts Here.......SocioCosmos
In order to make a lasting impression on your sector, SocioCosmos provides customized solutions to improve your LinkedIn profile.
https://www.sociocosmos.com/product-category/linkedin/
EASY TUTORIAL OF HOW TO USE G-TEAMS BY: FEBLESS HERNANEFebless Hernane
Using Google Teams (G-Teams) is simple. Start by opening the Google Teams app on your phone or visiting the G-Teams website on your computer. Sign in with your Google account. To join a meeting, click on the link shared by the organizer or enter the meeting code in the "Join a Meeting" section. To start a meeting, click on "New Meeting" and share the link with others. You can use the chat feature to send messages and the video button to turn your camera on or off. G-Teams makes it easy to connect and collaborate with others!
UR BHatti Academy dedicated to providing the finest IT courses training in the world. Under the guidance of experienced trainer Usman Rasheed Bhatti, we have established ourselves as a professional online training firm offering unparalleled courses in Pakistan. Our academy is a trailblazer in Dijkot, being the first institute to officially provide training to all students at their preferred schedules, led by real-world industry professionals and Google certified staff.
This tutorial presentation provides a step-by-step guide on how to use Facebook, the popular social media platform. In simple and easy-to-understand language, this presentation explains how to create a Facebook account, connect with friends and family, post updates, share photos and videos, join groups, and manage privacy settings. Whether you're new to Facebook or just need a refresher, this presentation will help you navigate the features and make the most of your Facebook experience.
STUDY ON THE DEVELOPMENT STRATEGY OF HUZHOU TOURISMAJHSSR Journal
ABSTRACT: Huzhou has rich tourism resources, as early as a considerable development since the reform and
opening up, especially in recent years, Huzhou tourism has ushered in a new period of development
opportunities. At present, Huzhou tourism has become one of the most characteristic tourist cities on the East
China tourism line. With the development of Huzhou City, the tourism industry has been further improved, and
the tourism degree of the whole city has further increased the transformation and upgrading of the tourism
industry. However, the development of tourism in Huzhou City still lags far behind the tourism development of
major cities in East China. This round of research mainly analyzes the current development of tourism in
Huzhou City, on the basis of analyzing the specific situation, pointed out that the current development of
Huzhou tourism problems, and then analyzes these problems one by one, and put forward some specific
solutions, so as to promote the further rapid development of tourism in Huzhou City.
KEYWORDS:Huzhou; Travel; Development
Telegram is a messaging platform that ushers in a new era of communication. Available for Android, Windows, Mac, and Linux, Telegram offers simplicity, privacy, synchronization across devices, speed, and powerful features. It allows users to create their own stickers with a user-friendly editor. With robust encryption, Telegram ensures message security and even offers self-destructing messages. The platform is open, with an API and source code accessible to everyone, making it a secure and social environment where groups can accommodate up to 200,000 members. Customize your messenger experience with Telegram's expressive features.
3. INTRODUCTION
Spreadsheets are computer
applications used to store,
analyze, organize and manipulate
data in the rows and columns of
grid.
Spreadsheets contain either
numeric or text data, or the
of formulas that automatically
calculate and display a value
based on the contents of other
cells.
Examples: Excel, Multiplan, Lotus
1-2-3 etc.
4. HISTORY
BACKGROUND
Spreadsheet Was Discovered By
Dan Bricklin And His Classmate Bob
Frankston.
The First Electronic Spreadsheet On
A Microcomputer Was APPLE II.
After That It Is Widely Popular.
Lotus 1-2-3 was leading
Spreadsheet on DOS.
5. BASIC CONCEPT
A file in Excel
known as
workbook.
It is a
collection of
a number of
worksheets.
At a time
only one
worksheet
can be made
as Active
Worksheet.
Sheet names
can be
changed, if
required.
6. TYPES
- Many Types
But Some Are:
EditGrid
Google
spreadsheet
JotspotSmartsheet
Thinkfree online
8. ADVANTAGES AND DISADVANTAGES
Advantages
Widely available
Powerful
calculations
Basic sorting
and filtering
Disadvantages
Limited security
Multiple user access
isn’t supported
Redundant and
inconsistent data