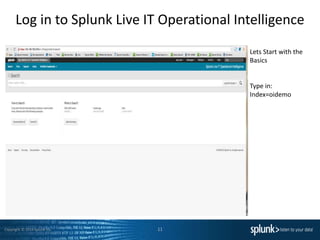
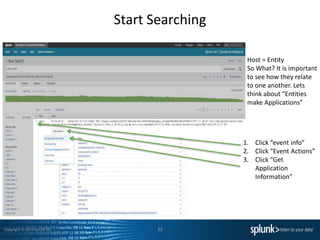
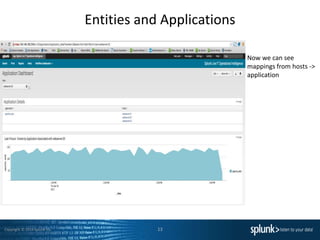
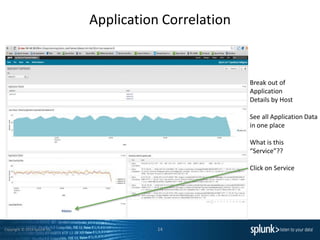
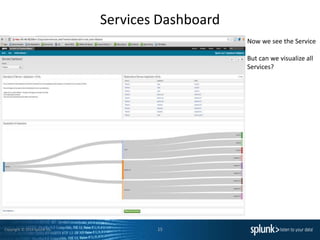
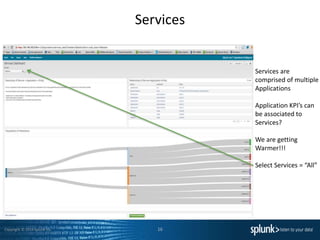
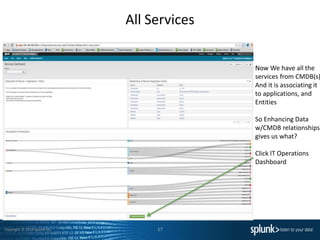
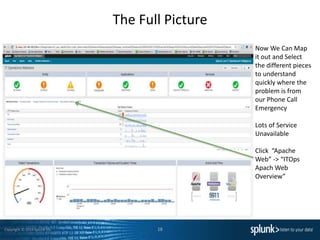
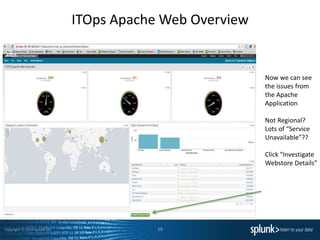
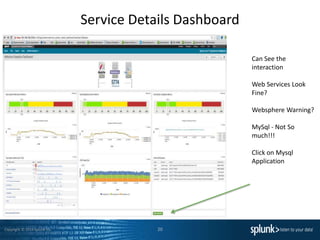
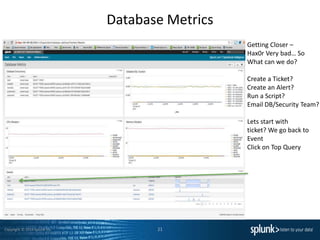
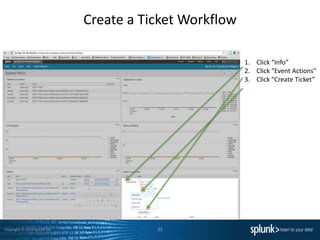
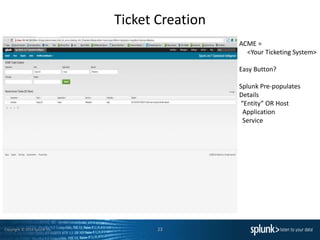
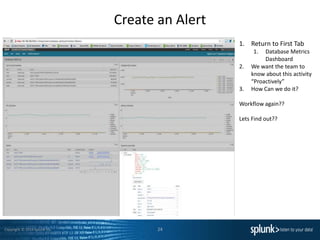
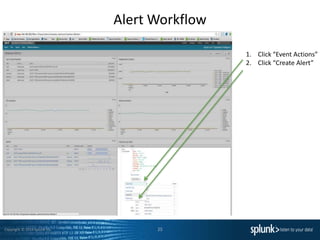
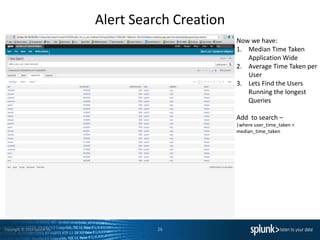
Copyright © 2014 Splunk Inc.
SplunkLive Phoenix
Splunk and ITOps
May 7, 2015
IT
Operations
Developer Platform (REST API, SDKs)
Business
Analytics
Industrial Data
and Internet of
Things
2
The Focus
Copyright © 2014 Splunk Inc.
Turning Machine Data Into Operational Intelligence
Reactive
Search
and
Investigate
Proactive
Monitoring
and Alerting
Operational
Visibility
Proactive
Real-time
Business
Insight
3
Copyright © 2014 Splunk Inc.
Where is Machine Data
Machine Data: Any Location, Type, Volume
Online
Services
Web
Services
Servers
Security
GPS
Location
Storage
Desktops
Networks
Packaged
Applications
Custom
ApplicationsMessaging
Telecoms
Online
Shopping
Cart
Web
Clickstreams
Databases
Energy
Meters
Call Detail
Records
Smartphones
and Devices
RFID
On-
Premises
Private
Cloud
Public
Cloud
Platform Support (Apps / API / SDKs)
Enterprise Scalability
Universal Indexing
Answer Any Question
Developer
Platform
Report
and
analyze
Custom
dashboards
Monitor
and alert
Ad hoc
search
Copyright © 2014 Splunk Inc.
Common Information Model
What is it?
Why Is it Important?
What does it mean to IT Operations Team?
Where is the Splunk fit?
5
Copyright © 2014 Splunk Inc.
Splunk Apps & Add-ons
What is a Splunk App?
What is a Splunk Add-on ?
Why do they work?
Where do you put them?
Connection CIM + Add-ons = OH YEAH!!!!
6
Copyright © 2014 Splunk Inc.
Definition Refresher
Entity/Host – Infrastructure Component or Asset that requires management in order to deliver an IT
Service
Applications – Set of Entities that conduct the same activities which require management in order to
deliver an IT Service
Service – Groups of Entities that relate to groups of Applications, Infrastructure Tiers, or Business
Services
Key Performance Indicator(KPI) – Measurements that determine how an IT
Entity/Application/Service is performing
Service Level Agreement (SLA) – Measurement which a Service is expected to deliver
7
Copyright © 2014 Splunk Inc.
Call
Comes In
8
Admins get a phone call
saying we are having
problems with <insert
here>
The Dreaded Call!!!
Copyright © 2014 Splunk Inc.
Looking in Splunk
9
Logging In Details:
URL: We will Provide Shortly
Username: test_user
Password: Password
(Original, I know don’t worry Security Hands On is up next)
Copyright © 2014 Splunk Inc.
Looking in Splunk
10
Logging In Details:
URL:
https://54.147.228.57
https://54.92.242.88
https://54.147.51.13
https://54.237.24.75
https://54.146.150.218
Username: test_user
Password: Password
(Original, I know don’t worry Security Hands On is up next)
Copyright © 2014 Splunk Inc.
Log in to Splunk Live IT Operational Intelligence
11
Lets Start with the
Basics
Type in:
Index=oidemo
Copyright © 2014 Splunk Inc.
Start Searching
12
1. Click “event info”
2. Click “Event Actions”
3. Click “Get
Application
Information”
Host = Entity
So What? It is important
to see how they relate
to one another. Lets
think about “Entities
make Applications”
Copyright © 2014 Splunk Inc.
Entities and Applications
13
Now we can see
mappings from hosts ->
application
Copyright © 2014 Splunk Inc.
Application Correlation
14
Break out of
Application
Details by Host
See all Application Data
in one place
What is this
“Service”??
Click on Service
Copyright © 2014 Splunk Inc.
Services Dashboard
15
Now we see the Service
But can we visualize all
Services?
Copyright © 2014 Splunk Inc.
Services
16
Services are
comprised of multiple
Applications
Application KPI’s can
be associated to
Services?
We are getting
Warmer!!!
Select Services = “All”
Copyright © 2014 Splunk Inc.
All Services
17
Now We have all the
services from CMDB(s)
And it is associating it
to applications, and
Entities
So Enhancing Data
w/CMDB relationships
gives us what?
Click IT Operations
Dashboard
Copyright © 2014 Splunk Inc.
The Full Picture
18
Now We Can Map
it out and Select
the different pieces
to understand
quickly where the
problem is from
our Phone Call
Emergency
Lots of Service
Unavailable
Click “Apache
Web” -> “ITOps
Apach Web
Overview”
Copyright © 2014 Splunk Inc.
ITOps Apache Web Overview
19
Now we can see
the issues from
the Apache
Application
Not Regional?
Lots of “Service
Unavailable”??
Click “Investigate
Webstore Details”
Copyright © 2014 Splunk Inc.
Service Details Dashboard
20
Can See the
interaction
Web Services Look
Fine?
Websphere Warning?
MySql - Not So
much!!!
Click on Mysql
Application
Copyright © 2014 Splunk Inc.
Database Metrics
21
Getting Closer –
Hax0r Very bad… So
What can we do?
Create a Ticket?
Create an Alert?
Run a Script?
Email DB/Security Team?
Lets start with
ticket? We go back to
Event
Click on Top Query
Copyright © 2014 Splunk Inc.
Create a Ticket Workflow
22
1. Click “Info”
2. Click “Event Actions”
3. Click “Create Ticket”
Copyright © 2014 Splunk Inc.
Ticket Creation
23
ACME =
<Your Ticketing System>
Easy Button?
Splunk Pre-populates
Details
“Entity” OR Host
Application
Service
Copyright © 2014 Splunk Inc.
Create an Alert
24
1. Return to First Tab
1. Database Metrics
Dashboard
2. We want the team to
know about this activity
“Proactively”
3. How Can we do it?
Workflow again??
Lets Find out??
Copyright © 2014 Splunk Inc.
Alert Workflow
25
1. Click “Event Actions”
2. Click “Create Alert”
Copyright © 2014 Splunk Inc.
Alert Search Creation
26
Now we have:
1. Median Time Taken
Application Wide
2. Average Time Taken per
User
3. Lets Find the Users
Running the longest
Queries
Add to search –
|where user_time_taken >
median_time_taken
Copyright © 2014 Splunk Inc.
Create Alert
27
Now Lets Create an Alert:
1. Click Save AS
2. Click Alert
The alert will be used to
proactively notify our
Teams of the issue
Copyright © 2014 Splunk Inc.
Alert Saving
28
1. Give the Alert a Title:
<yourname>User_DBQuery
2. Description:
<Your Choice>
3. Alert Type:
Scheduled
4. Time Range:
Thursday at <now + 5m>
6. Trigger conditions:
Defaults
7. Click Next
Copyright © 2014 Splunk Inc.
Alert Email Option
29
1.List in Triggered Alerts
Check
2. Send Email
Check
Copyright © 2014 Splunk Inc.
Alert Completion
30
To:
<your email>
Priority:
Default
Subject:
Default
Message:
Default
Include:
Your Choice
Run A Script?
When Triggered:
Default
Click Saved
Copyright © 2014 Splunk Inc.
Wrapping Up
31
• Common Information Model & Splunk
• ITOps Analytics
• Why Is it Important?
• How can it help the ITOps Team/Business?
Copyright © 2014 Splunk Inc.
We Want to Hear your Feedback!
After the Breakout Sessions conclude
Text Splunk PHX to 878787
And be entered for a chance to win a $100 AMEX gift card!
Copyright © 2014 Splunk Inc. 33
www.splunk.com/apptitude
July 20th, 2015 Submission deadline
Copyright © 2014 Splunk Inc. 34
The 6th Annual Splunk Worldwide Users’ Conference
• September 21-24, 2015
• The MGM Grand Hotel, Las Vegas
• 4000 IT & Business Professionals
• 2 Keynote Sessions
• 3 days of technical content
– 165+ sessions
• 3 days of Splunk University
– Sept 19-21, 2015
– Get Splunk Certified for FREE!
– Get CPE credits for CISSP, CAP, SSCP, etc.
– Save thousands on Splunk education!
• 80 Customer Speakers
• 80 Splunk Speakers
• 35+ Apps in Splunk Apps Showcase
• 65 Technology Partners
• Ask The Experts and Security Experts,
Birds of a Feather, Chalk Talks and a new
& improved Partner Pavilion!
• Register at conf.splunk.com
Questions???

Splunk for ITOA Breakout Session

  • 1.
    Copyright © 2014Splunk Inc. SplunkLive Phoenix Splunk and ITOps May 7, 2015
  • 2.
    IT Operations Developer Platform (RESTAPI, SDKs) Business Analytics Industrial Data and Internet of Things 2 The Focus
  • 3.
    Copyright © 2014Splunk Inc. Turning Machine Data Into Operational Intelligence Reactive Search and Investigate Proactive Monitoring and Alerting Operational Visibility Proactive Real-time Business Insight 3
  • 4.
    Copyright © 2014Splunk Inc. Where is Machine Data Machine Data: Any Location, Type, Volume Online Services Web Services Servers Security GPS Location Storage Desktops Networks Packaged Applications Custom ApplicationsMessaging Telecoms Online Shopping Cart Web Clickstreams Databases Energy Meters Call Detail Records Smartphones and Devices RFID On- Premises Private Cloud Public Cloud Platform Support (Apps / API / SDKs) Enterprise Scalability Universal Indexing Answer Any Question Developer Platform Report and analyze Custom dashboards Monitor and alert Ad hoc search
  • 5.
    Copyright © 2014Splunk Inc. Common Information Model What is it? Why Is it Important? What does it mean to IT Operations Team? Where is the Splunk fit? 5
  • 6.
    Copyright © 2014Splunk Inc. Splunk Apps & Add-ons What is a Splunk App? What is a Splunk Add-on ? Why do they work? Where do you put them? Connection CIM + Add-ons = OH YEAH!!!! 6
  • 7.
    Copyright © 2014Splunk Inc. Definition Refresher Entity/Host – Infrastructure Component or Asset that requires management in order to deliver an IT Service Applications – Set of Entities that conduct the same activities which require management in order to deliver an IT Service Service – Groups of Entities that relate to groups of Applications, Infrastructure Tiers, or Business Services Key Performance Indicator(KPI) – Measurements that determine how an IT Entity/Application/Service is performing Service Level Agreement (SLA) – Measurement which a Service is expected to deliver 7
  • 8.
    Copyright © 2014Splunk Inc. Call Comes In 8 Admins get a phone call saying we are having problems with <insert here> The Dreaded Call!!!
  • 9.
    Copyright © 2014Splunk Inc. Looking in Splunk 9 Logging In Details: URL: We will Provide Shortly Username: test_user Password: Password (Original, I know don’t worry Security Hands On is up next)
  • 10.
    Copyright © 2014Splunk Inc. Looking in Splunk 10 Logging In Details: URL: https://54.147.228.57 https://54.92.242.88 https://54.147.51.13 https://54.237.24.75 https://54.146.150.218 Username: test_user Password: Password (Original, I know don’t worry Security Hands On is up next)
  • 11.
    Copyright © 2014Splunk Inc. Log in to Splunk Live IT Operational Intelligence 11 Lets Start with the Basics Type in: Index=oidemo
  • 12.
    Copyright © 2014Splunk Inc. Start Searching 12 1. Click “event info” 2. Click “Event Actions” 3. Click “Get Application Information” Host = Entity So What? It is important to see how they relate to one another. Lets think about “Entities make Applications”
  • 13.
    Copyright © 2014Splunk Inc. Entities and Applications 13 Now we can see mappings from hosts -> application
  • 14.
    Copyright © 2014Splunk Inc. Application Correlation 14 Break out of Application Details by Host See all Application Data in one place What is this “Service”?? Click on Service
  • 15.
    Copyright © 2014Splunk Inc. Services Dashboard 15 Now we see the Service But can we visualize all Services?
  • 16.
    Copyright © 2014Splunk Inc. Services 16 Services are comprised of multiple Applications Application KPI’s can be associated to Services? We are getting Warmer!!! Select Services = “All”
  • 17.
    Copyright © 2014Splunk Inc. All Services 17 Now We have all the services from CMDB(s) And it is associating it to applications, and Entities So Enhancing Data w/CMDB relationships gives us what? Click IT Operations Dashboard
  • 18.
    Copyright © 2014Splunk Inc. The Full Picture 18 Now We Can Map it out and Select the different pieces to understand quickly where the problem is from our Phone Call Emergency Lots of Service Unavailable Click “Apache Web” -> “ITOps Apach Web Overview”
  • 19.
    Copyright © 2014Splunk Inc. ITOps Apache Web Overview 19 Now we can see the issues from the Apache Application Not Regional? Lots of “Service Unavailable”?? Click “Investigate Webstore Details”
  • 20.
    Copyright © 2014Splunk Inc. Service Details Dashboard 20 Can See the interaction Web Services Look Fine? Websphere Warning? MySql - Not So much!!! Click on Mysql Application
  • 21.
    Copyright © 2014Splunk Inc. Database Metrics 21 Getting Closer – Hax0r Very bad… So What can we do? Create a Ticket? Create an Alert? Run a Script? Email DB/Security Team? Lets start with ticket? We go back to Event Click on Top Query
  • 22.
    Copyright © 2014Splunk Inc. Create a Ticket Workflow 22 1. Click “Info” 2. Click “Event Actions” 3. Click “Create Ticket”
  • 23.
    Copyright © 2014Splunk Inc. Ticket Creation 23 ACME = <Your Ticketing System> Easy Button? Splunk Pre-populates Details “Entity” OR Host Application Service
  • 24.
    Copyright © 2014Splunk Inc. Create an Alert 24 1. Return to First Tab 1. Database Metrics Dashboard 2. We want the team to know about this activity “Proactively” 3. How Can we do it? Workflow again?? Lets Find out??
  • 25.
    Copyright © 2014Splunk Inc. Alert Workflow 25 1. Click “Event Actions” 2. Click “Create Alert”
  • 26.
    Copyright © 2014Splunk Inc. Alert Search Creation 26 Now we have: 1. Median Time Taken Application Wide 2. Average Time Taken per User 3. Lets Find the Users Running the longest Queries Add to search – |where user_time_taken > median_time_taken
  • 27.
    Copyright © 2014Splunk Inc. Create Alert 27 Now Lets Create an Alert: 1. Click Save AS 2. Click Alert The alert will be used to proactively notify our Teams of the issue
  • 28.
    Copyright © 2014Splunk Inc. Alert Saving 28 1. Give the Alert a Title: <yourname>User_DBQuery 2. Description: <Your Choice> 3. Alert Type: Scheduled 4. Time Range: Thursday at <now + 5m> 6. Trigger conditions: Defaults 7. Click Next
  • 29.
    Copyright © 2014Splunk Inc. Alert Email Option 29 1.List in Triggered Alerts Check 2. Send Email Check
  • 30.
    Copyright © 2014Splunk Inc. Alert Completion 30 To: <your email> Priority: Default Subject: Default Message: Default Include: Your Choice Run A Script? When Triggered: Default Click Saved
  • 31.
    Copyright © 2014Splunk Inc. Wrapping Up 31 • Common Information Model & Splunk • ITOps Analytics • Why Is it Important? • How can it help the ITOps Team/Business?
  • 32.
    Copyright © 2014Splunk Inc. We Want to Hear your Feedback! After the Breakout Sessions conclude Text Splunk PHX to 878787 And be entered for a chance to win a $100 AMEX gift card!
  • 33.
    Copyright © 2014Splunk Inc. 33 www.splunk.com/apptitude July 20th, 2015 Submission deadline
  • 34.
    Copyright © 2014Splunk Inc. 34 The 6th Annual Splunk Worldwide Users’ Conference • September 21-24, 2015 • The MGM Grand Hotel, Las Vegas • 4000 IT & Business Professionals • 2 Keynote Sessions • 3 days of technical content – 165+ sessions • 3 days of Splunk University – Sept 19-21, 2015 – Get Splunk Certified for FREE! – Get CPE credits for CISSP, CAP, SSCP, etc. – Save thousands on Splunk education! • 80 Customer Speakers • 80 Splunk Speakers • 35+ Apps in Splunk Apps Showcase • 65 Technology Partners • Ask The Experts and Security Experts, Birds of a Feather, Chalk Talks and a new & improved Partner Pavilion! • Register at conf.splunk.com
  • 35.

Editor's Notes

  • #3 Both IT and business professionals can analyze machine data to get real-time visibility and operational intelligence. With our platform for machine data, organizations can meaningfully improve their performance in a wide range of areas e.g. meet service levels, reduce costs, mitigate security risks, maintain compliance and gain insights.
  • #4 Here's how using Splunk and your machine data can drive significant benefits for your organization. Search and investigation. Using Splunk, organizations identify and resolve issues up to 70% faster and reduce costly escalations by up to 90%. Splunk is one place to find and fix problems, and investigate incidents across all your IT systems and infrastructure. Proactive monitoring. Monitor IT systems in real time to identify issues, problems and attacks before they impact your customers, services and revenue. Splunk keeps watch of specific patterns, trends and thresholds in your machine data so you don't have to. Trigger notifications in real-time via email or RSS, execute a script to take remedial actions, send an SNMP trap to your system management console or generate a service desk ticket. Operational visibility. See the whole picture, track performance and make better decisions. Visualize usage trends to better plan for capacity; spot SLA infractions, track how you are being measured by the business. Do all of this using your existing machine data without spending millions of dollars instrumenting your IT infrastructure. Real-time business insight. Make better-informed business decisions by understanding trends, patterns and gaining Operational Intelligence from your machine data. See the success of new online services by channel or demographic, reconcile 3rd-party service provider fees against actual use, find your heaviest users and heaviest abusers, and more. Because machine data captures every behavior, the possibilities are game changing. You'll find the lead times to get to this intelligence dramatically less than other solutions - measured in minutes/hours instead of months.
  • #5 Splunk is the leading platform for machine data analytics with over 7,000 organizations using Splunk – for data volumes ranging from tens of GBs to tens of TBs to over 100 TBs of data PER DAY. Splunk software reliably collects and indexes all the streaming data from IT systems, technology devices and the Internet of Things in real-time - tens of thousands of sources in unpredictable formats and types. Splunk software is optimized for real-time, low latency and interactivity. Organizations use Splunk software and their data the following ways: 1. Find and fix problems dramatically faster 2. Automatically monitor to identify issues, problems and attacks 3. Gain end-to-end visibility to track and deliver on IT KPIs and make better-informed IT decisions 4. Gain real-time insight from operational data to make better-informed business decisions This is described as Operational Intelligence: visibility, insights and intelligence from operational data. Splunk Cloud is currently only available in the United States and Canada.
  • #6 The CIM allows you to normalize your data to match a common standard, using the same field names and event tags for equivalent events from different sources or vendors. The CIM acts as a search-time schema ("schema-on-the-fly") to allow you to define relationships in the event data while leaving the raw machine data intact. Once you have normalized the data from multiple different source types, you can develop reports, correlation searches, and dashboards to present a unified view of a data domain. You can display your normalized data in the dashboards provided by other Splunk-developed applications such as the Splunk App for Enterprise Security and the Splunk App for PCI Compliance. ITOps – Heterogonous environments – Who has one type of Server, Storage, Switch, Firewall? - Database - Select Splunk TA and SA Map to CIM Where does Splunk Fit with CIM – Schema on the Fly Map field names and event tags for equivalent events from different sources or vendors.
  • #7 Splunk APP - A Splunk App is a prebuilt collection of dashboards, panels and UI elements powered by saved searches and packaged for a specific technology or use case to make Splunk immediately useful and relevant to different roles. Splunk Add-on – Capture/Index Data Identify relative events, field extractions, tags, CIM Compliancy Why do they work – Come prepackaged with inputs, props, transforms to standardize the obtaining the data, indexing of data, Search Time Extractions, saved searches, macros Where do you put them – They tell you where to put them, NIX addon goes on Forwarder, Indexer, Searchhead, Deployment Server
  • #9 Splunk 6.1 is our latest version of Splunk software – the industry-leading machine data platform. Lets recap what Splunk Enterprise 6.1 delivers: Enabling the Mission-critical Enterprise Continuous availability of mission-critical machine data with expanded insights from new sources   Multi-site Clustering: Delivers continuous availability for Spunk Enterprise deployments that span sites, countries or continents by replicating raw and indexed data in a clustered configuration Search Affinity: Provides a performance increase when using multi-site clustering by routing search and analytics requests to the nearest cluster, increasing performance and decreasing network usage. zLinux Forwarder: Allows for application and platform data from IBM mainframes to be easily collected and indexed by Splunk Enterprise. Data Preview with Structured Inputs: Enables previewing of massive data files to verify alignment of fields and headers before indexing improving data quality and the time it takes to discover critical insights.   Delivering Enhanced Interactive Analytics Easier to build dashboards and more interactive visualizations. Enhanced Dashboard Editor: Provides the ability to build advanced dashboards through the UI and without requiring advanced XML coding. Chart Overlay: Improves data analysis by providing the ability to overlay one chart on top of another. Contextual Drilldown: Enables more detailed insights when clicking on a dashboard panel without leaving the context of the dashboard itself. Pan and Zoom Controls: Enables more focused analytics by providing the ability to selecting a range of interest on a chart and zooming in for deeper analysis. Embedding Operational Intelligence Extends Operational Intelligence to common business applications. Embedded Reports: Enable any report, table to be embedded in third-party business applications such as salesforce.com, WordPress, Wiki Microsoft® SharePoint, and more. Custom Alerts: Deliver alerts with embedded machine data context reducing mean-time-to-resolution (MTTR), and provide ability to customize alert templates.   Splunk 6.1 represents a significant milestone in our mission to make machine data accessible, usable and valuable by everyone. Find out more at www.splunk.com/6
  • #10 https://54.146.150.218
  • #13 Here is the raw data – date and other fields have been extracted Eventypes – Common Information Model Fields – Src / Dest src_ip/dest_ip etc Splunk Workflow – Event Actions to redirect User to another dashboard or action
  • #14 Discuss CMDB Configuration Management Database – What is it? A repository that acts as a data warehouse for information technology (IT) organizations. Its contents are intended to hold a collection of IT assets that are commonly referred to as configuration items (CI), as well as descriptive relationships between such assets. Can you Splunk it? Oh yeah and use its details to enhance Splunk Data collection
  • #17 Again CMDB Details If we understand Host/Entity to Application to Services then we can search/visualize/report/alert on the time series events based on this detail right?
  • #19 This is a customized for the items important for this NOC Entities/Hosts -> Applications ->Services We can evaluate the individual components that make up a Service from Host components Network/Storage/Compute Why is this important? MTTR Capacity Planning Everyone on the Same Page Blame Games
  • #20 Highlight Different Visualizations GeoIP – Convienant when you looking for a correlation – sometime a link/pop goes down?
  • #21 Logically break out visualizations to represent a flow Highlight the common issues which could occur Web – time_taken/ Response codes Websphere – Java – time_taken/JVM Heap Database – time_taken / active queries
  • #22 Break out of details by query User CPU Memory All the same data just pivoting on it in a different way allows for better visibility into what is happening
  • #23 Workflow again – Standard activity that is repeatable -
  • #34  ----- Meeting Notes (4/22/15 10:47) ----- Splunk Apptitude is live and open. You've got 90 days. To win more than $150,000 in cash and prizes. Last day to submit is July 20th, 2015. We'll announce the winners at Black Hat in August. Good luck!
  • #35 2 inspired Keynotes – General Session and Security Keynote 150+ Breakout sessions addressing all areas and levels of Operational Intelligence – IT, Business Analytics, Mobile, Cloud, IoT, Security…and MORE! Join the 50%+ of Fortune 100 companies who attended .conf2014 to get hands on with Splunk. You’ll be surrounded by thousands of other like-minded individuals who are ready to share exciting and cutting edge use cases and best practices. You can also deep dive on all things Splunk products together with your favorite Splunkers. Head back to your company with both practical and inspired new uses for Splunk, ready to unlock the unimaginable power of your data! Arrive in Vegas a Splunk user, leave Vegas a Splunk Ninja!