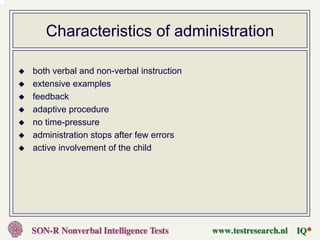
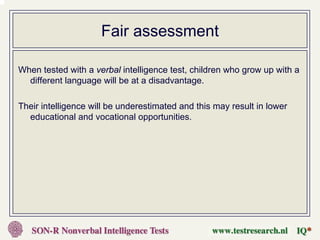
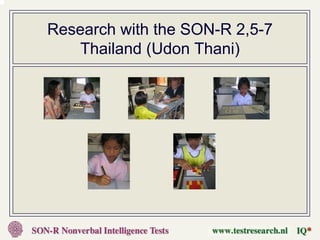
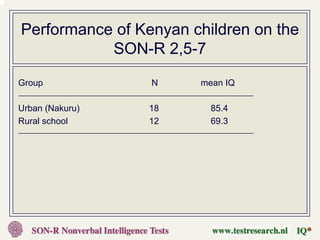
The SON-R non-verbal intelligence tests:
           fair assessment of children


Dr. Peter Tellegen

University of Groningen
The Netherlands

p.j.tellegen@rug.nl
The SON-tests

Originally developed in 1943 for use with deaf children

Now two tests for general application with different age norms:

    the SON-R 2,5-7 (published in 1998)

    the SON-R 5,5-17 (published in 1988)

Dr. Peter Tellegen (university of Groningen, The Netherlands)
Dr. Jaap Laros (university of Brasilia, Brazil)

Publisher: Hogrefe Verlag, Germany
History of the SON-tests

                    SON (1943)
                     4-14 years

                  SON-’58 (1958)
                     4-16 years

SON 2½-7 (1975)                         SSON (1975)
    3-7 years                              7-17 years

SON-R 2½-7 (1998)                 SON-R 5½-17 (1988)
    2,5-8 years                        5,5-17 years

                                     SON-I 6-40 (2008)
                                         6-40 years
A non-verbal test

•   The SON-tests are tests of general intelligence which do not require
    the use of spoken or written language

•   The focus is on fluid intelligence

•   The tests are especially suitable for children with problems in the
    area of language and communication

•   For cross-cultural intelligence assessment, the SON-tests can be
    very useful, because the test materials don’t need translation
Some characteristics

                     SON-R 2,5-7 SON-R 5,5-17

Age range            2;6 – 6;11 yrs    5;6 – 6;11 yrs
Number of subtests                 6                7
Administration          individually     individually
Duration                    50 min.          90 min.
Sample                     N=1.124          N=1.350
Reliability                     .90              .93
Generalisability                .78              .85
Evaluation by the Dutch test
         commission (COTAN)
                     SON-R 2,5-7   SON-R 5,5-17

Construction               good           good
Materials                  good           good
Manual                     good           good
Norms                      good           good
Reliability                good           good
Construct validity         good           good
Criterion validity         good           good
Dimensions in the SON-tests

Concrete reasoning
Abstract reasoning
Spatial abilities
Perceptual abilities
SON-R and language development

Correlations of SON-R 2,5-7 and teacher evaluation
(general education, N=616)

Criterion                        correlation
------------------------------------------------
Intelligence                                .46
Language development                        .44

Correlations of SON-R 2,5-7 and evaluation by staff
(special groups, N=241)

Criterion                        correlation
------------------------------------------------
Intelligence                                .61
Language development                        .31
SON-R and language development

Correlations of IQ SON-R 2,5-7 with other tests

Criterion test                   General education               Special groups
-------------------------------------------------------------------------------------
General intelligence
    Bailey                                 .59 (50)
    K-ABC                                  .65 (115)
    RAKIT                                  .60 (165)             .55 (70)
    LDT                                                          .58 (80)
    WPPSI                                                        .60 (53)

Language development
    Reynell                                .45 (558)             .44 (179)
    TvK                                    .59 (108)             .53 (49)
---------------------------------------------------------------------------------------
Subtests of the SON-R 2,5-7

Mosaics      (spatial)
Categories   (reasoning)
Puzzles      (spatial)
Analogies    (reasoning)
Situations   (reasoning)
Patterns     (spatial)
Analogies (SON-R 2,5-7)

Abstract reasoning
Mosaics (SON-R 2,5-7)

Spatial
Categories (SON-R 2,5-7)

Abstract reasoning
Puzzles (SON-R 2,5-7)
Spatial
Situations (SON-R 2,5-7)

Concrete reasoning
Patterns (SON-R 2,5-7)

Spatial
Standardisations of the SON-R 2,5-7

The Netherlands (1998)         published
Germany (2005)                 to be published 2006
Great Britain (2005)           most data collected
Czech/Slowak Republic (2006)   most data collected
Brazil (2007)                  in preparation
Iran (2007)                    in preparation
Thailand (2007)                in preparation
Subtests of the SON-R 5,5-17

Categories        (reasoning)
Mosaics           (spatial)
Hidden Pictures   (perceptual)
Patterns          (spatial)
Situations        (reasoning)
Analogies         (reasoning)
Stories           (reasoning)
Categories (SON-R 5,5-17)
Concrete reasoning
Mosaics (SON-R 5,5-17)
Spatial
Hidden pictures (SON-R 5,5-17)
Perceptual
Patterns (SON-R 5,5-17)
Spatial
Situations (SON-R 5,5-17)
Concrete reasoning
Analogies (SON-R 5,5-17)
Abstract reasoning
Stories (SON-R 5,5-17)
Concrete reasoning
PRINCIPLES of ASSESSMENT

              The needs of the subject
              are the focus of interest


Improve                               Highlight the
accuracy of                           limitations of
measurement                           interpretation
Characteristics of administration

both verbal and non-verbal instruction
extensive examples
feedback
adaptive procedure
no time-pressure
administration stops after few errors
active involvement of the child
Individualized adaptive testing

3 series (a, b, c) with same levels of difficulty


    Each child starts with same item a1.
    Stop in each series after two errors.
    Skip easy items at the beginning
    (they are counted as correct)
Norms based on age intervals

The WISC-tests use norms based on 4-month intervals

Two children with exactly the same raw scores:
  Age of John is 6;3:30
  Age of Mary is 6;4:0

The age difference is only 1 day

But the difference in IQ is 8 points
  John: IQ = 74
  Mary: IQ = 66
Continuous norms

It is possible to compute standardized scores (z)
     for any raw score X and for any age Y
     with a formula such as:

Z = a + b.X + c.X2 + d.X3 +
    e.Y + f.Y2 + g.Y3 +
    h.X.Y + i.X2.Y + j.X3.Y + k.X.Y2

a ... k parameters of the model
X2, X3 second and third order of raw score
Y2, Y3 second and third order of age
Fair assessment

When tested with a verbal intelligence test, children who grow up with a
  different language will be at a disadvantage.

Their intelligence will be underestimated and this may result in lower
  educational and vocational opportunities.
Immigrant children in The Netherlands

Verbal intelligence should be assessed in the native language
(Carroll).

Also with the SON-tests, immigrant children score lower
compared to native Dutch children.

With verbal intelligence tests, however, the difference is twice as
large.
Mean IQ’s of immigrant children

groups                 SON-R           RAKIT

Moroccan                88.7           80.5
Turkish                 91.0           80.0


SON-R non-verbal intelligence test
RAKIT general intelligence test, like the WISC
Educational level of the father in
      The Netherlands and mean IQ’s
Educational level     pct.   mean SON IQ

Only primary school   7%      92.9
University            7%     111.6
Improving the nonverbal content

Pictorial contents can also be culturally biased.

Cross-cultural research – between countries and also
between different cultures within a country –
can make the test less culture dependent.

For the new edition of the SON-R 5,5-17 such research
is carried out with the subtest Categories.
Thailand photo research categories
Africa photo research categories
Morocco photo research
     categories
Cross-cultural research SON-R 5,5-17

Improvement of the subtest Categories

     Group-wise administration in different countries
     Comparison of results
     Improving item content
     Estimation of difficulty order
     Evaluation of item bias

First round: Brazil, Indonesia, Kenya, Morocco, The
   Netherlands
Second round: Brazil, Thailand, Iran, Slovakia, Surinam,
   The Netherlands
The SON outside Europe

Research with the tests in:

Kenya, Morocco, Burkina Fasso, Congo Brazzaville
Brasilia, Surinam, Peru
Thailand, Iran, China, Indonesia
Australia, United States
Africa photo boy patterns
Morocco photo girl mosaics
Africa photo boy patterns
Africa photo boy mosaics
Morocco photo boy mosaics
Morocco photo girl patterns
Research with the SON-R 2,5-7
    Thailand (Udon Thani)
Performance of the Thai children on the
          SON-R 2,5-7 [a]
                                             Udon Thani                     other parts
                                           (poor rural area)                 Thailand
                                                N=49                           N=240
                                           ---------------------            --------------
subtest                                    mean (sd)                        mean (sd)
-------------------------------------------------------------------------------------------
• Mosaics (spatial)                          7.1 (2.8)                      9.0 (2.9)
• Patterns (spatial)                         8.3 (2.8)                    11.3 (3.0)
• Categories (reasoning)                     7.2 (3.2)                      9.7 (3.2)
• Situations (reasoning)                     7.1 (3.3)                    10.0 (3.4)
-------------------------------------------------------------------------------------------
Total IQ                                   82.8 (14.2)                   100.2 (15.7)
Performance of Kenyan children on the
           SON-R 2,5-7
Group            N     mean IQ

Urban (Nakuru)   18      85.4
Rural school     12      69.3
Performance of Peruvian children on the
           SON-R 5,5-17
Group                             N    mean IQ

Urban (Lima)                     160    94.0
Rural (Urubamba)                  32    73.0
(street children / poor areas)
Conclusion:
        how to interpret the test scores

Test performance reflects level of intelligence.

   But it is also true that

Test performance reflects the situation in which children grow up.

Unless situations are fairly comparable, scores do not represent
  “real” intelligence but are better described as representing
  differences in cognitive development.
www.testresearch.nl

   Pages in Dutch / German / English
   General information on the SON and other intelligence tests

Of special interest on the website:

Fair Assessment of Children from Cultural Minorities: A Description of
   the SON-R Nonverbal Intelligence Tests

P.J. Tellegen & J.A. Laros

In: Quality Education for Children from Socially Disadvantaged Settings
Edited by Dagmar Kopcanova (2005)

Spatial intelligence test for children

  • 1.
    The SON-R non-verbalintelligence tests: fair assessment of children Dr. Peter Tellegen University of Groningen The Netherlands p.j.tellegen@rug.nl
  • 2.
    The SON-tests Originally developedin 1943 for use with deaf children Now two tests for general application with different age norms: the SON-R 2,5-7 (published in 1998) the SON-R 5,5-17 (published in 1988) Dr. Peter Tellegen (university of Groningen, The Netherlands) Dr. Jaap Laros (university of Brasilia, Brazil) Publisher: Hogrefe Verlag, Germany
  • 3.
    History of theSON-tests SON (1943) 4-14 years SON-’58 (1958) 4-16 years SON 2½-7 (1975) SSON (1975) 3-7 years 7-17 years SON-R 2½-7 (1998) SON-R 5½-17 (1988) 2,5-8 years 5,5-17 years SON-I 6-40 (2008) 6-40 years
  • 4.
    A non-verbal test • The SON-tests are tests of general intelligence which do not require the use of spoken or written language • The focus is on fluid intelligence • The tests are especially suitable for children with problems in the area of language and communication • For cross-cultural intelligence assessment, the SON-tests can be very useful, because the test materials don’t need translation
  • 5.
    Some characteristics SON-R 2,5-7 SON-R 5,5-17 Age range 2;6 – 6;11 yrs 5;6 – 6;11 yrs Number of subtests 6 7 Administration individually individually Duration 50 min. 90 min. Sample N=1.124 N=1.350 Reliability .90 .93 Generalisability .78 .85
  • 6.
    Evaluation by theDutch test commission (COTAN) SON-R 2,5-7 SON-R 5,5-17 Construction good good Materials good good Manual good good Norms good good Reliability good good Construct validity good good Criterion validity good good
  • 7.
    Dimensions in theSON-tests Concrete reasoning Abstract reasoning Spatial abilities Perceptual abilities
  • 8.
    SON-R and languagedevelopment Correlations of SON-R 2,5-7 and teacher evaluation (general education, N=616) Criterion correlation ------------------------------------------------ Intelligence .46 Language development .44 Correlations of SON-R 2,5-7 and evaluation by staff (special groups, N=241) Criterion correlation ------------------------------------------------ Intelligence .61 Language development .31
  • 9.
    SON-R and languagedevelopment Correlations of IQ SON-R 2,5-7 with other tests Criterion test General education Special groups ------------------------------------------------------------------------------------- General intelligence Bailey .59 (50) K-ABC .65 (115) RAKIT .60 (165) .55 (70) LDT .58 (80) WPPSI .60 (53) Language development Reynell .45 (558) .44 (179) TvK .59 (108) .53 (49) ---------------------------------------------------------------------------------------
  • 10.
    Subtests of theSON-R 2,5-7 Mosaics (spatial) Categories (reasoning) Puzzles (spatial) Analogies (reasoning) Situations (reasoning) Patterns (spatial)
  • 11.
  • 12.
  • 13.
  • 14.
  • 15.
  • 16.
  • 17.
    Standardisations of theSON-R 2,5-7 The Netherlands (1998) published Germany (2005) to be published 2006 Great Britain (2005) most data collected Czech/Slowak Republic (2006) most data collected Brazil (2007) in preparation Iran (2007) in preparation Thailand (2007) in preparation
  • 18.
    Subtests of theSON-R 5,5-17 Categories (reasoning) Mosaics (spatial) Hidden Pictures (perceptual) Patterns (spatial) Situations (reasoning) Analogies (reasoning) Stories (reasoning)
  • 19.
  • 20.
  • 21.
    Hidden pictures (SON-R5,5-17) Perceptual
  • 22.
  • 23.
  • 24.
  • 25.
  • 26.
    PRINCIPLES of ASSESSMENT The needs of the subject are the focus of interest Improve Highlight the accuracy of limitations of measurement interpretation
  • 27.
    Characteristics of administration bothverbal and non-verbal instruction extensive examples feedback adaptive procedure no time-pressure administration stops after few errors active involvement of the child
  • 28.
    Individualized adaptive testing 3series (a, b, c) with same levels of difficulty Each child starts with same item a1. Stop in each series after two errors. Skip easy items at the beginning (they are counted as correct)
  • 29.
    Norms based onage intervals The WISC-tests use norms based on 4-month intervals Two children with exactly the same raw scores: Age of John is 6;3:30 Age of Mary is 6;4:0 The age difference is only 1 day But the difference in IQ is 8 points John: IQ = 74 Mary: IQ = 66
  • 30.
    Continuous norms It ispossible to compute standardized scores (z) for any raw score X and for any age Y with a formula such as: Z = a + b.X + c.X2 + d.X3 + e.Y + f.Y2 + g.Y3 + h.X.Y + i.X2.Y + j.X3.Y + k.X.Y2 a ... k parameters of the model X2, X3 second and third order of raw score Y2, Y3 second and third order of age
  • 31.
    Fair assessment When testedwith a verbal intelligence test, children who grow up with a different language will be at a disadvantage. Their intelligence will be underestimated and this may result in lower educational and vocational opportunities.
  • 32.
    Immigrant children inThe Netherlands Verbal intelligence should be assessed in the native language (Carroll). Also with the SON-tests, immigrant children score lower compared to native Dutch children. With verbal intelligence tests, however, the difference is twice as large.
  • 33.
    Mean IQ’s ofimmigrant children groups SON-R RAKIT Moroccan 88.7 80.5 Turkish 91.0 80.0 SON-R non-verbal intelligence test RAKIT general intelligence test, like the WISC
  • 34.
    Educational level ofthe father in The Netherlands and mean IQ’s Educational level pct. mean SON IQ Only primary school 7% 92.9 University 7% 111.6
  • 35.
    Improving the nonverbalcontent Pictorial contents can also be culturally biased. Cross-cultural research – between countries and also between different cultures within a country – can make the test less culture dependent. For the new edition of the SON-R 5,5-17 such research is carried out with the subtest Categories.
  • 36.
  • 37.
  • 38.
  • 39.
    Cross-cultural research SON-R5,5-17 Improvement of the subtest Categories Group-wise administration in different countries Comparison of results Improving item content Estimation of difficulty order Evaluation of item bias First round: Brazil, Indonesia, Kenya, Morocco, The Netherlands Second round: Brazil, Thailand, Iran, Slovakia, Surinam, The Netherlands
  • 40.
    The SON outsideEurope Research with the tests in: Kenya, Morocco, Burkina Fasso, Congo Brazzaville Brasilia, Surinam, Peru Thailand, Iran, China, Indonesia Australia, United States
  • 41.
  • 42.
  • 43.
  • 44.
  • 45.
  • 46.
  • 47.
    Research with theSON-R 2,5-7 Thailand (Udon Thani)
  • 48.
    Performance of theThai children on the SON-R 2,5-7 [a] Udon Thani other parts (poor rural area) Thailand N=49 N=240 --------------------- -------------- subtest mean (sd) mean (sd) ------------------------------------------------------------------------------------------- • Mosaics (spatial) 7.1 (2.8) 9.0 (2.9) • Patterns (spatial) 8.3 (2.8) 11.3 (3.0) • Categories (reasoning) 7.2 (3.2) 9.7 (3.2) • Situations (reasoning) 7.1 (3.3) 10.0 (3.4) ------------------------------------------------------------------------------------------- Total IQ 82.8 (14.2) 100.2 (15.7)
  • 49.
    Performance of Kenyanchildren on the SON-R 2,5-7 Group N mean IQ Urban (Nakuru) 18 85.4 Rural school 12 69.3
  • 50.
    Performance of Peruvianchildren on the SON-R 5,5-17 Group N mean IQ Urban (Lima) 160 94.0 Rural (Urubamba) 32 73.0 (street children / poor areas)
  • 51.
    Conclusion: how to interpret the test scores Test performance reflects level of intelligence. But it is also true that Test performance reflects the situation in which children grow up. Unless situations are fairly comparable, scores do not represent “real” intelligence but are better described as representing differences in cognitive development.
  • 52.
    www.testresearch.nl Pages in Dutch / German / English General information on the SON and other intelligence tests Of special interest on the website: Fair Assessment of Children from Cultural Minorities: A Description of the SON-R Nonverbal Intelligence Tests P.J. Tellegen & J.A. Laros In: Quality Education for Children from Socially Disadvantaged Settings Edited by Dagmar Kopcanova (2005)