Downloaded 62 times
 ⊕ X = B Rotate180 0.257 0.771 0.279
Rotate270 0.250 0.752 0.273
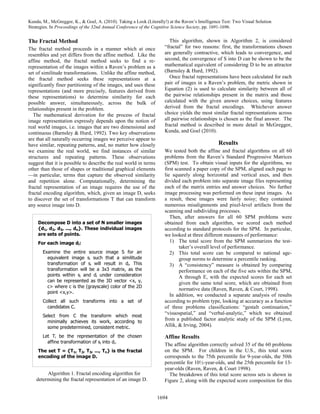
Algorithm 1. Affine method for calculating best-fit
Generated
similitude transformation for a pair of images A and B. guess:
For three-element transforms, T is applied to images A
and B, and the result is compared, as above, to image C.
1693](https://image.slidesharecdn.com/ravensintelligencetest-110321025701-phpapp01/85/Ravens-intelligence-test-3-320.jpg)
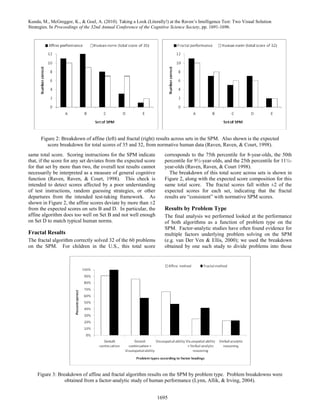
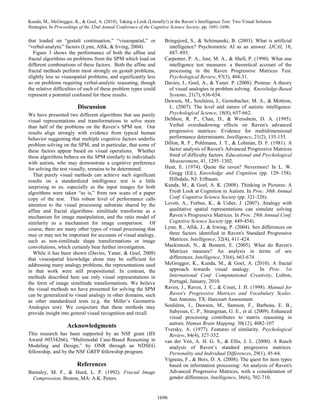

This document summarizes a research paper that presents two algorithms for solving Raven's Progressive Matrices tests visually without propositional representations. The paper introduces the Raven's test and existing computational accounts that use propositions. It then describes two new algorithms called "Affine" and "Fractal" that use visual representations and similarity-preserving transformations to solve the problems. The paper analyzes the performance of the algorithms on all 60 problems from the Standard Progressive Matrices test and finds they perform best on problems requiring visual/spatial skills and less on verbal problems.


![11.[36 49]solution of a subclass of lane emden differential equation by varia...](https://cdn.slidesharecdn.com/ss_thumbnails/11-36-49solutionofasubclassoflaneemdendifferentialequationbyvariationaliterationmethod-120512235747-phpapp02-thumbnail.jpg?width=640&height=640&fit=bounds)