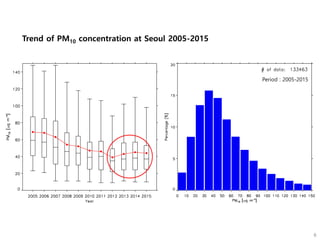
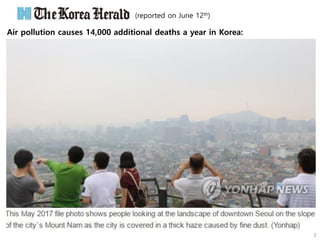
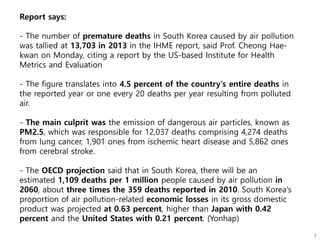
- Air pollution causes over 13,000 premature deaths per year in South Korea. Fine particulate matter (PM2.5) is the main culprit, responsible for over 12,000 deaths from lung cancer, heart disease, and stroke.
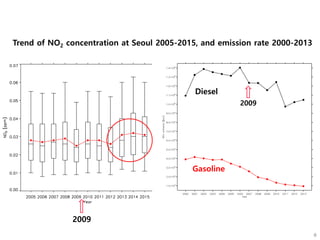
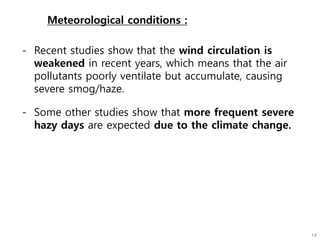
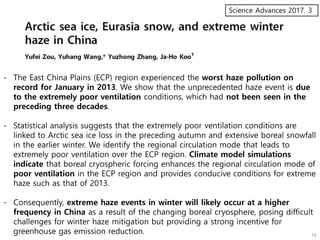
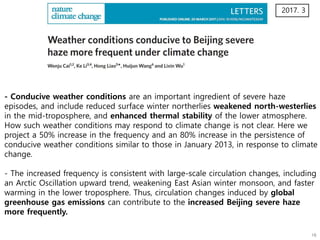
- The South Korean government has invested billions to reduce emissions from diesel vehicles and install filters, but air quality has worsened since 2013. Meteorological conditions are also playing a role, with weaker winds leading to increased air stagnation.
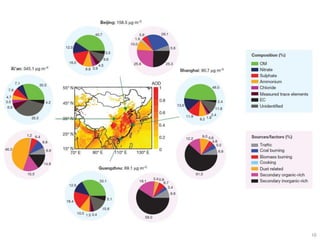
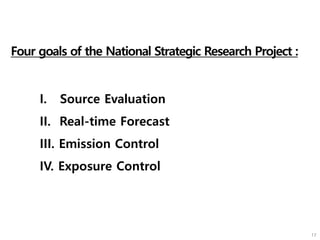
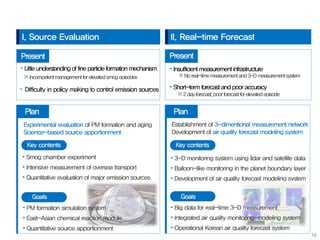
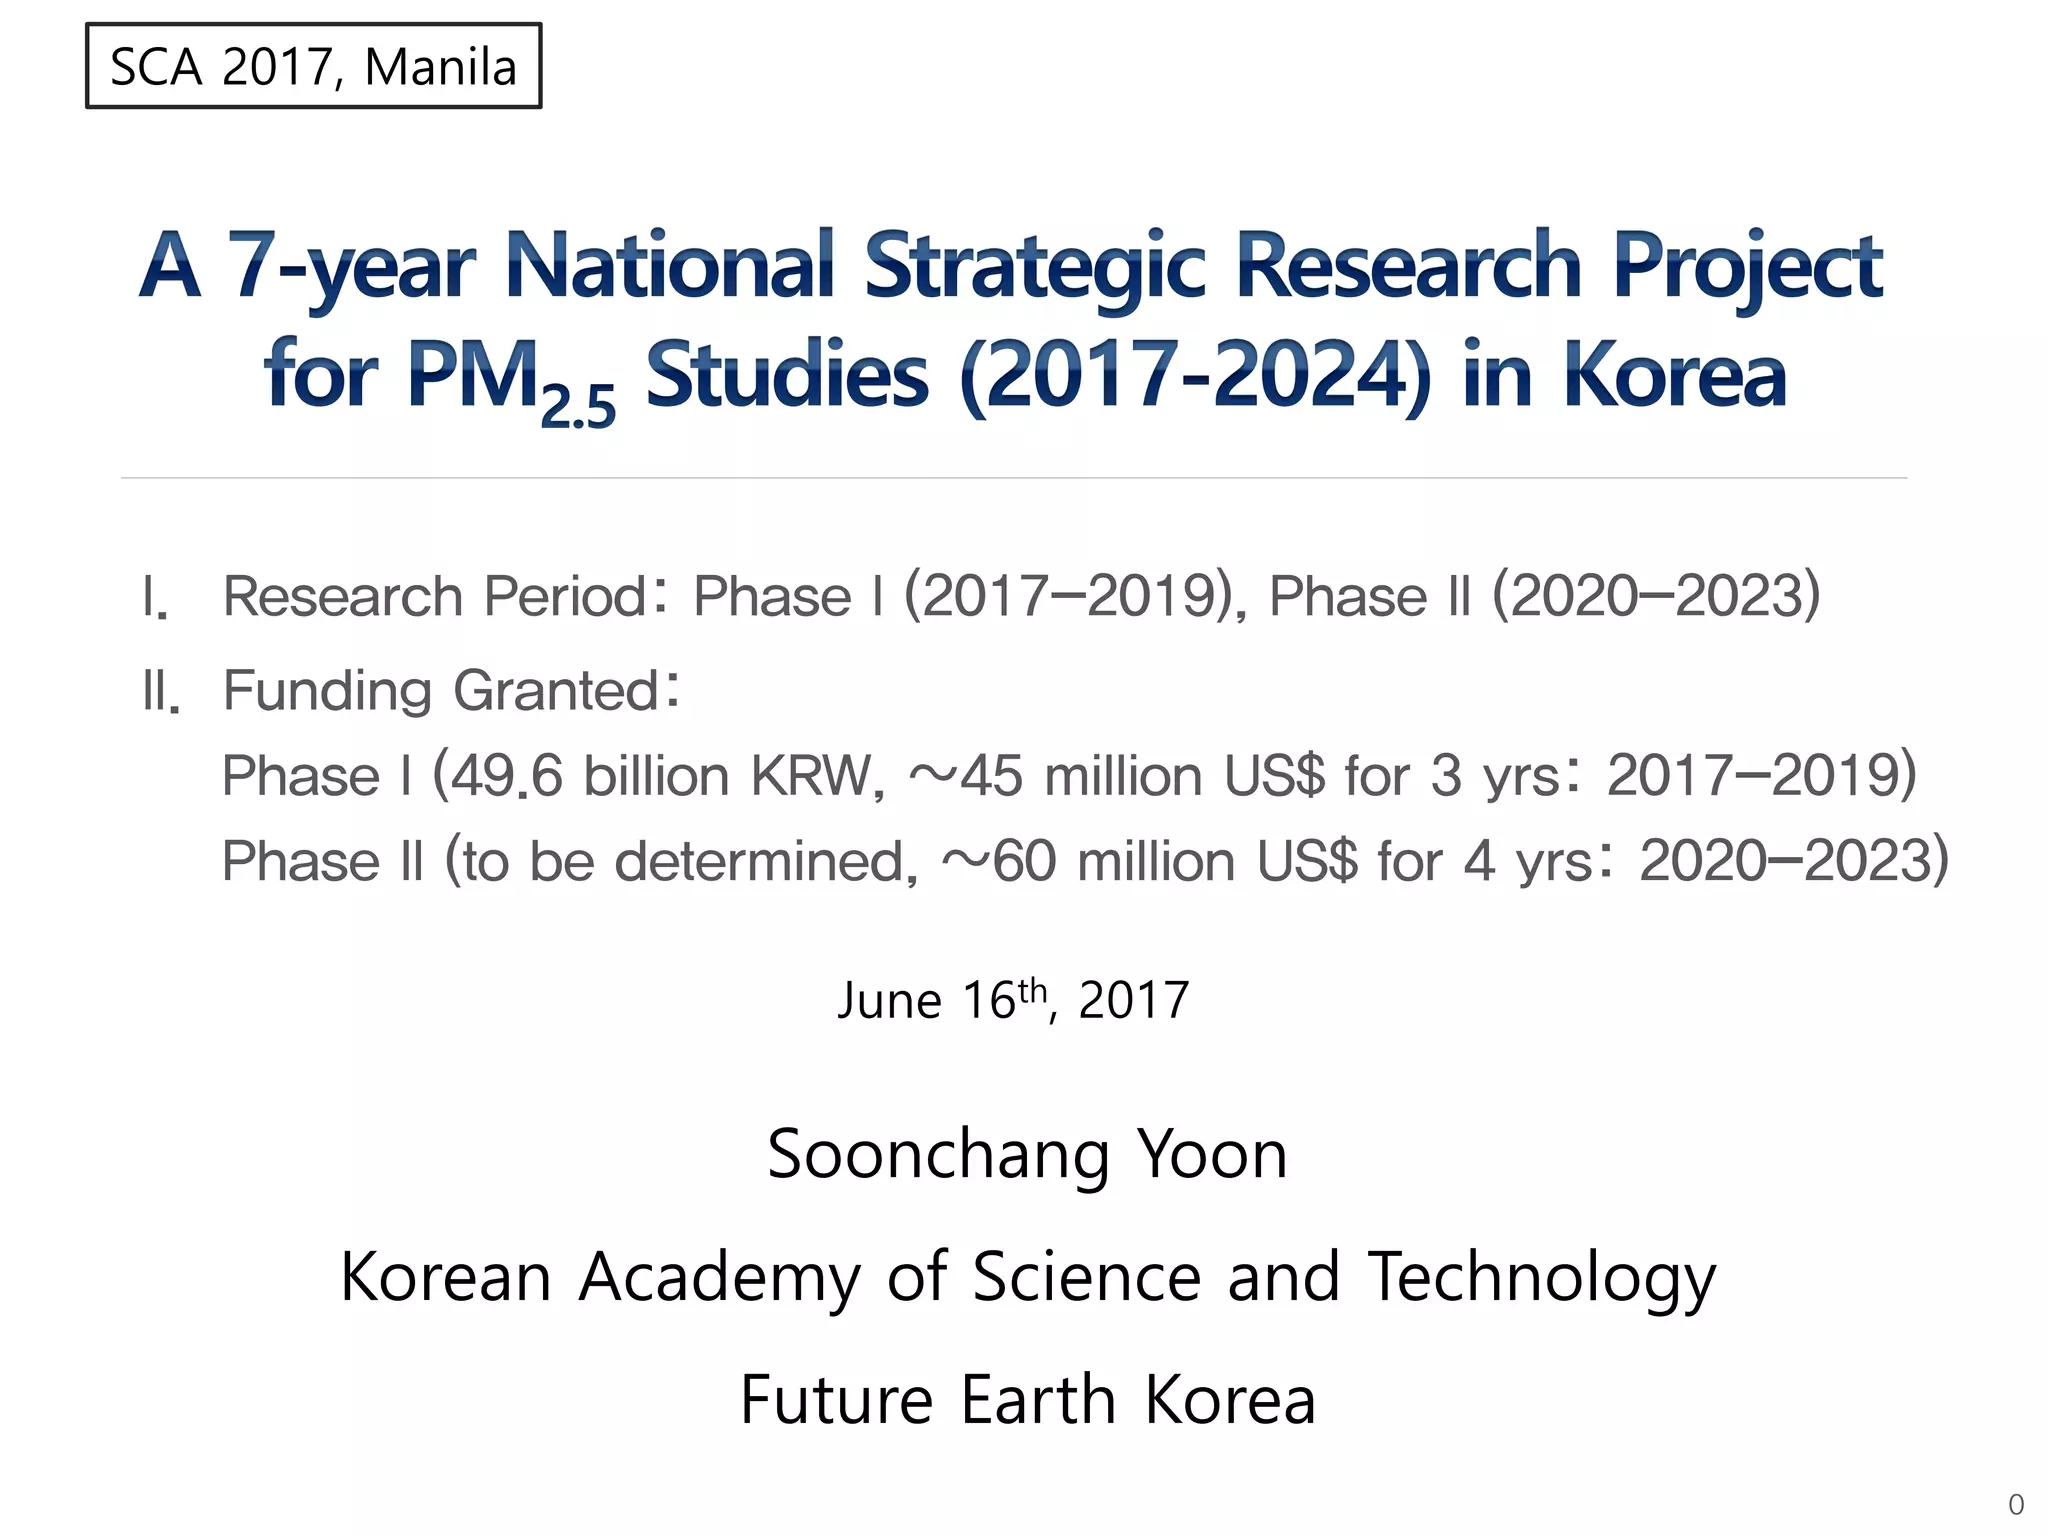
- South Korea has launched a National Strategic Research Project with four goals: evaluating pollution sources, improving forecasting, strengthening emissions controls, and reducing population exposure. The project aims to inform policymaking through interdisciplinary collaboration between scientists, industry, and

![1. Apr 2001 – Feb 2002 [Kim, 2006]
2. Apr 2001 – Feb 2002 [Kang et al., 2006]
3. 2003 – 2004 [Kim, 2006]
4. Mar 2003 – Feb 2005 [Kim et al., 2007]
5. 2003 – 2004 [Kim, 2006]
6. Mar 2003 – Feb 2005 [Kim et al., 2007]
7. Winter 2005 [Jung et al., 2009; Dec 2005 – Nov 2007]
8. Spring 2006 [Jung et al., 2009]
9. Summer 2006 [Jung et al., 2009]
10. Fall 2006 [Jung et al., 2009]
11. Winter 2006 [Jung et al., 2009]
12. Spring 2007 [Jung et al., 2009]
13. Summer 2007 [Jung et al., 2009]
14. Fall 2007 [Jung et al., 2009]
15. Jan 2009 – Dec 2009 [Park et al., 2012]
16. Jan 2010 – Dec 2010 [Shon et al., 2012]
17. Fall 2012 [KIST]
18. Winter 2013 [KIST]
19. Spring 2013 [KIST]
20. Summer 2013 [KIST]
1 2
3
5
4
6 11
107
8 9
12
13
14 15
16
17
19
18
20
↓ ↑
ECMassConcentration(μgm-3)
Year
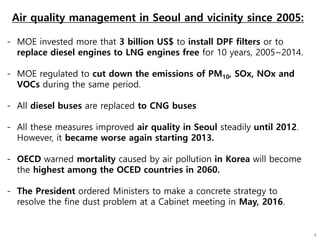
Trend of PM2.5 elemental carbon (EC) concentrations in Seoul
Air Quality, Atmosphere & Health (in print)](https://image.slidesharecdn.com/soonchangyoon-170626082030/85/Soonchang-yoon-6-320.jpg)