
Recommended
More Related Content
More from christjt
More from christjt (20)
Recently uploaded
Recently uploaded (20)
Ch.8 1 Linear Regression Intro
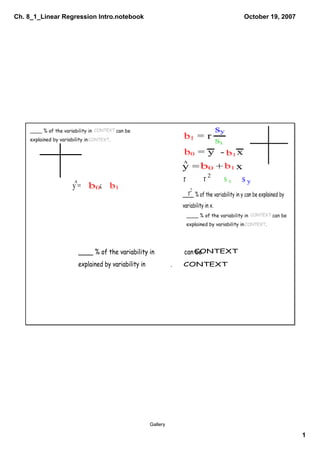
- 1. Ch. 8_1_Linear Regression Intro.notebook October 19, 2007 v r r2 sx sy y = + x ____ % of the variability in can CONTEXT be explained by variability in . CONTEXT Gallery 1
- 2. Ch. 8_1_Linear Regression Intro.notebook October 19, 2007 CONTEXT CONTEXT For every EXPLANATORY RESPONSE , UNITS UNITS Oct 187:03 AM 2
- 3. Ch. 8_1_Linear Regression Intro.notebook October 19, 2007 OBJECTIVES REMINDERS 1. HW Discussion IT Due Tuesday October 23 2. zscore's change with correlation 3. Describing Bivariate Data (Writing and Quantiatively) HW Opening Screen 3
- 4. Ch. 8_1_Linear Regression Intro.notebook October 19, 2007 Formulas 4
- 5. Ch. 8_1_Linear Regression Intro.notebook October 19, 2007 r = 0.85 zy Best Fit Line slope = yintercept = zx Equation Moving _____ standard deviations from the mean in x, moves us _____ standard deviations from the mean in y. Standard Deviations 5
- 6. Ch. 8_1_Linear Regression Intro.notebook October 19, 2007 Oct 1910:28 AM 6
- 7. Ch. 8_1_Linear Regression Intro.notebook October 19, 2007 Oct 1910:25 AM 7
- 8. Ch. 8_1_Linear Regression Intro.notebook October 19, 2007 r = 0.85 2 x = house size (thousands of ft ) y = house price (in thousands of $) 1. If a house is 1 SD above the mean in size, how many SD's above the mean would you predict its price to be? 2. What would you predict about a house that's 2 SDs below average in size? Application of r to prediction 8
- 9. Ch. 8_1_Linear Regression Intro.notebook October 19, 2007 Wiki Assignment Post some new vocabulary, a graphing calculator skill, or answer one of the chapter questions in the Chapter Outlines Tab. Wiki Assignments 9