


![[1] Gupta, N., Yadav, K. K., & Kumar, V. (2015). A review on current status of municipal
solid waste management in India. Journal of Environmental Sciences.
[2] Hazra, T., & Goel, S. (2009). Solid waste management in Kolkata, India: Practices
and challenges. Waste management, 2(1), 470-478.
[3] Kumar, K. N., & Goel, S. (2009). Characterization of municipal solid waste (MSW)
and a proposed management plan for Kharagpur, West Bengal, India.Resources,
Conservation and Recycling, 53(3), 166-174.
[4] Gu, B., Wang, H., Chen, Z., Jiang, S., Zhu, W., Liu, M., ... & Bi, J. (2015).
Characterization, quantification and management of household solid waste: A case
study in China. Resources, Conservation and Recycling, 98, 67-75.
[5] Pirani, S. I., & Arafat, H. A. (2014). Solid waste management in the hospitality
industry: A review. Journal of environmental management, 146, 320-336.
[6] Rajesh R. Pai, Lewlyn L. R. Rodrigues, Asish Oommen Mathew, Sunith Hebbar
“Impact of Urbanization on Municipal Solid Waste Management: A System Dynamics
Approach”, ISSN 2348-0157, Vol. 02, No. 01, January 2014.
[7] C Chandramouli (23 August 2011). "Census of India 2011 – A Story of Innovations".
Press Information Bureau, Government of India.
[8] Brady D, Beckfield J and Seeleib-Kaiser M (2005) Economic globalization and the
welfare state in affluent democracies – 1975–2001. American Sociological Review
70(6): 921–948.
[9] Corbridge S and Harriss J (2001) Reinventing India: Liberalization, Hindu
Nationalism and Popular Democracy. New Delhi: Oxford University Press.
REFERENCES](https://image.slidesharecdn.com/solidwastemanagement-200513074233/75/Solid-waste-management-17-2048.jpg)


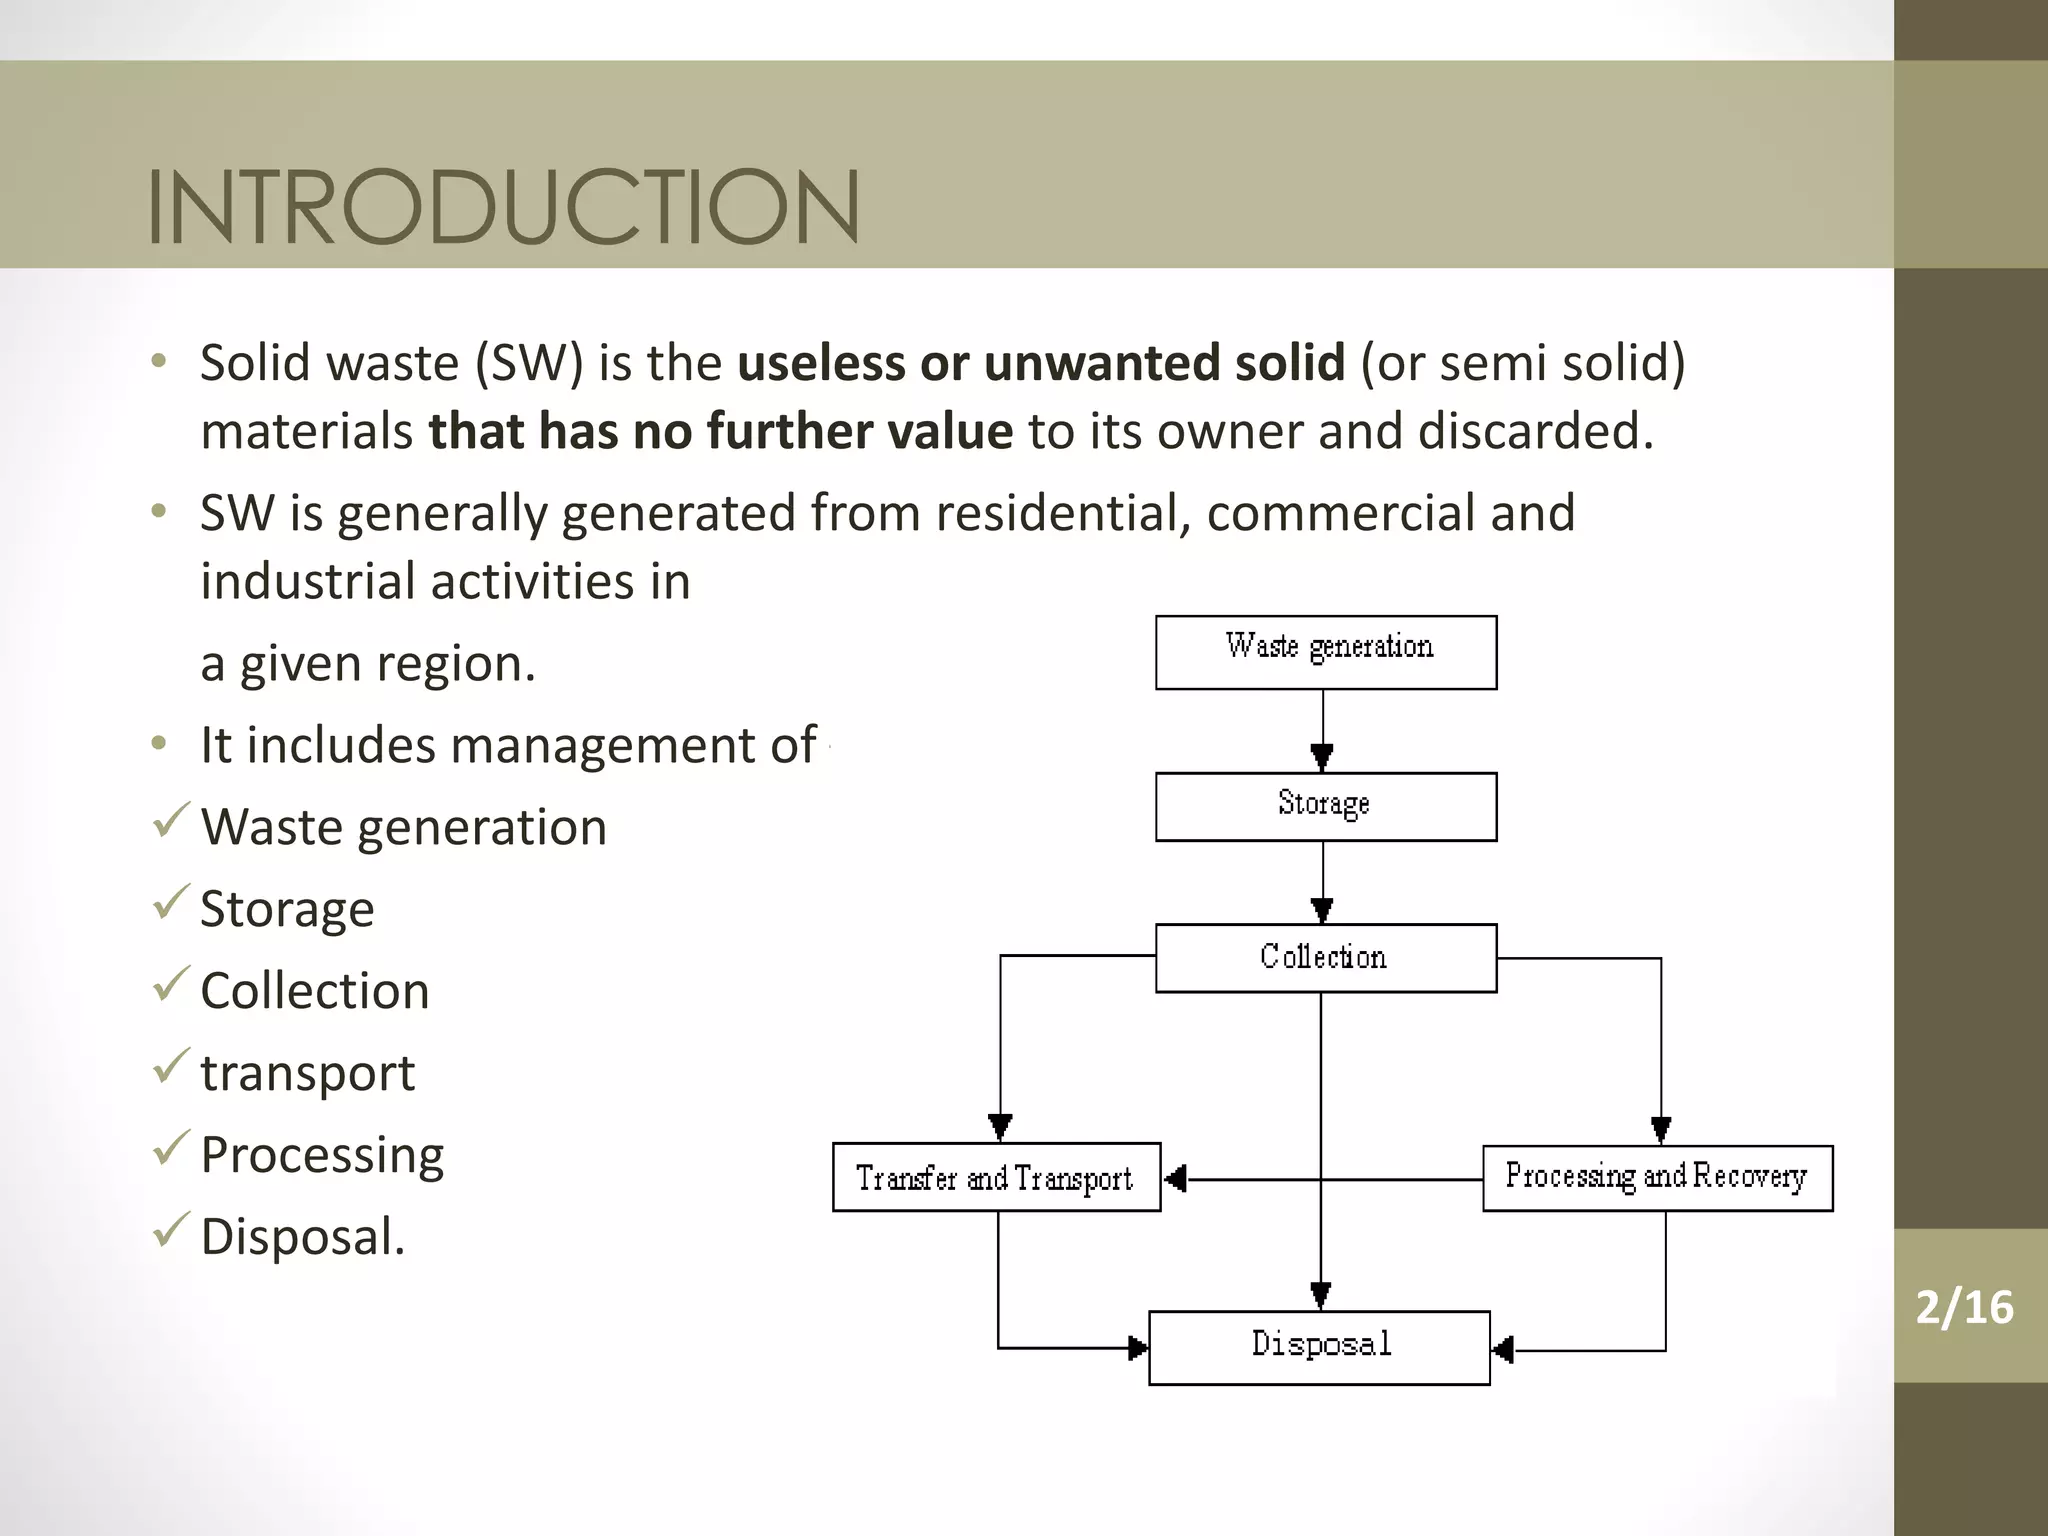
The document discusses solid waste management practices in Indian cities. It defines solid waste as useless materials that are discarded. Solid waste management involves waste generation, storage, collection, transport, processing, and disposal. The document notes that India's annual municipal solid waste generation has increased from 6 million tons in 1947 to an estimated 300 million tons in 2047. Current issues with solid waste management in Indian cities include inadequate waste collection systems, unscientific landfill practices, and lack of coordination between civic bodies. The document advocates for improved systems and protective measures for waste workers.


