The document summarizes India's renewable energy goals and progress under the Jawaharlal Nehru National Solar Mission. Key points include:
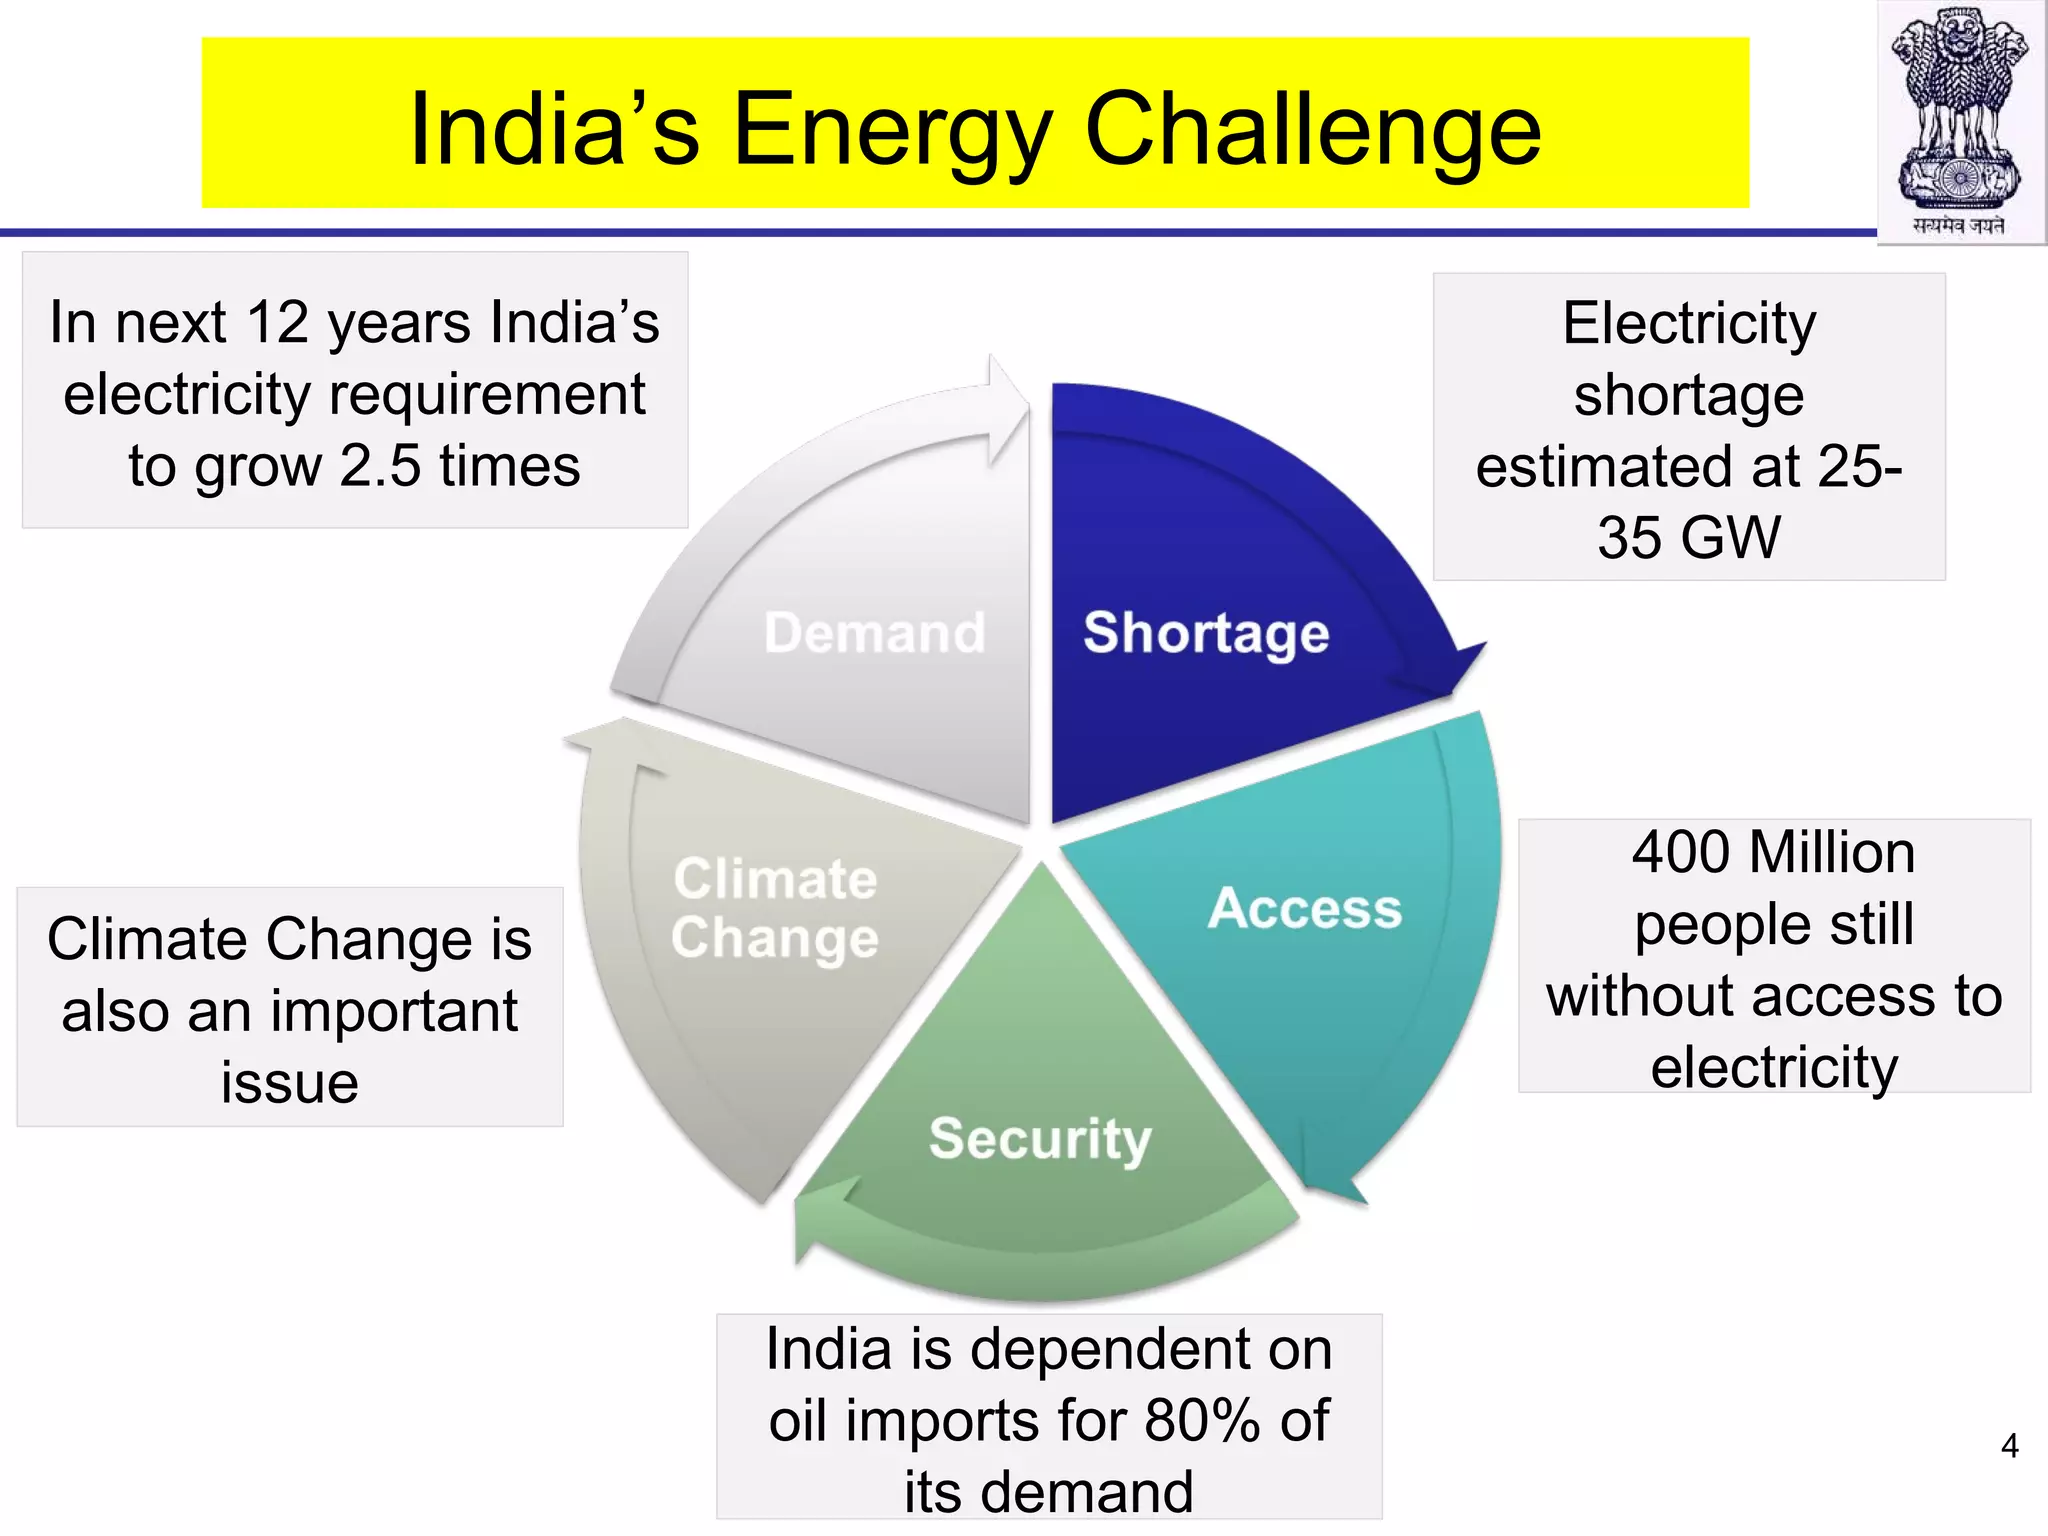
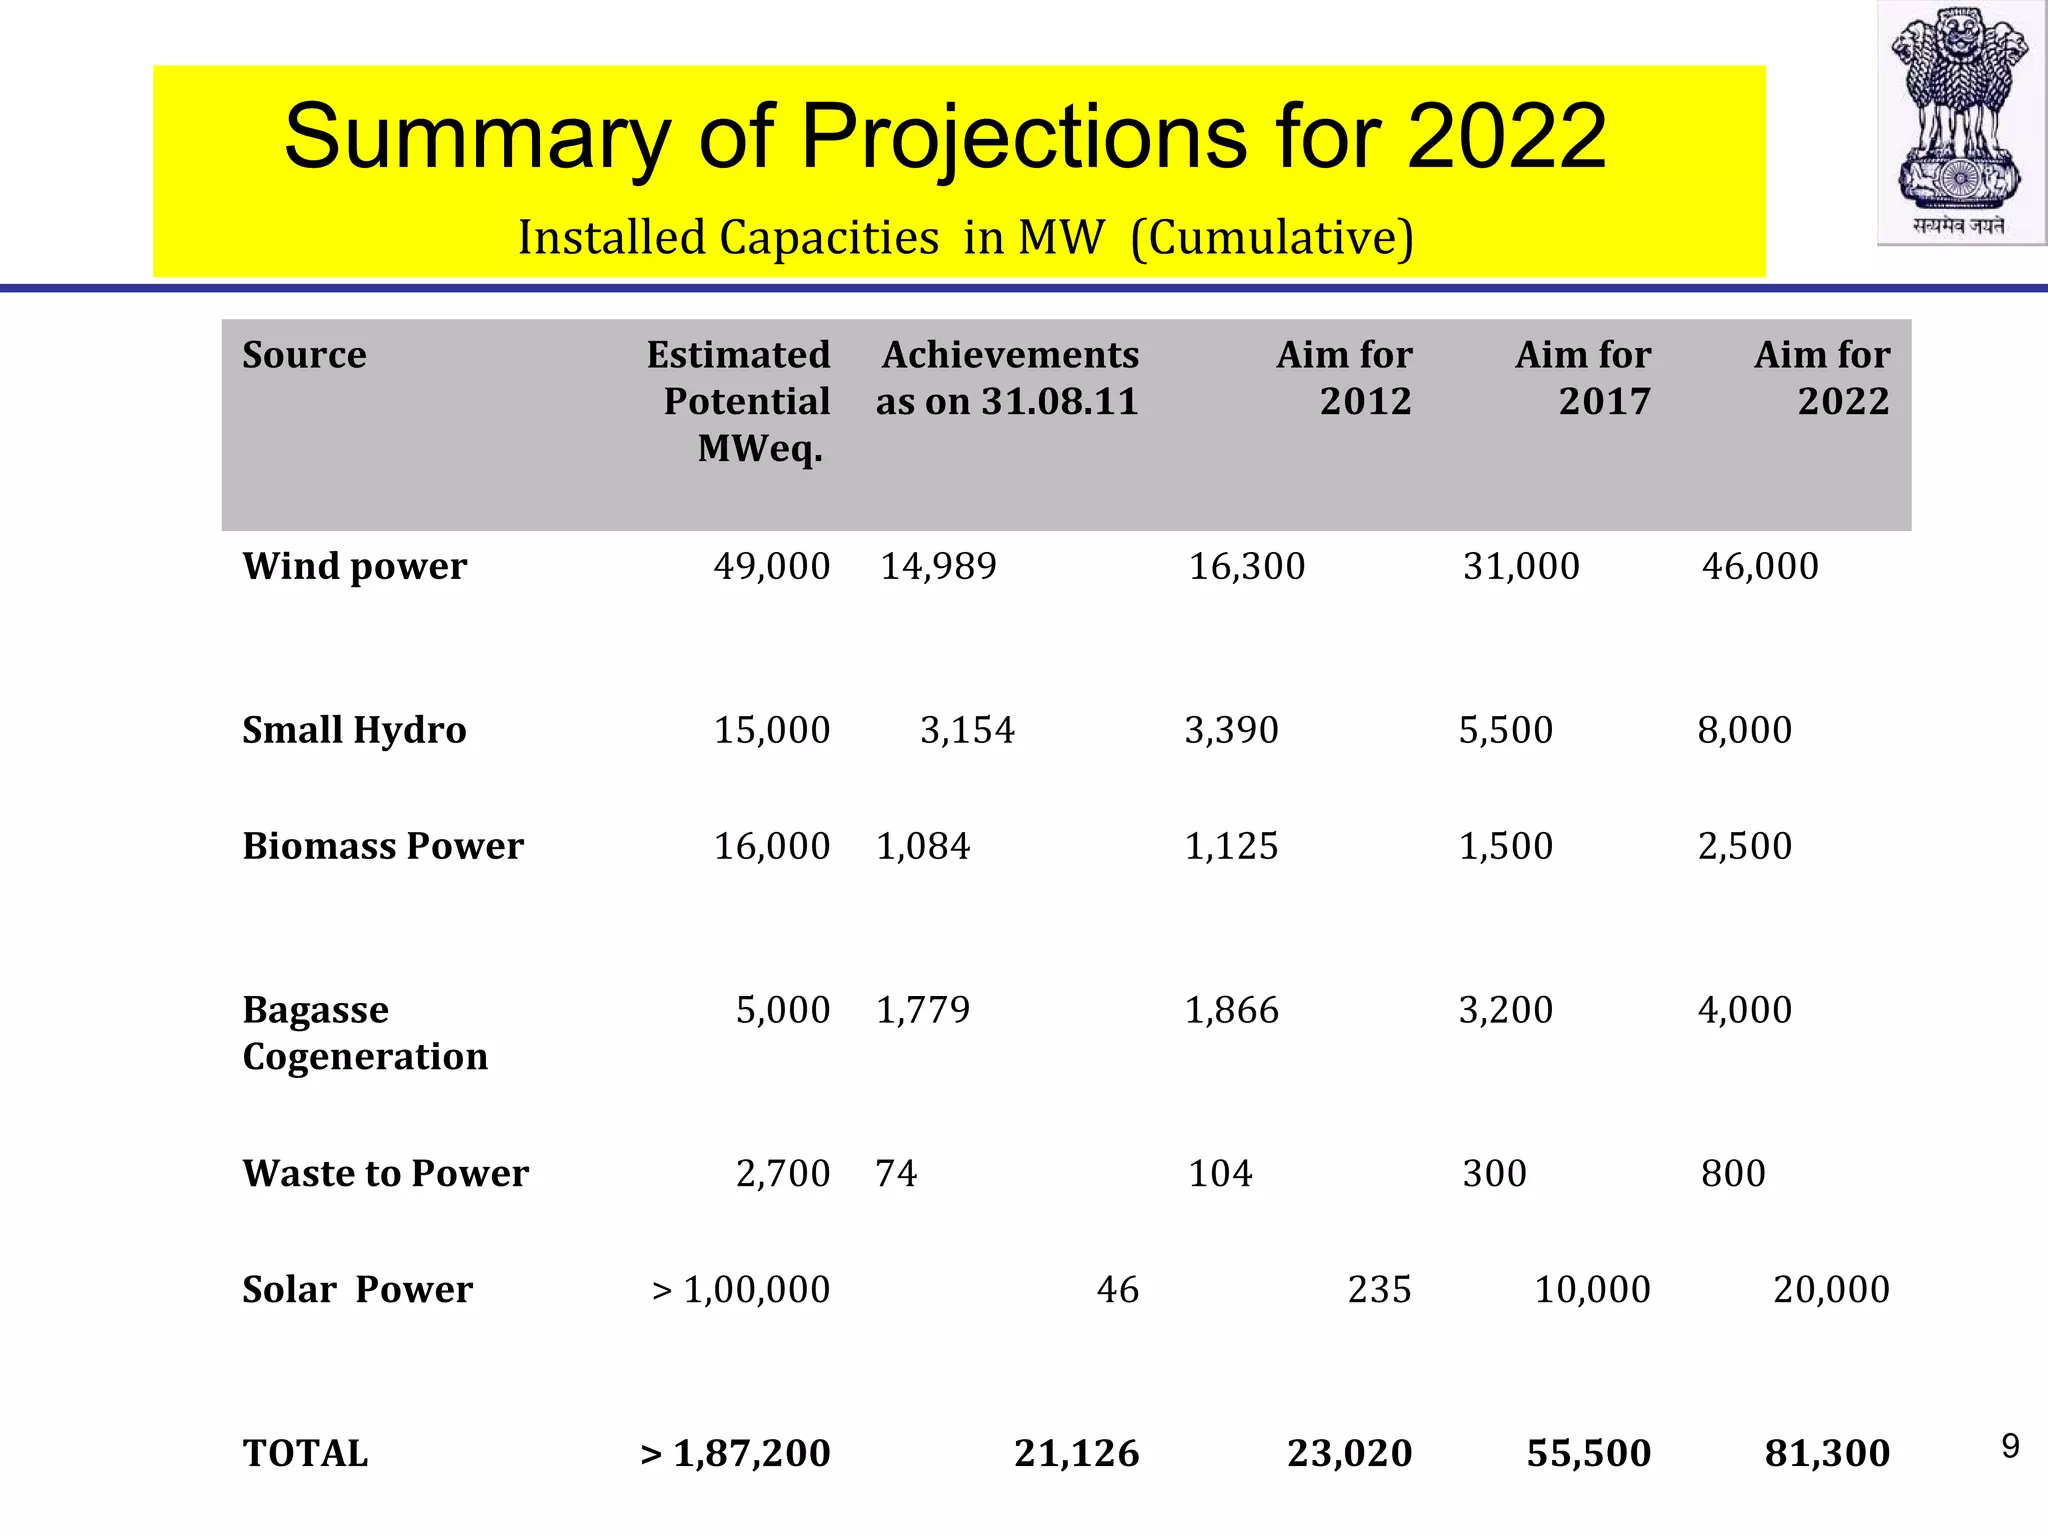
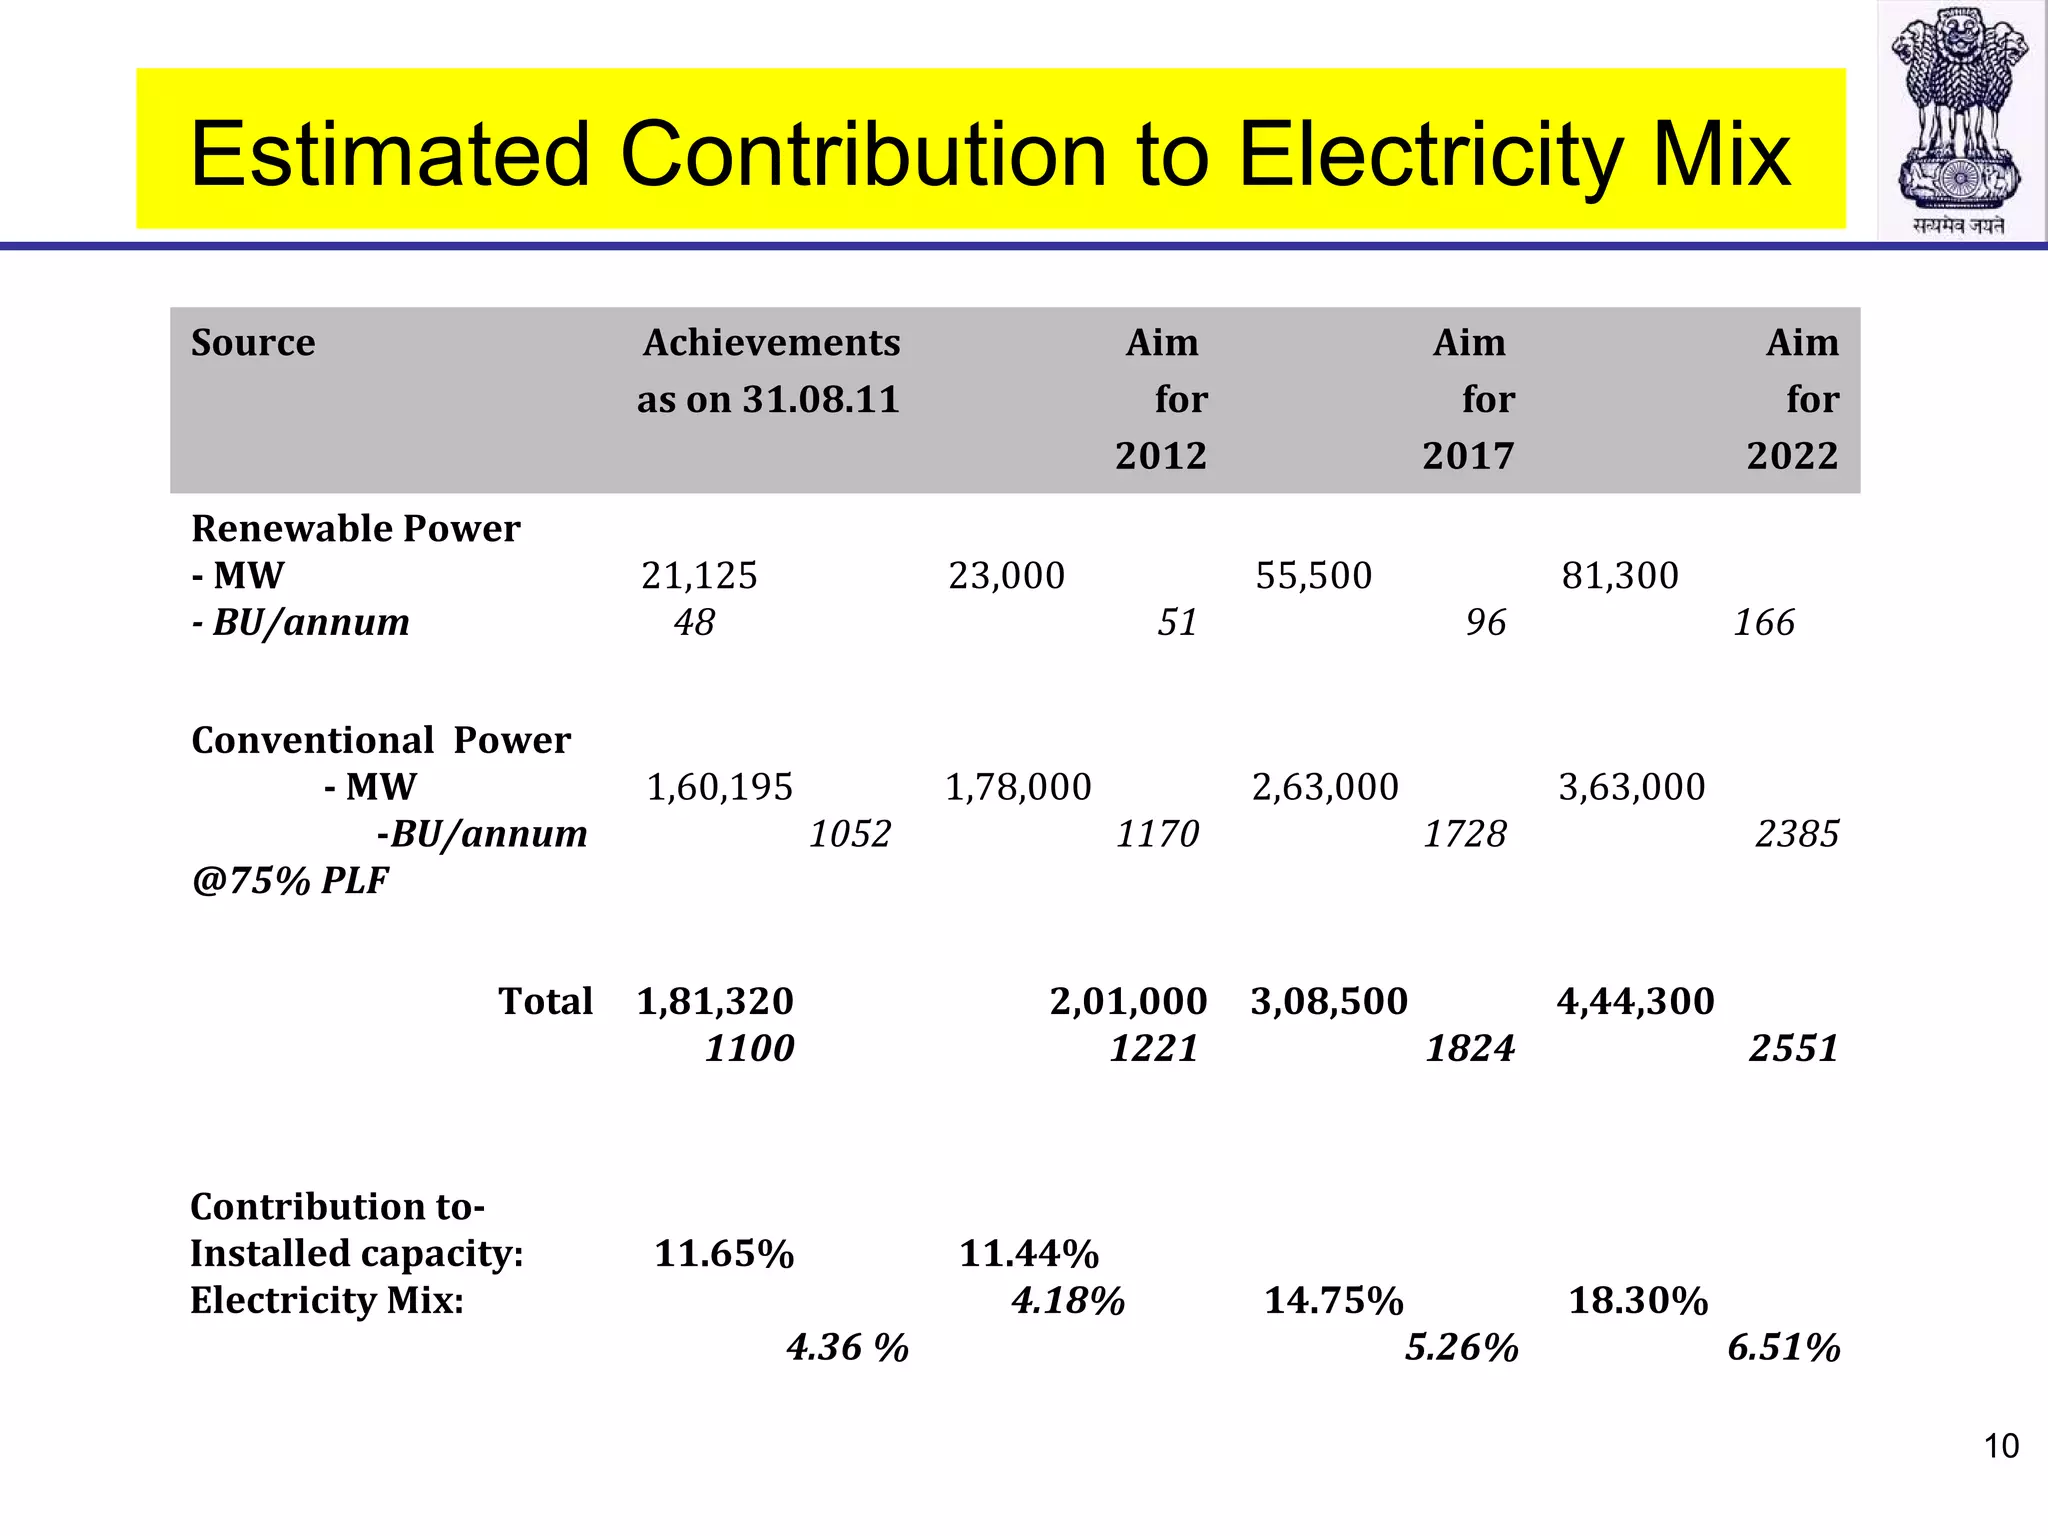
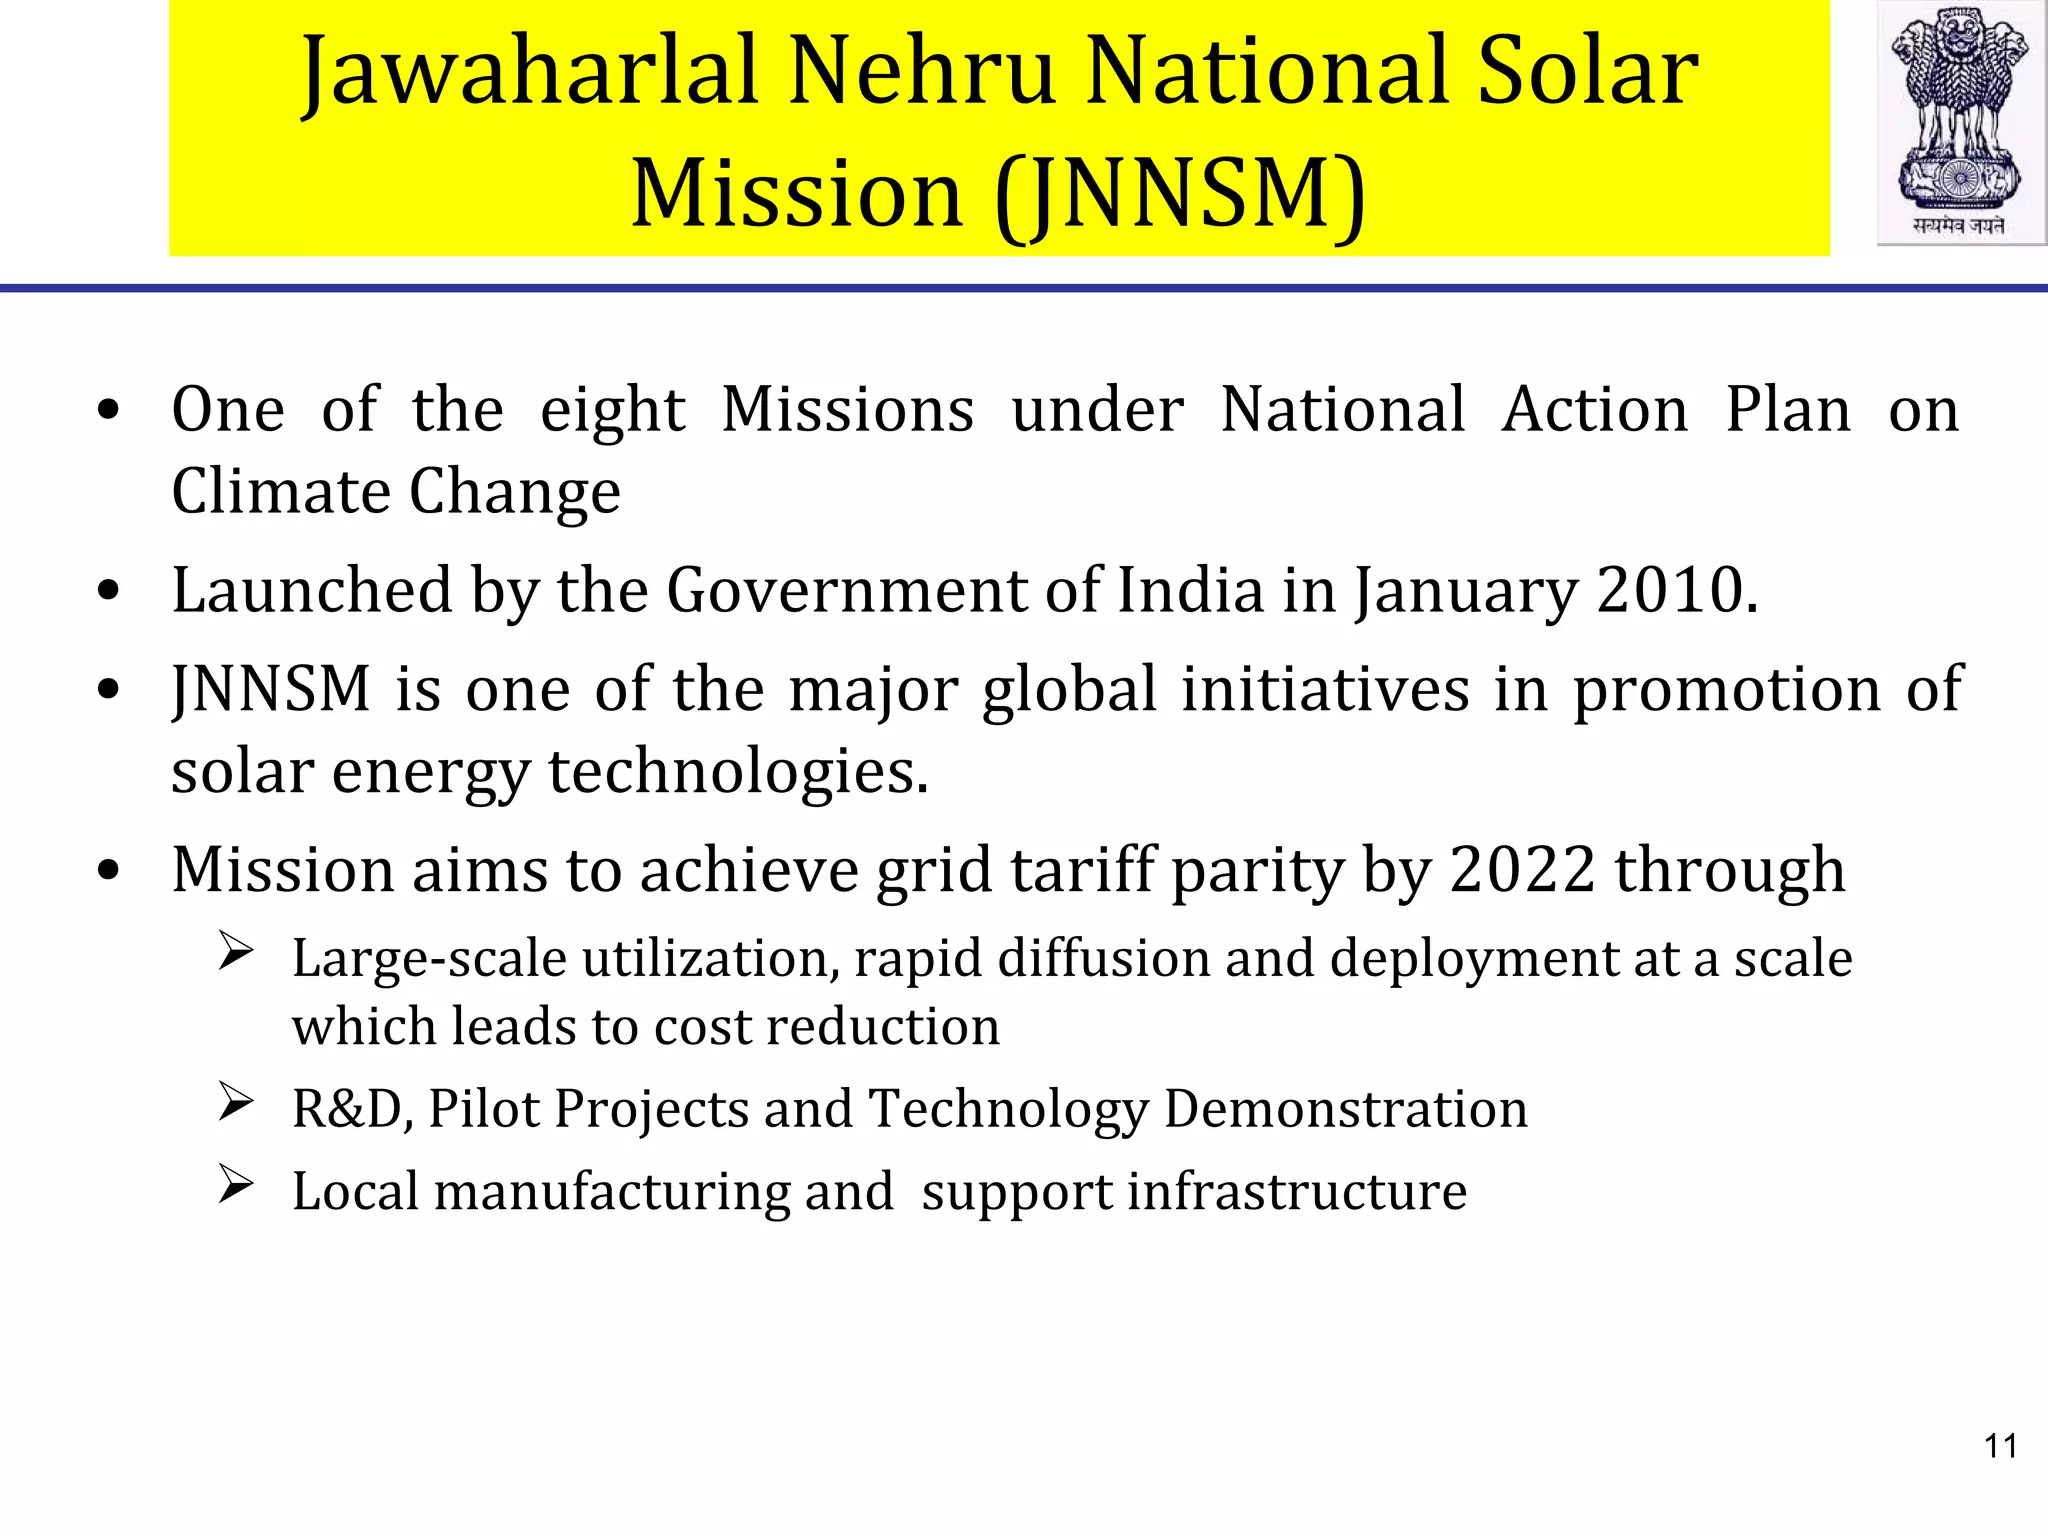
- India aims to significantly increase renewable energy capacity, especially solar, by 2022 to address energy security and climate change issues.
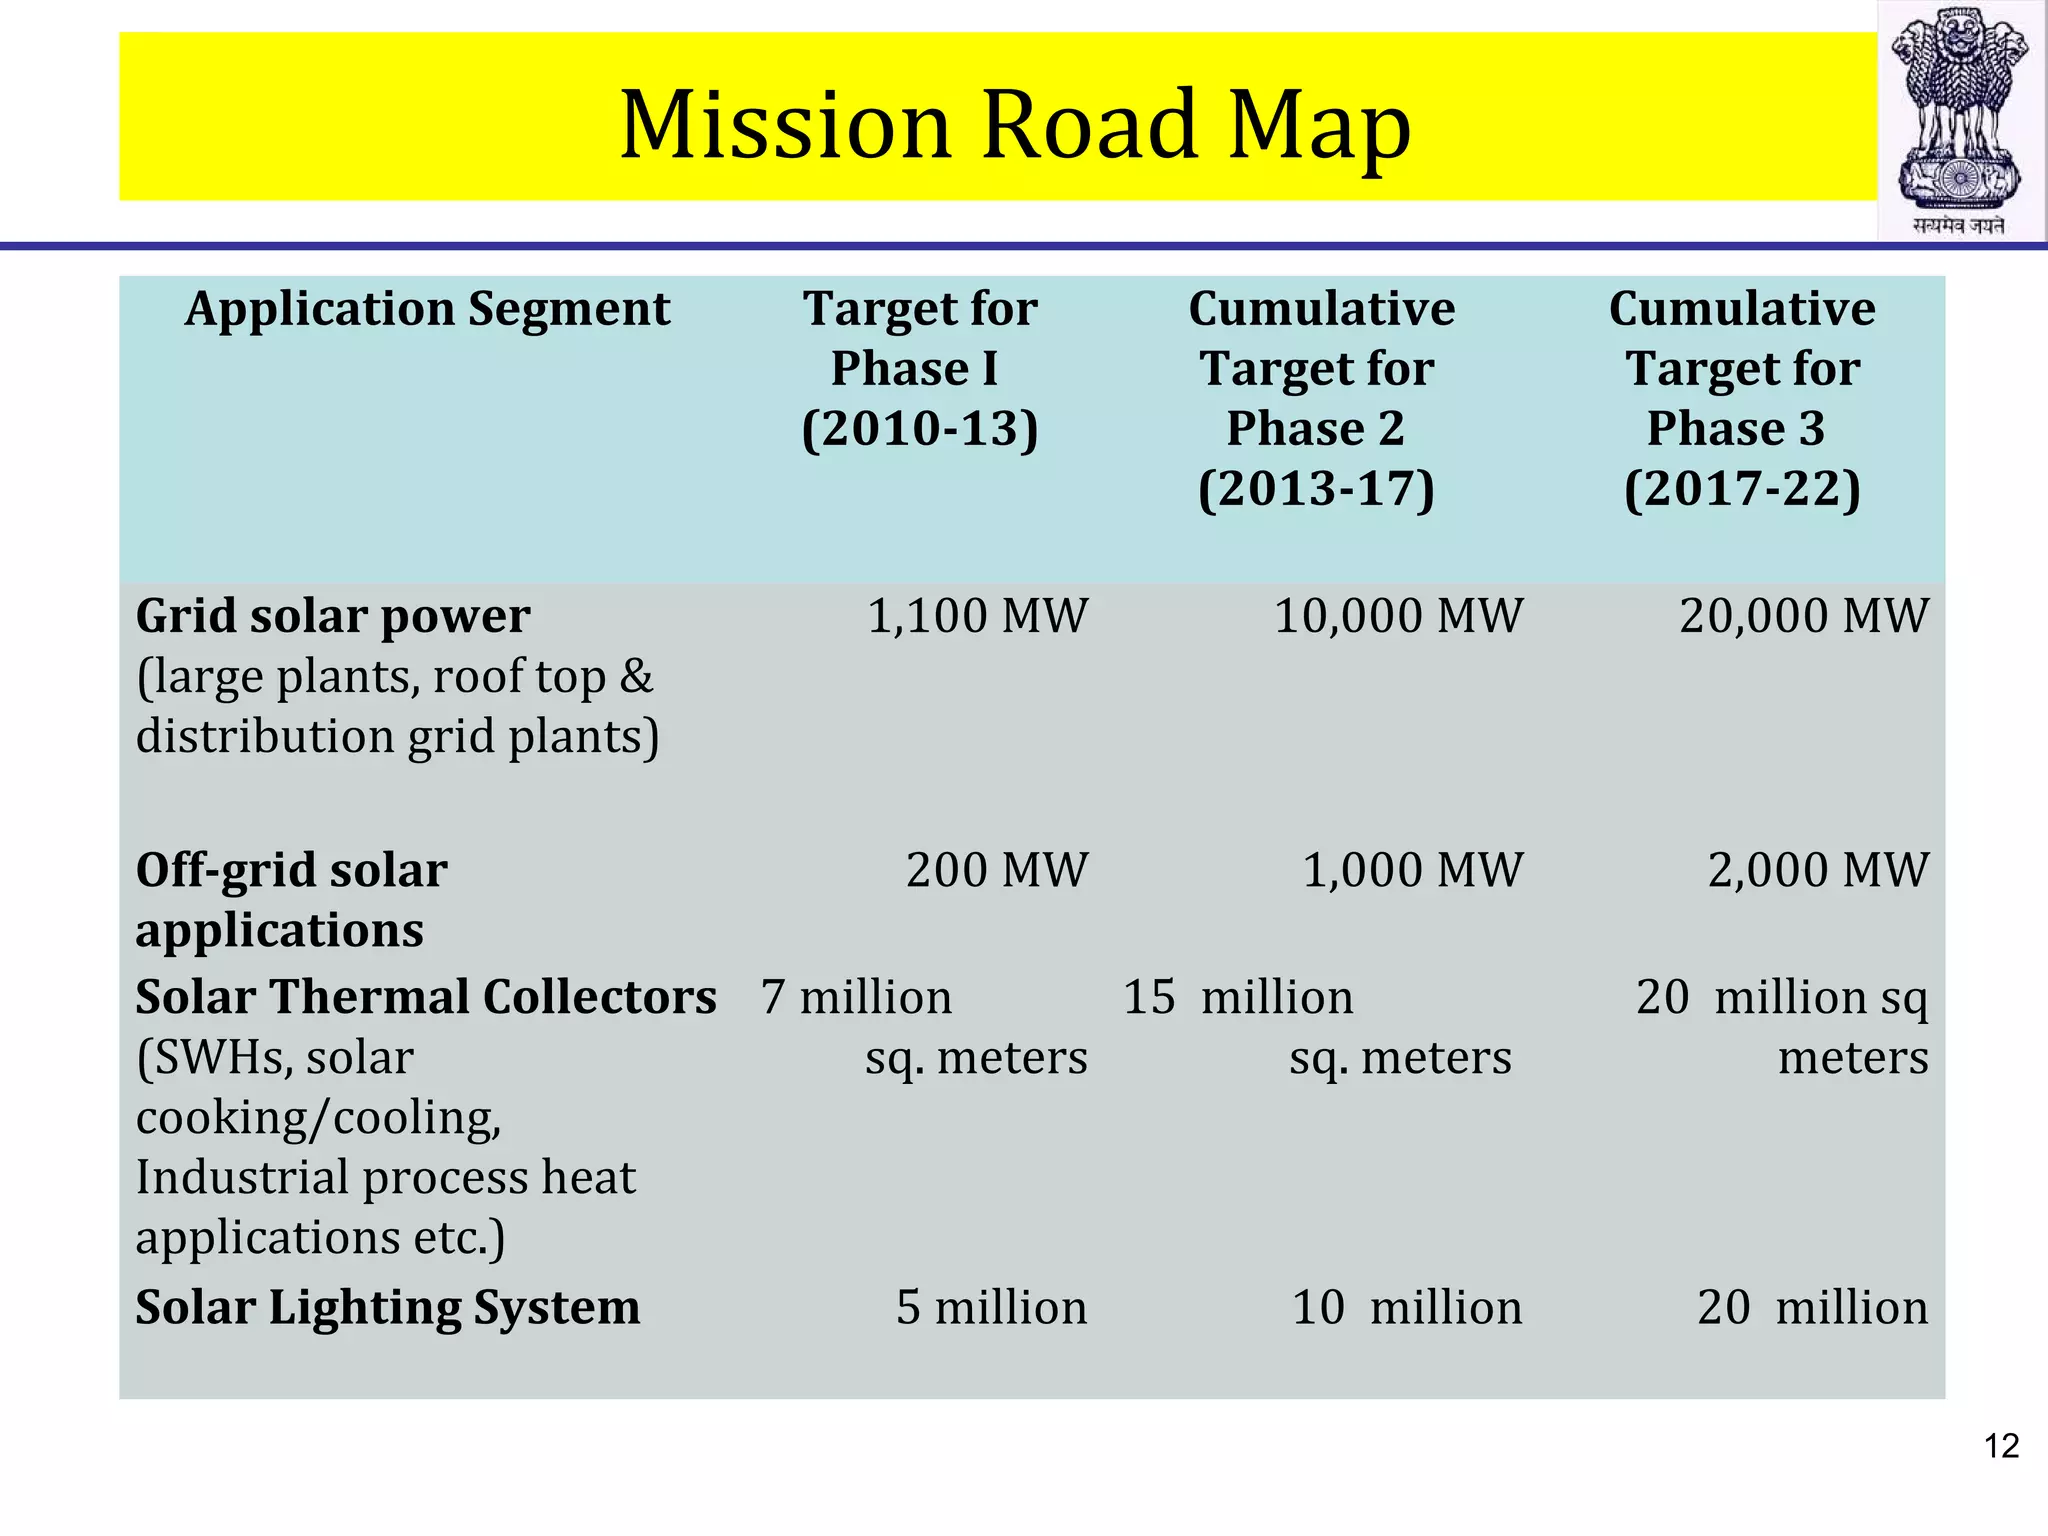
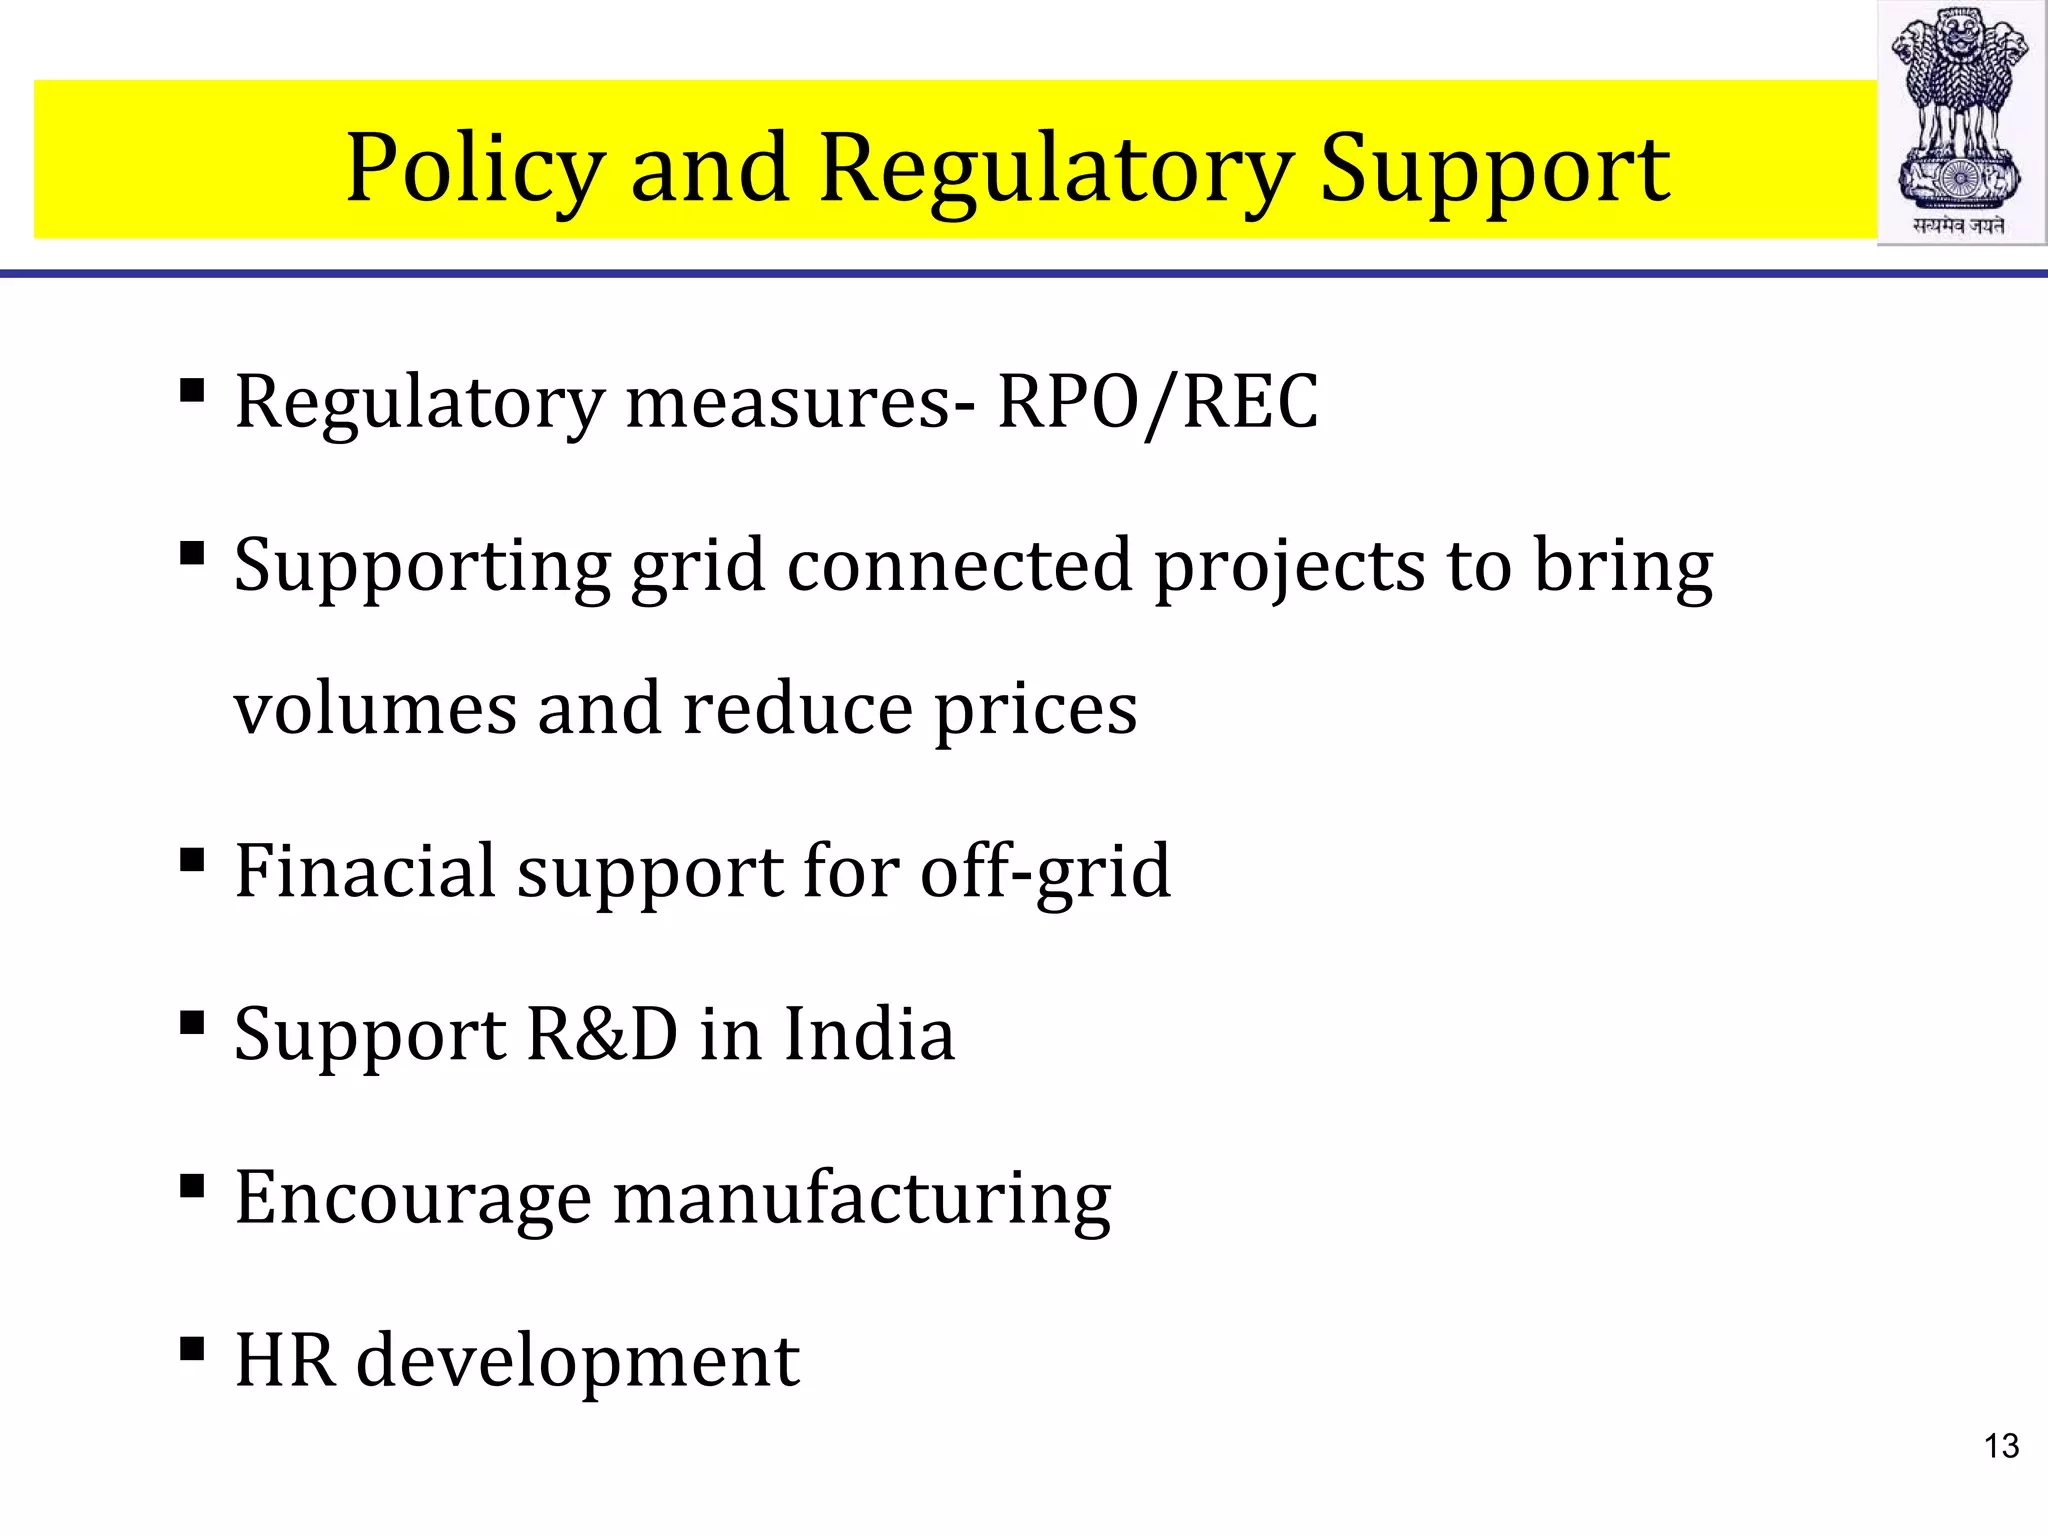
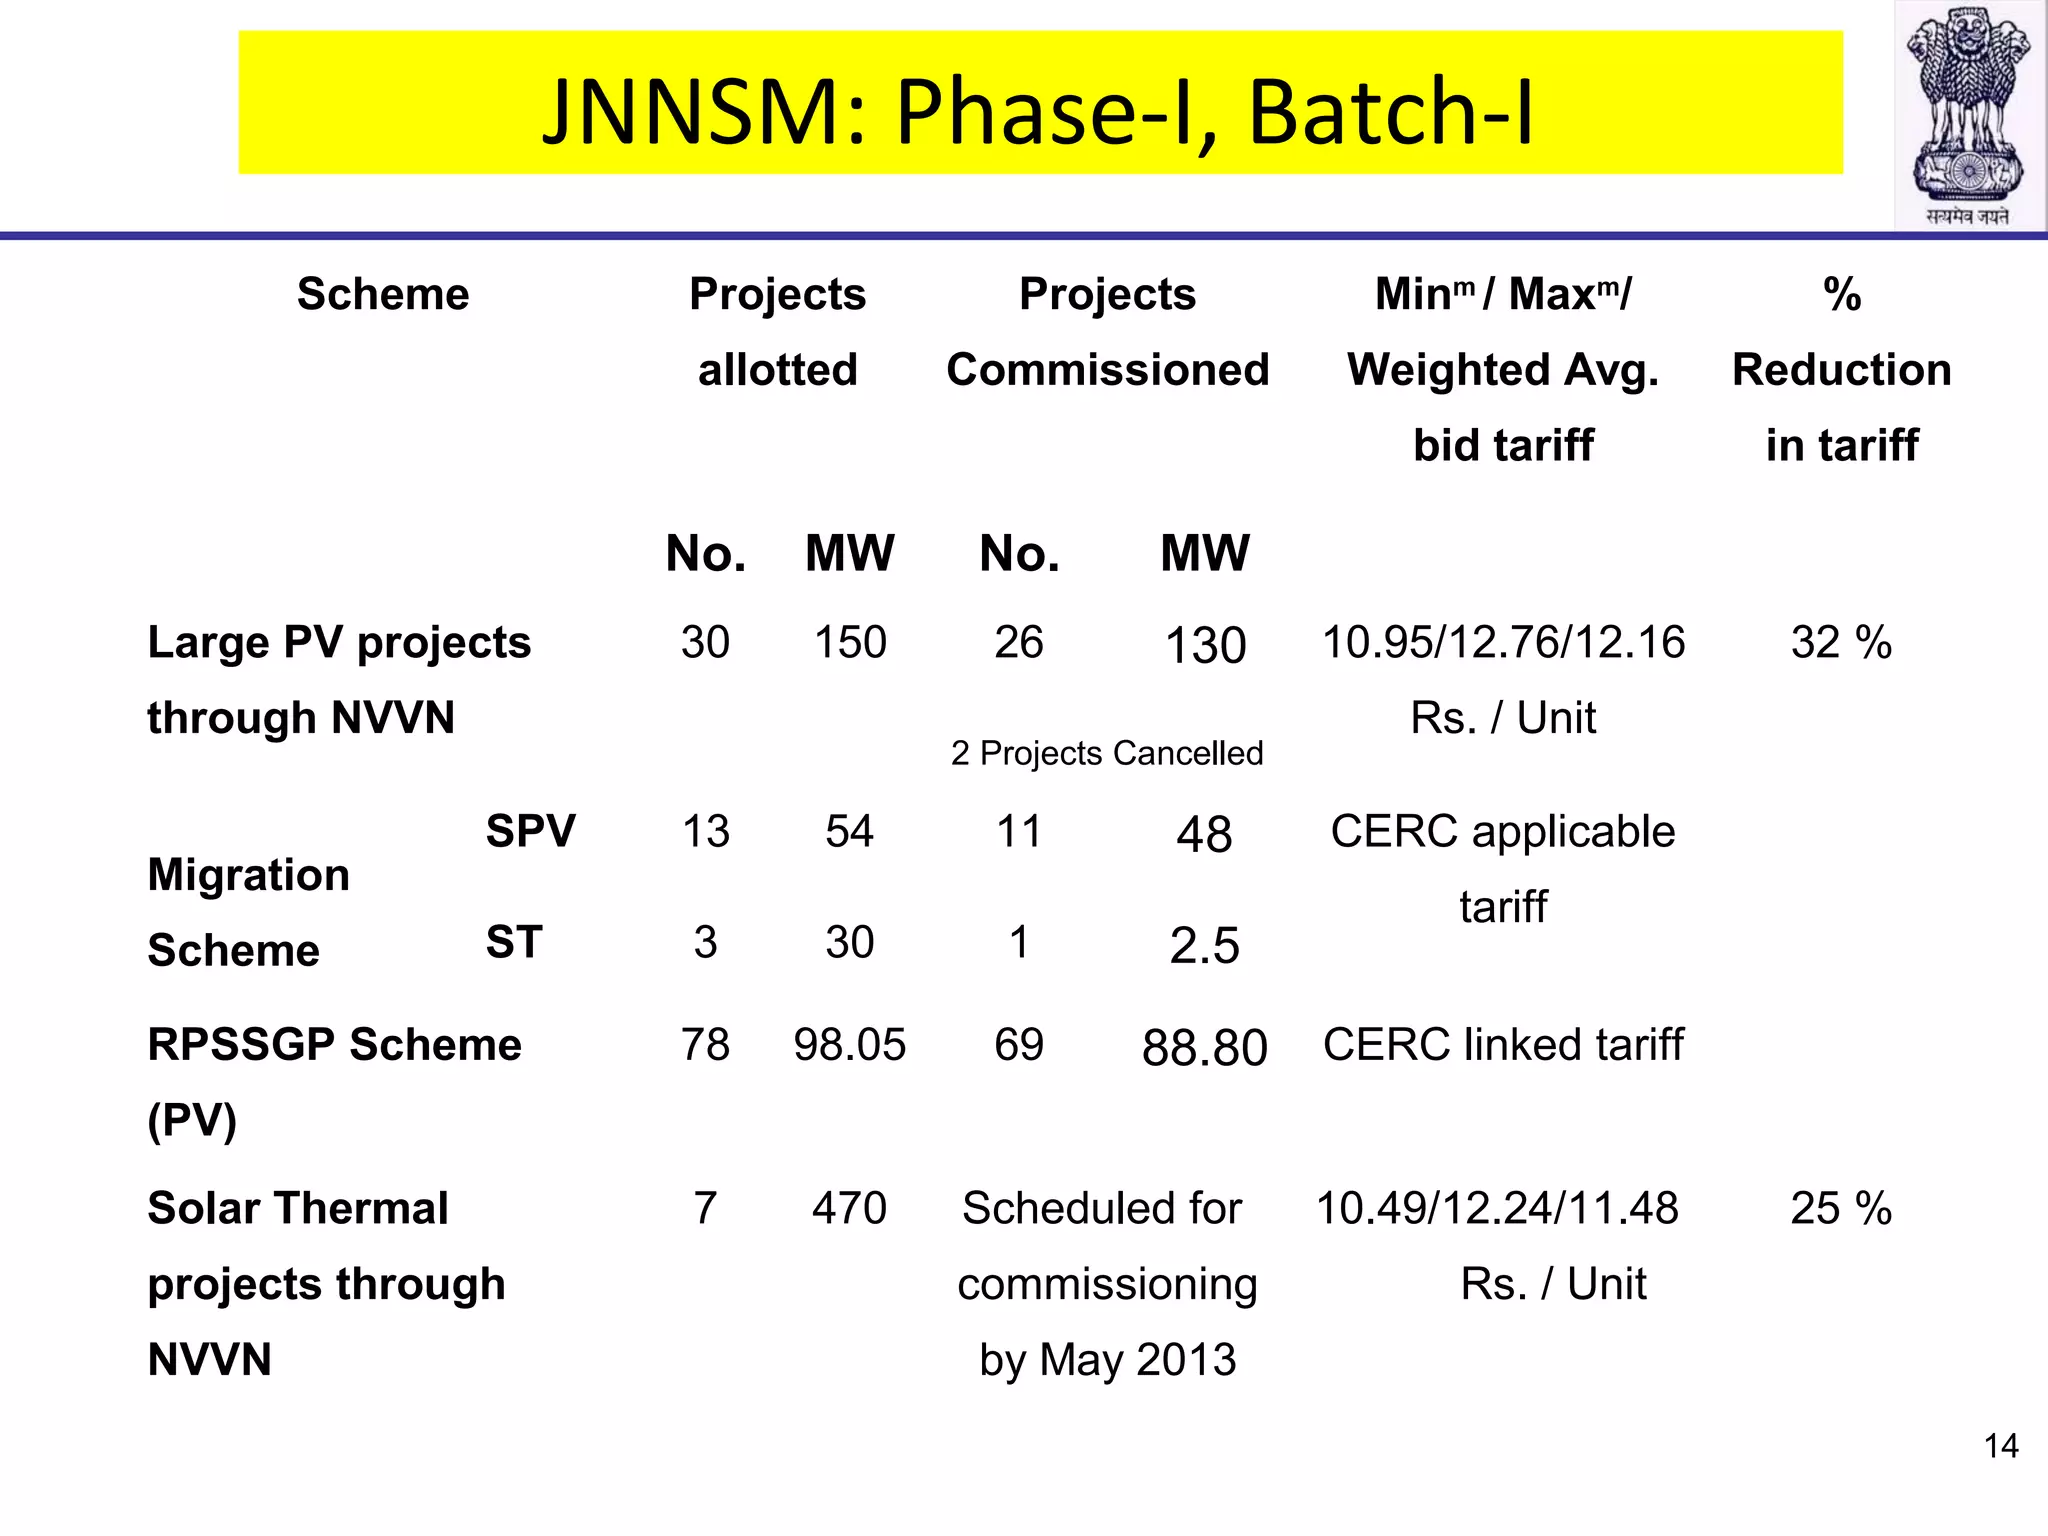
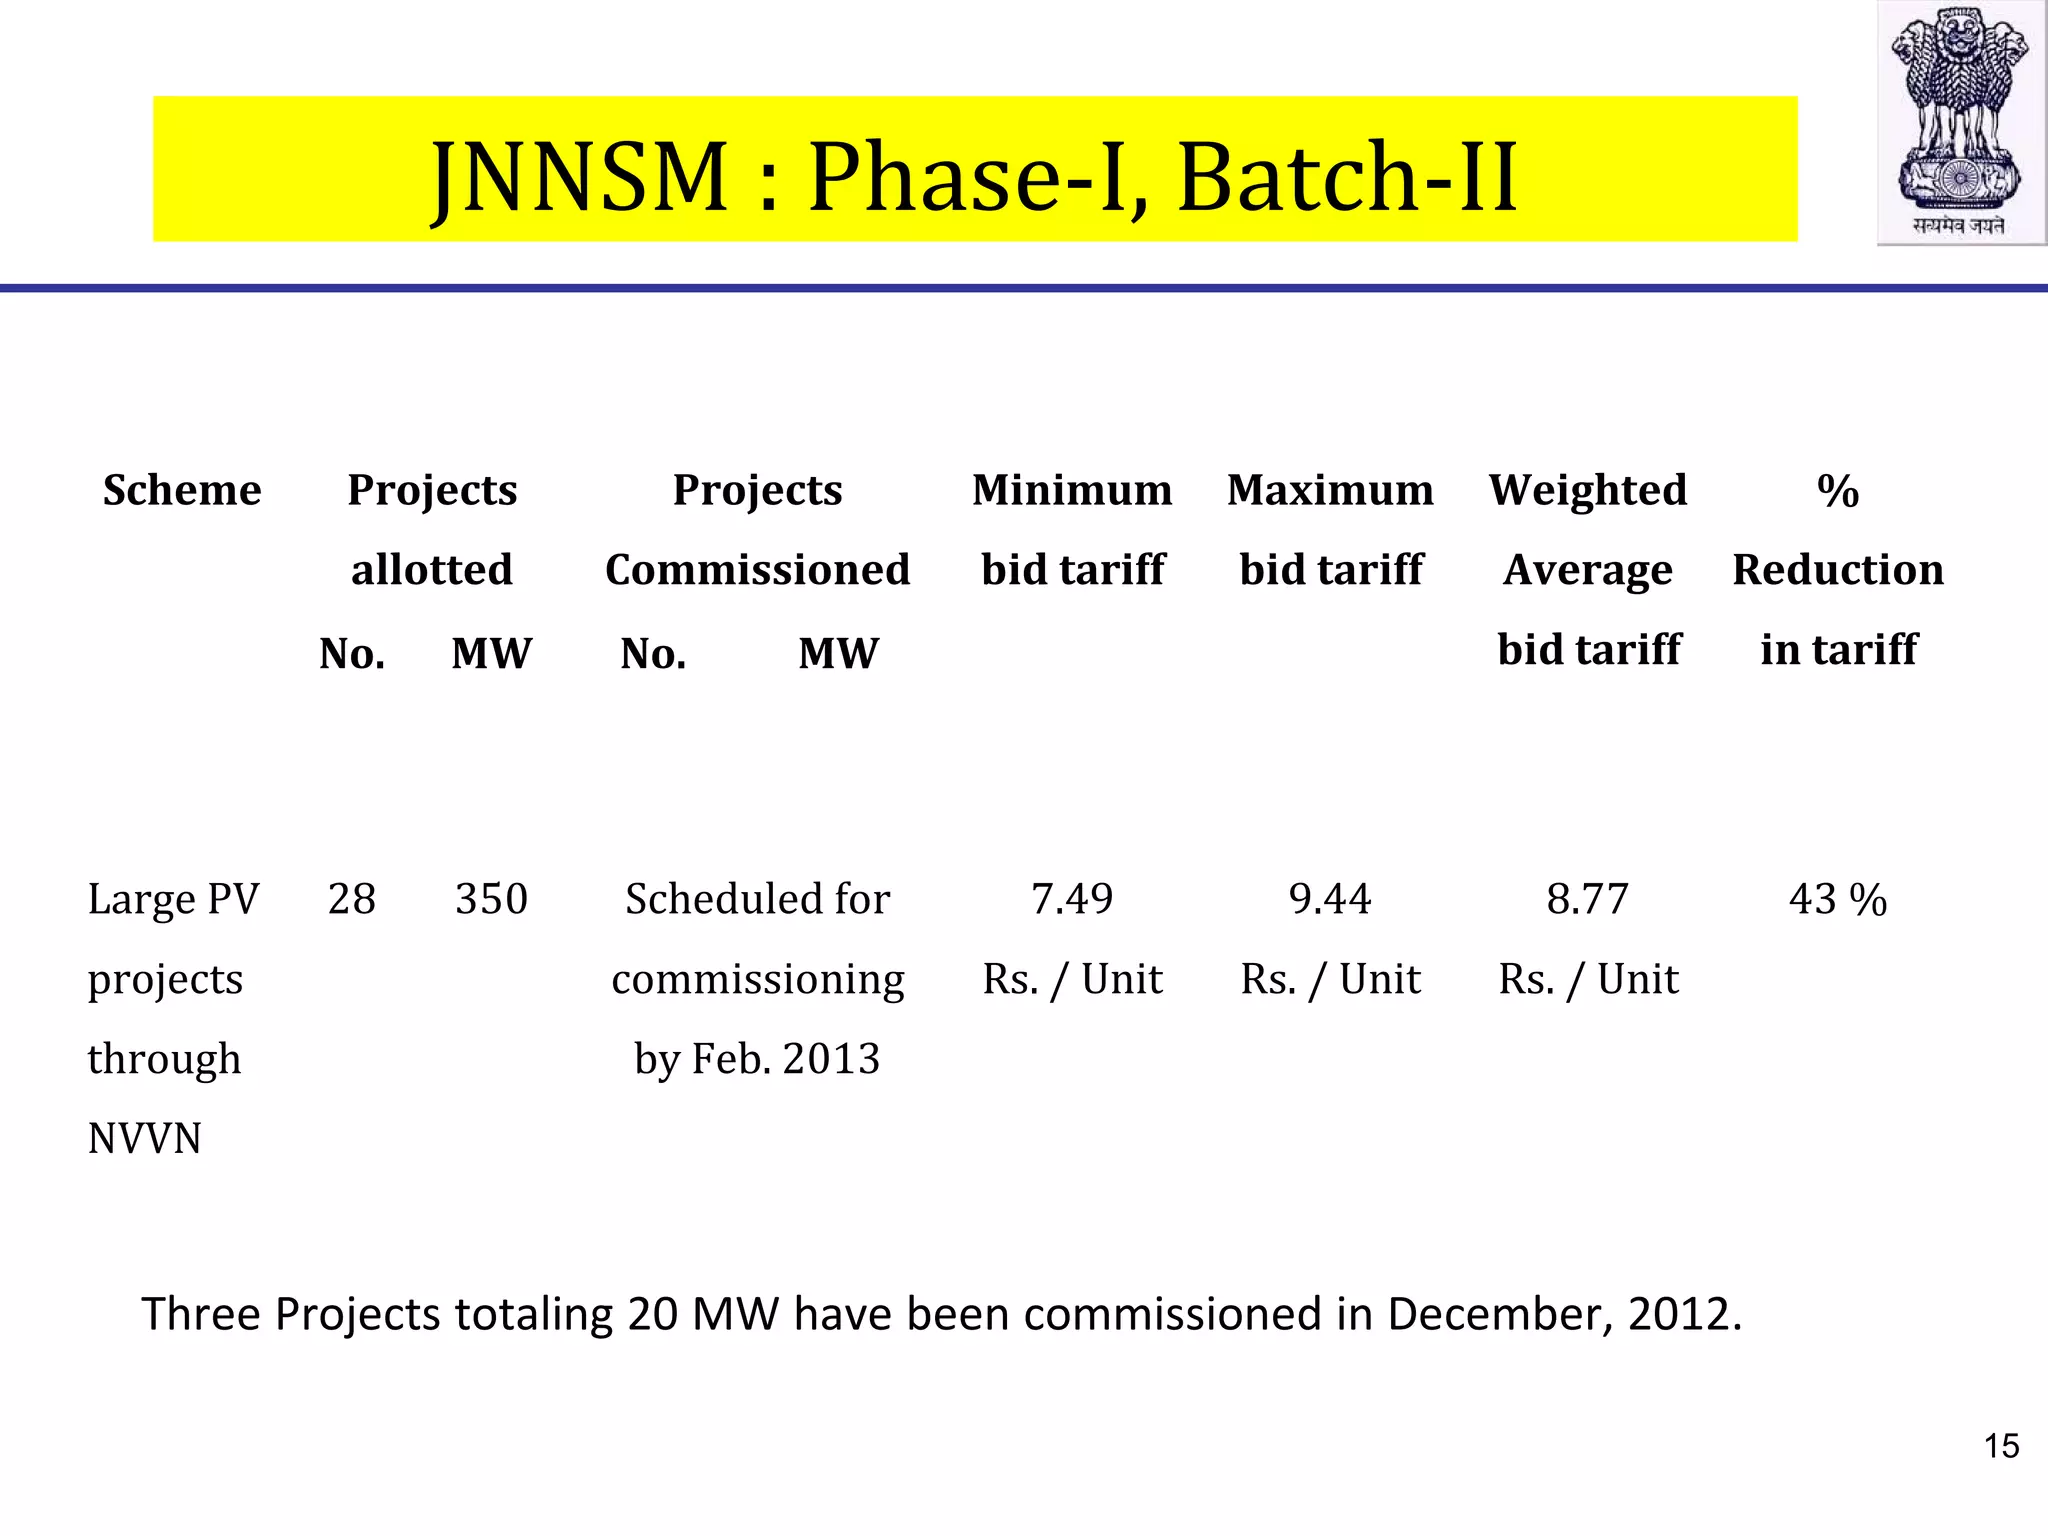
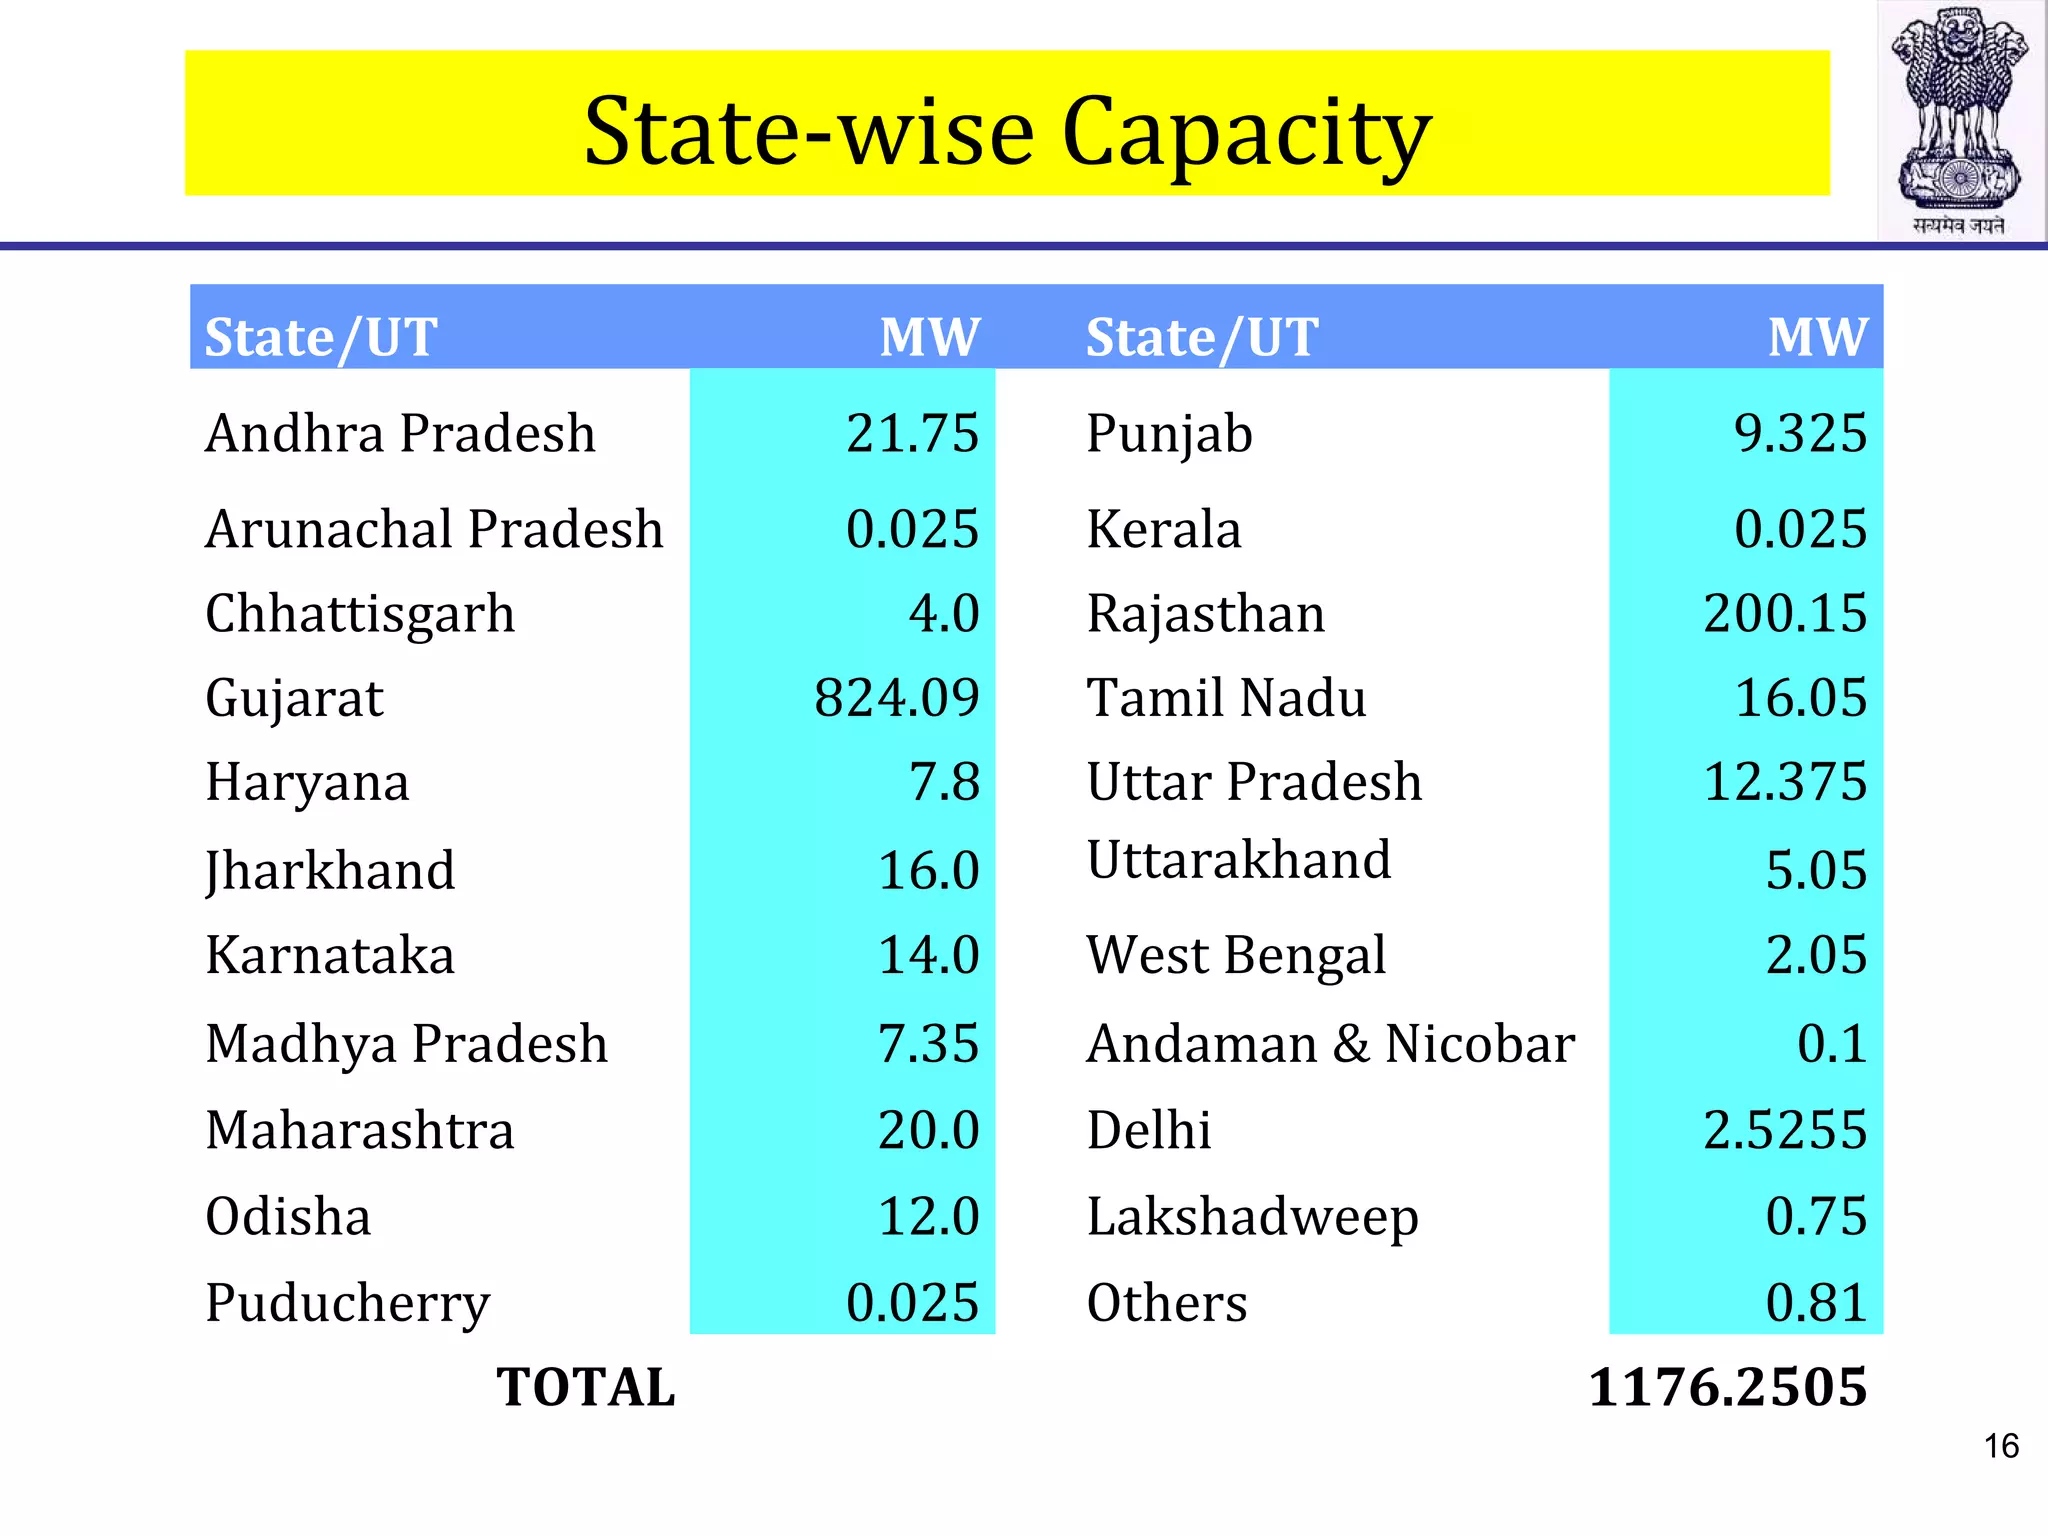
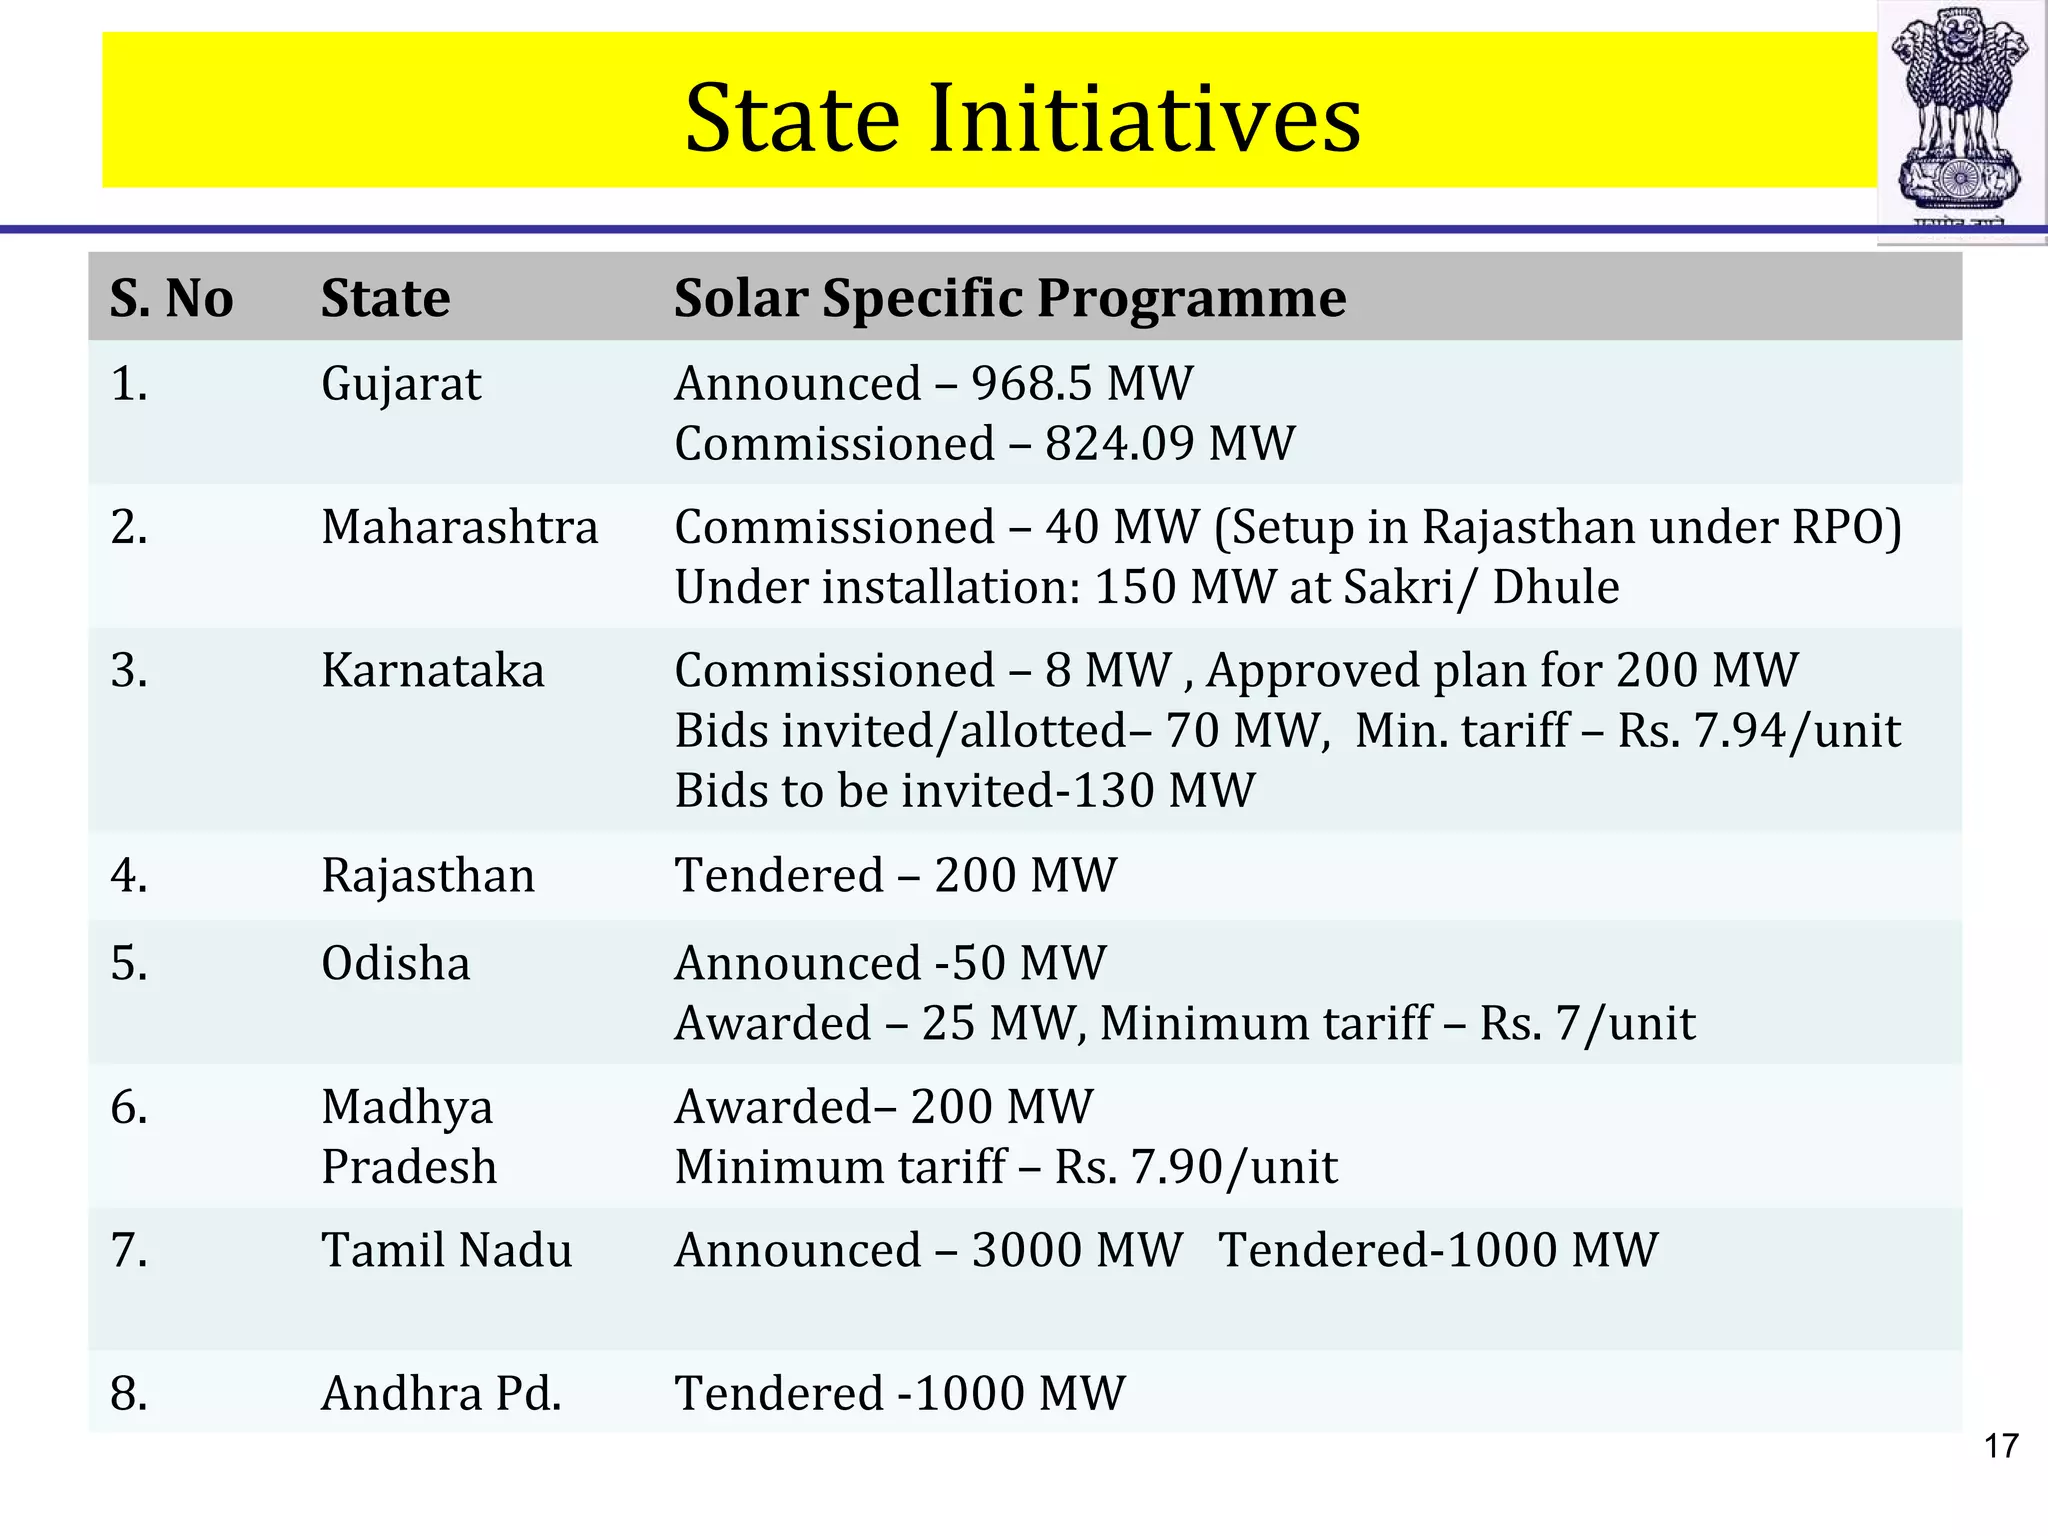
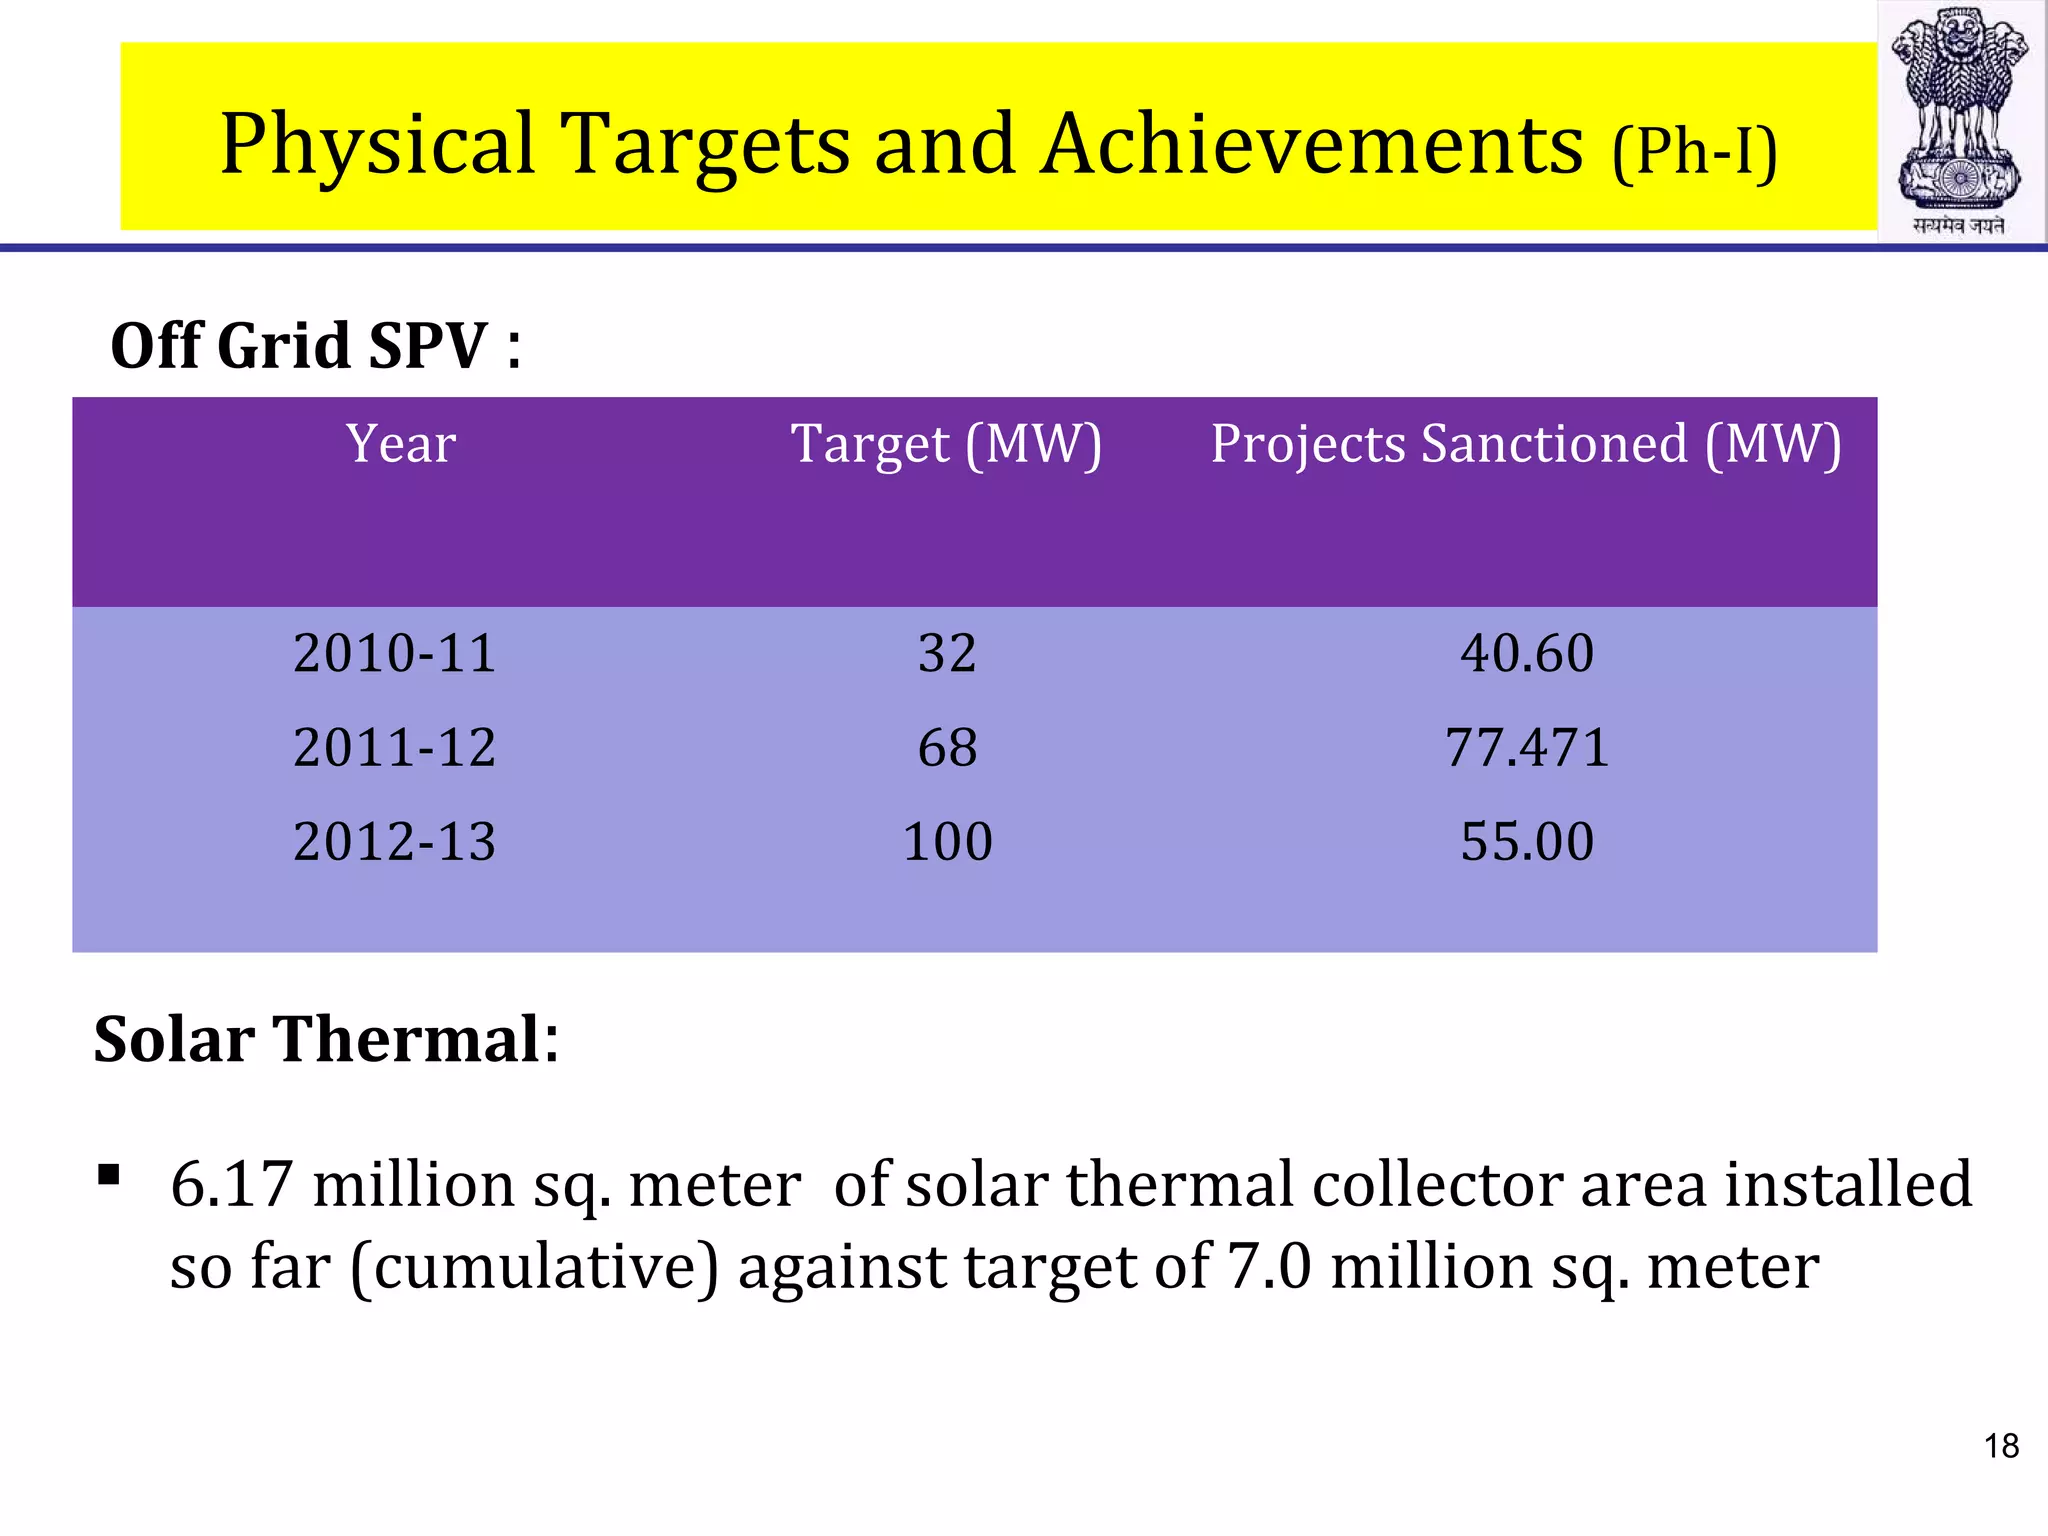
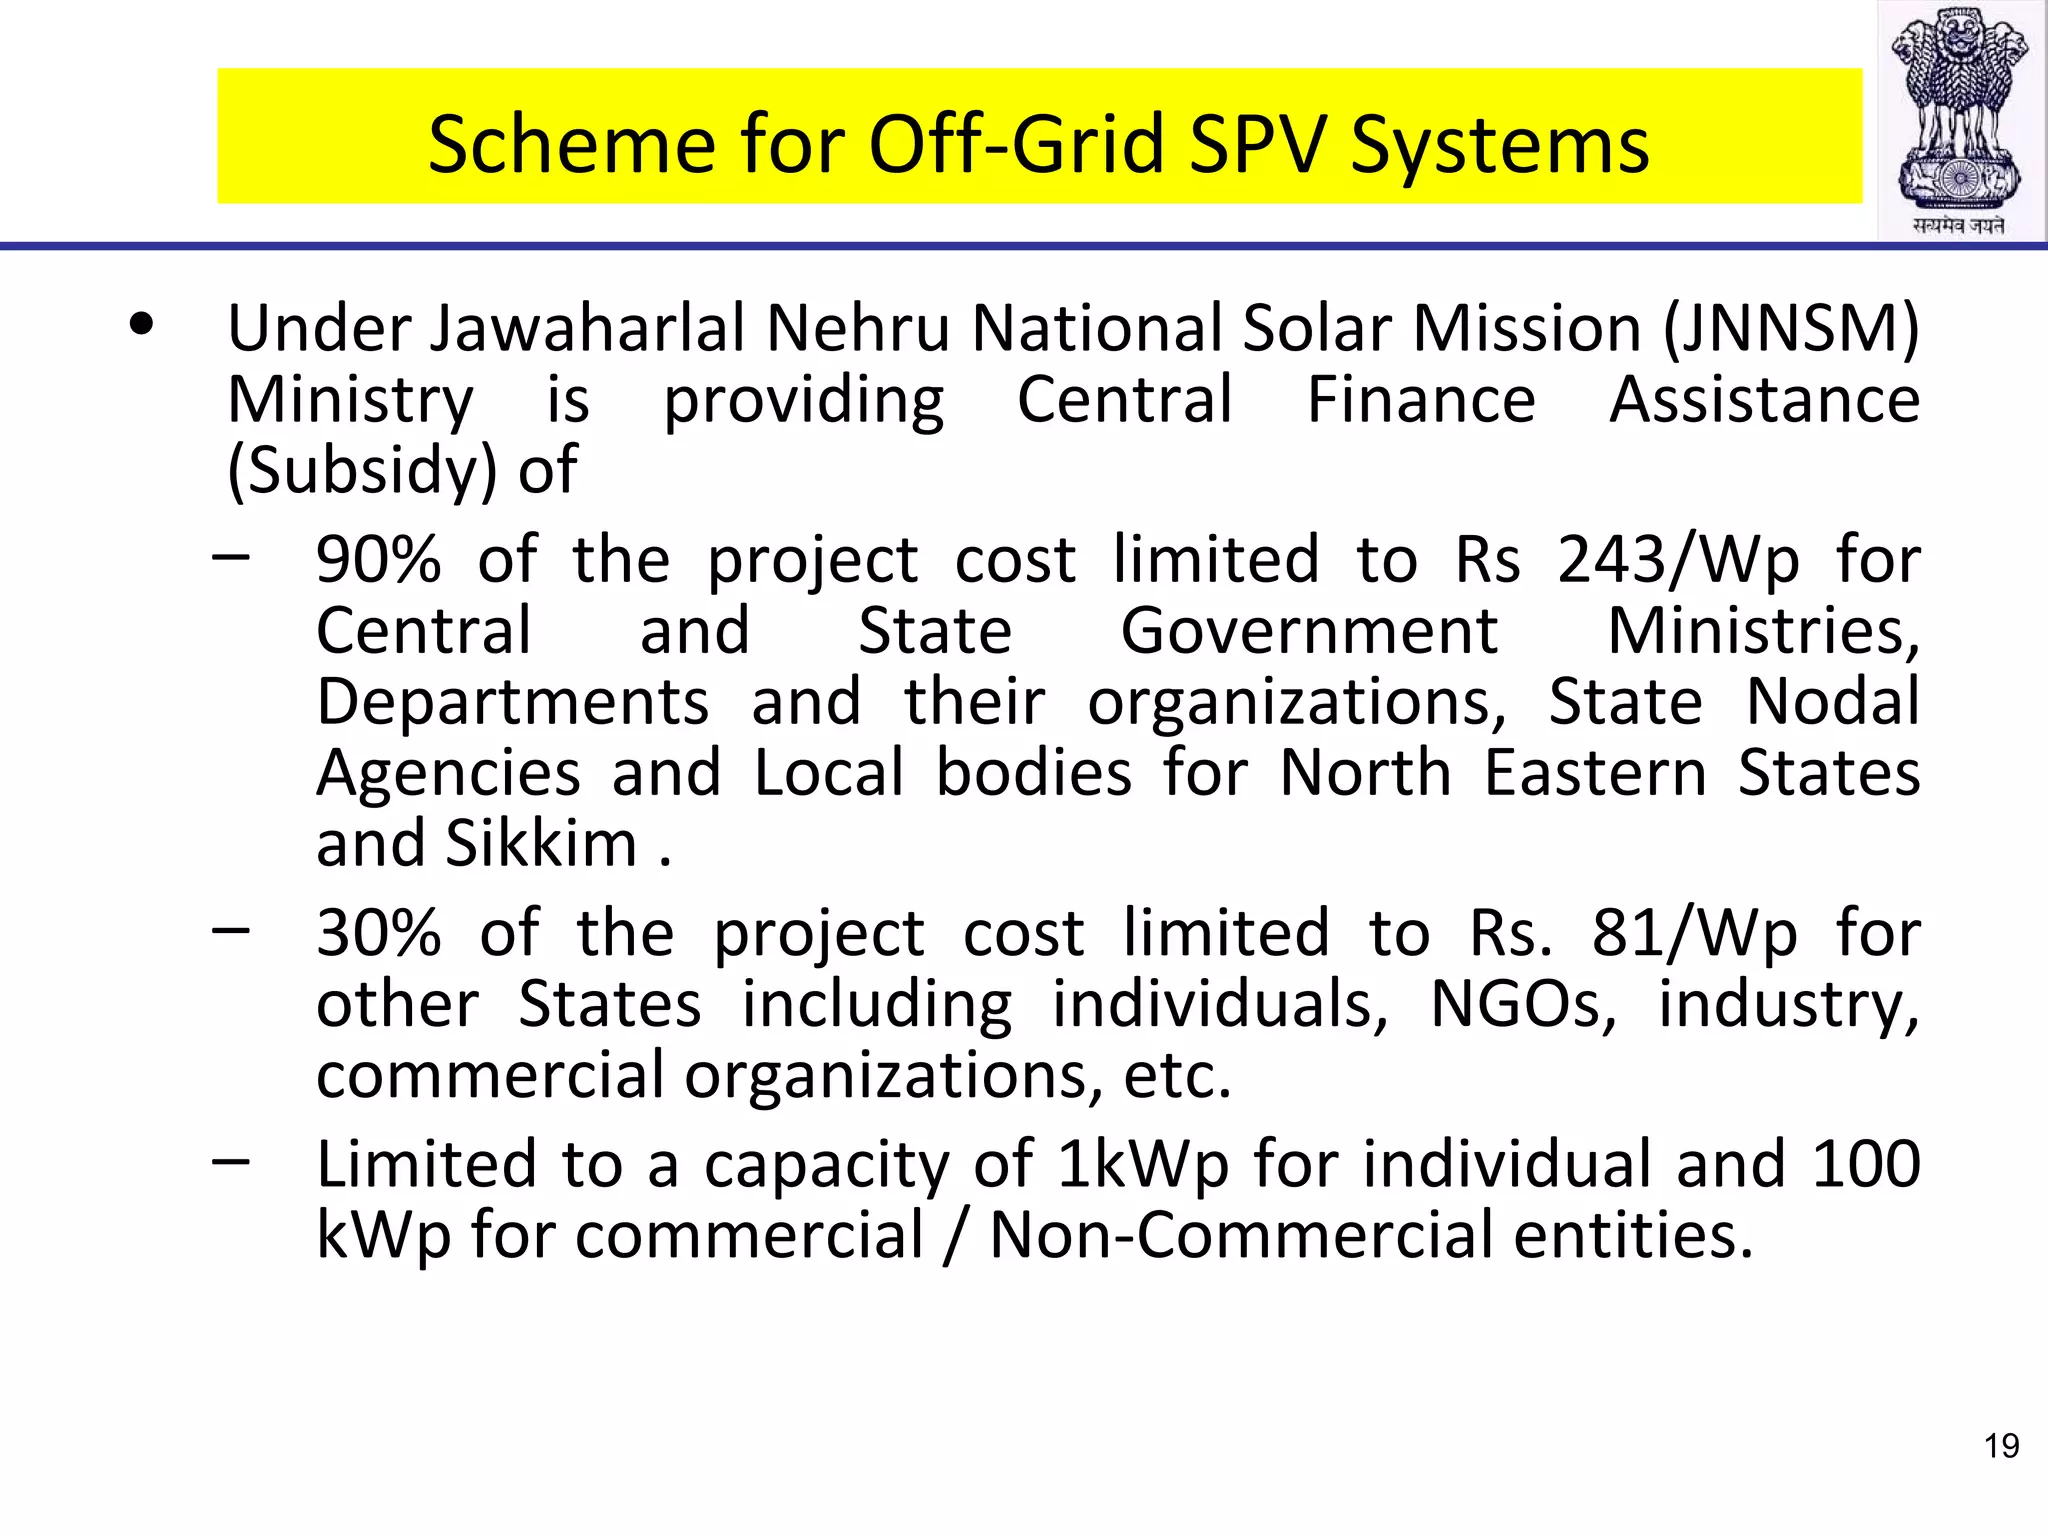
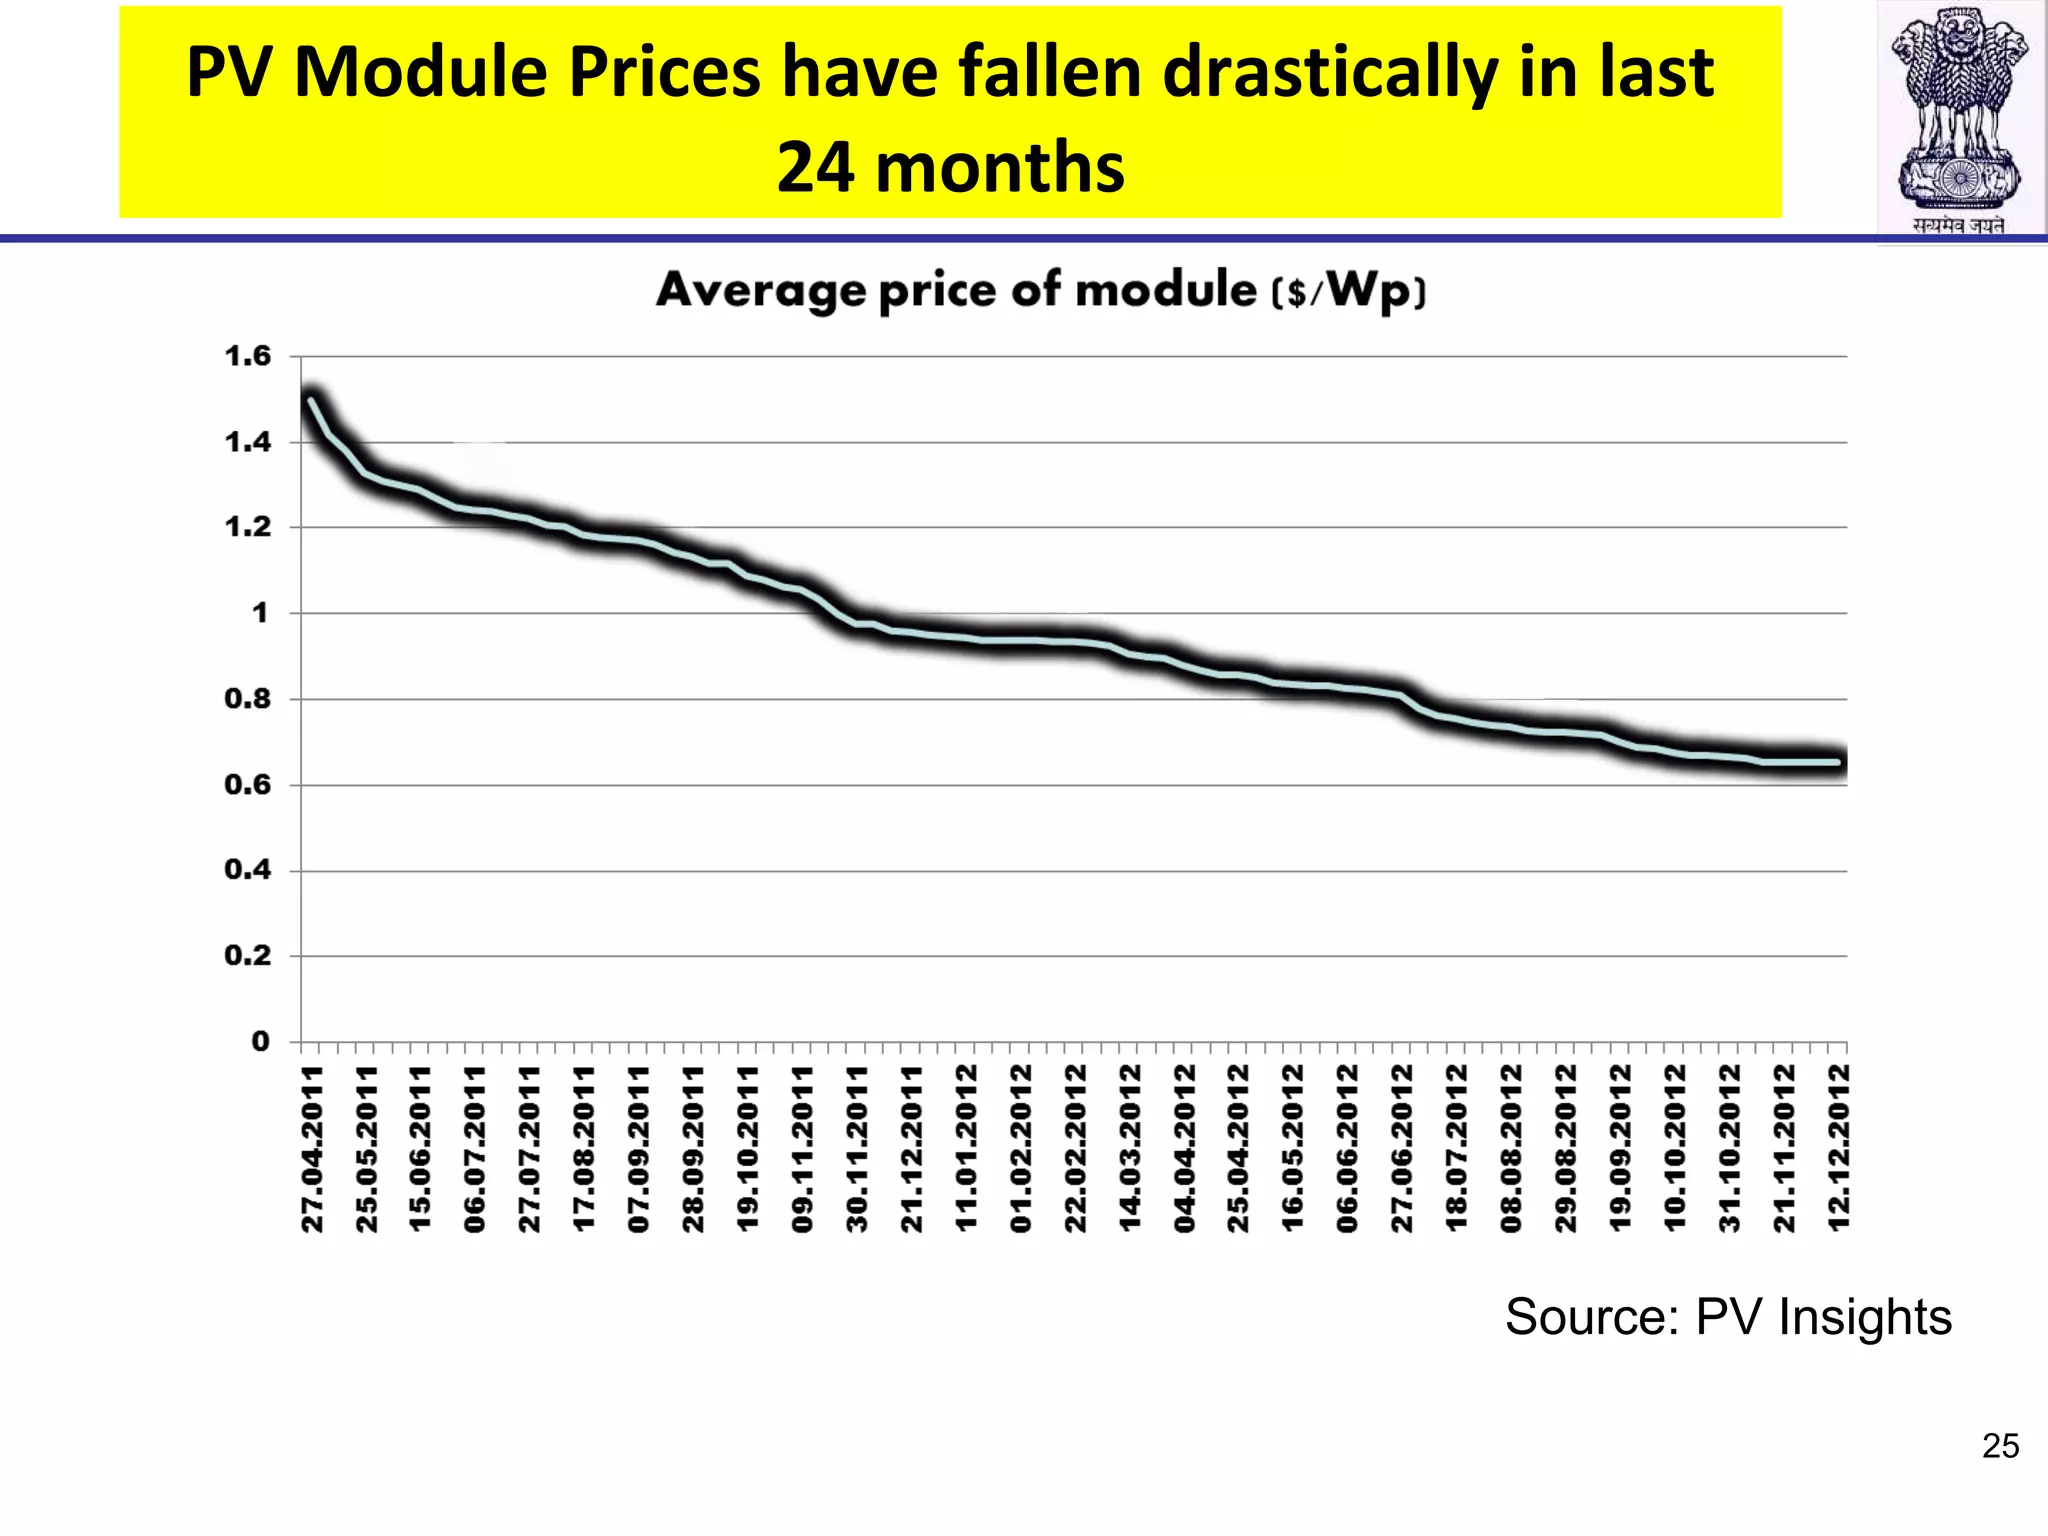
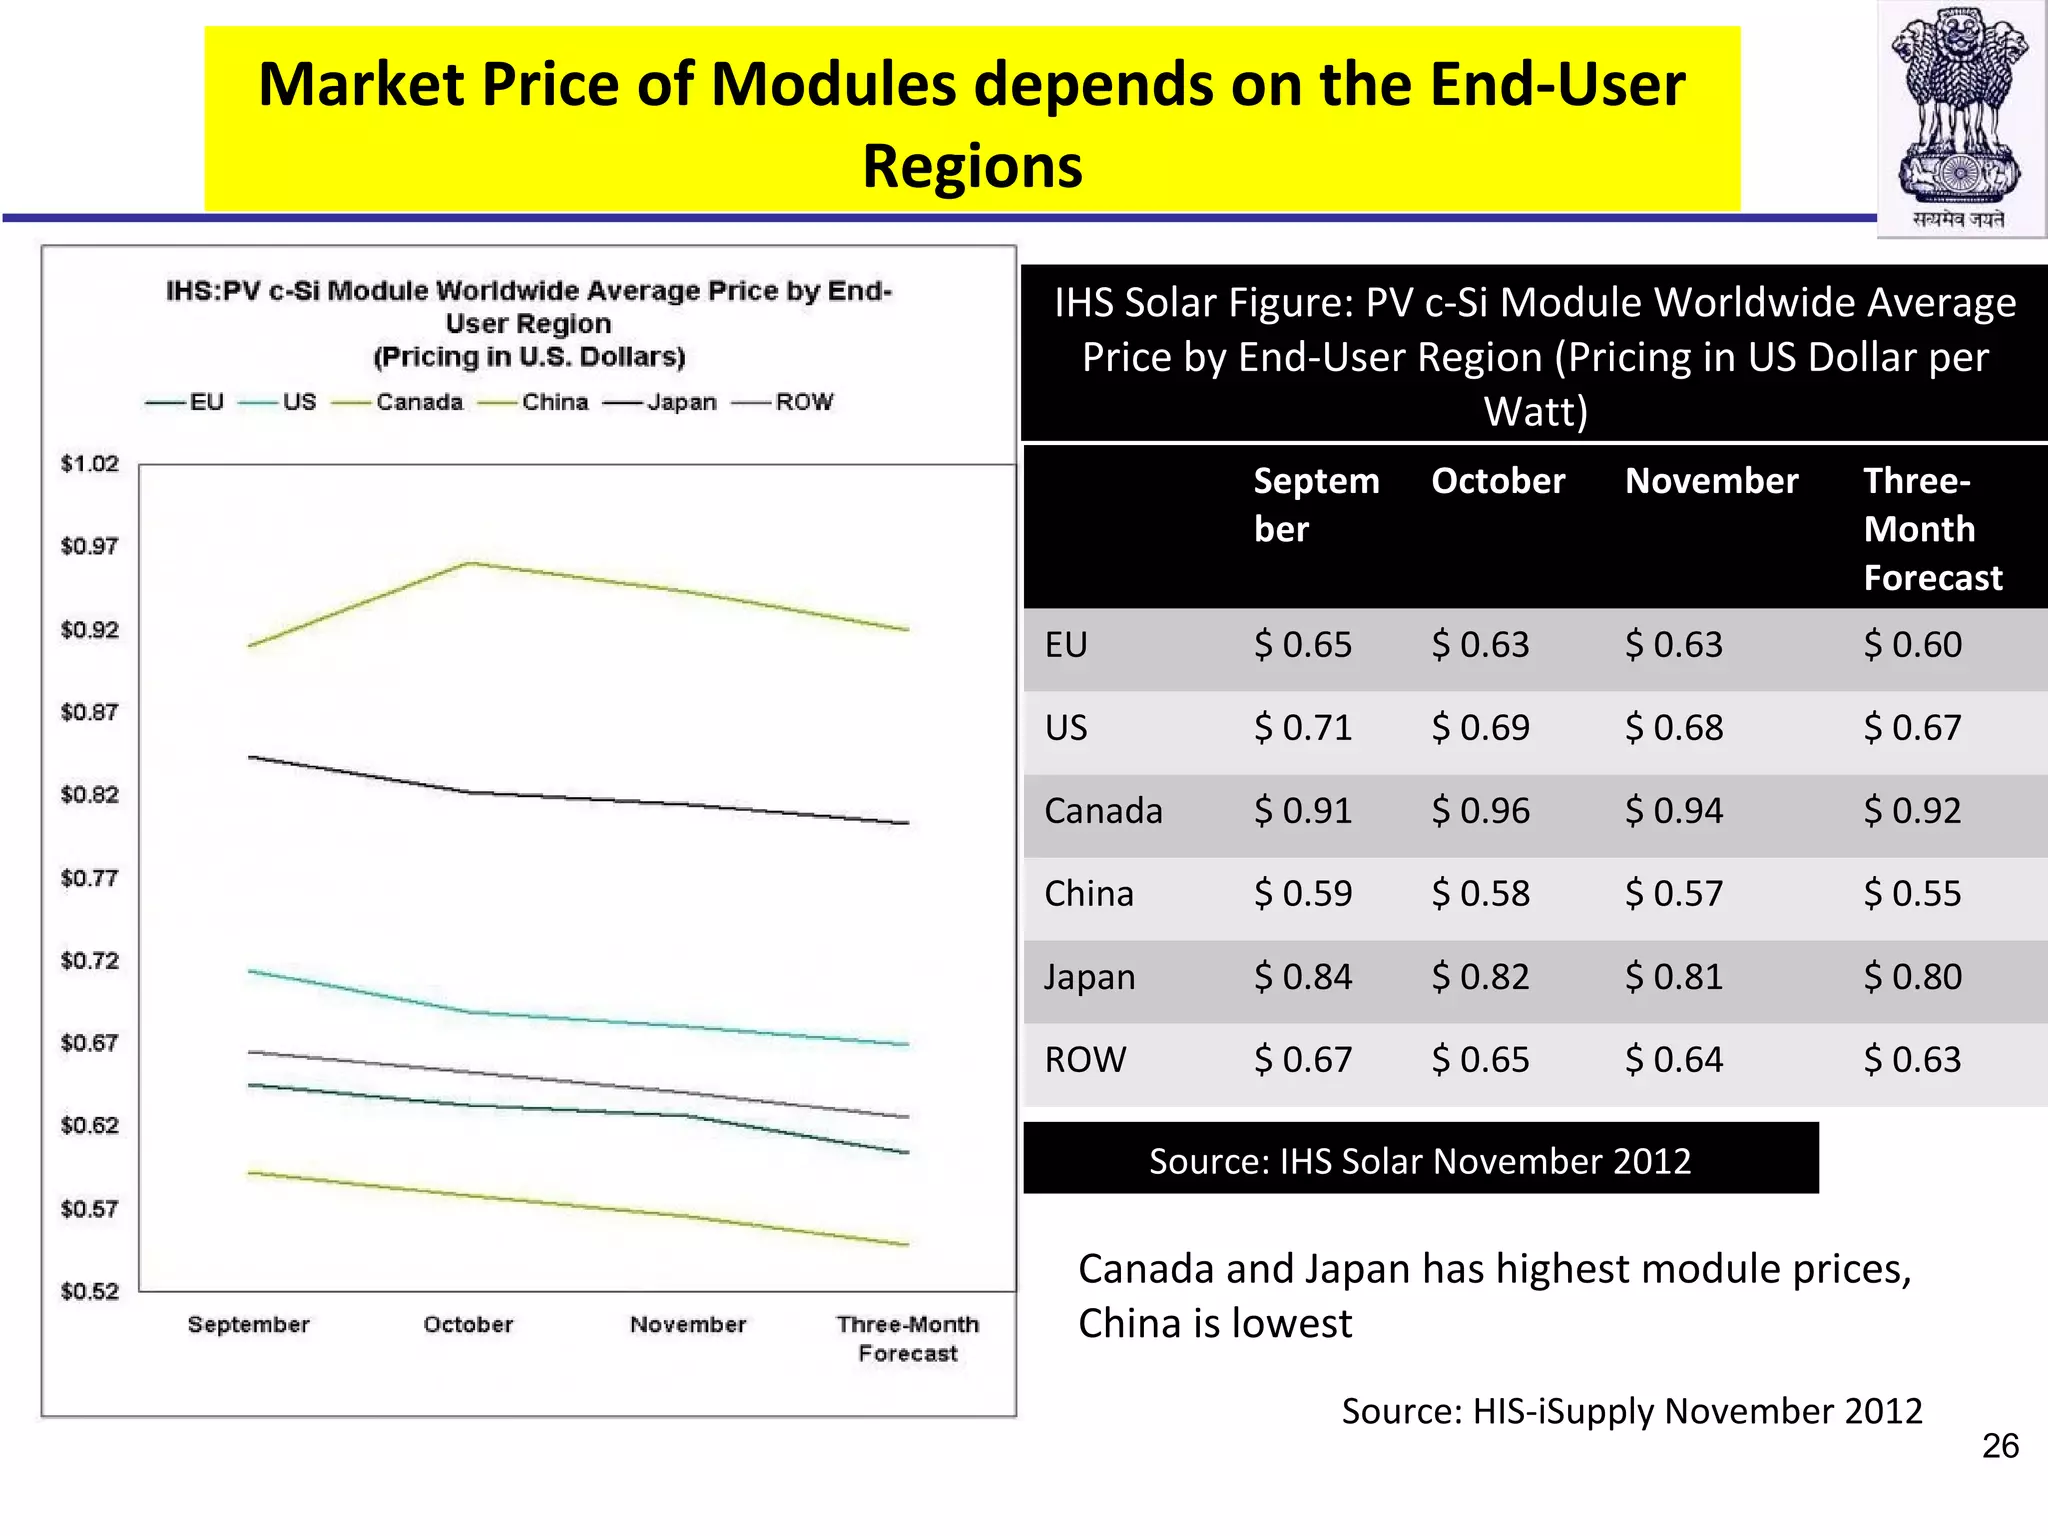
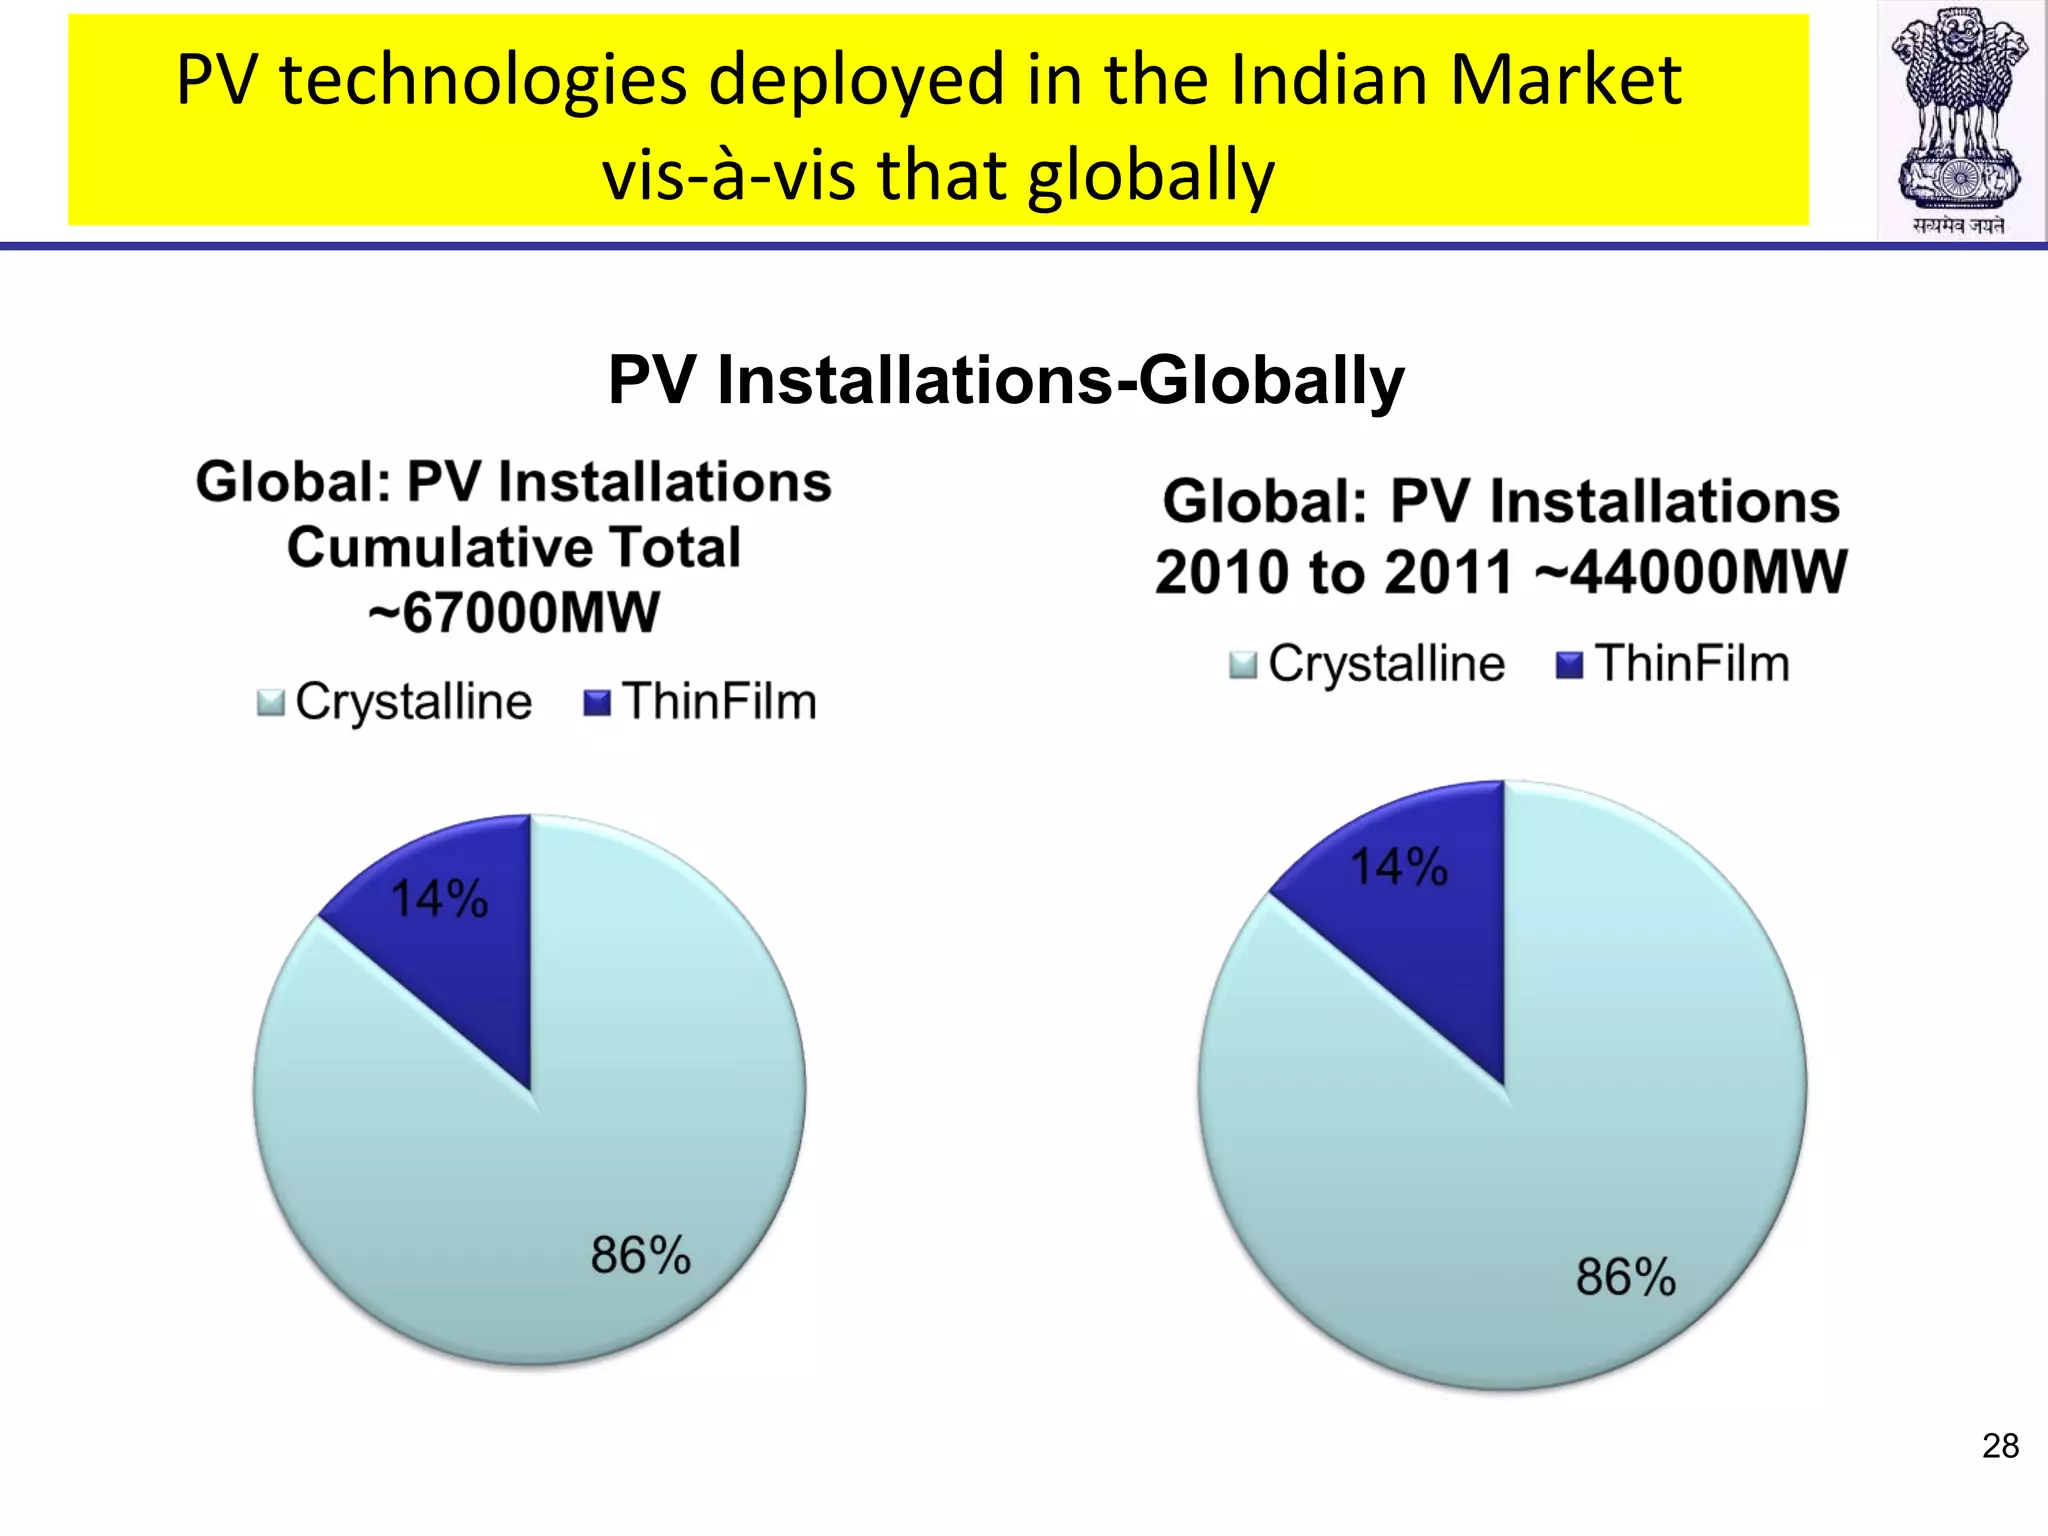
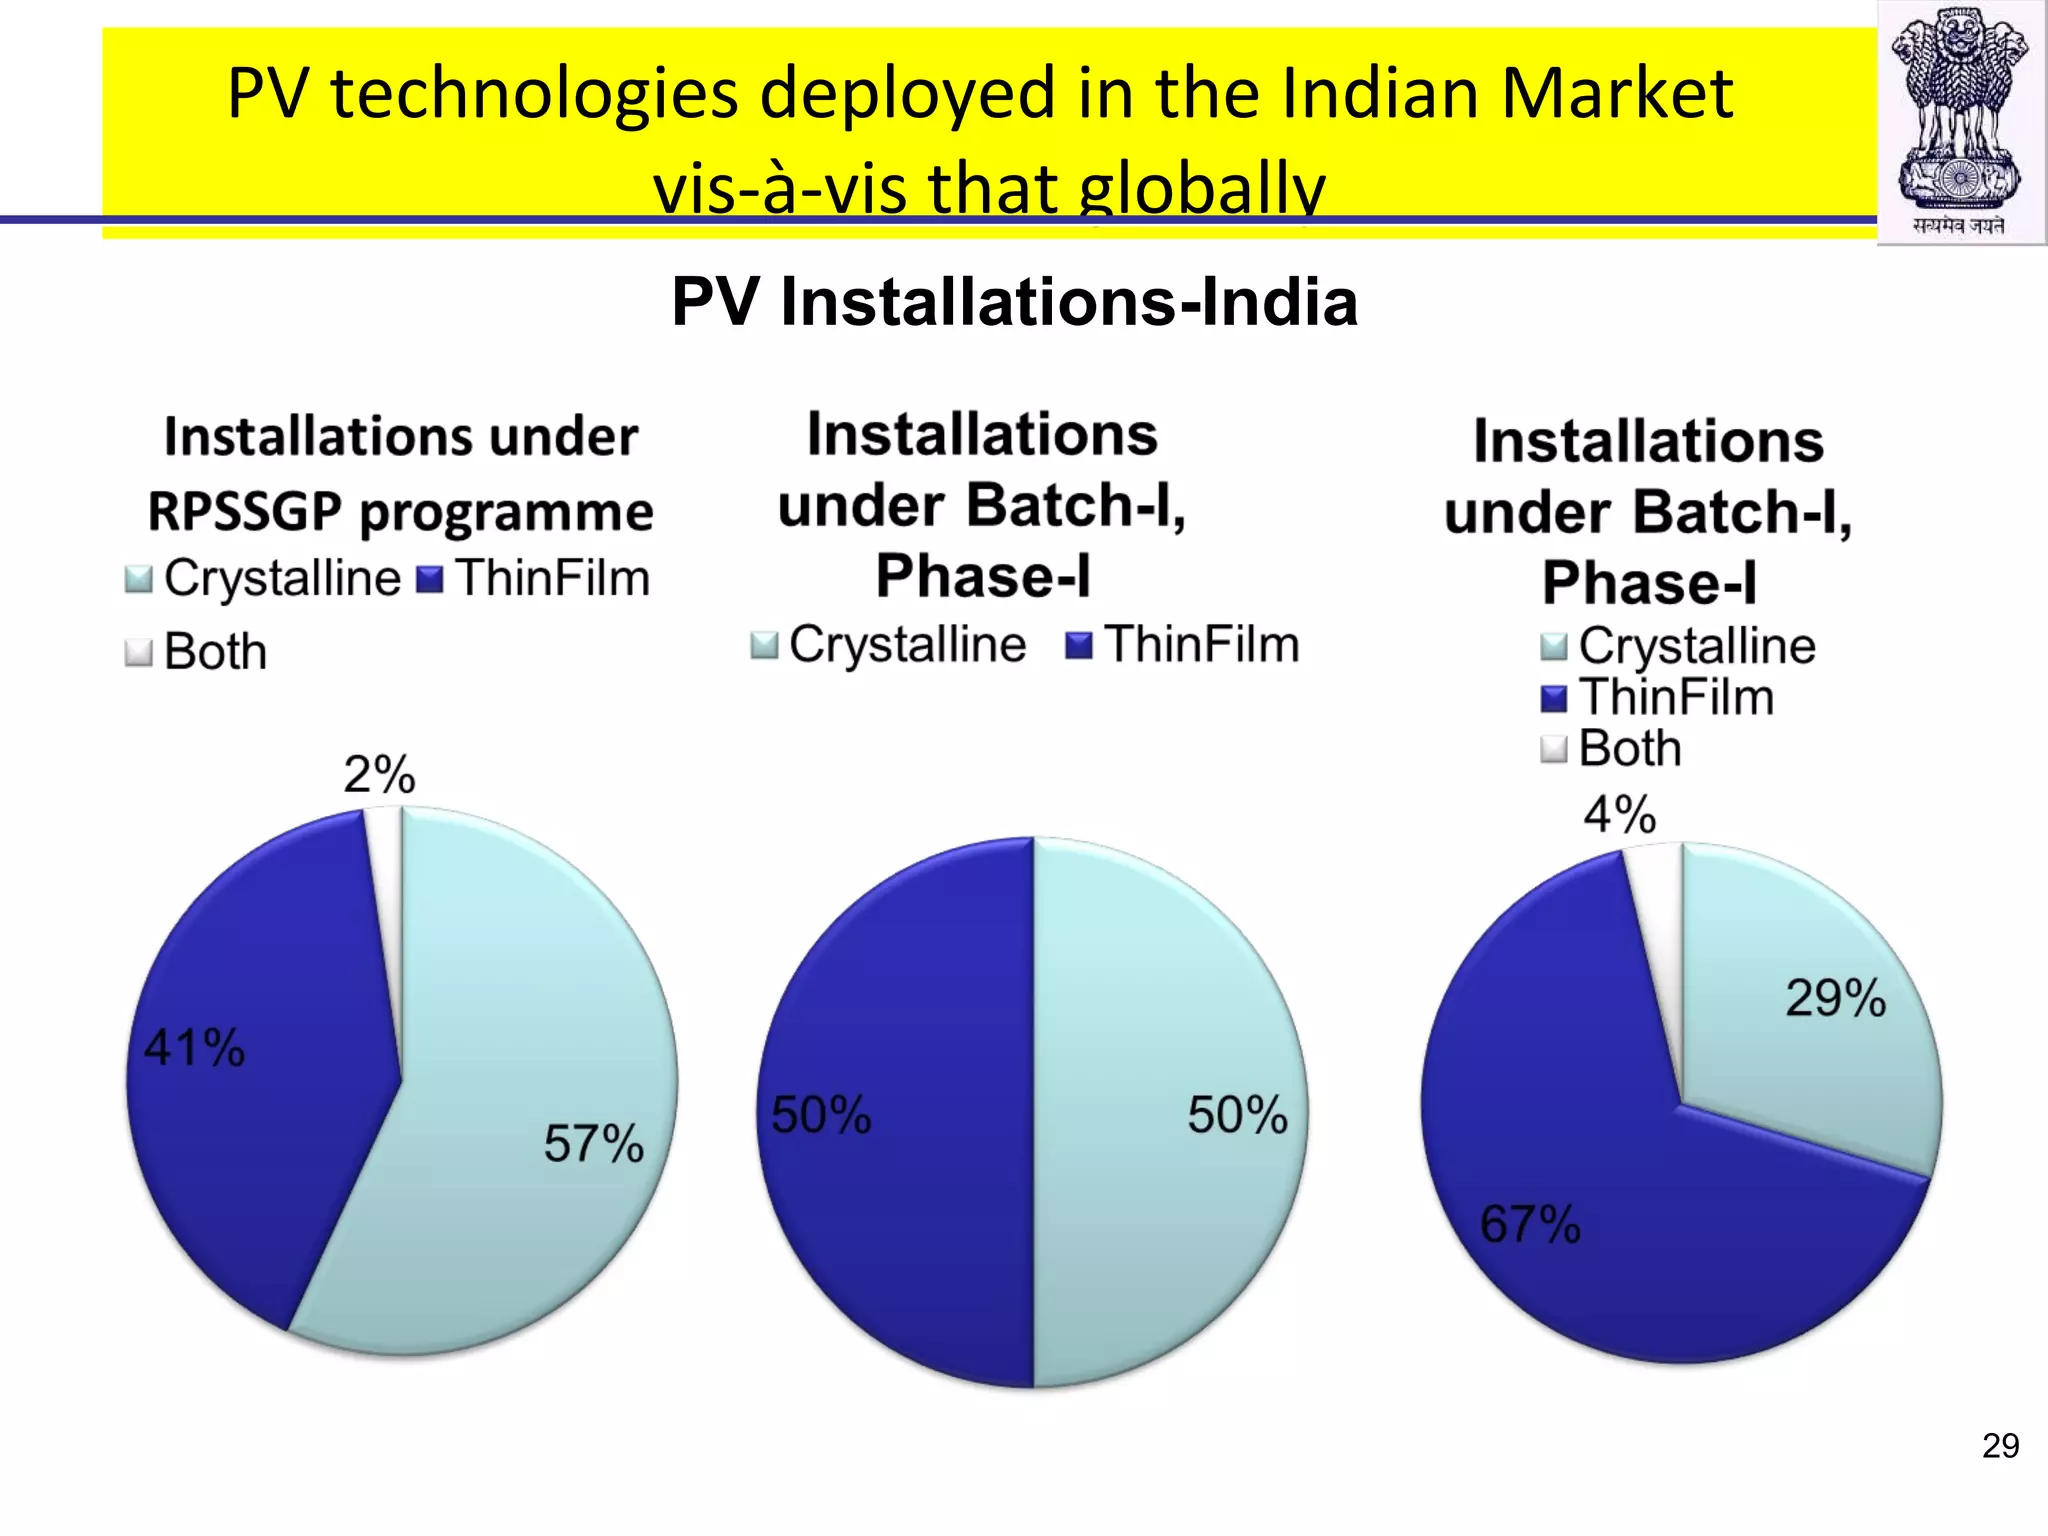
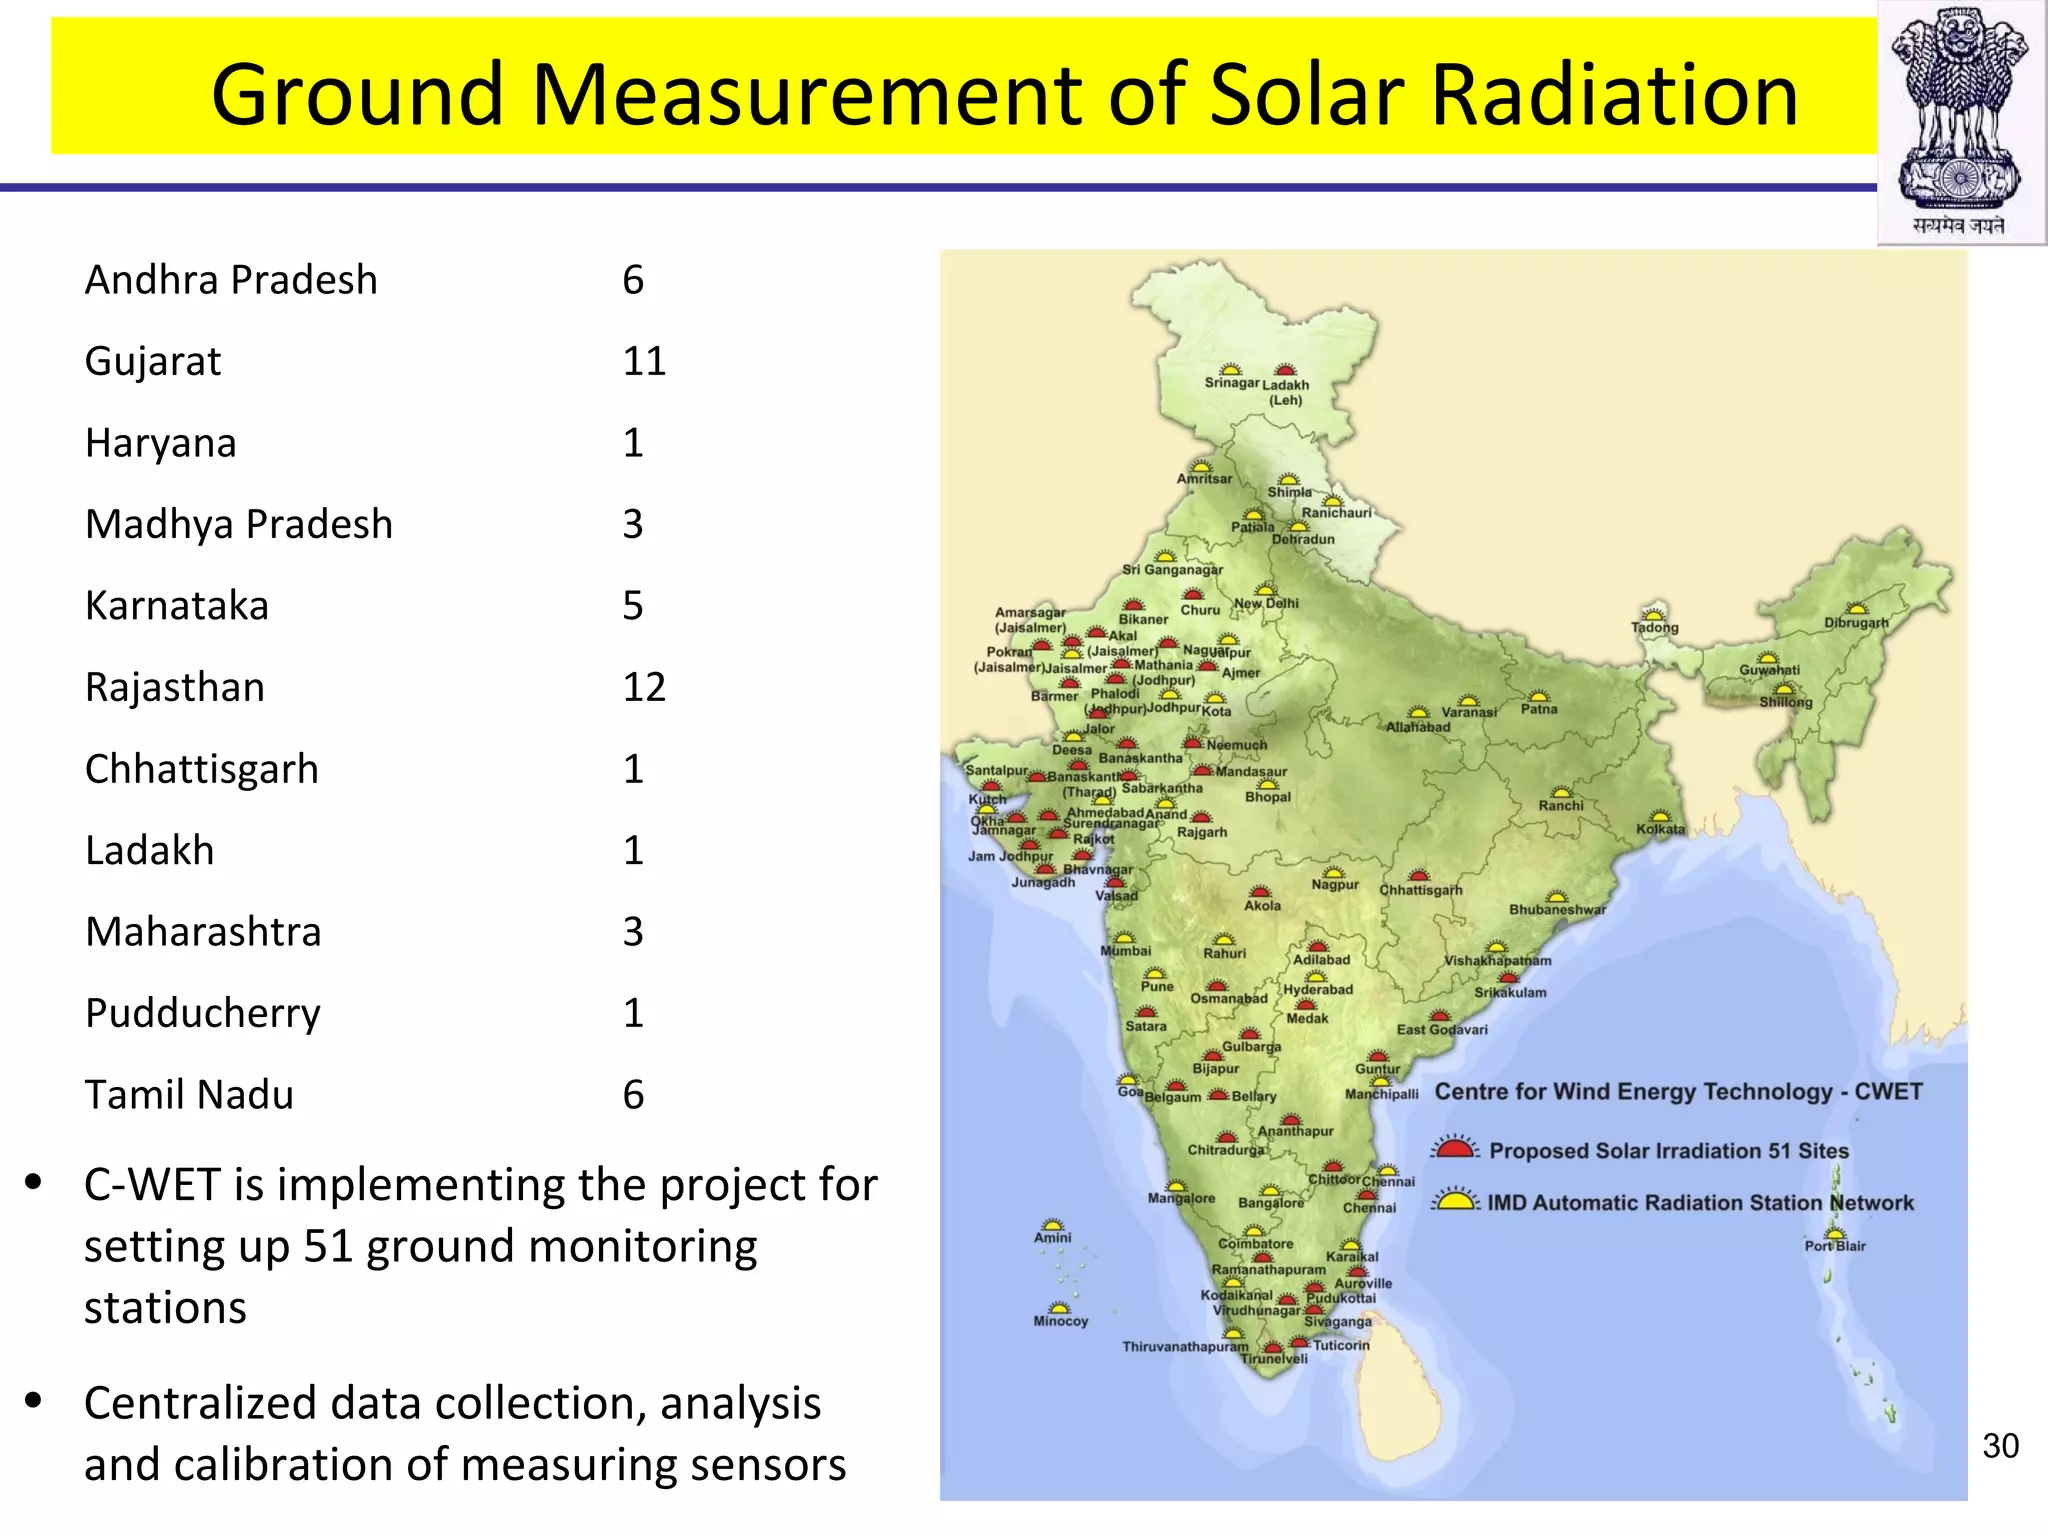
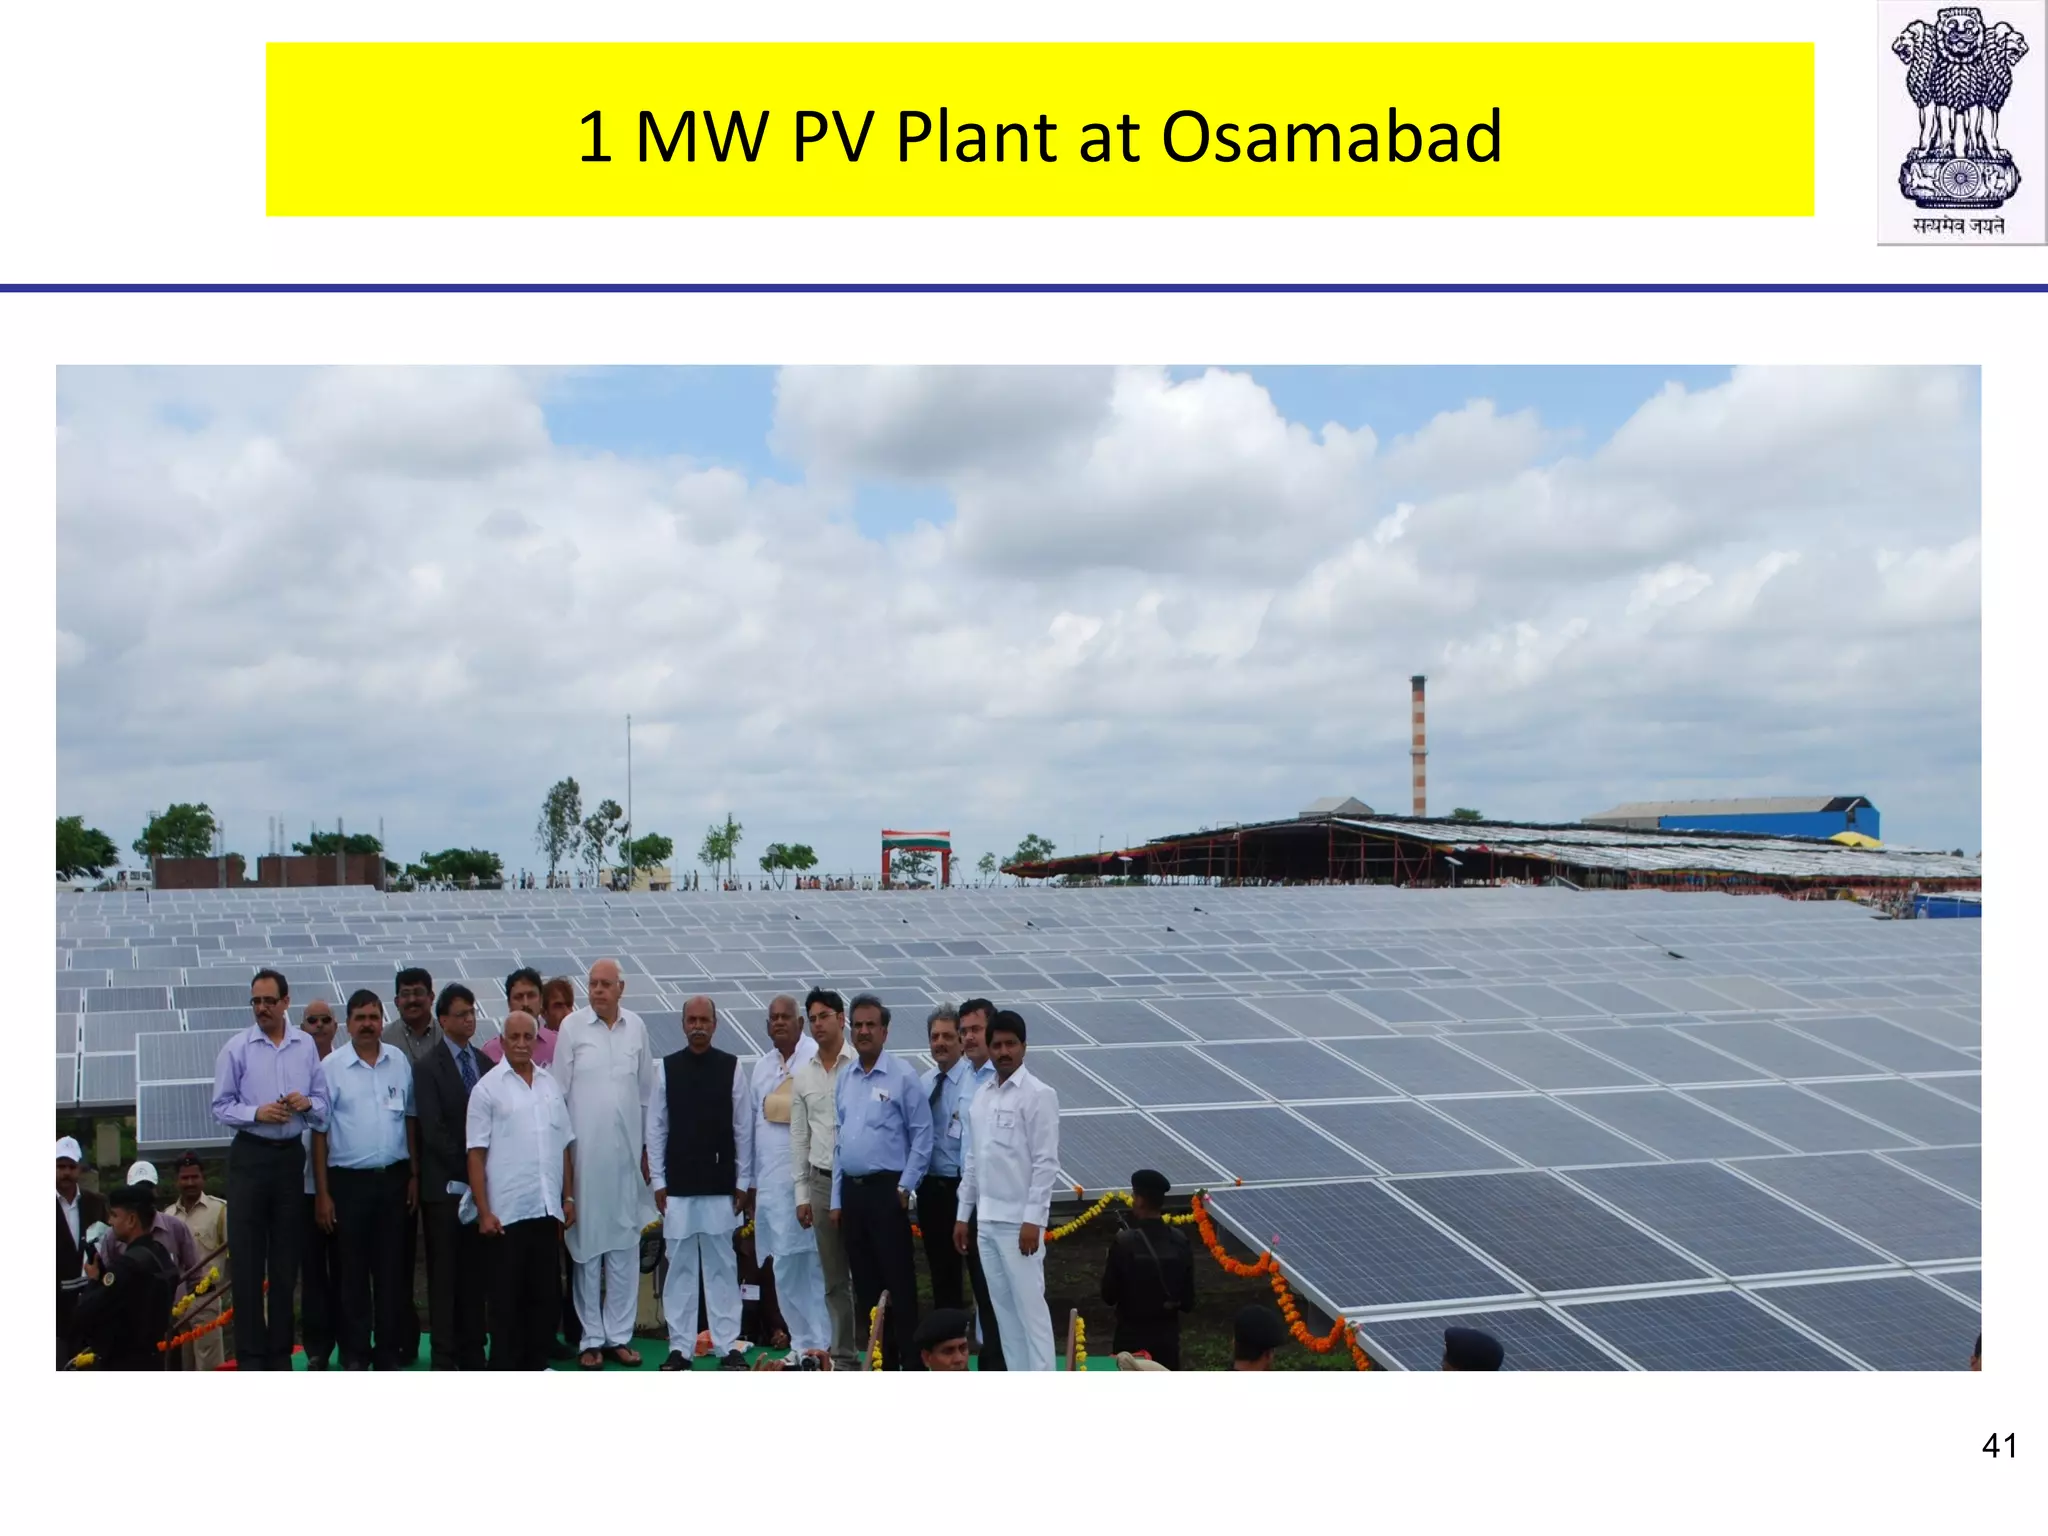
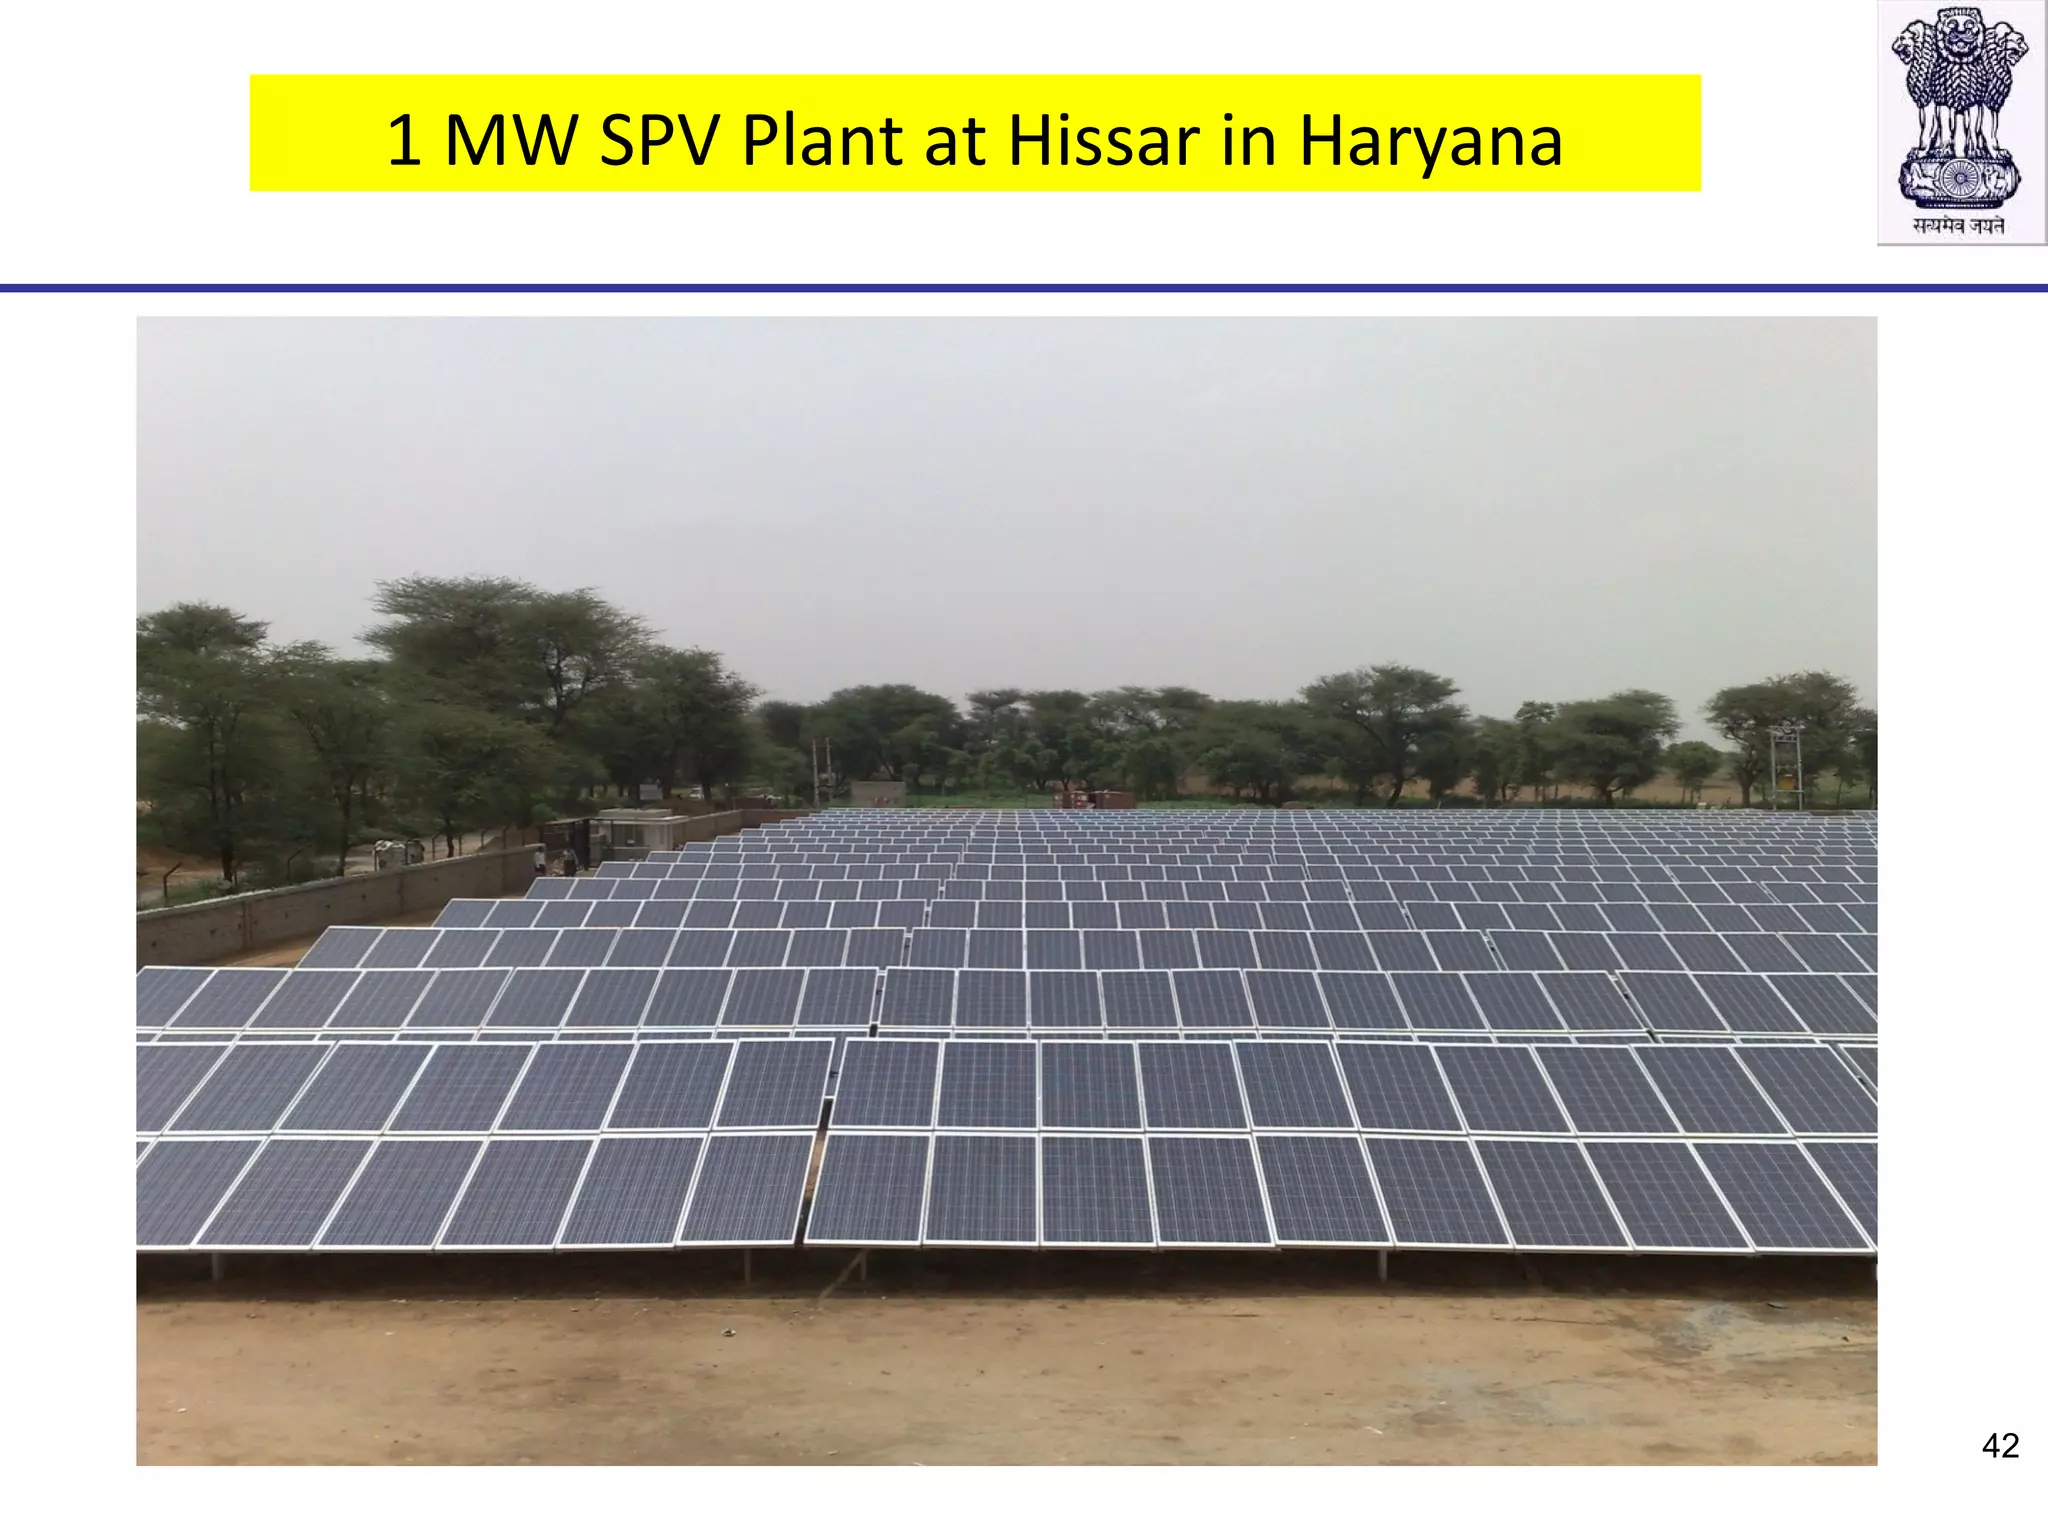
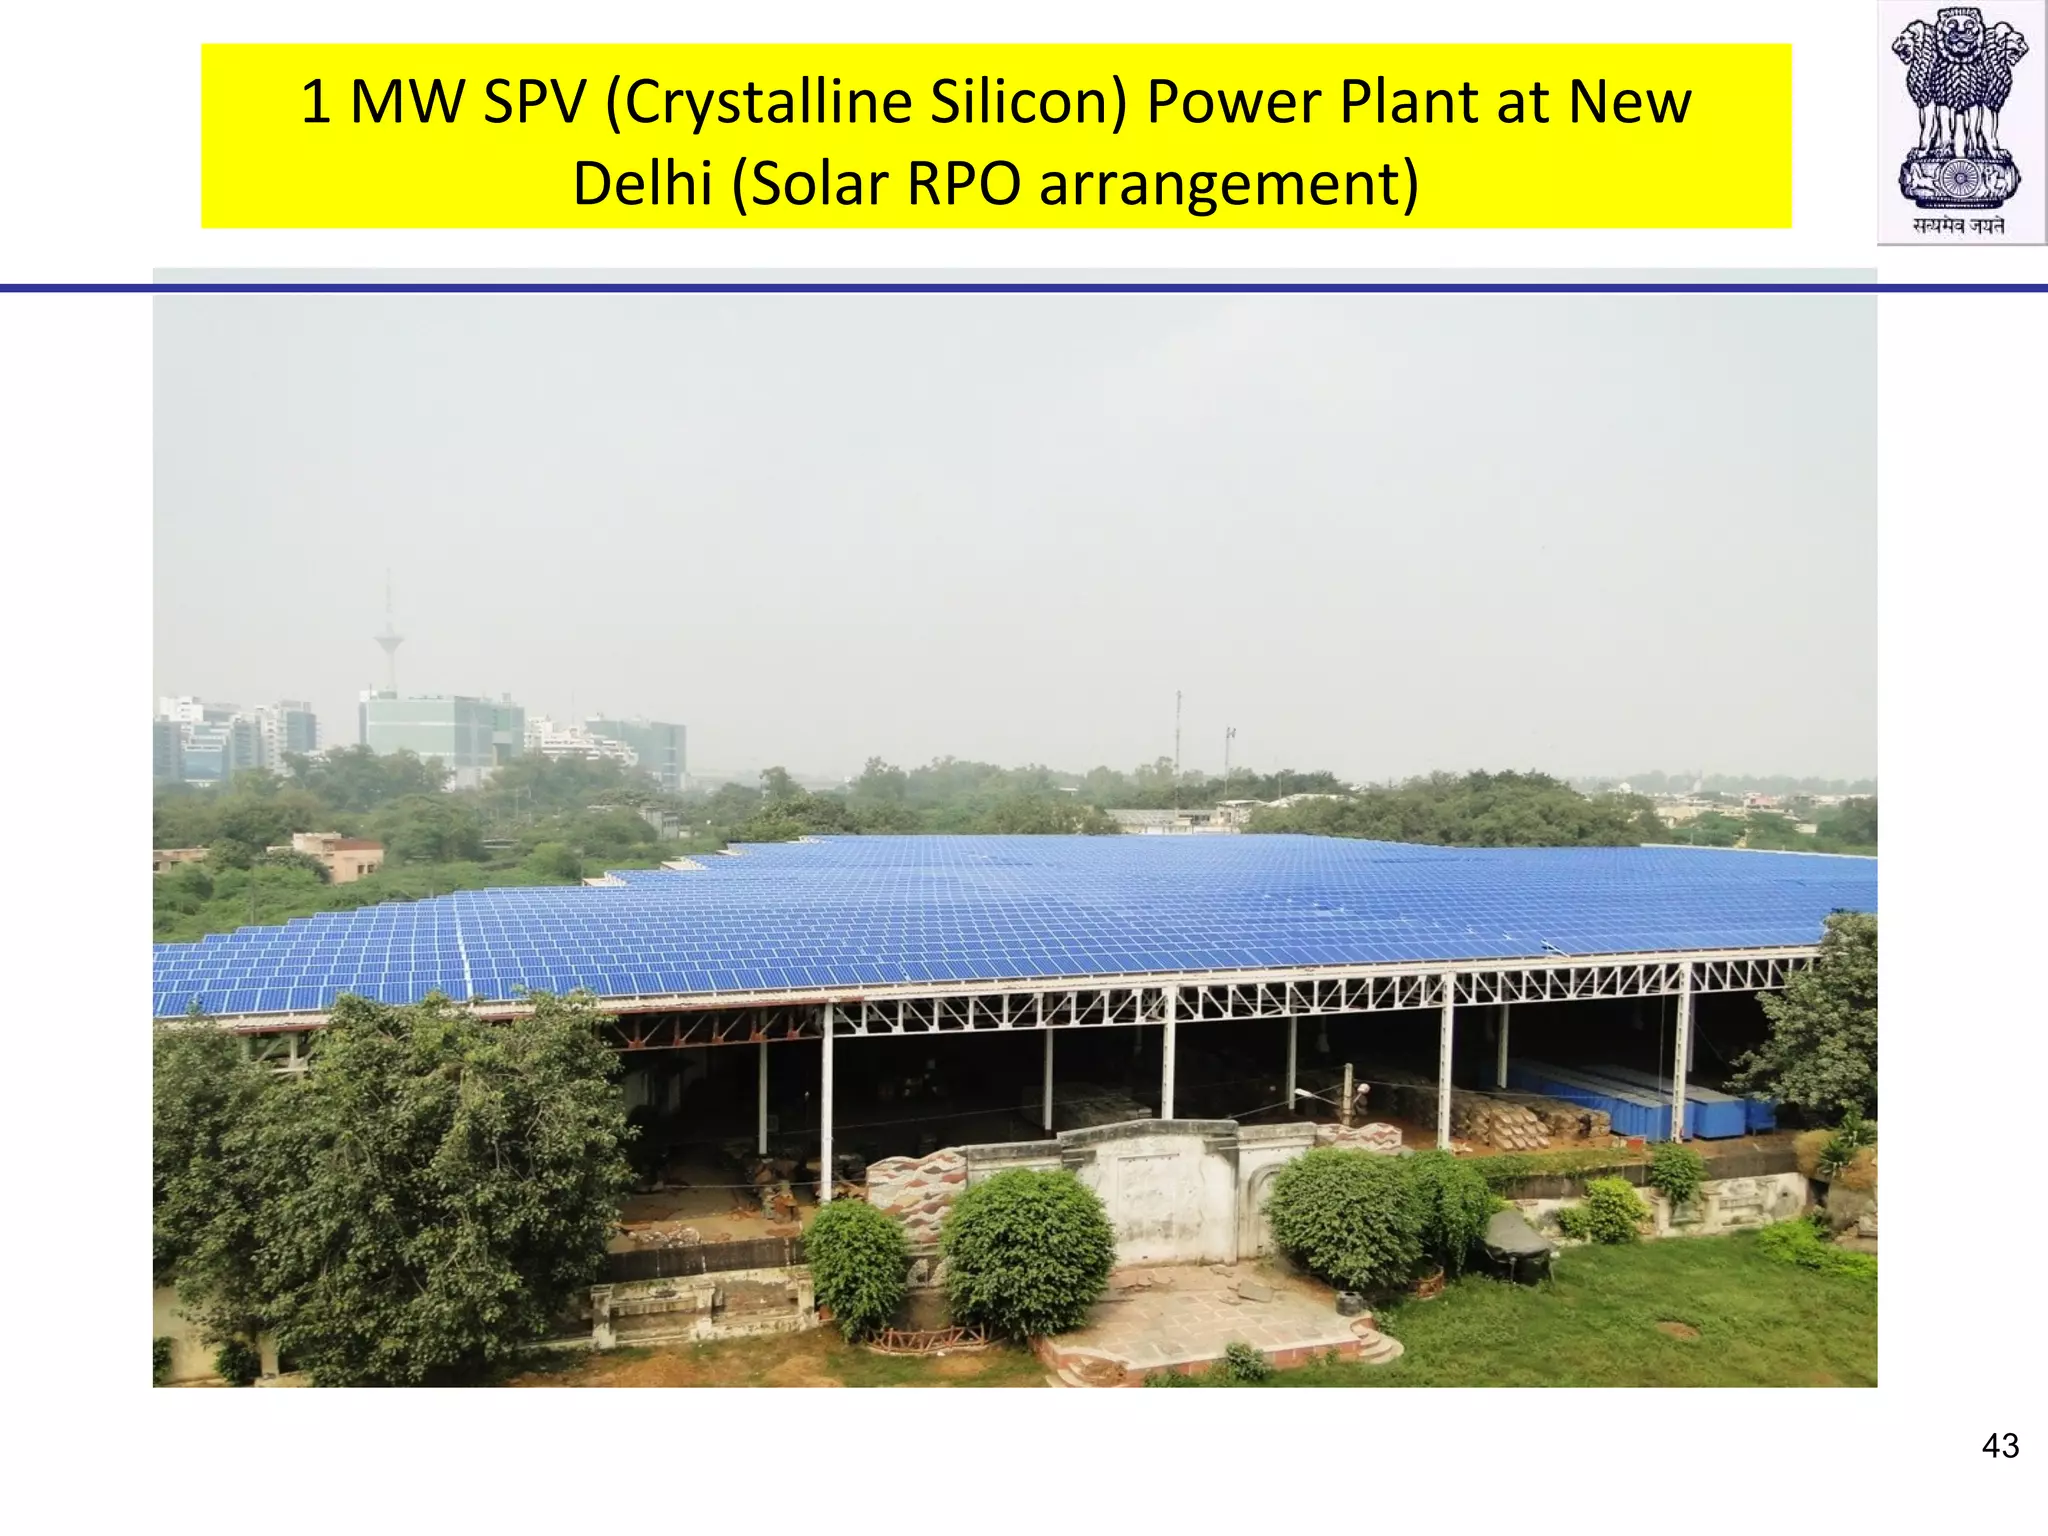
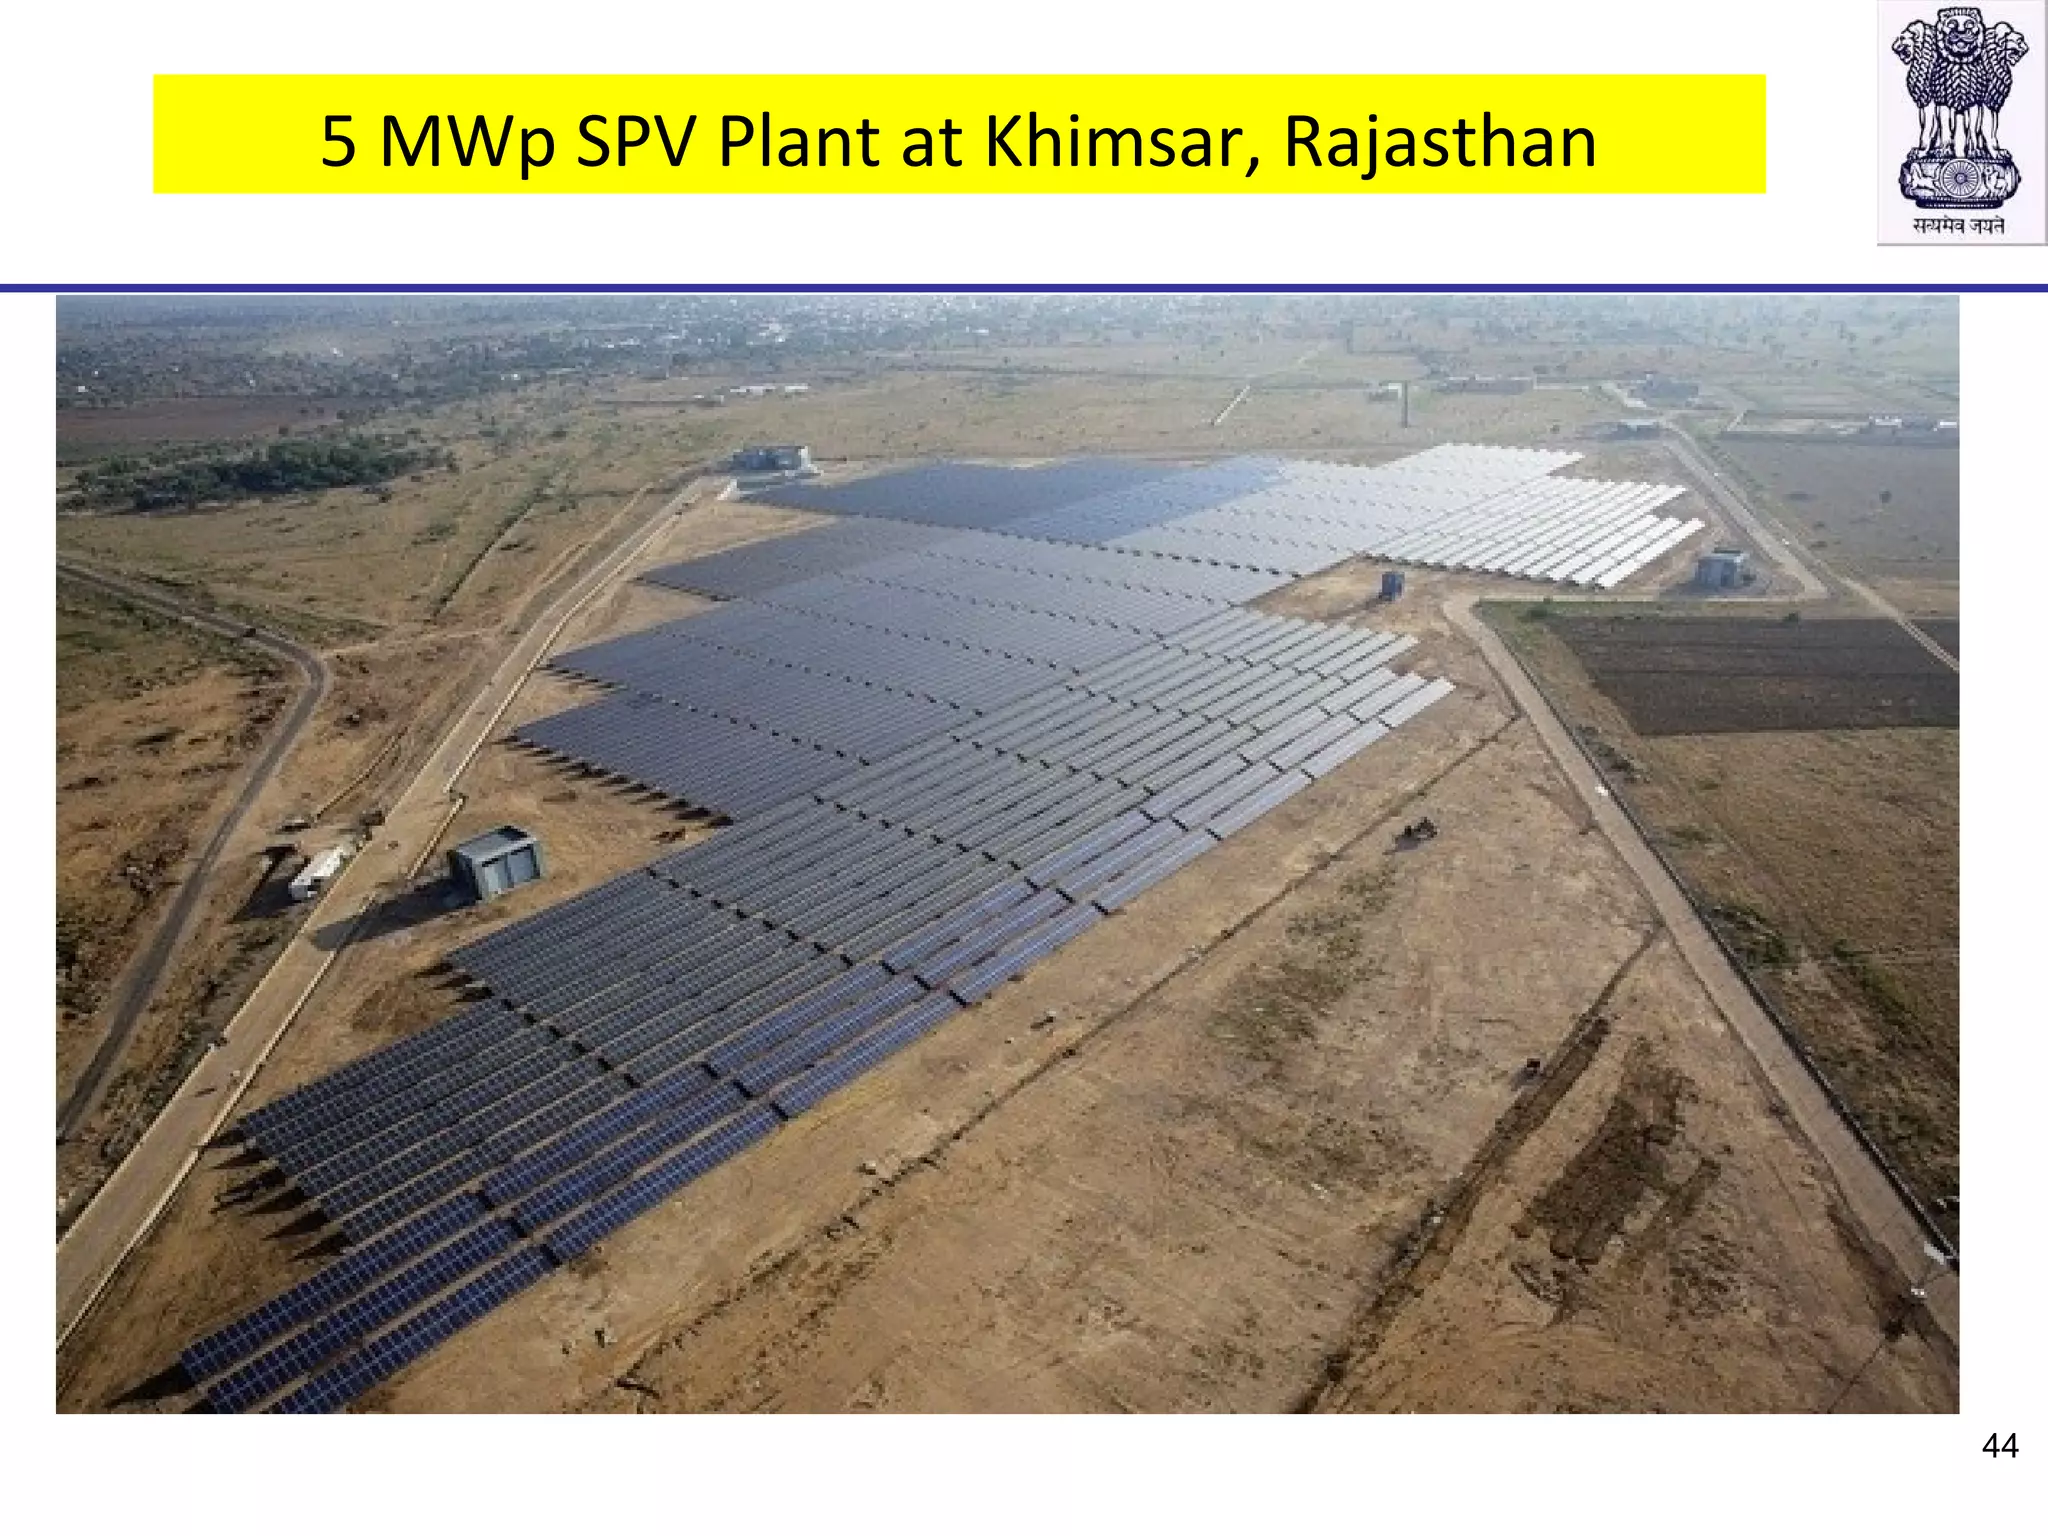
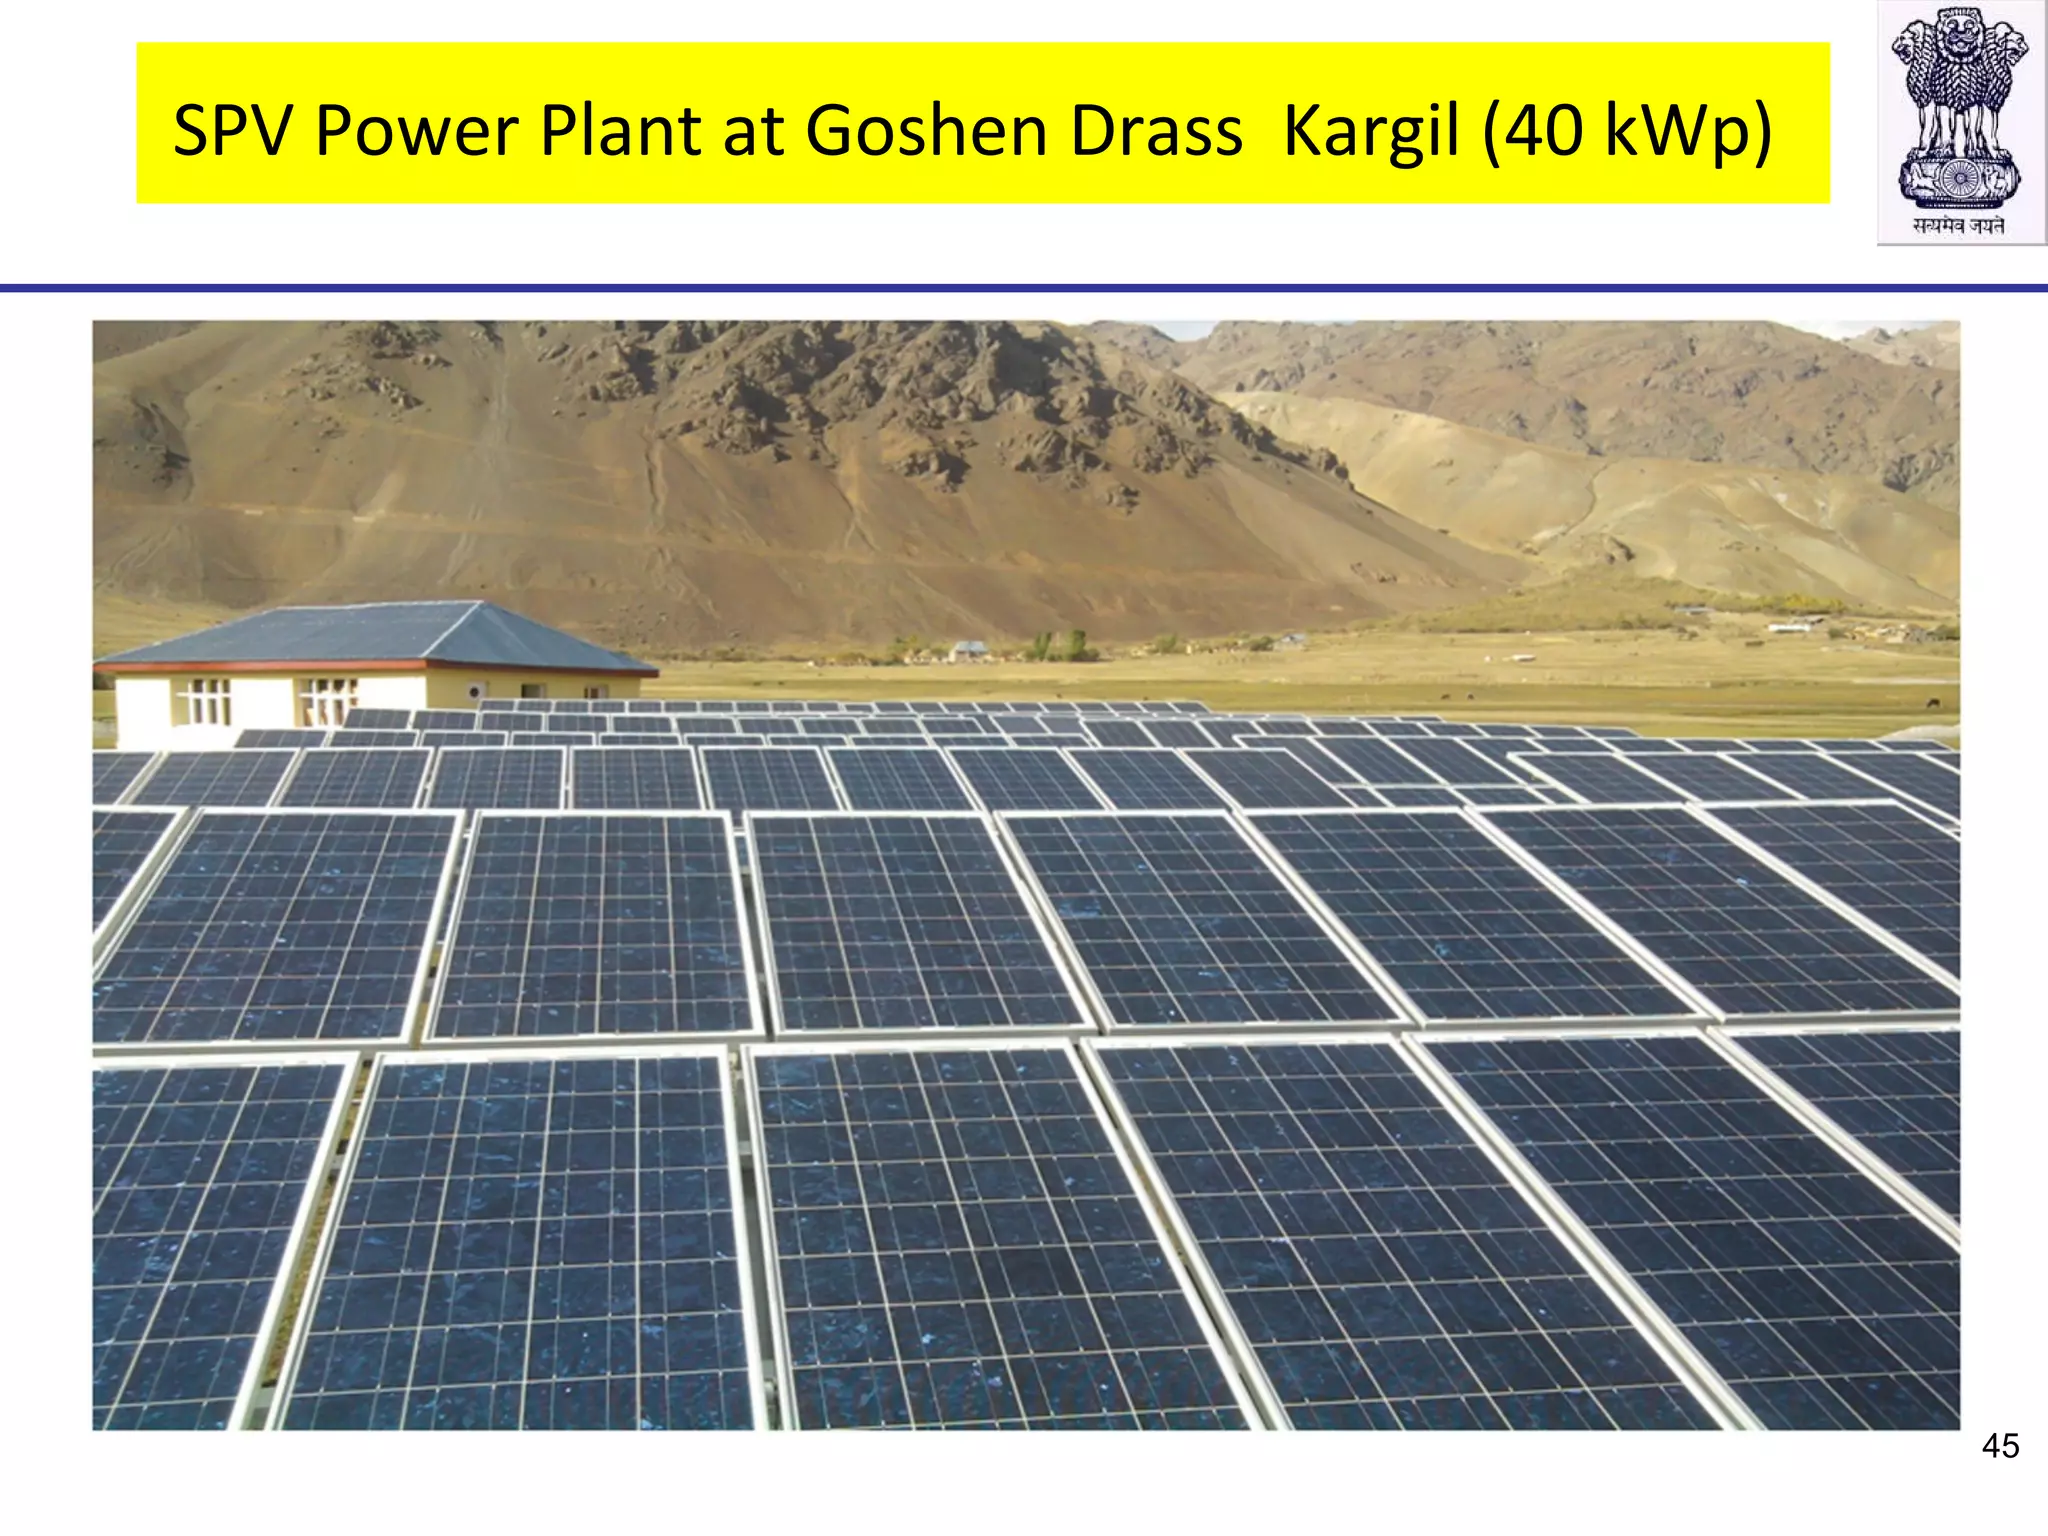
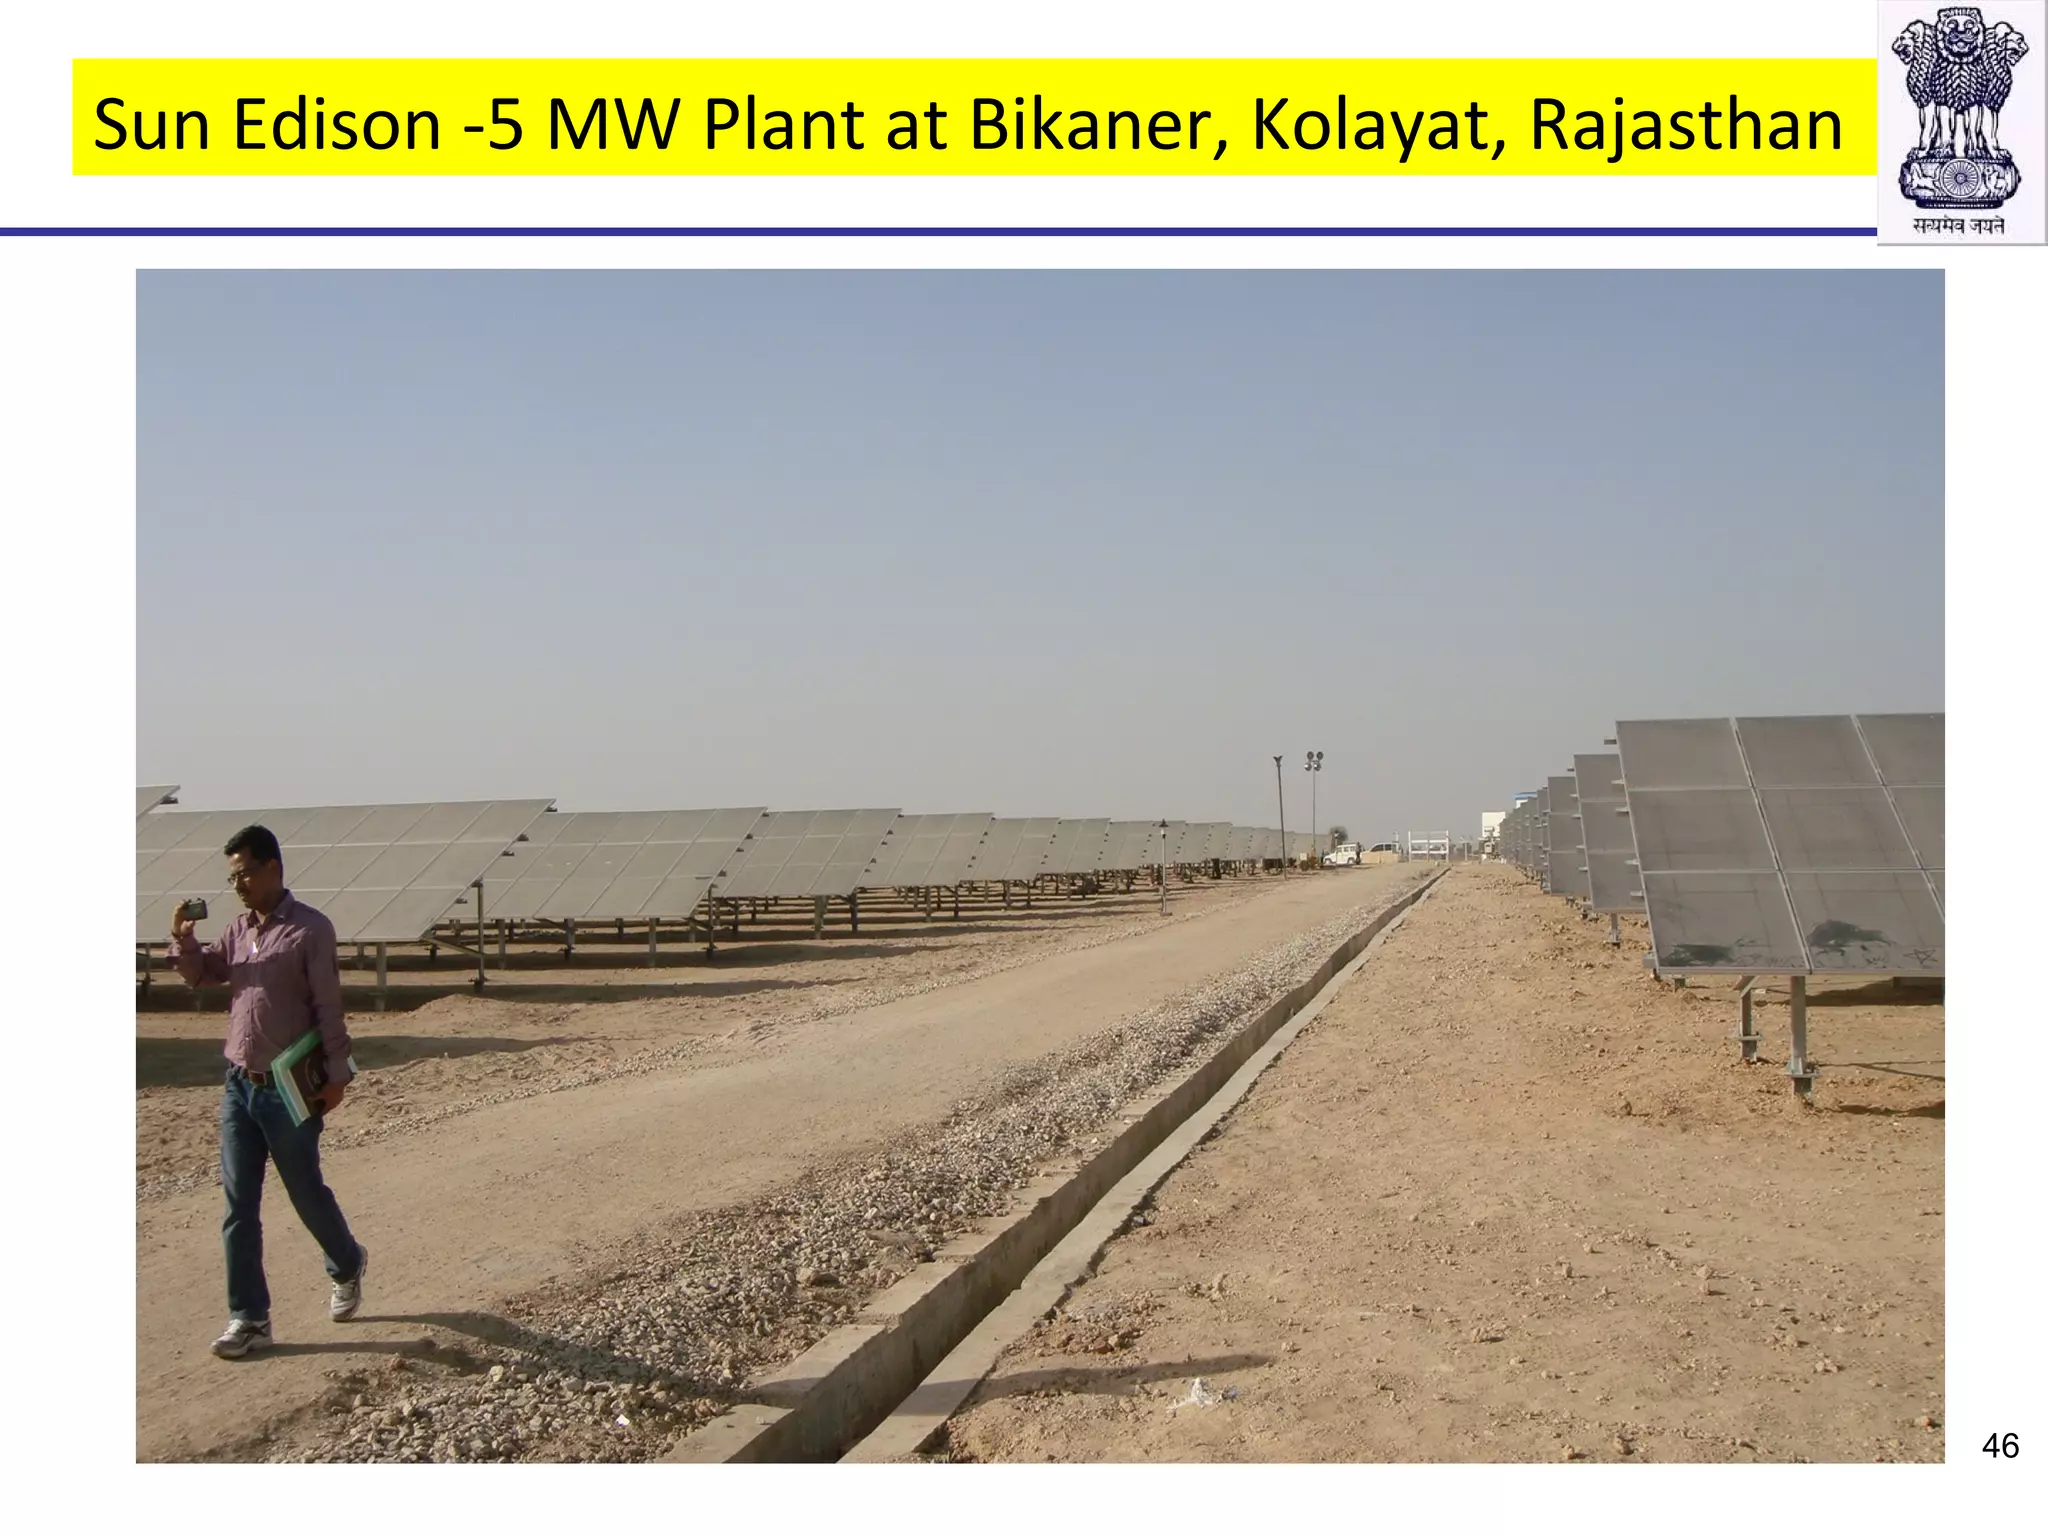
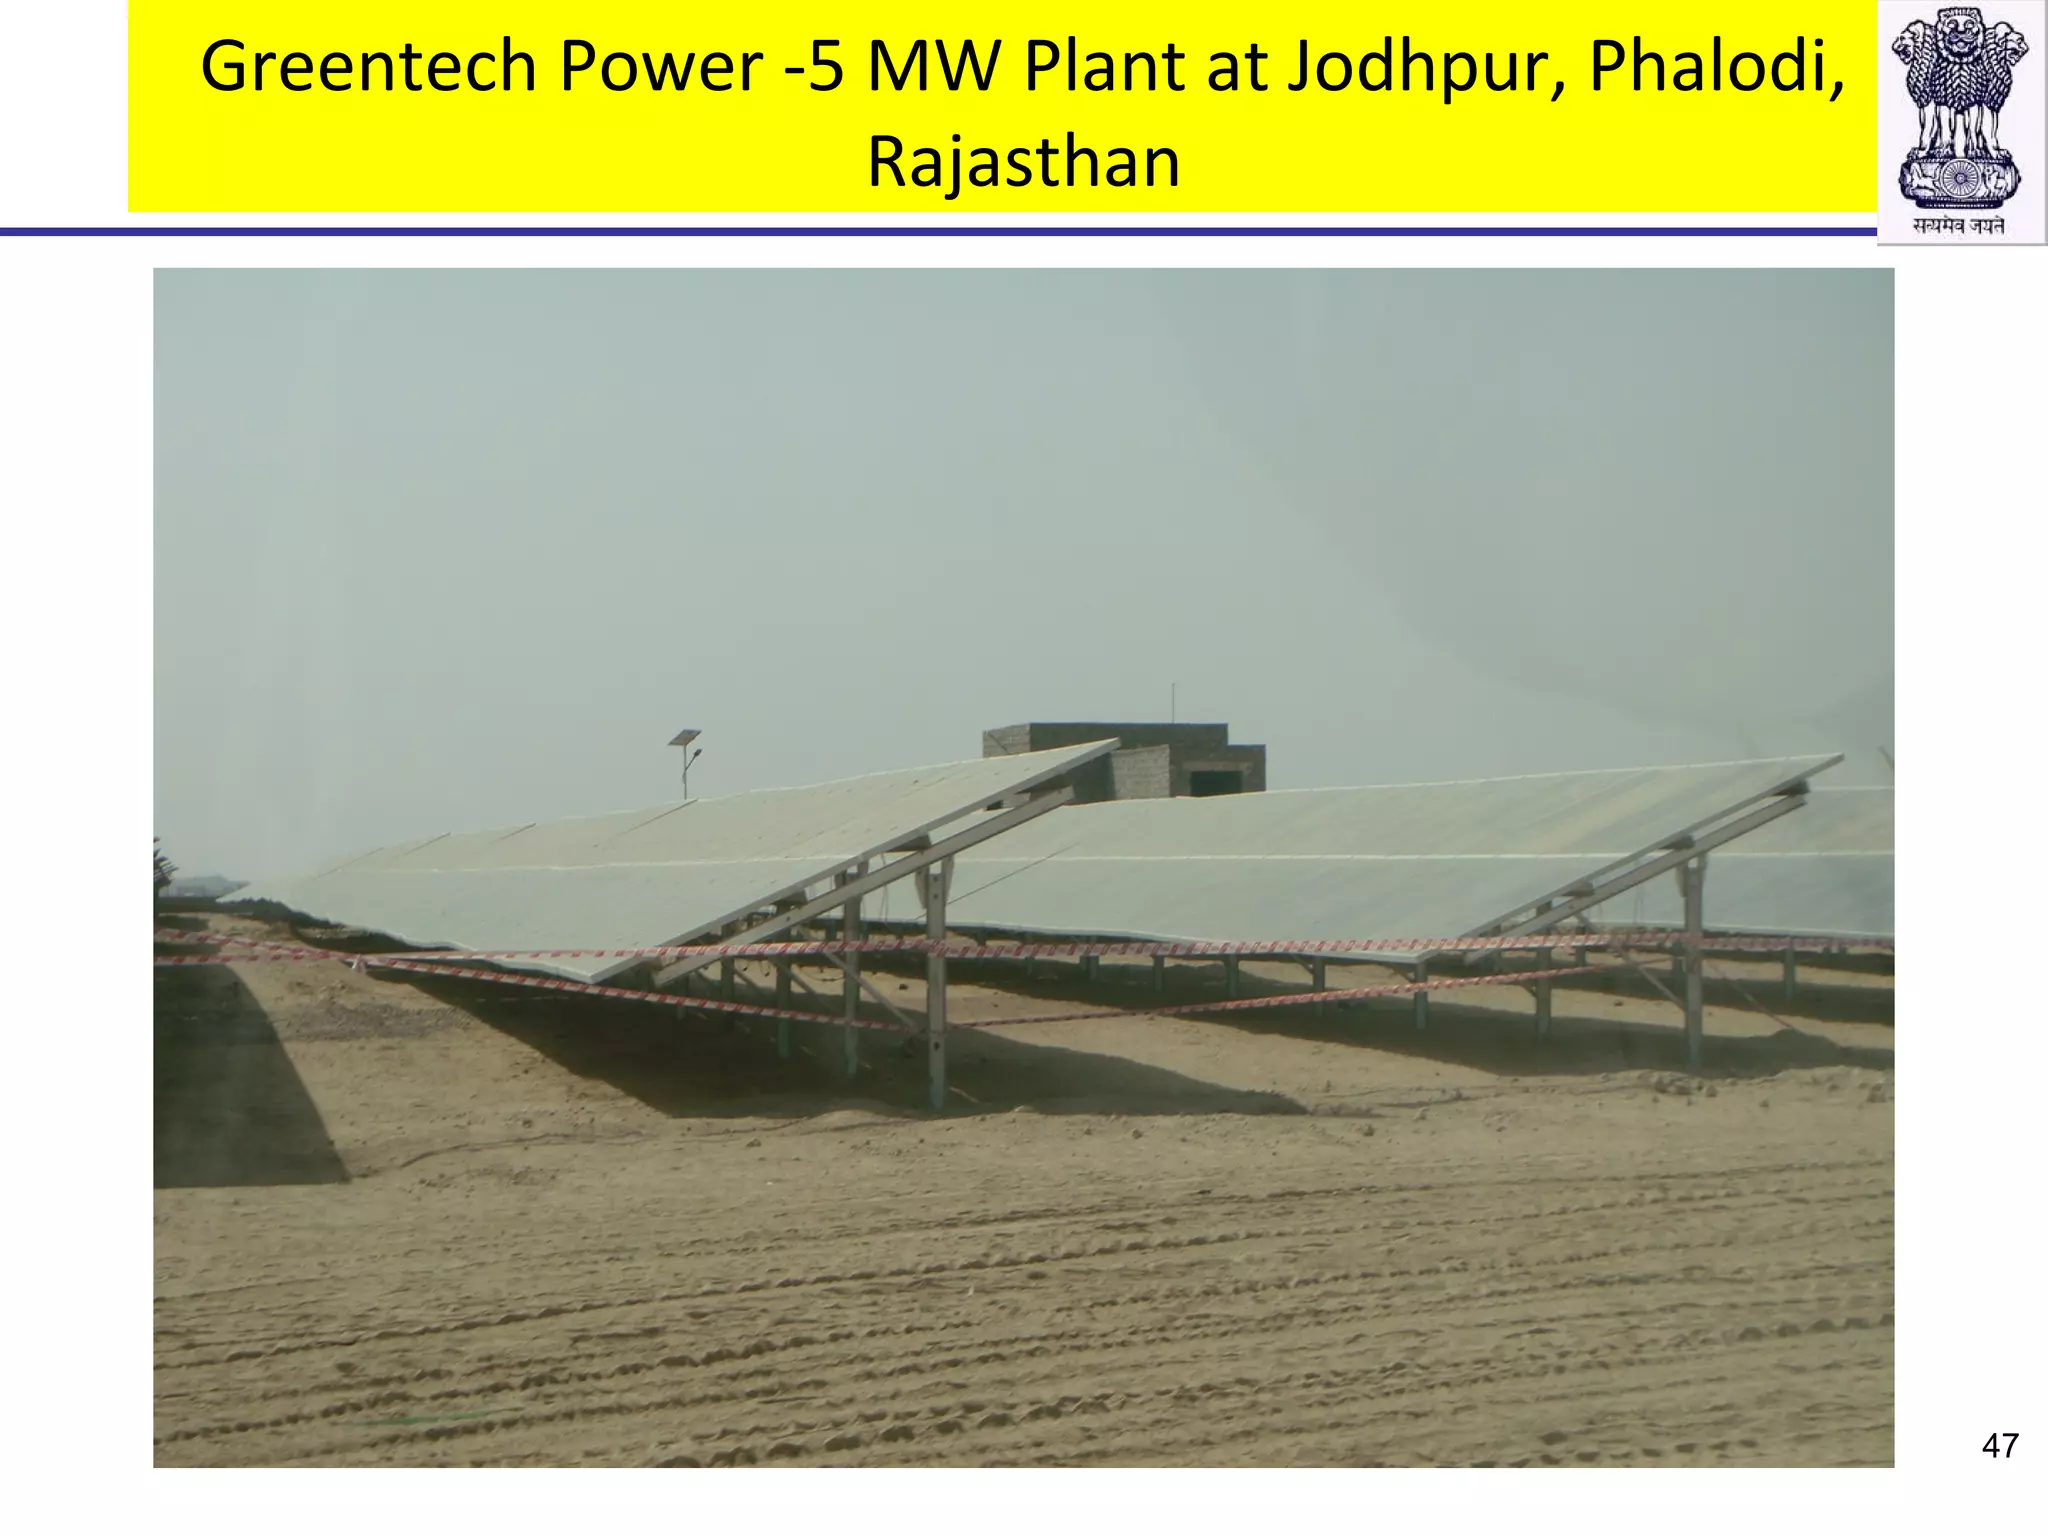
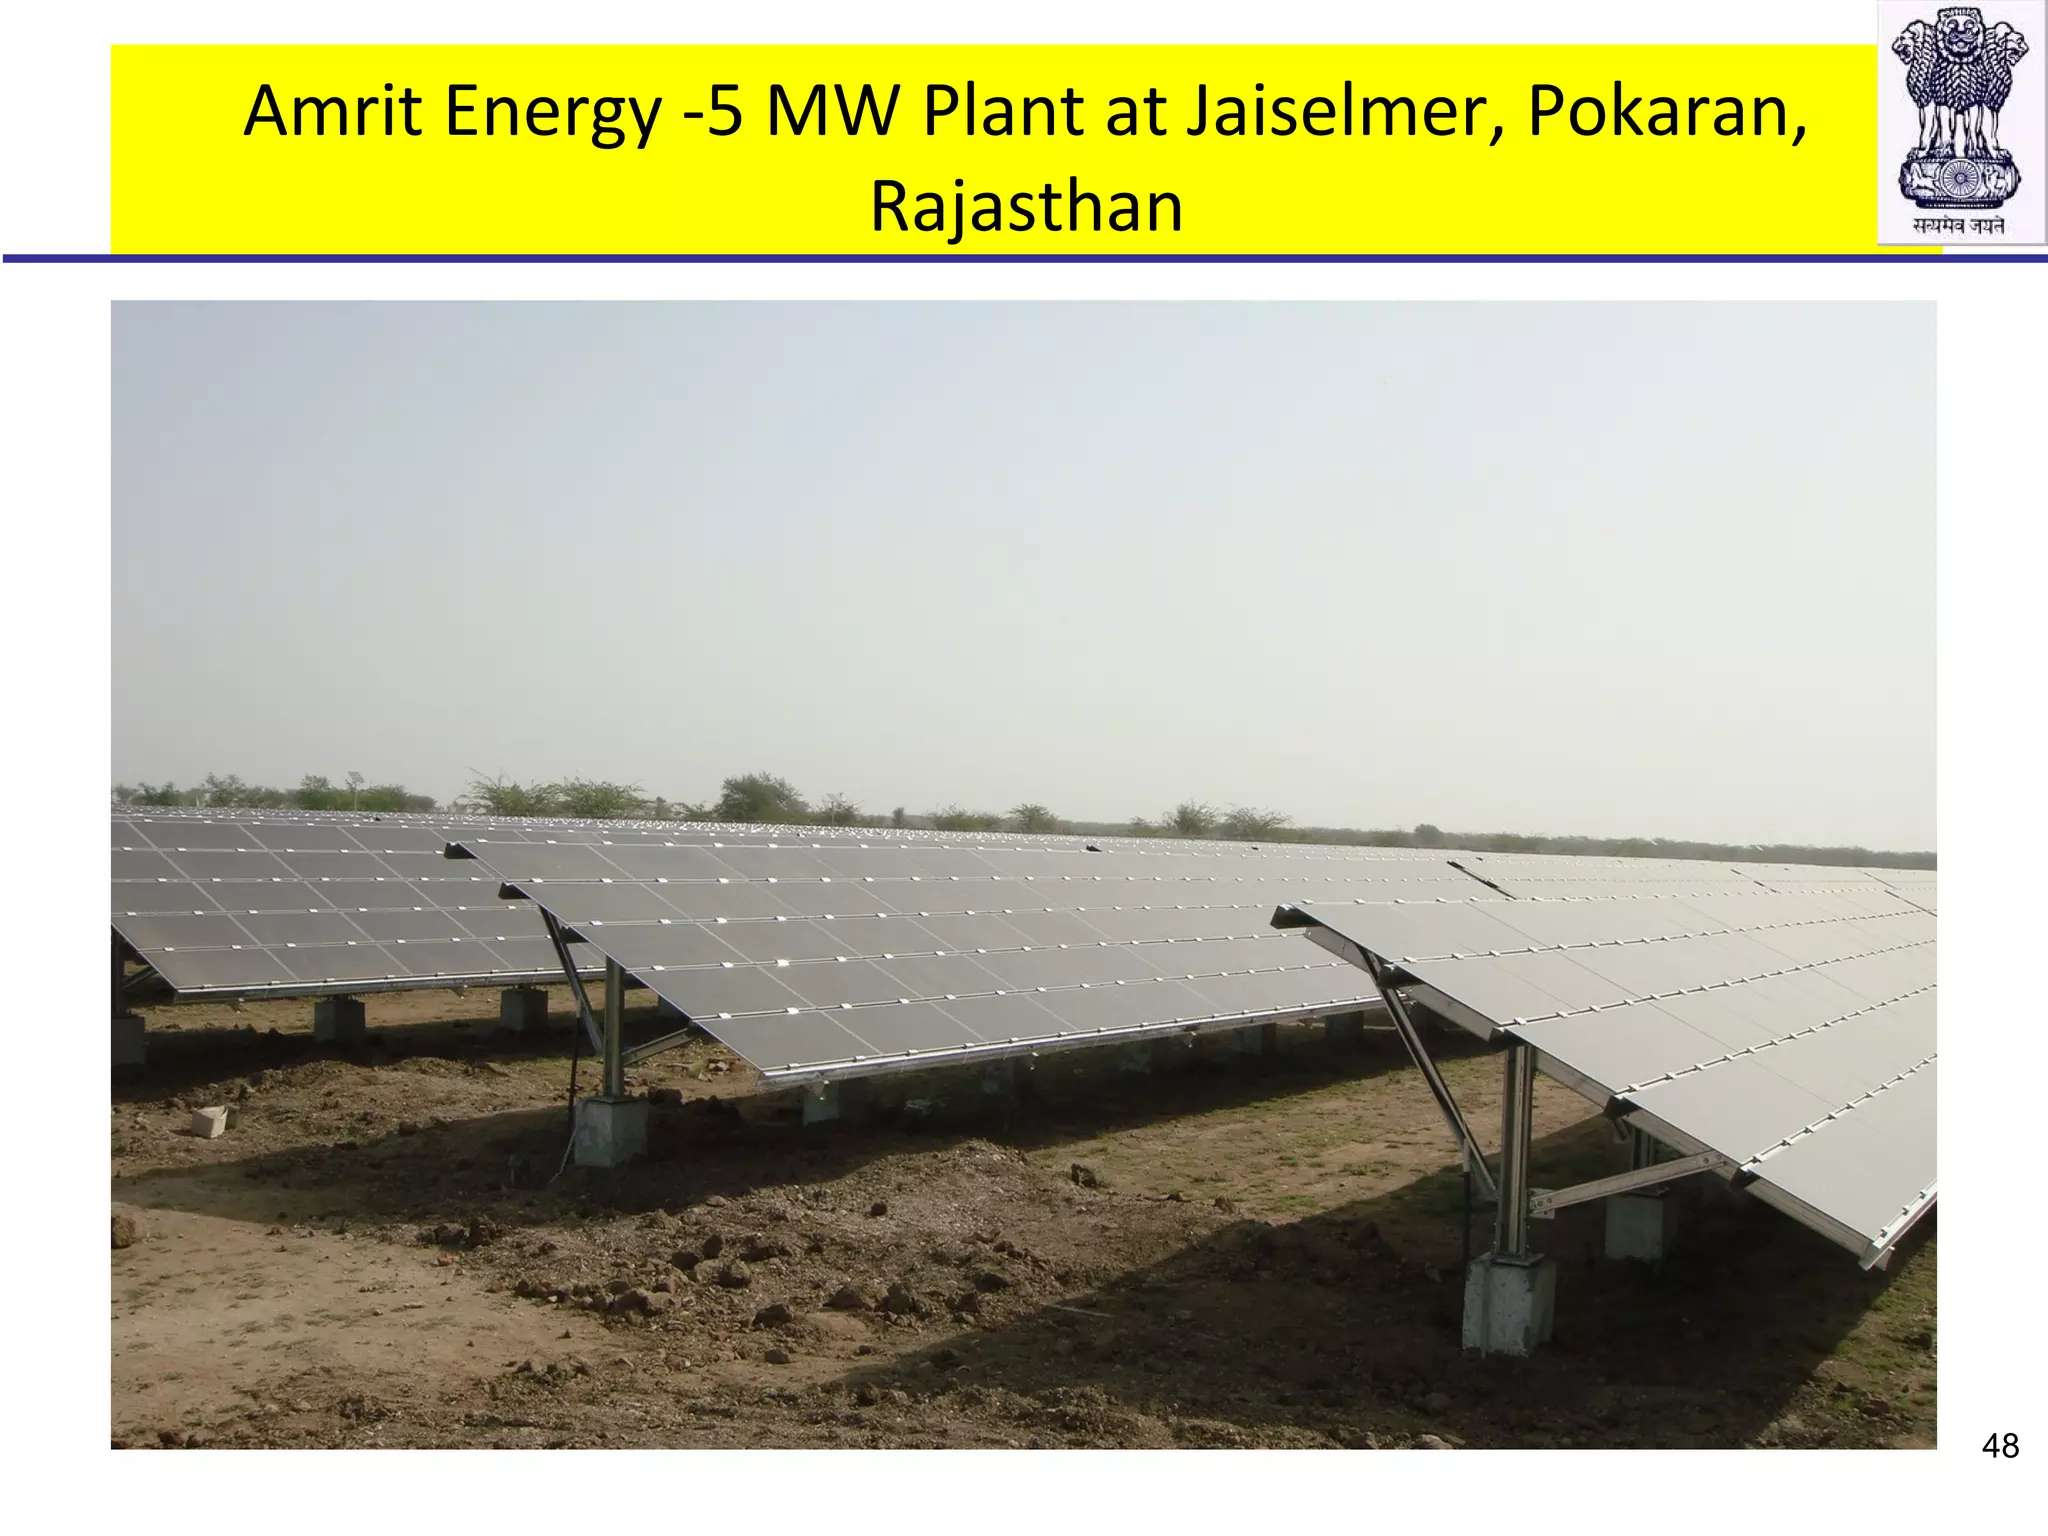
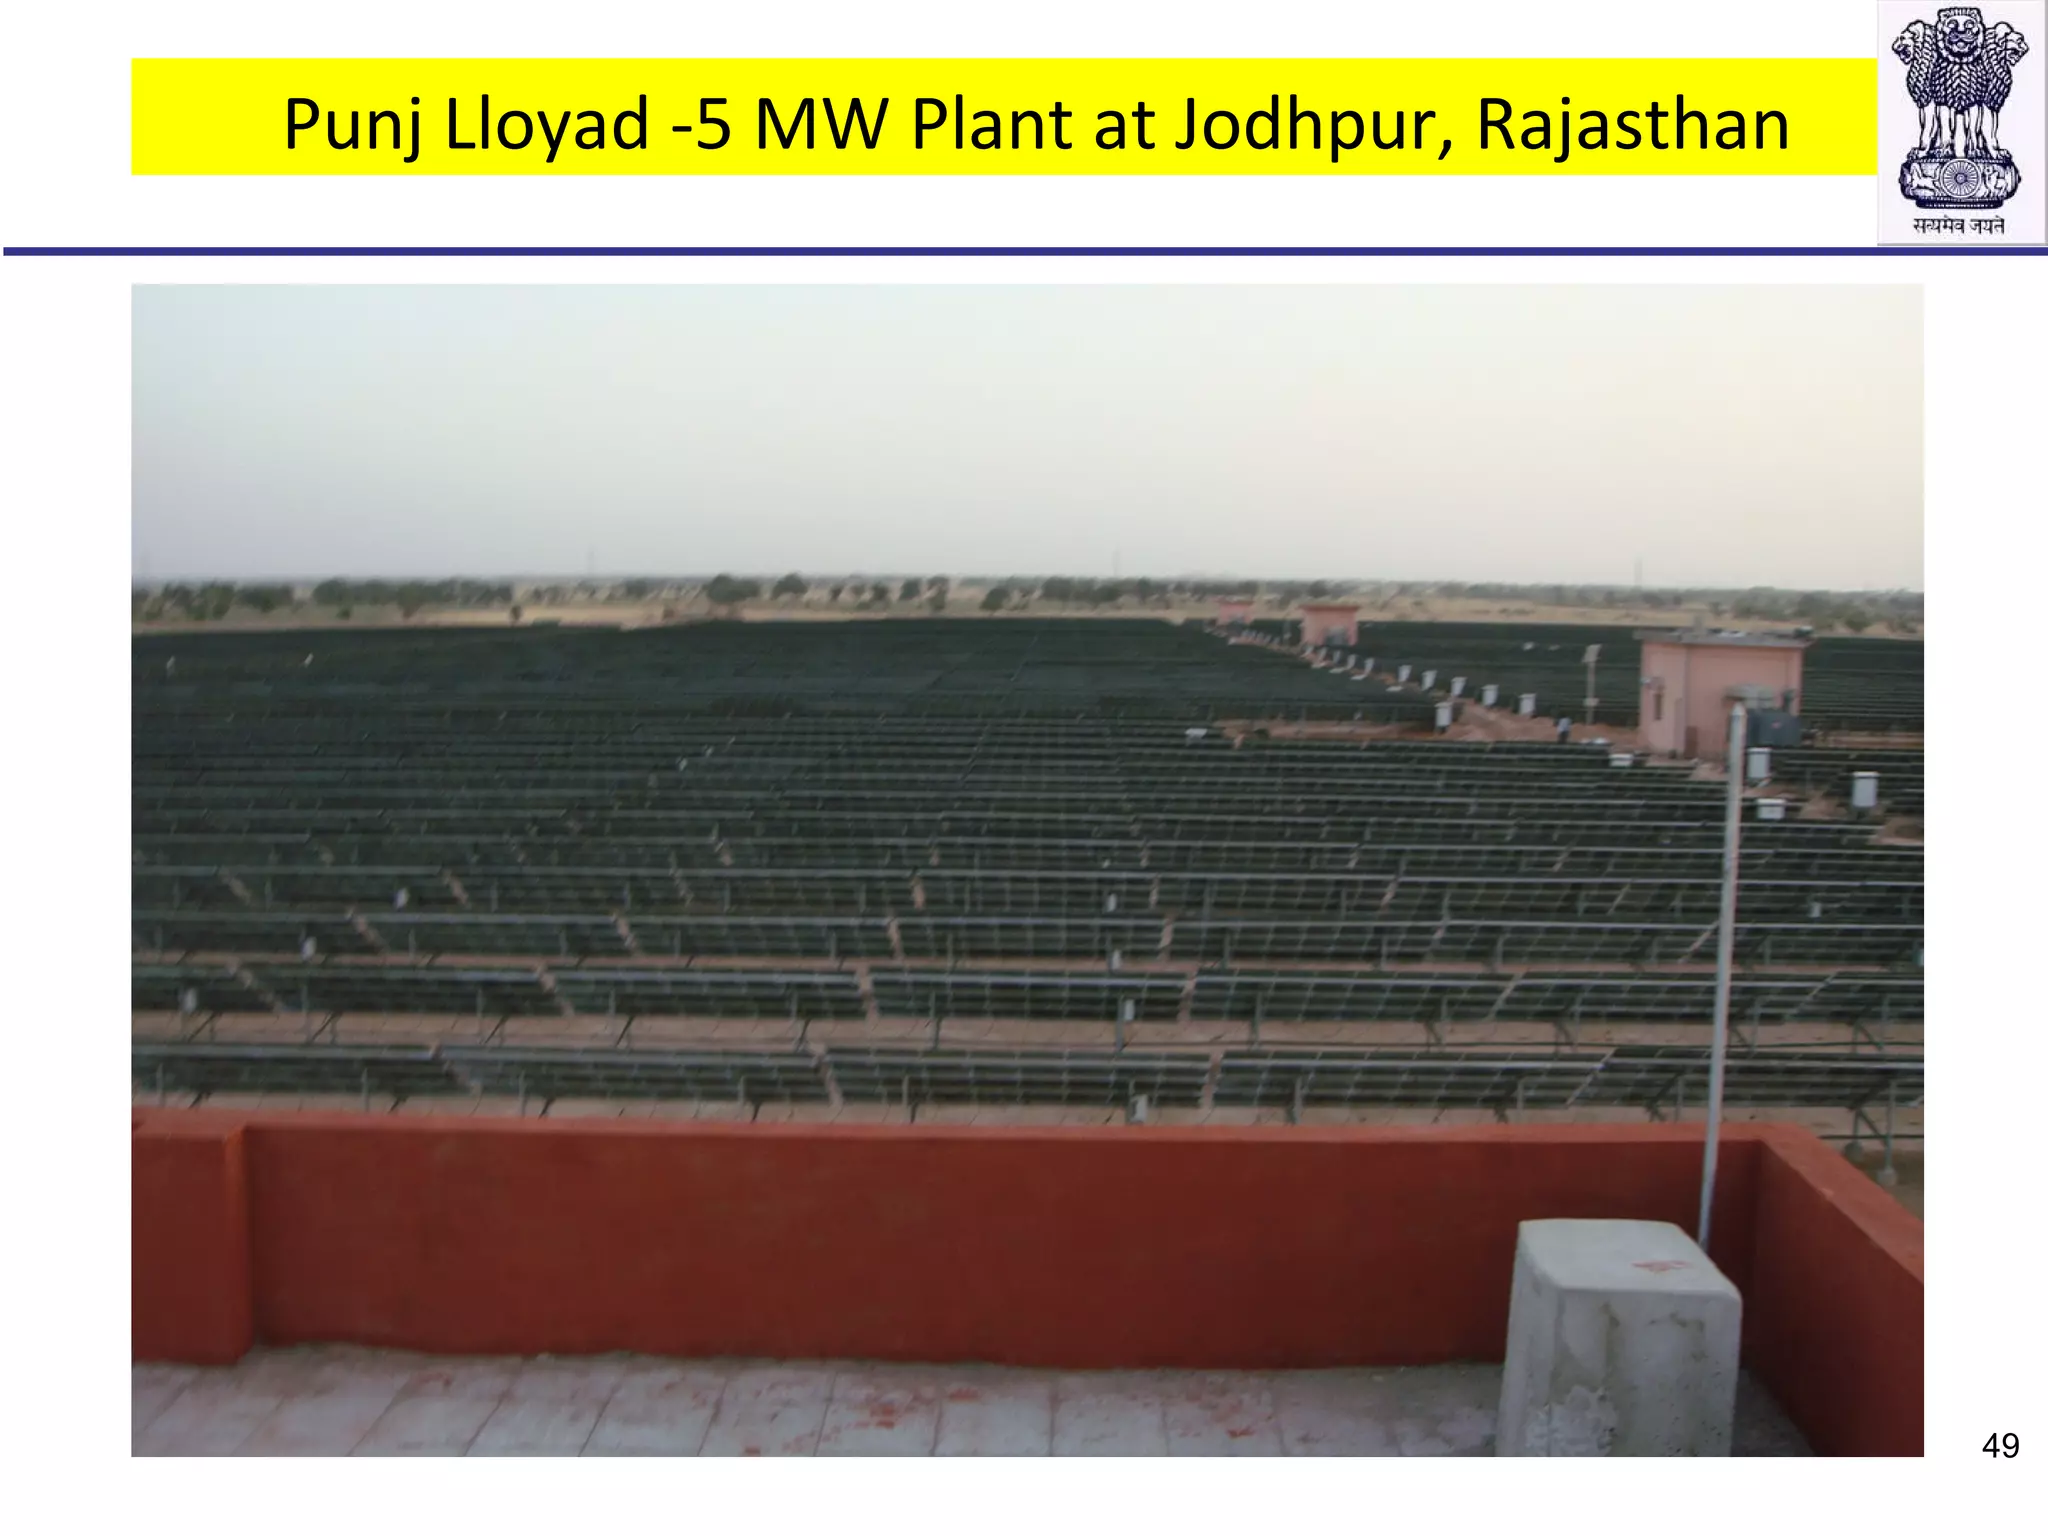
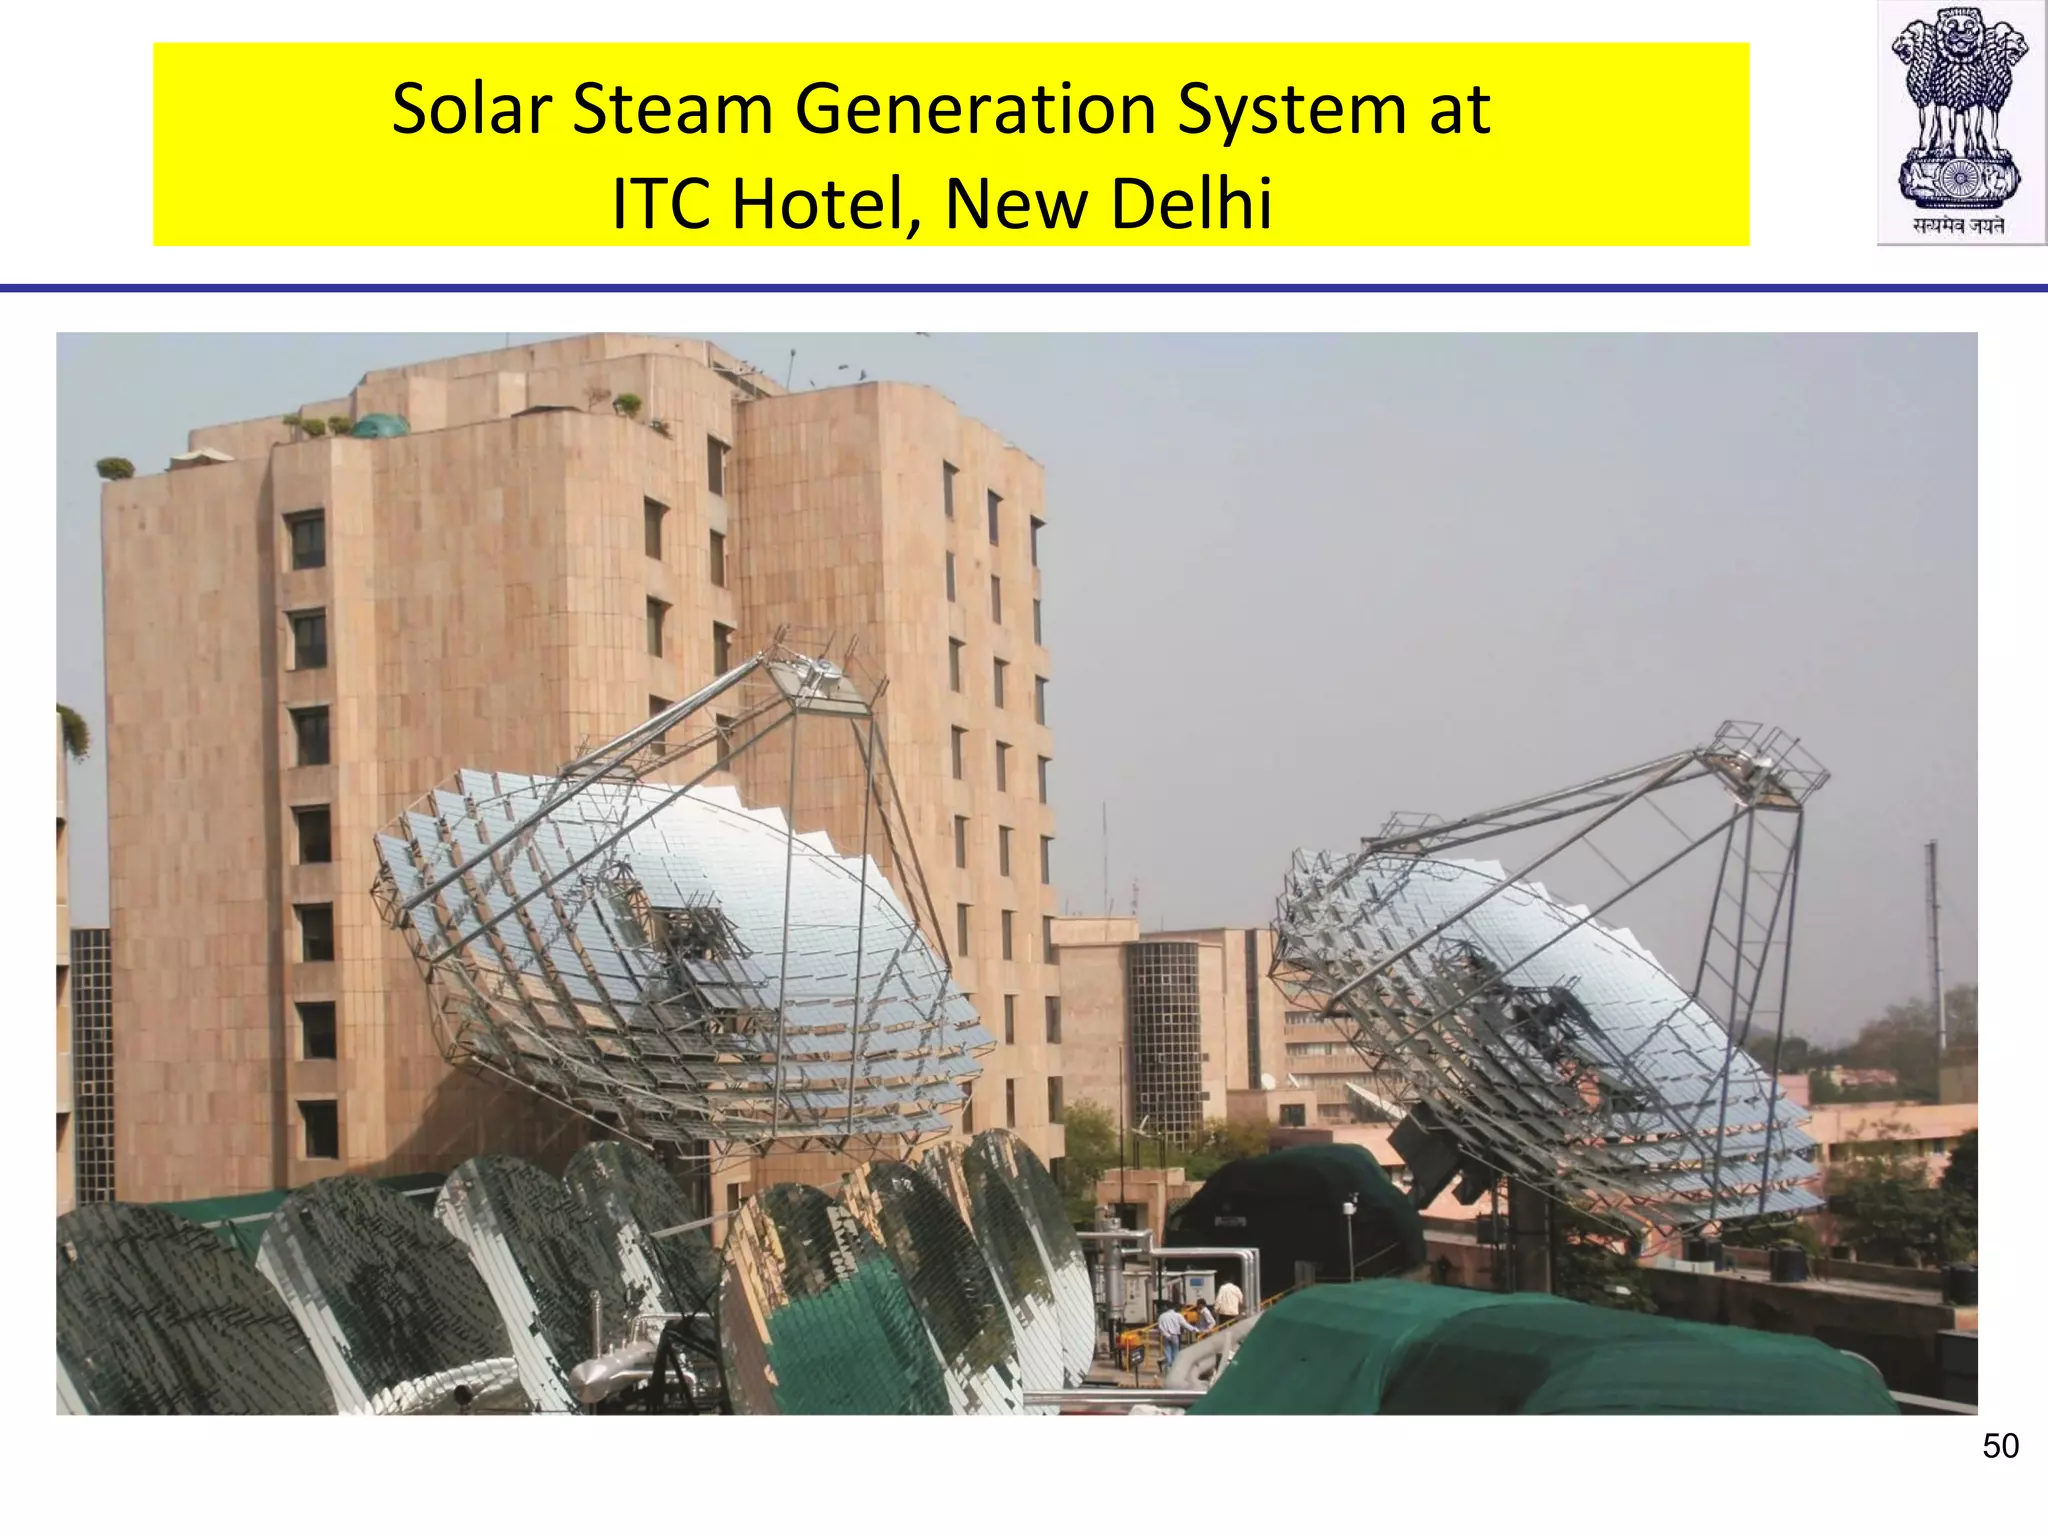
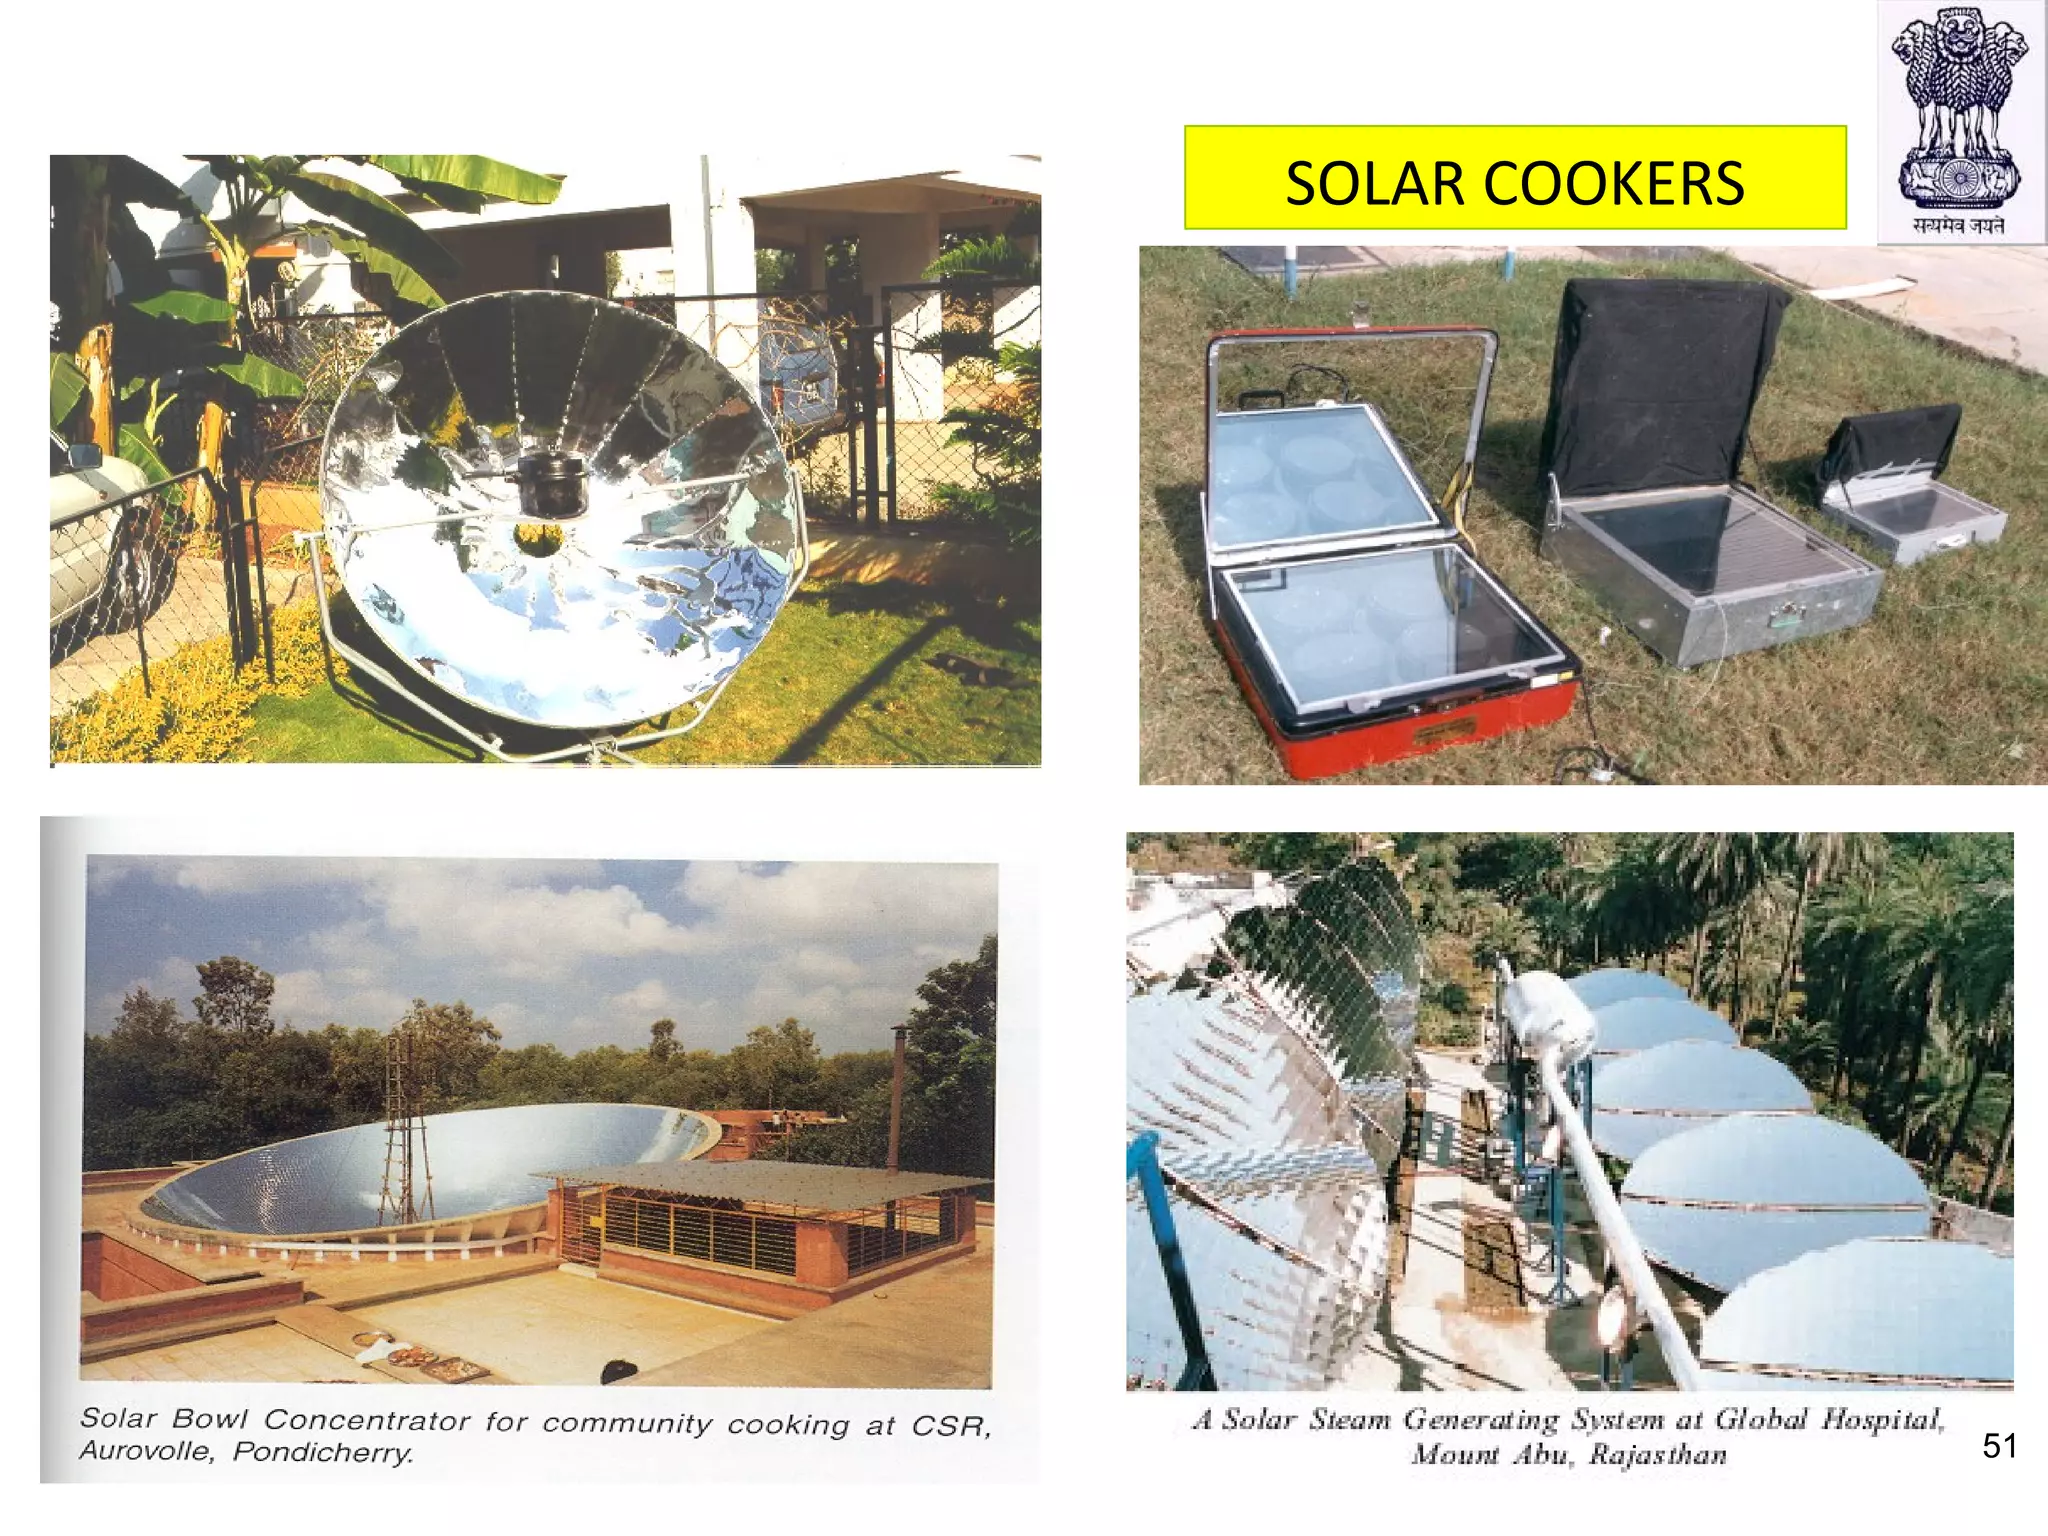
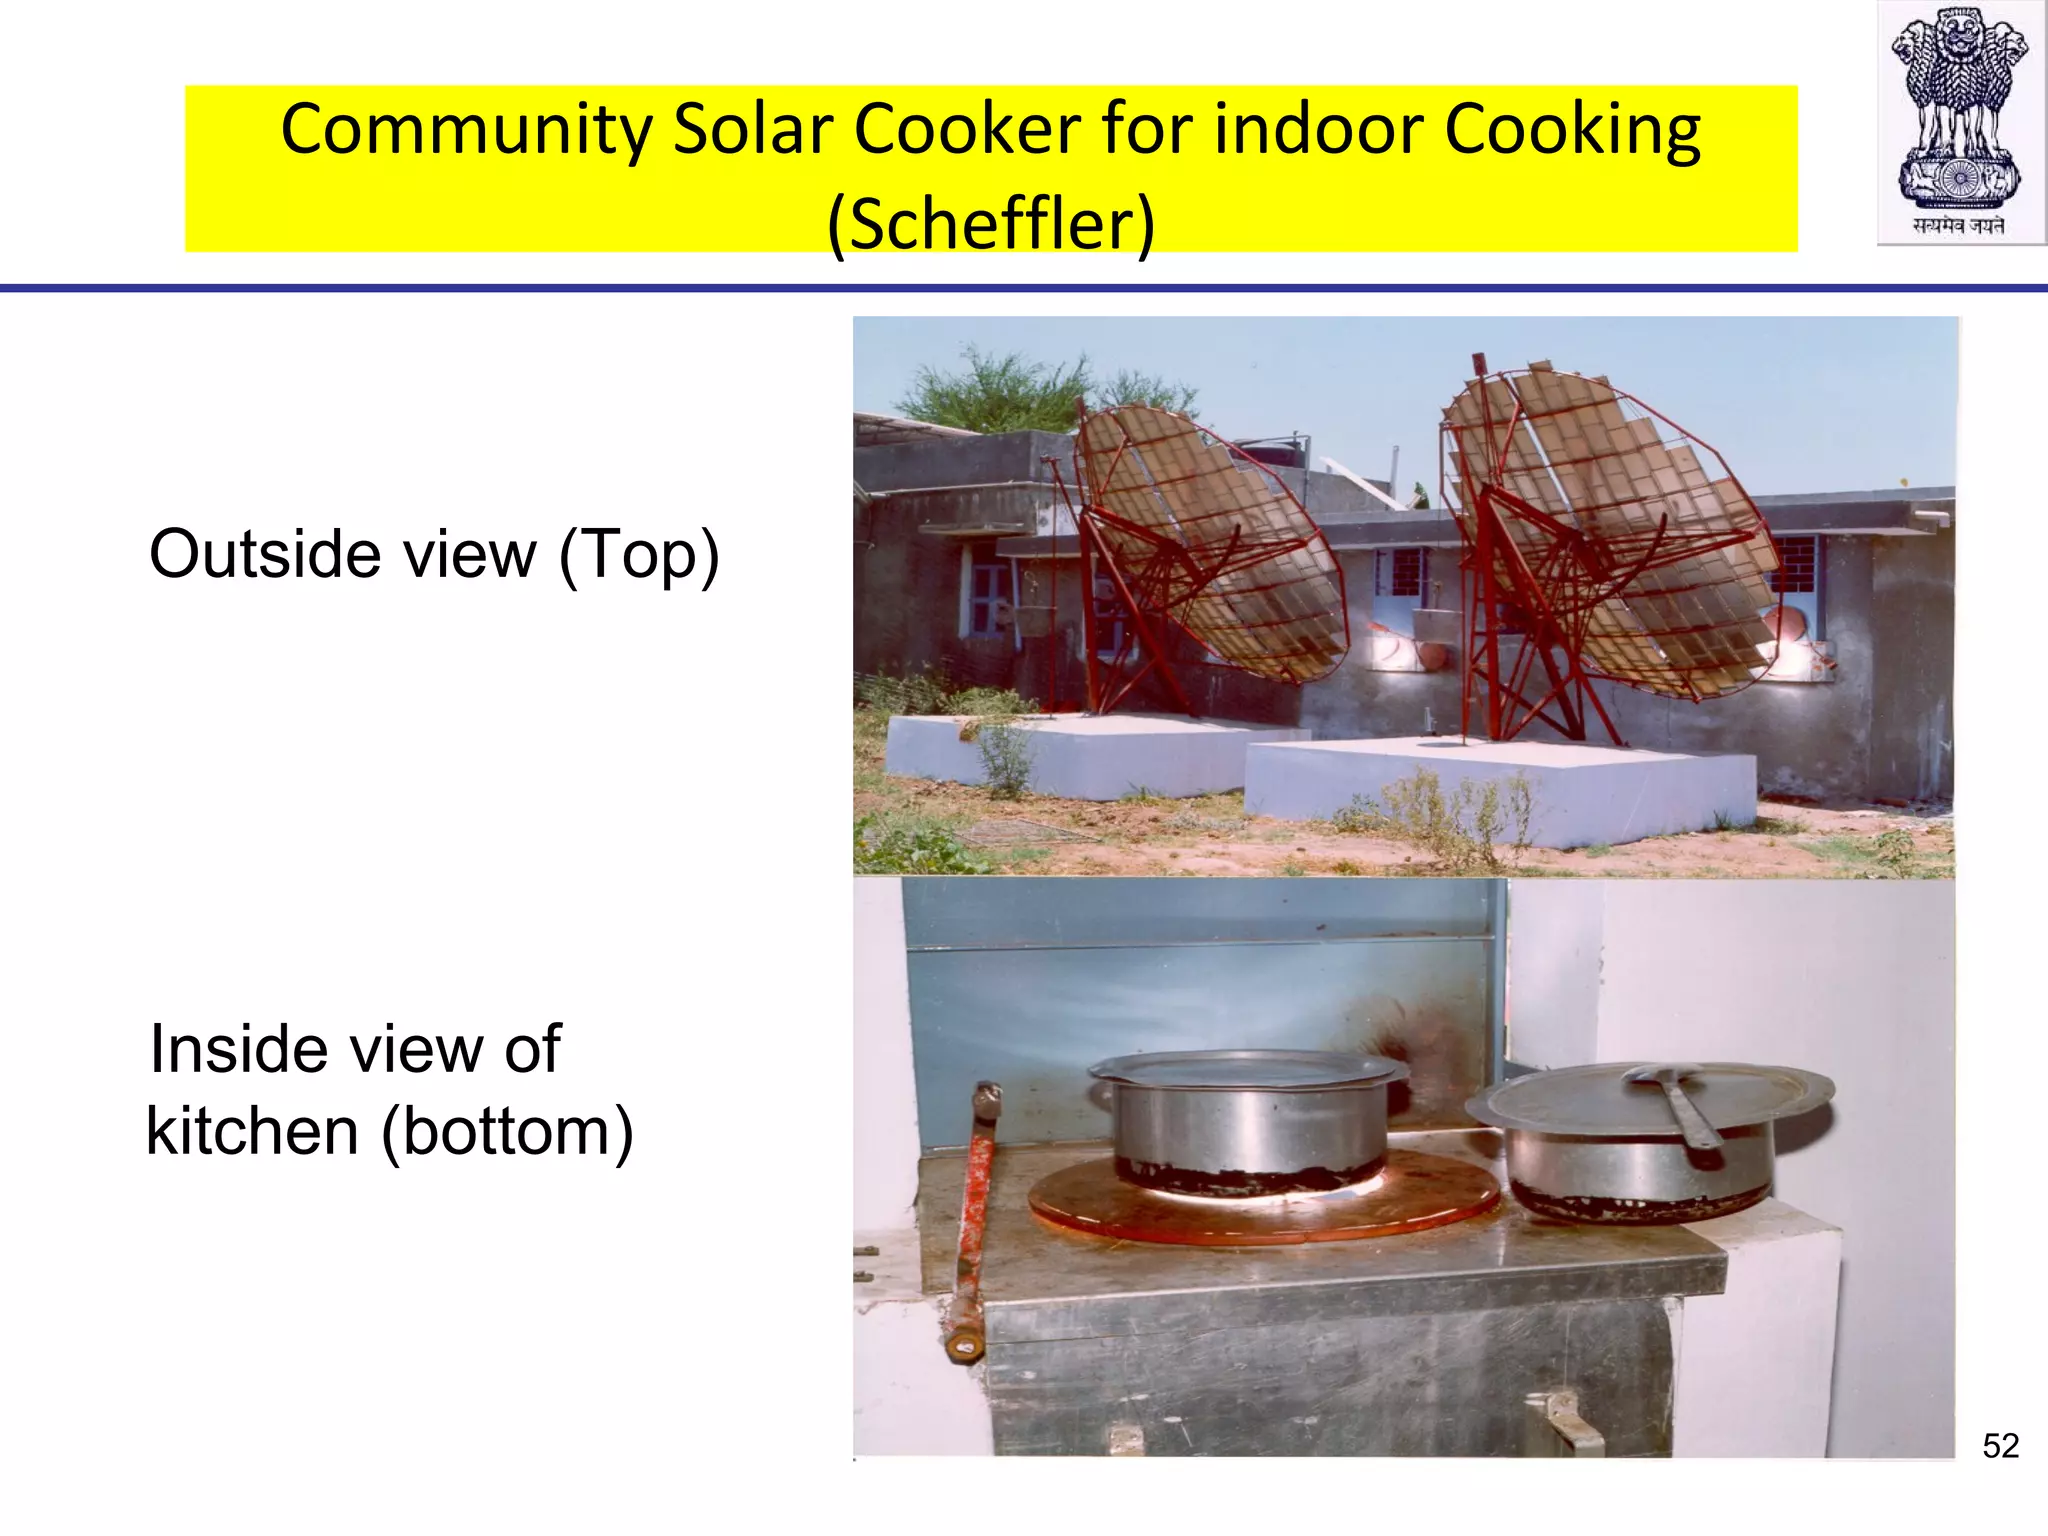
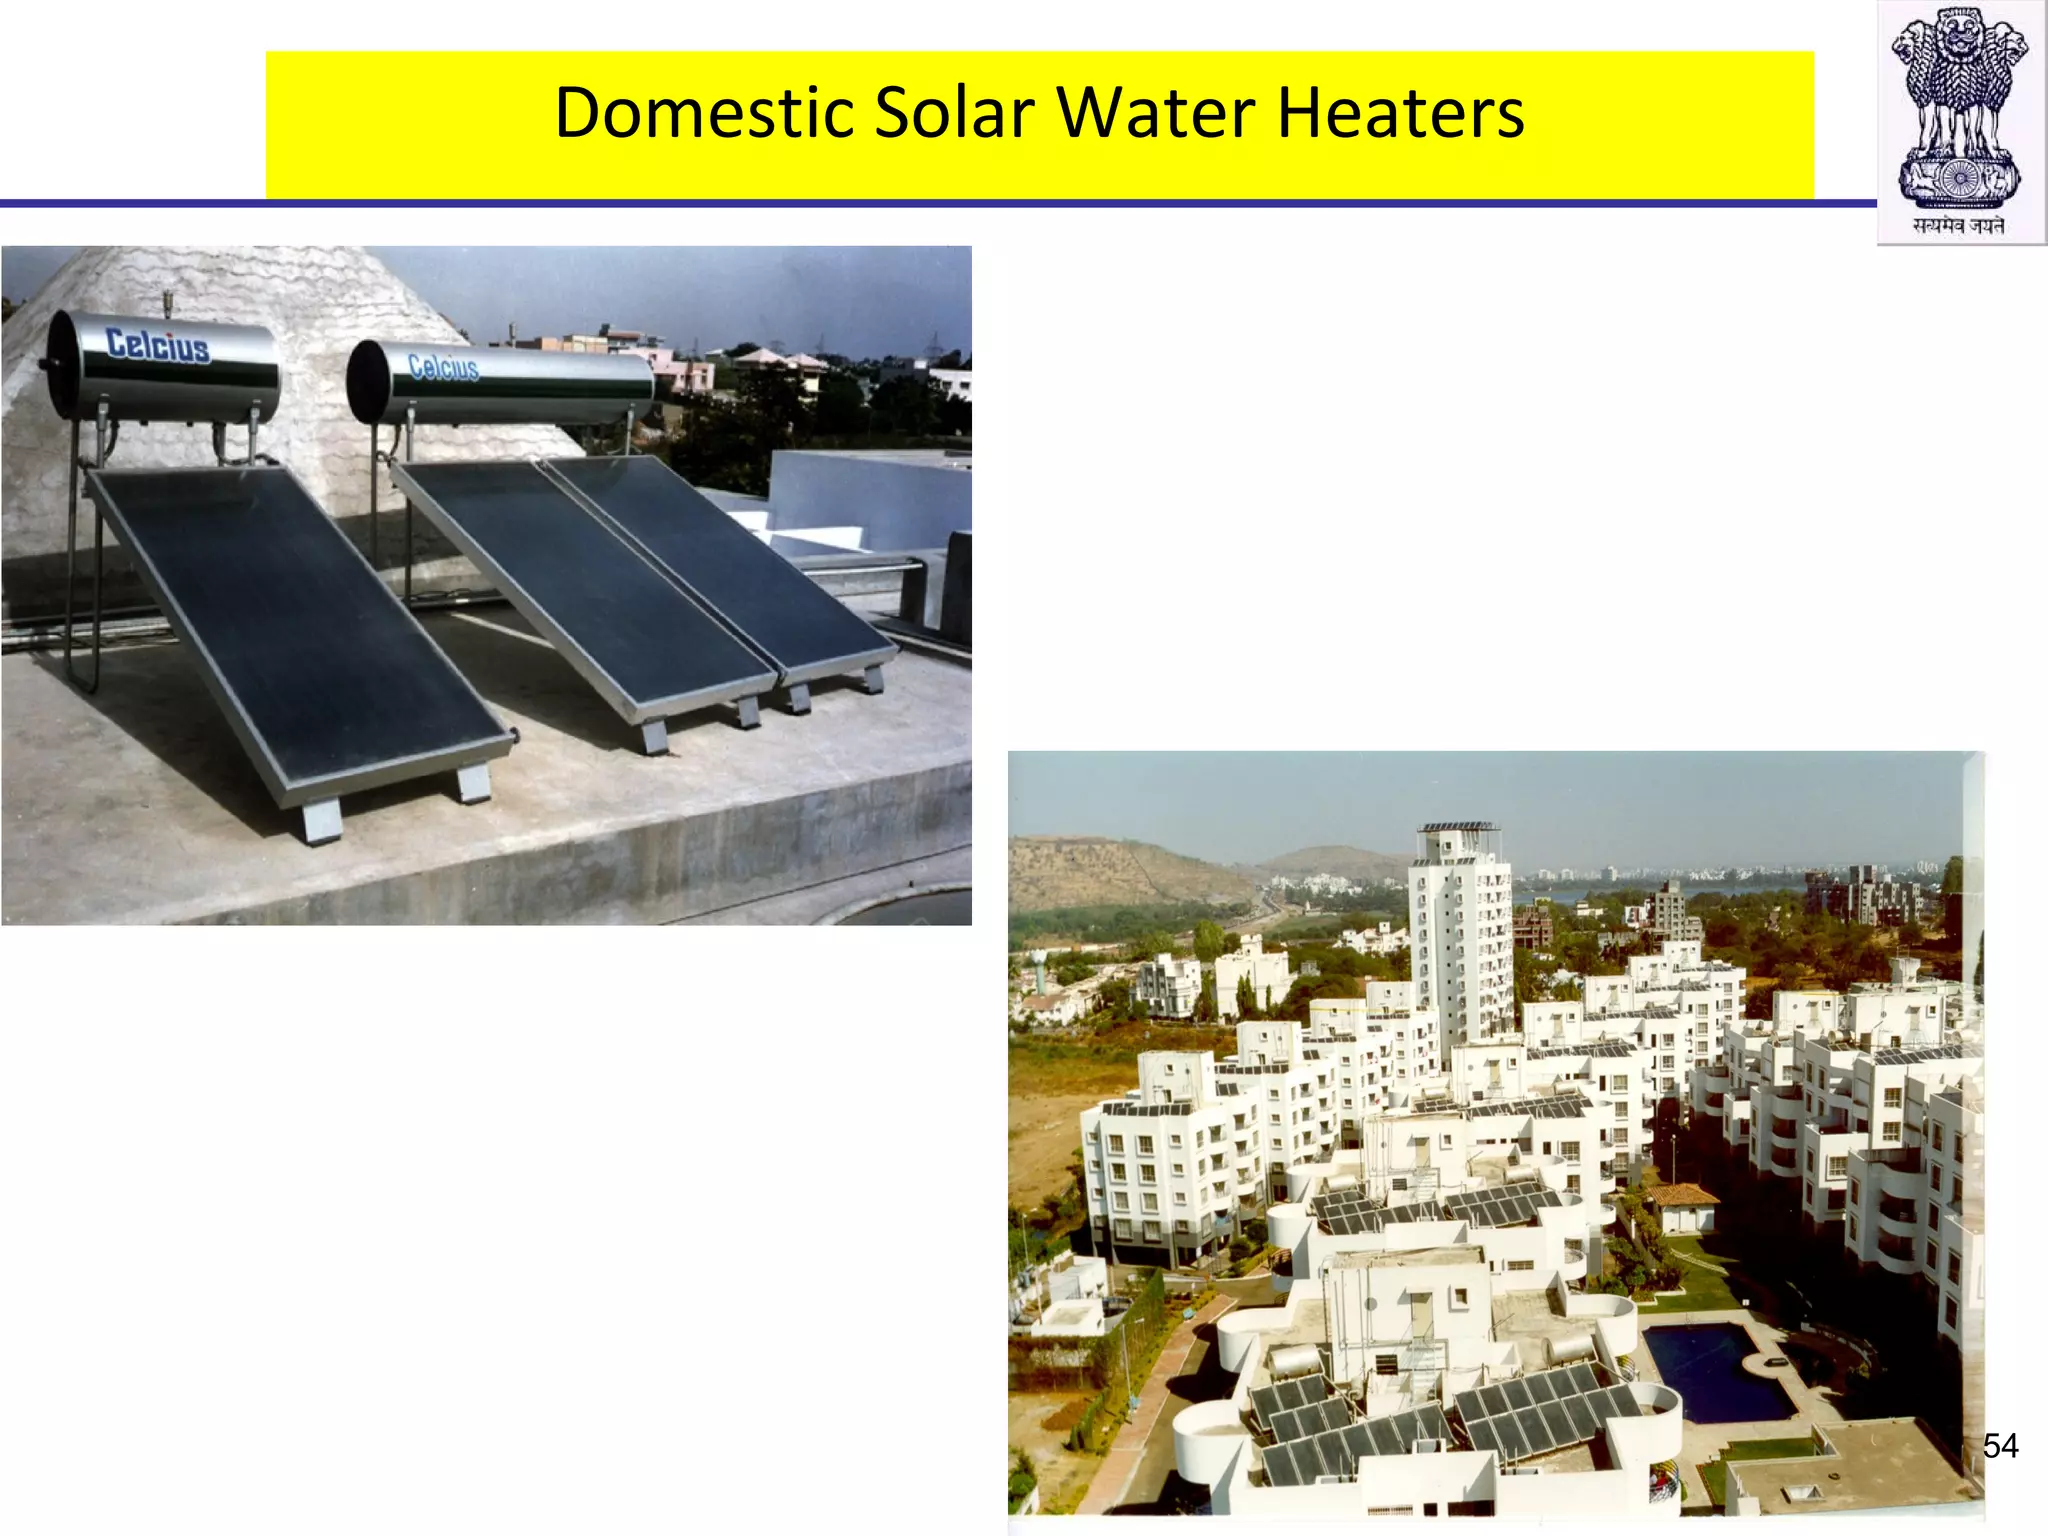
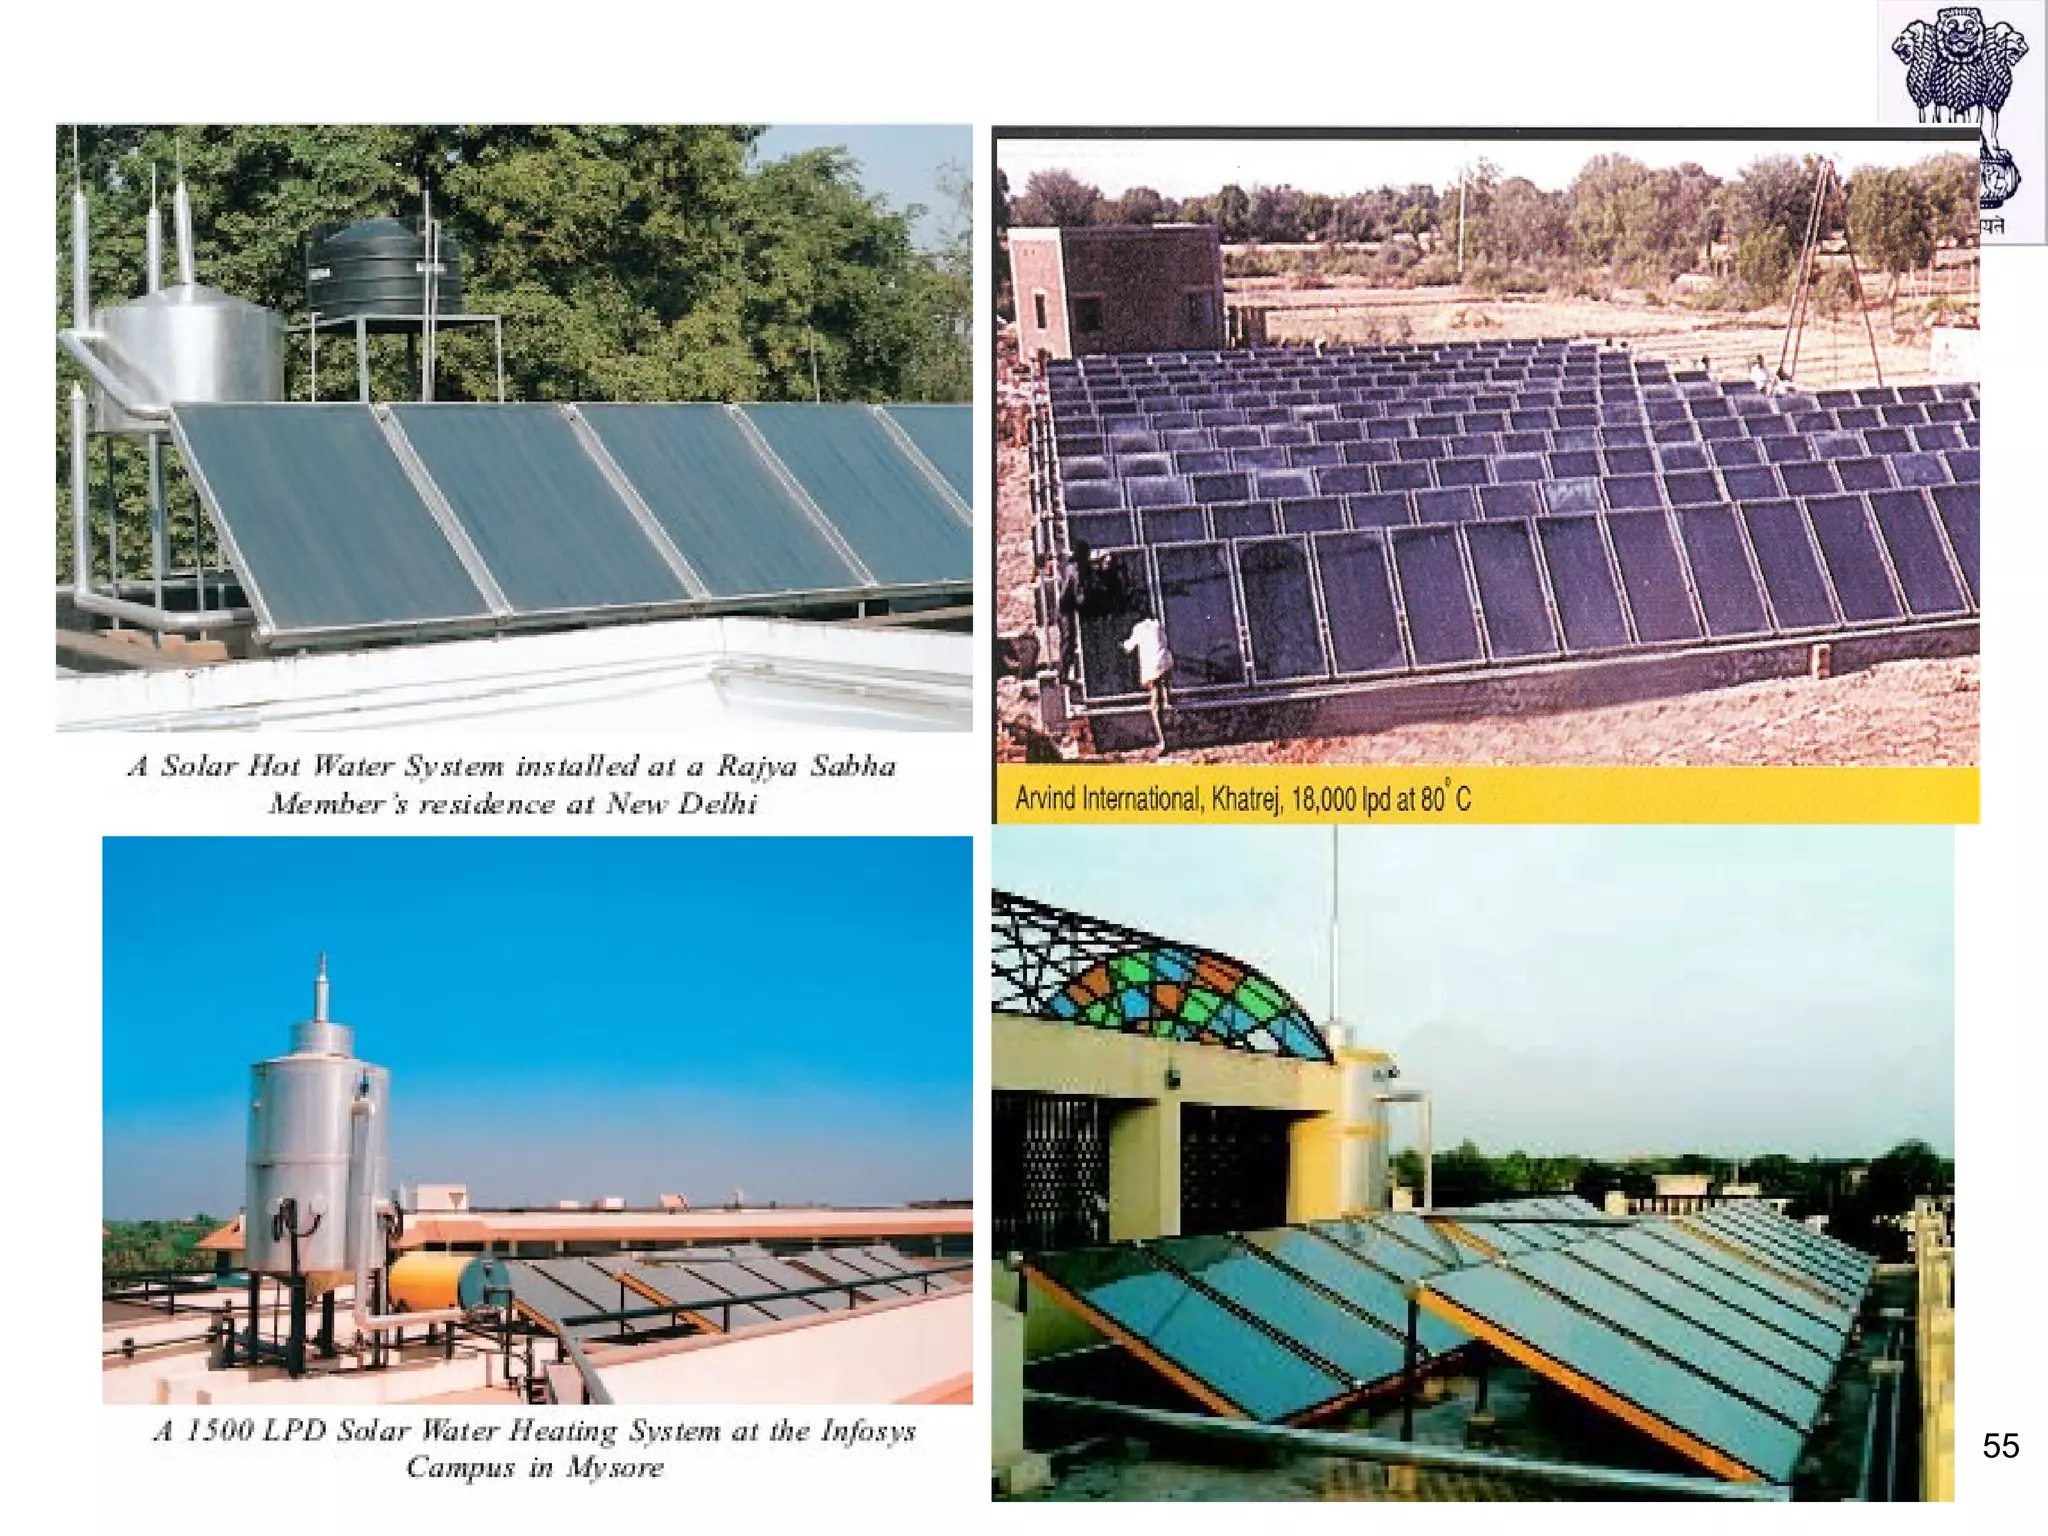
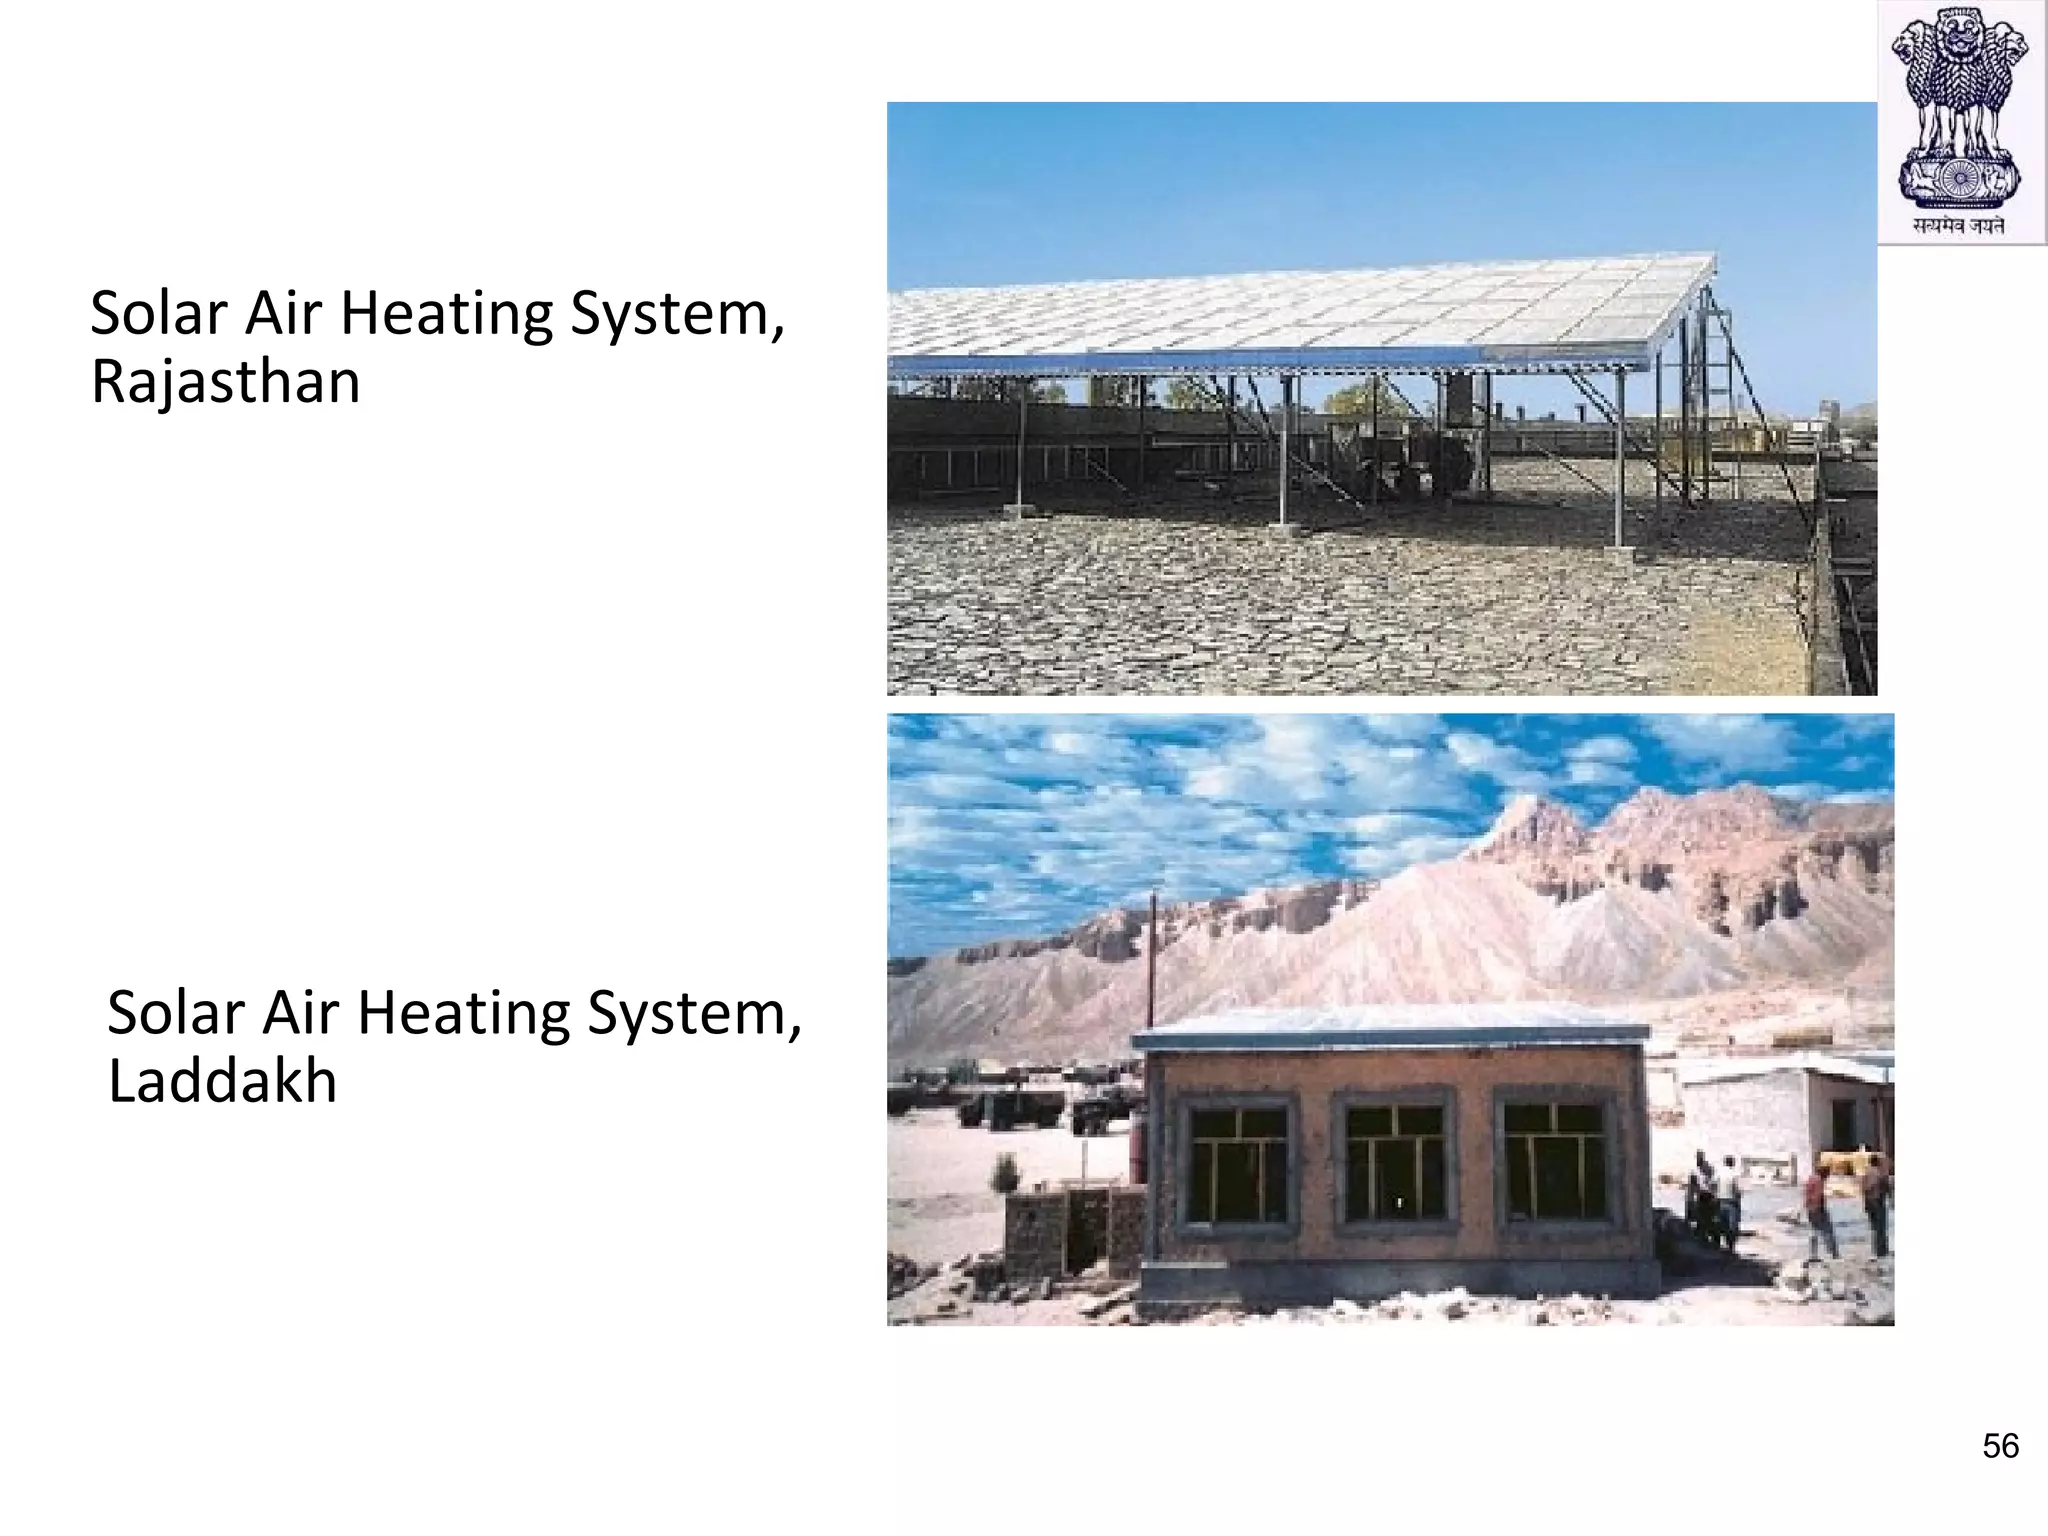
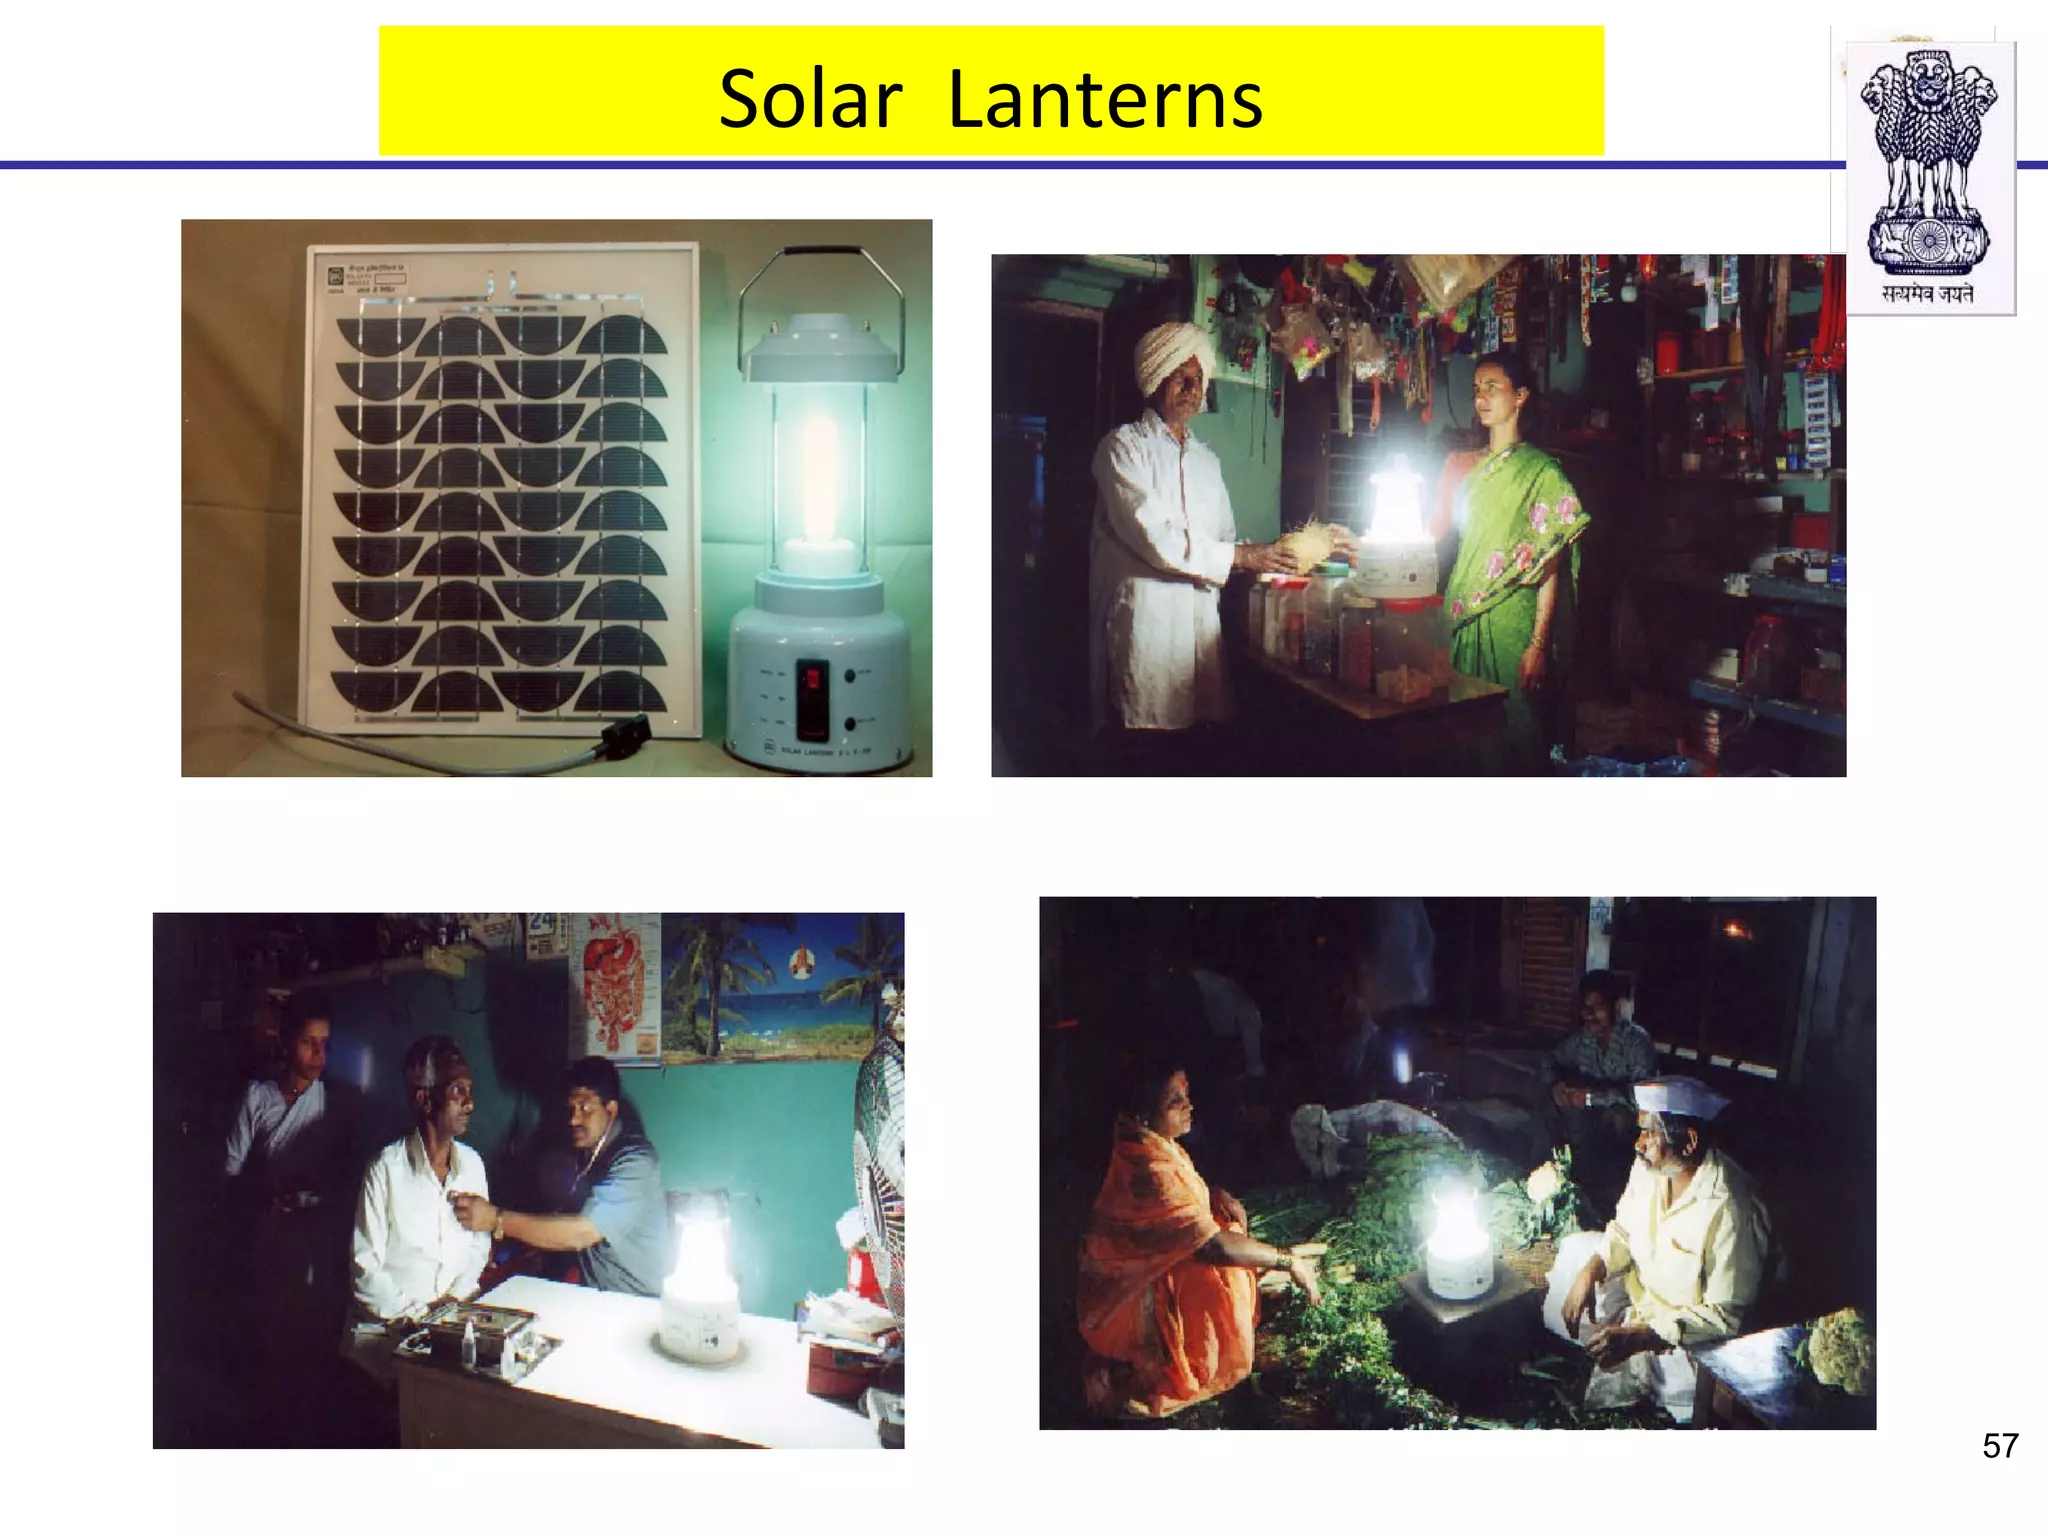
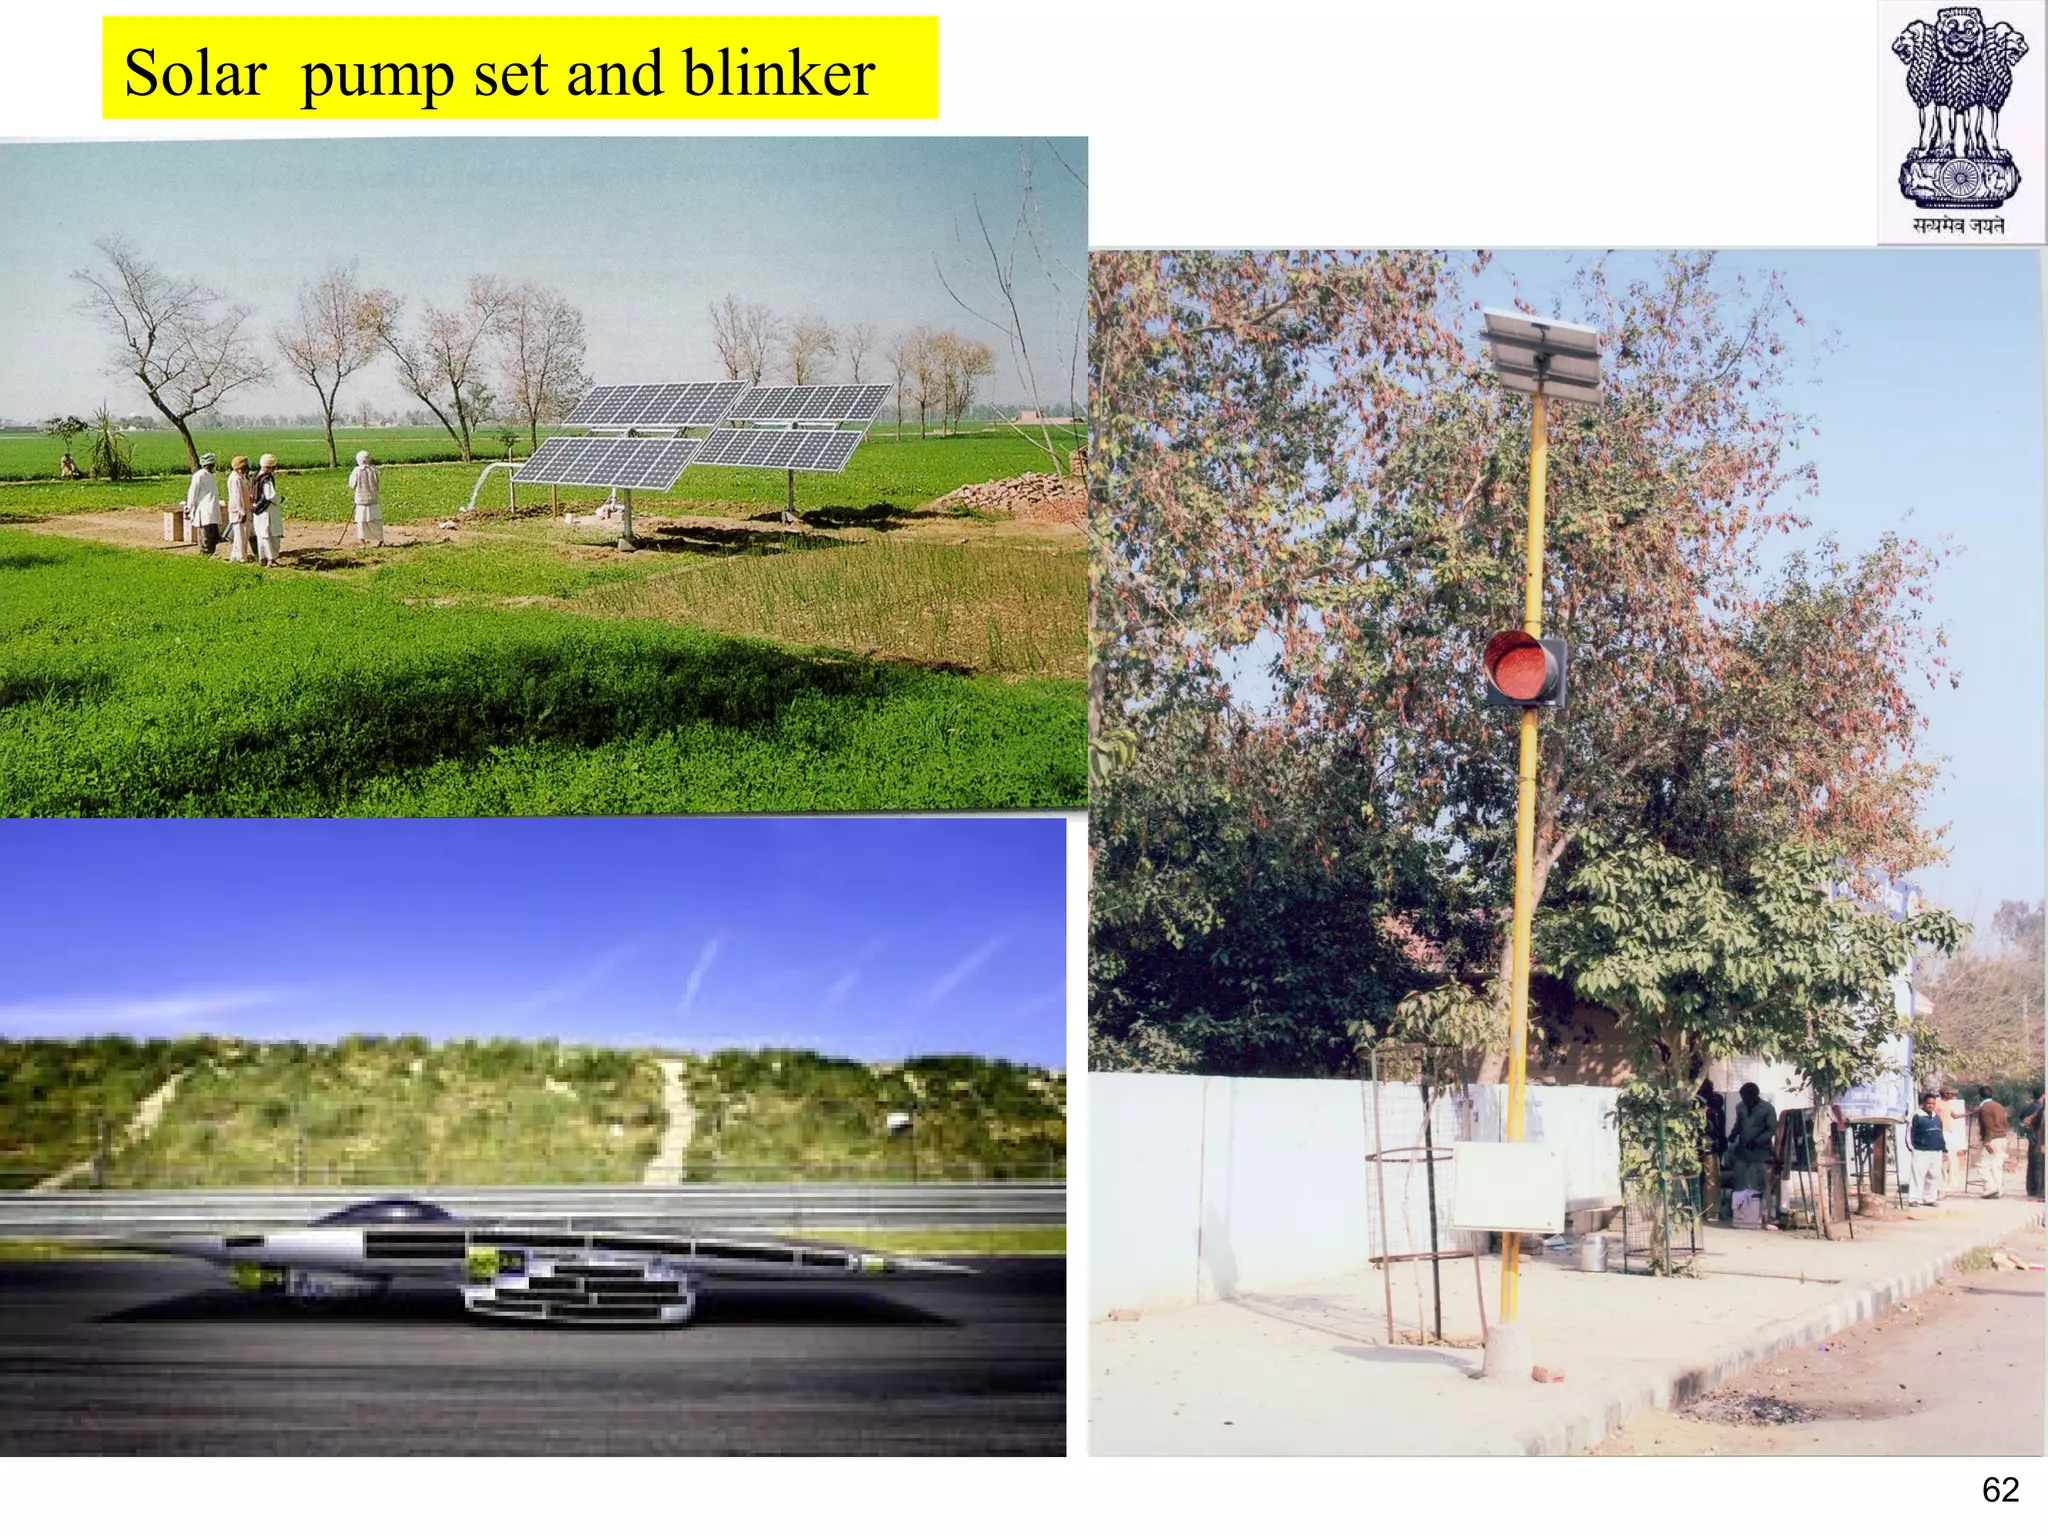
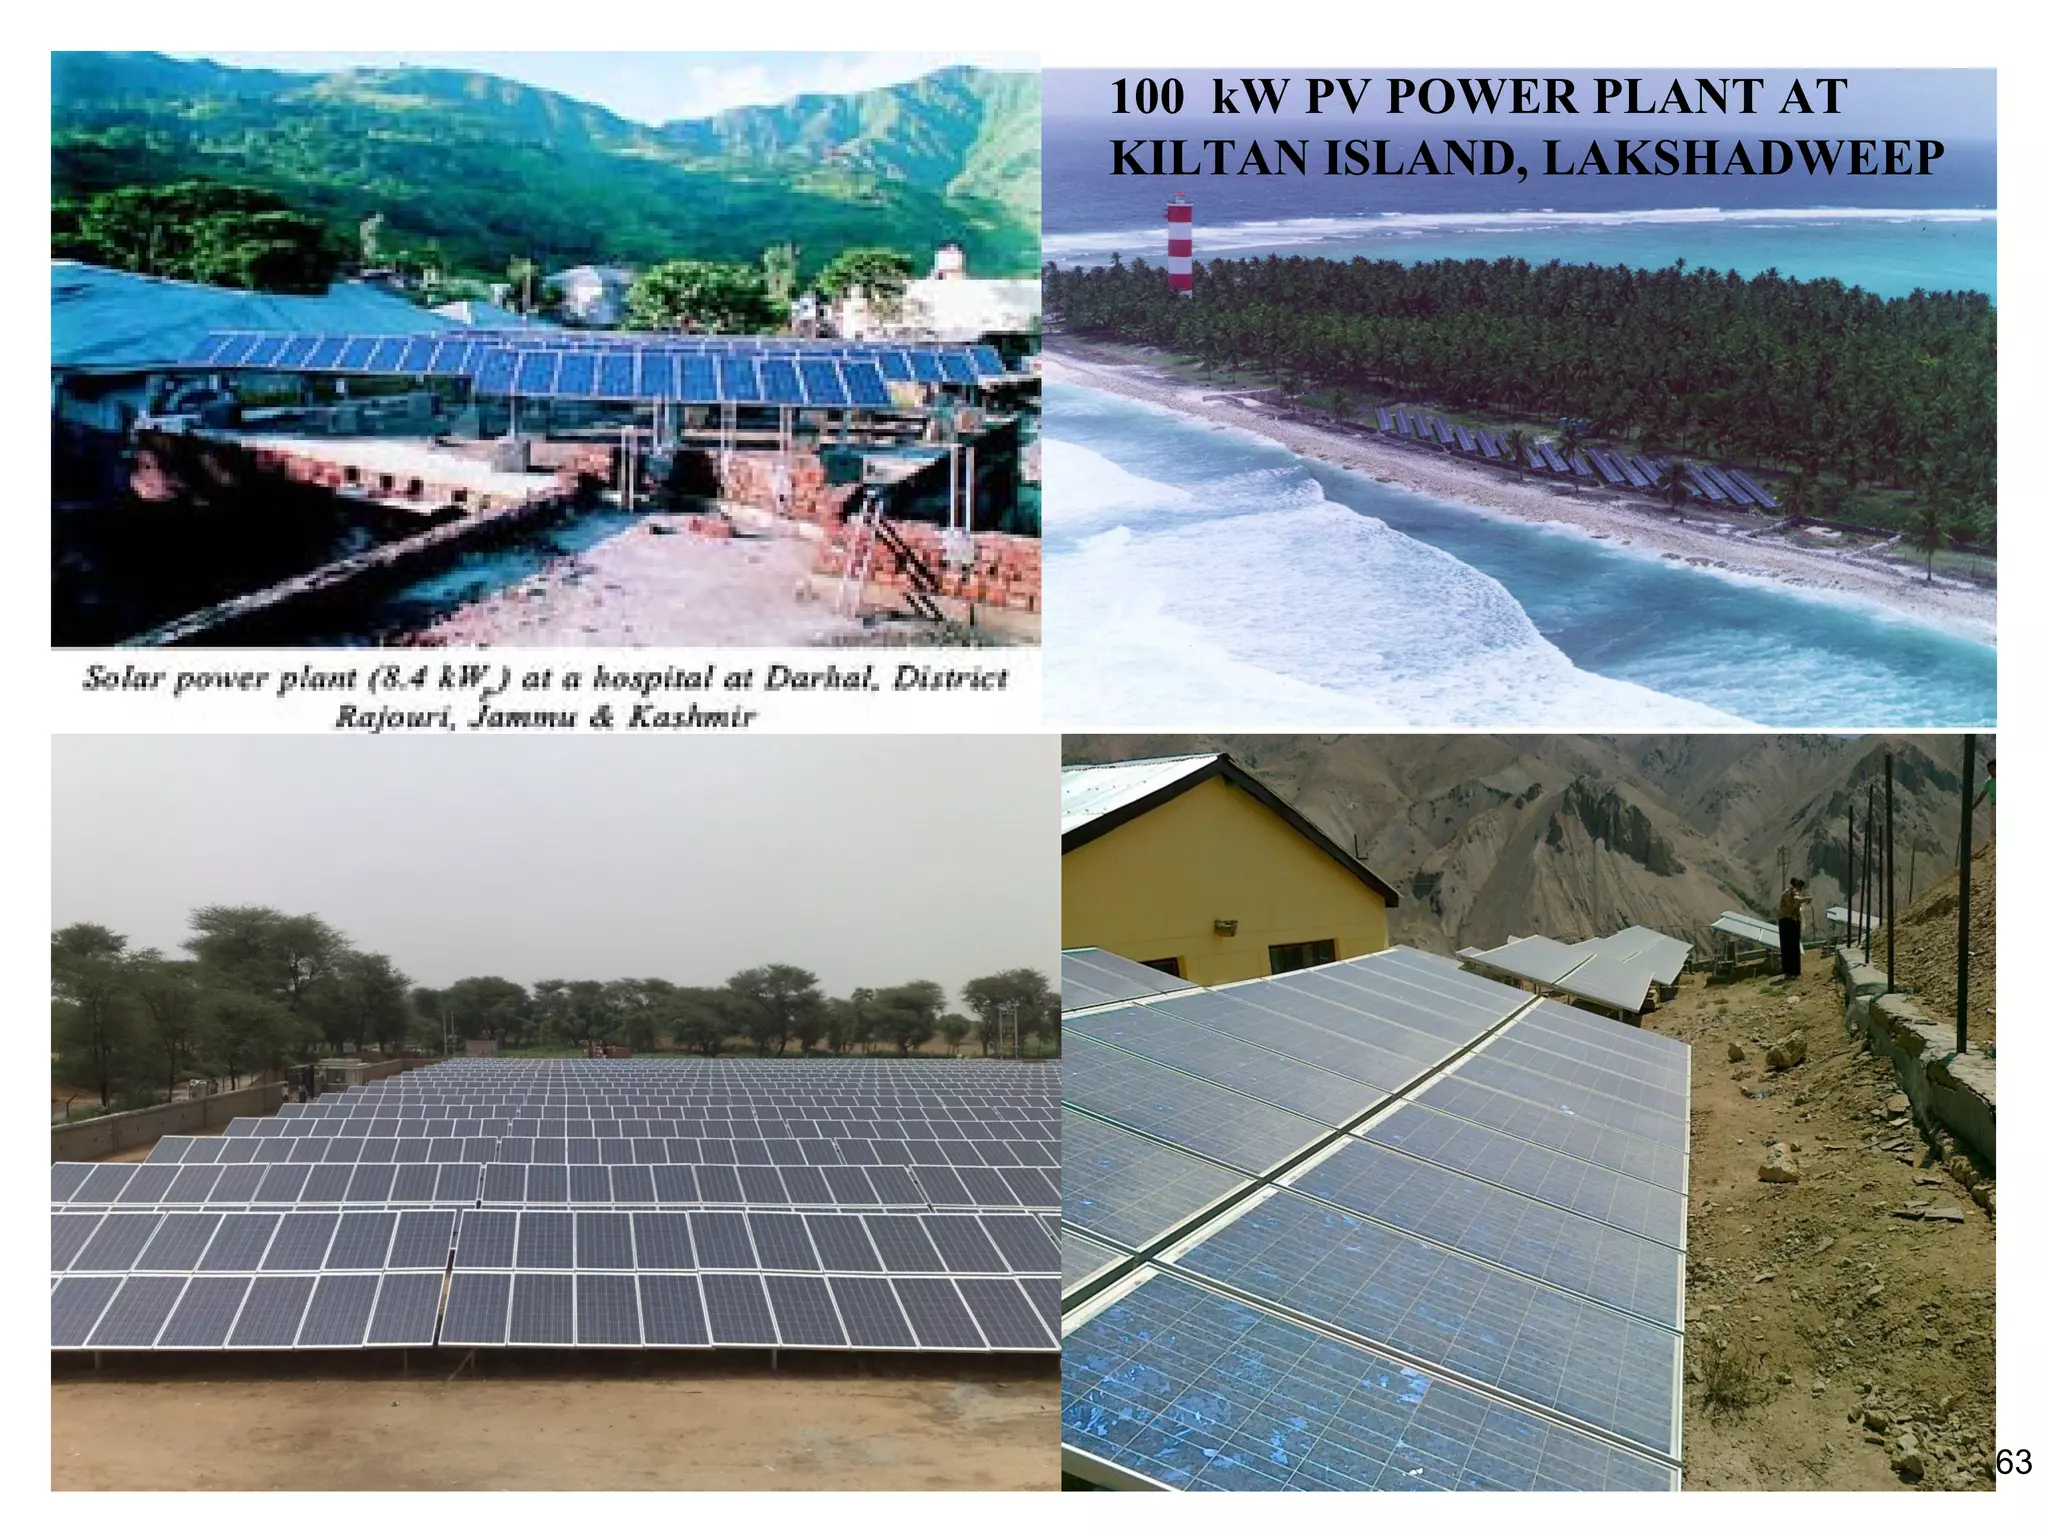
- Solar capacity has grown to over 1 GW and targets are 20 GW by 2022. Subsidy programs support grid-connected and off-grid solar nationwide.
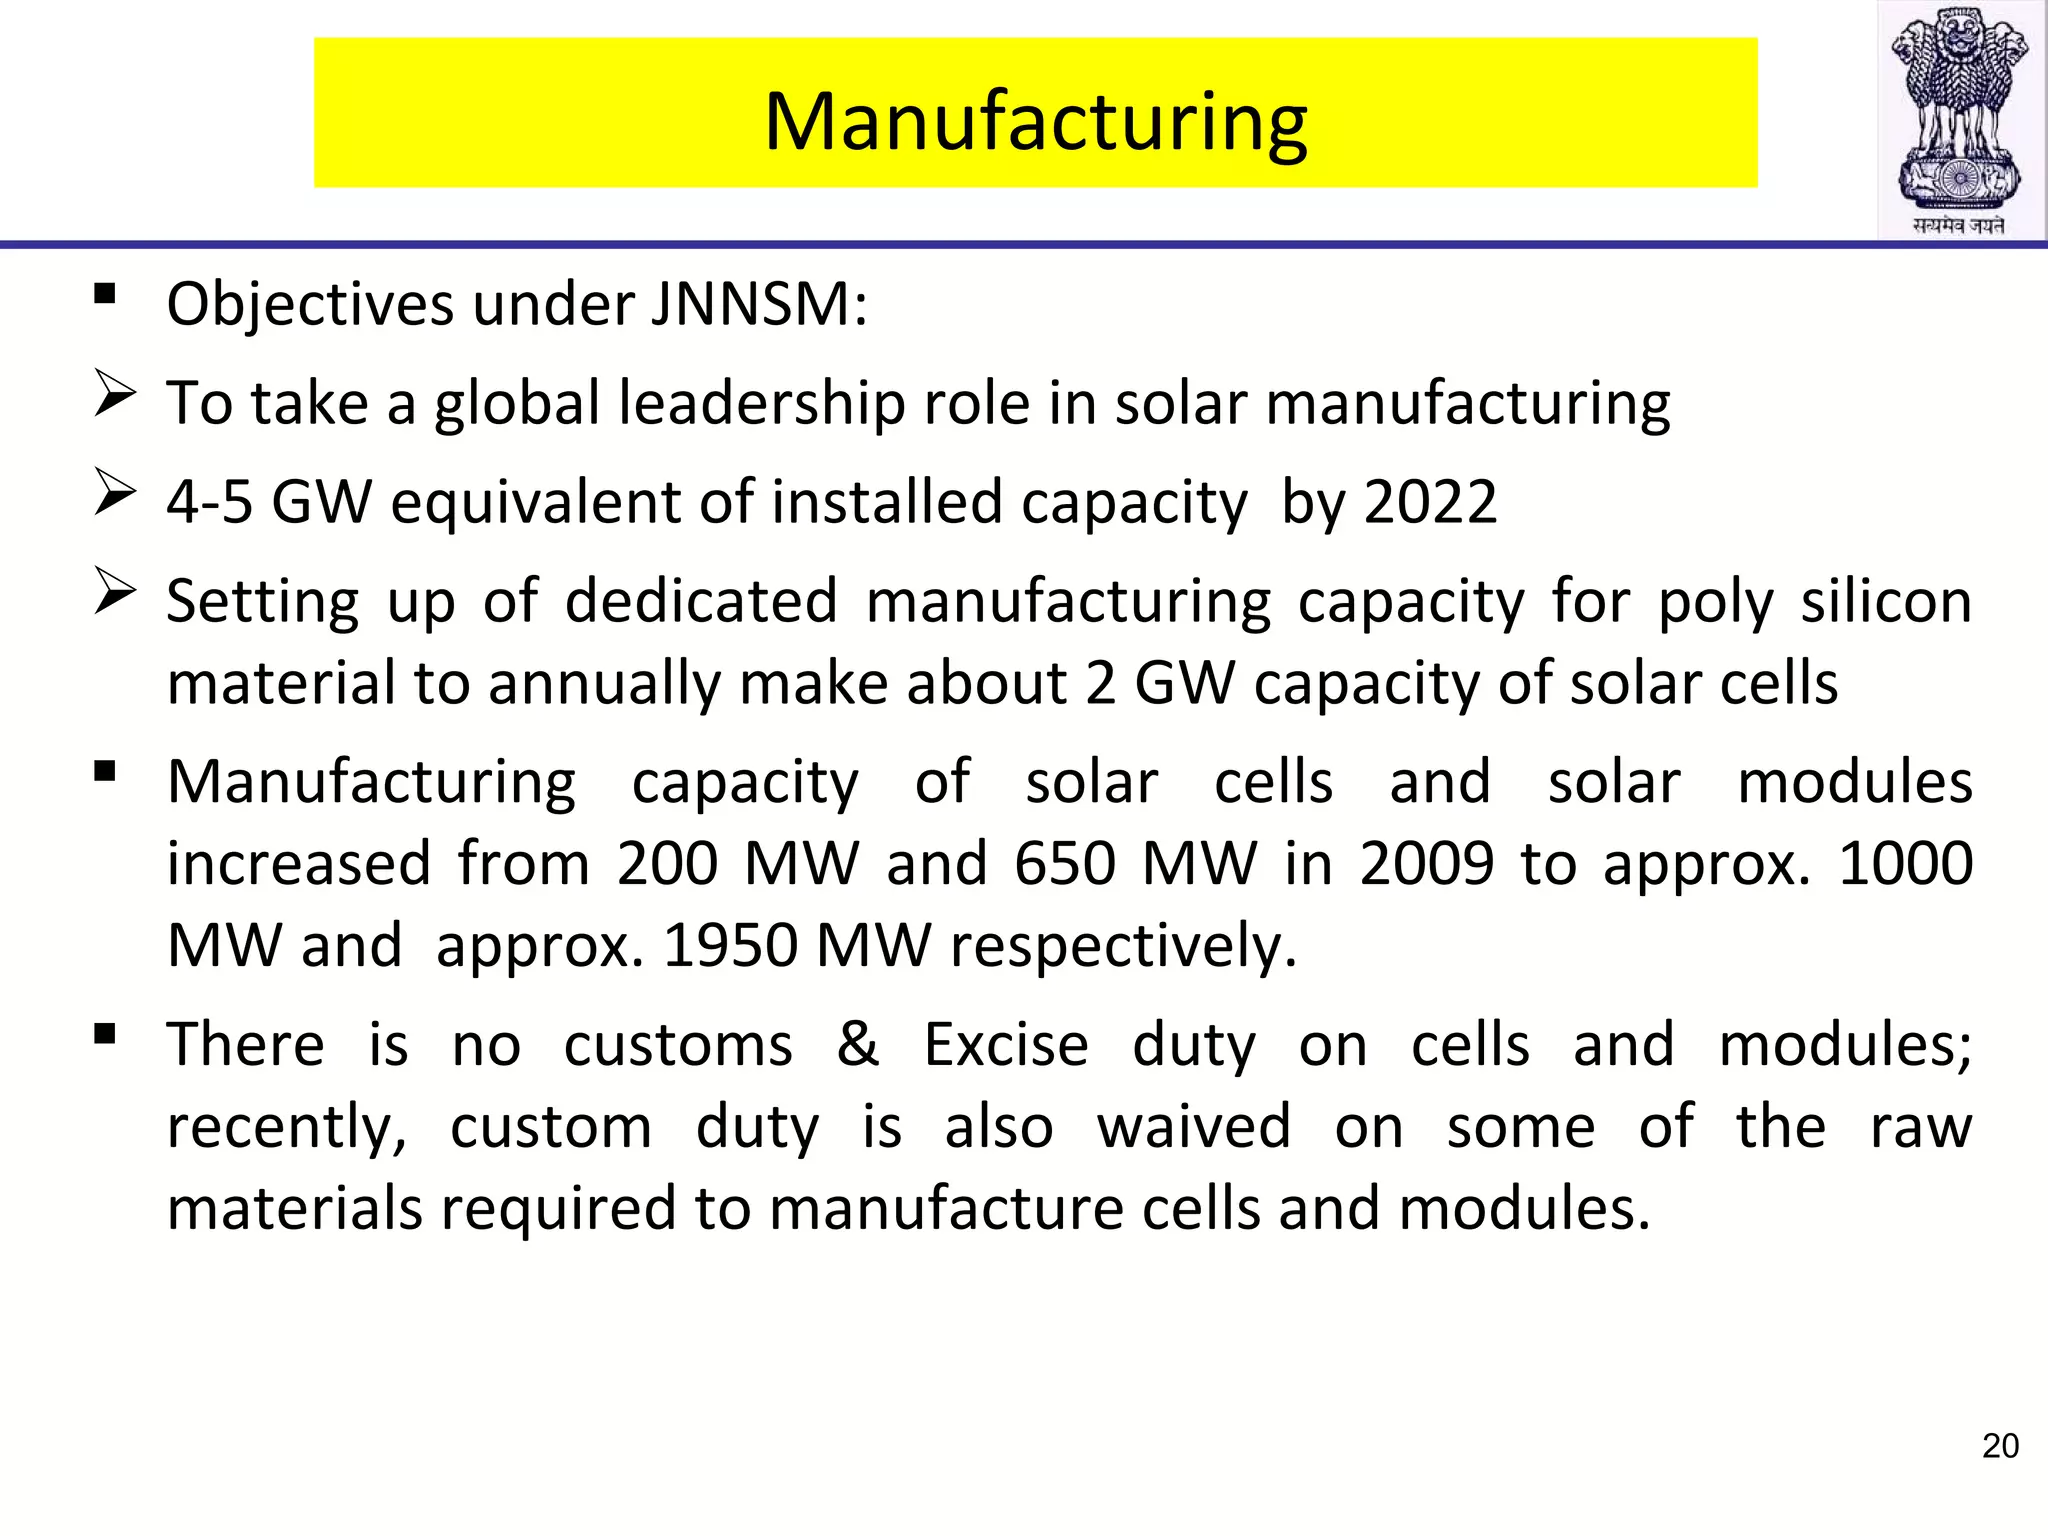
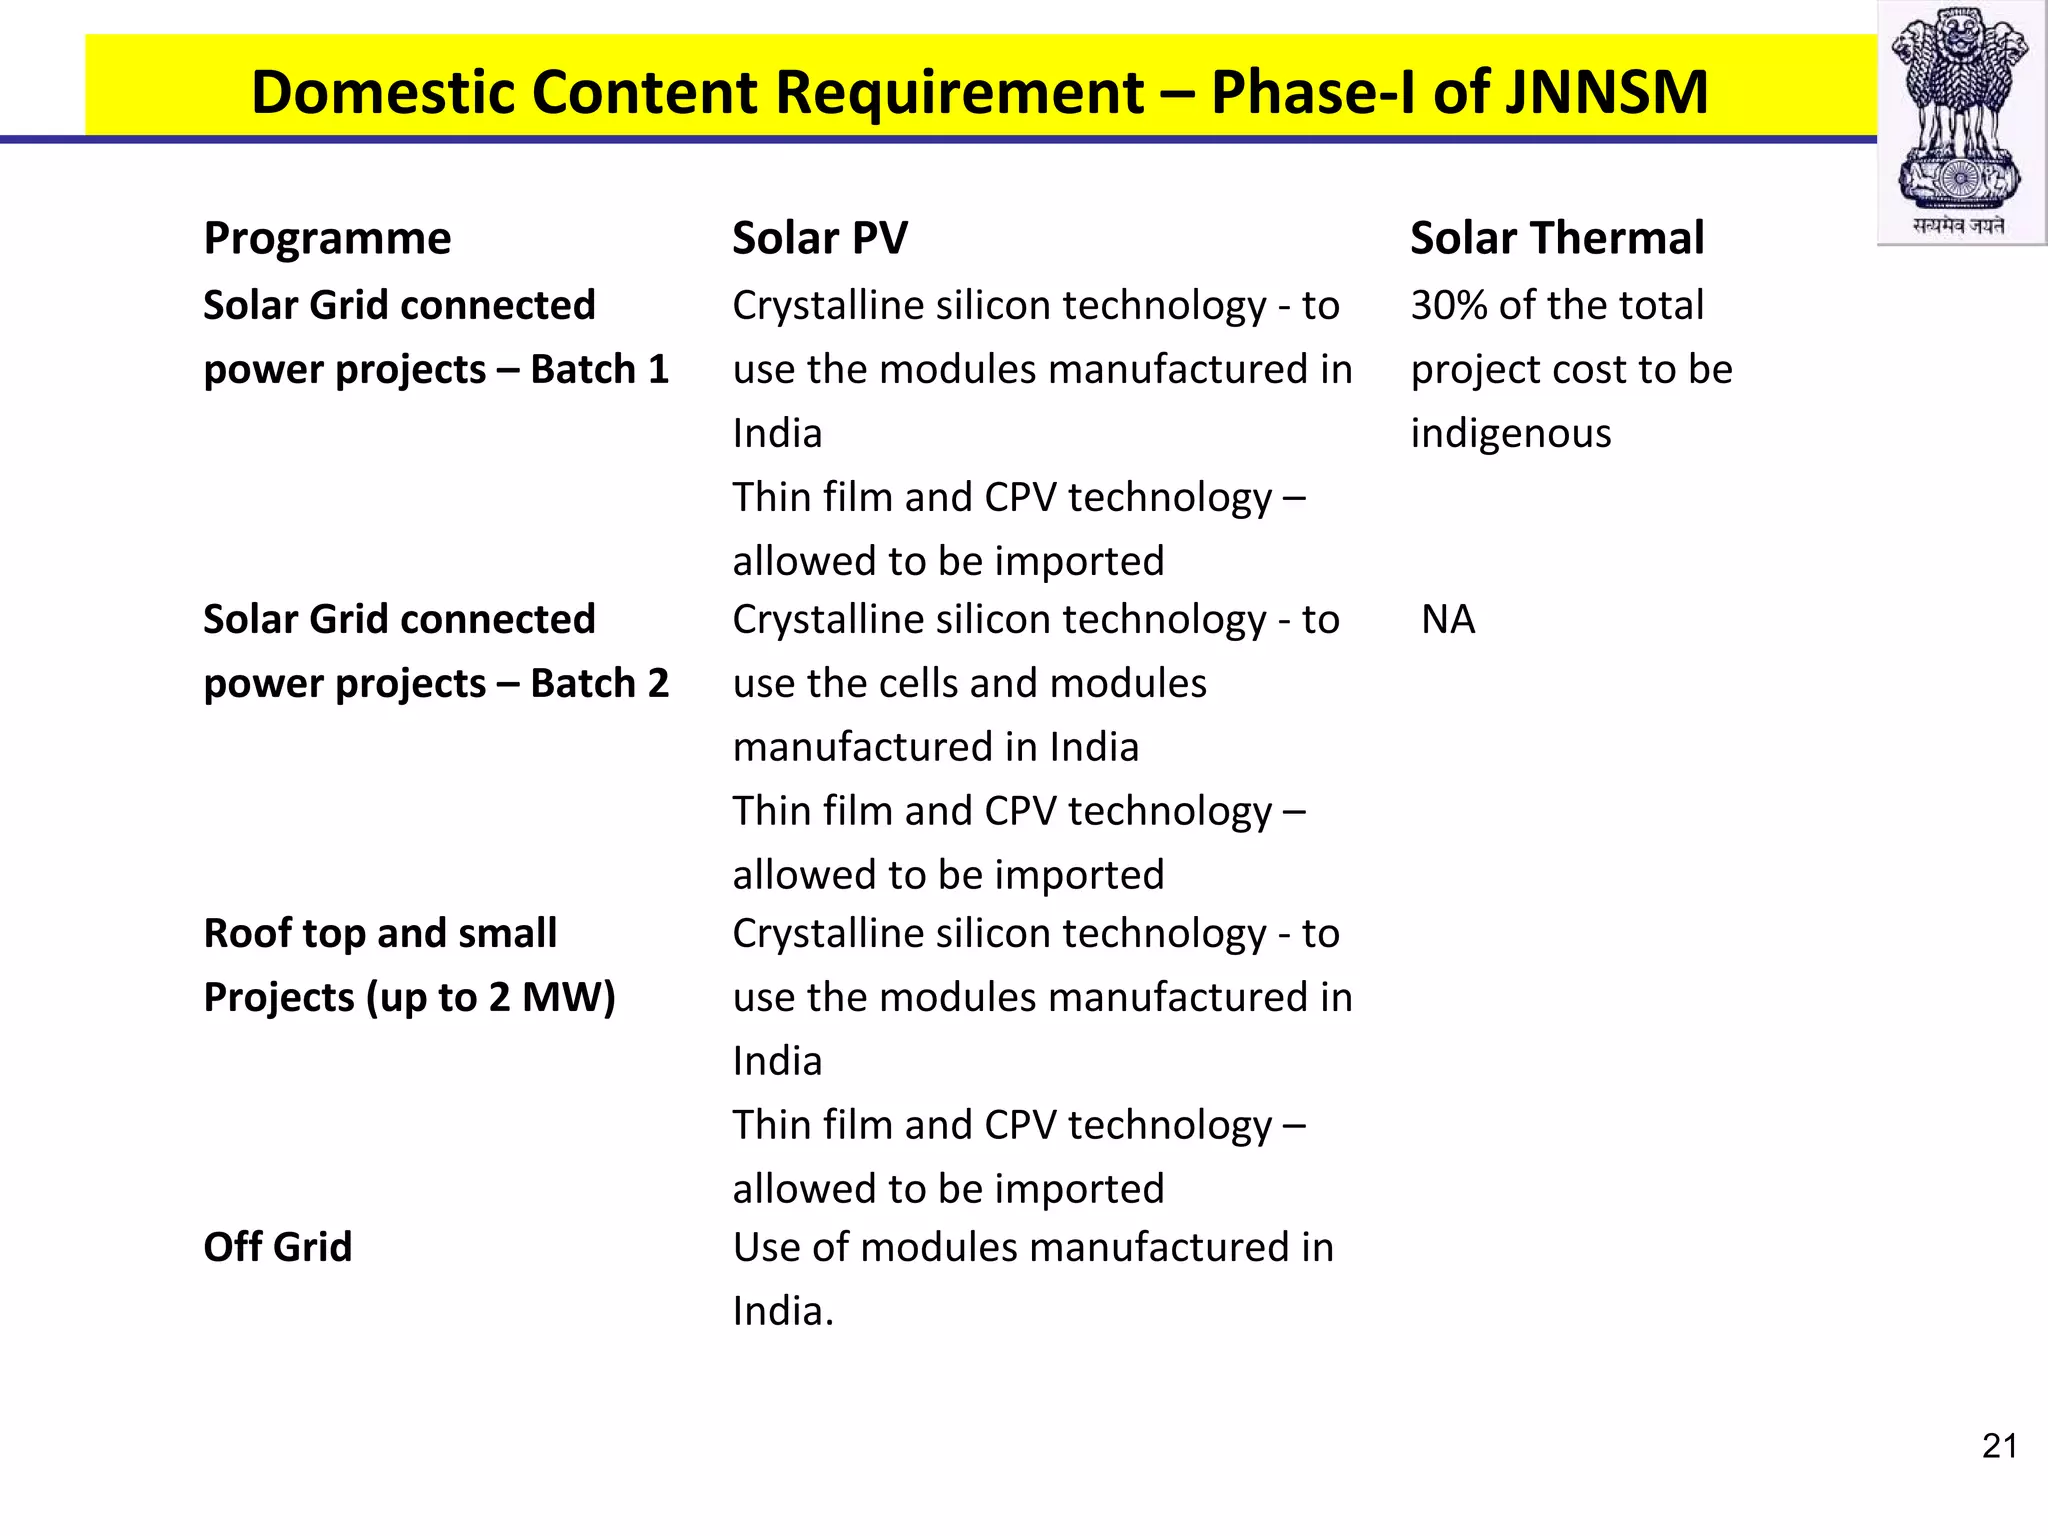
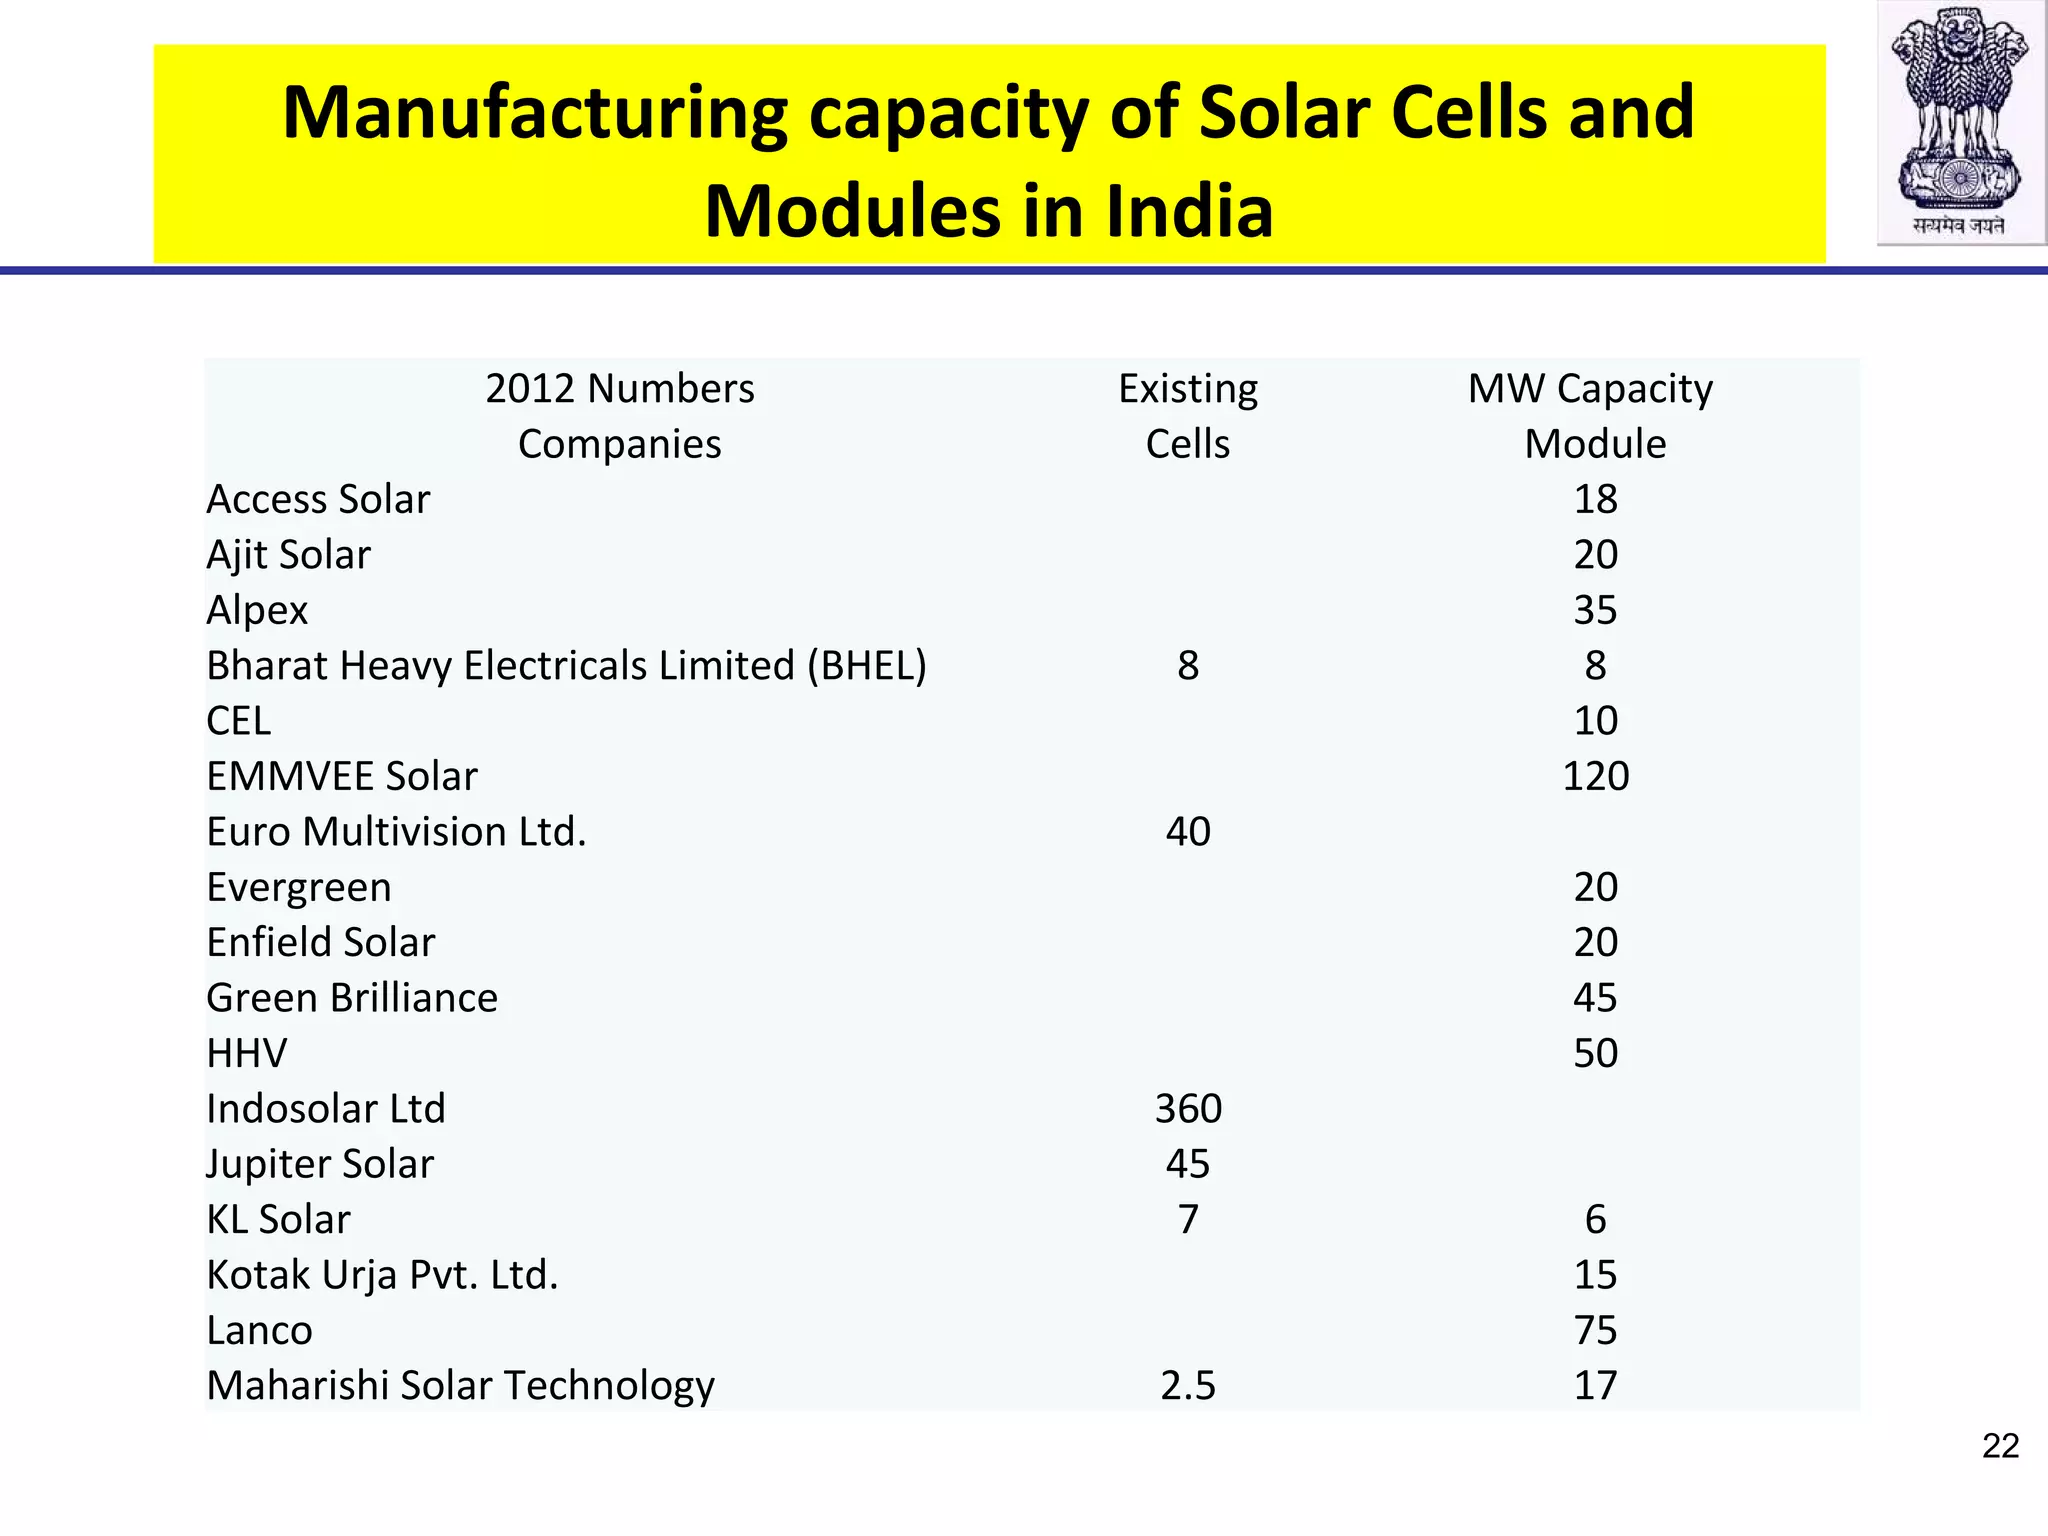
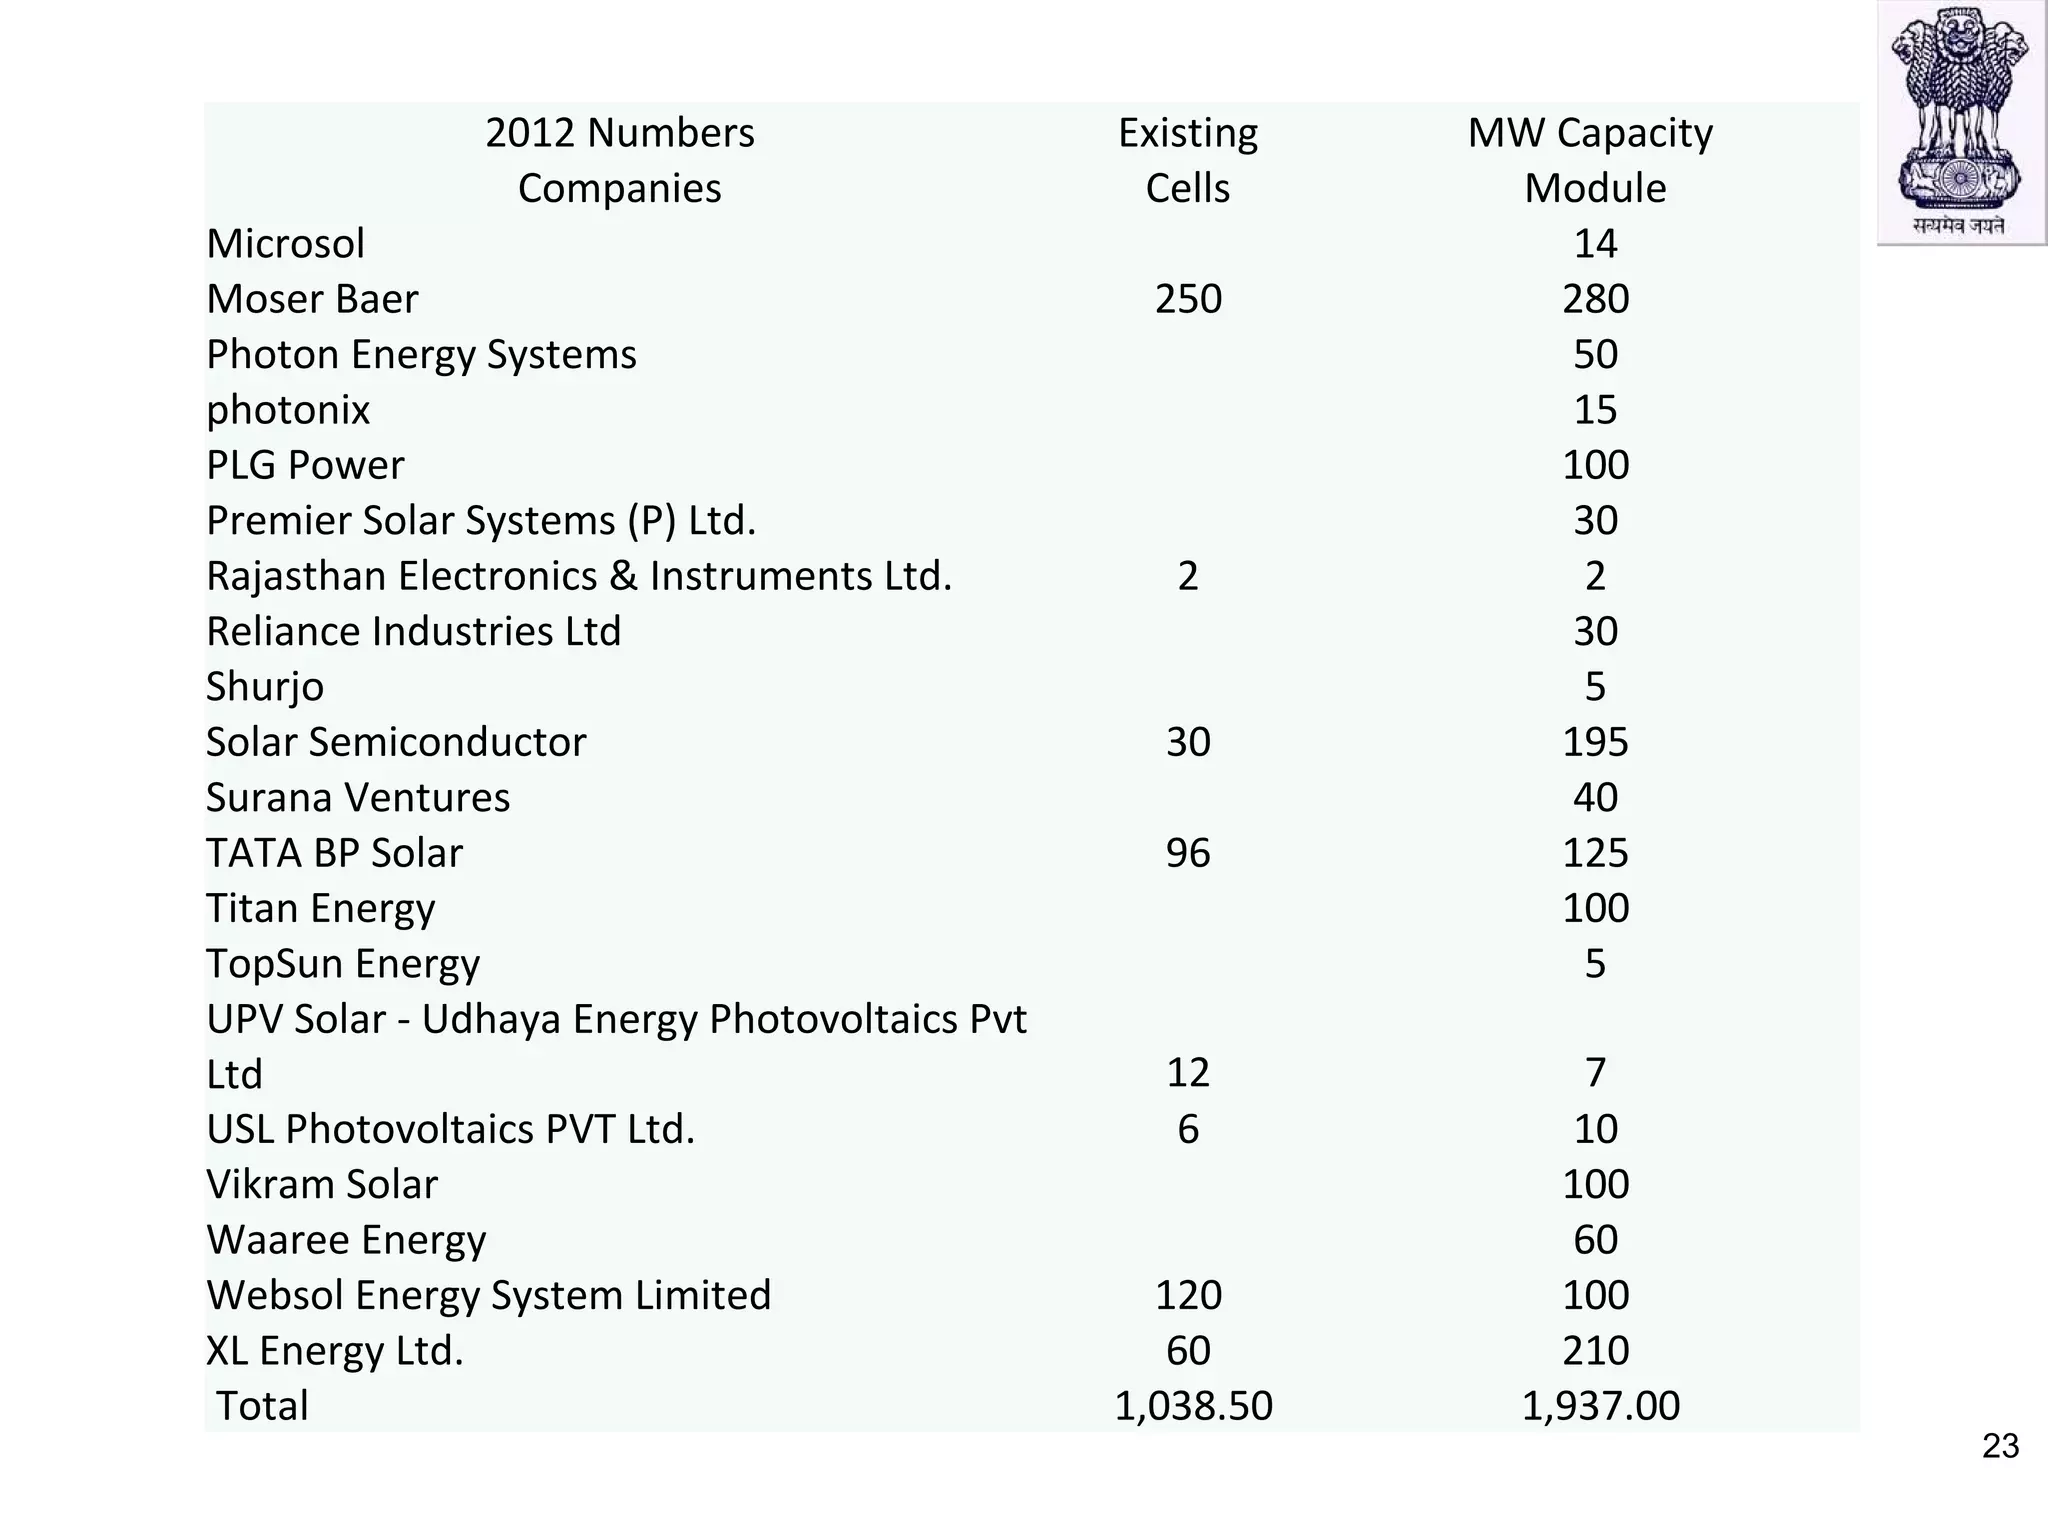
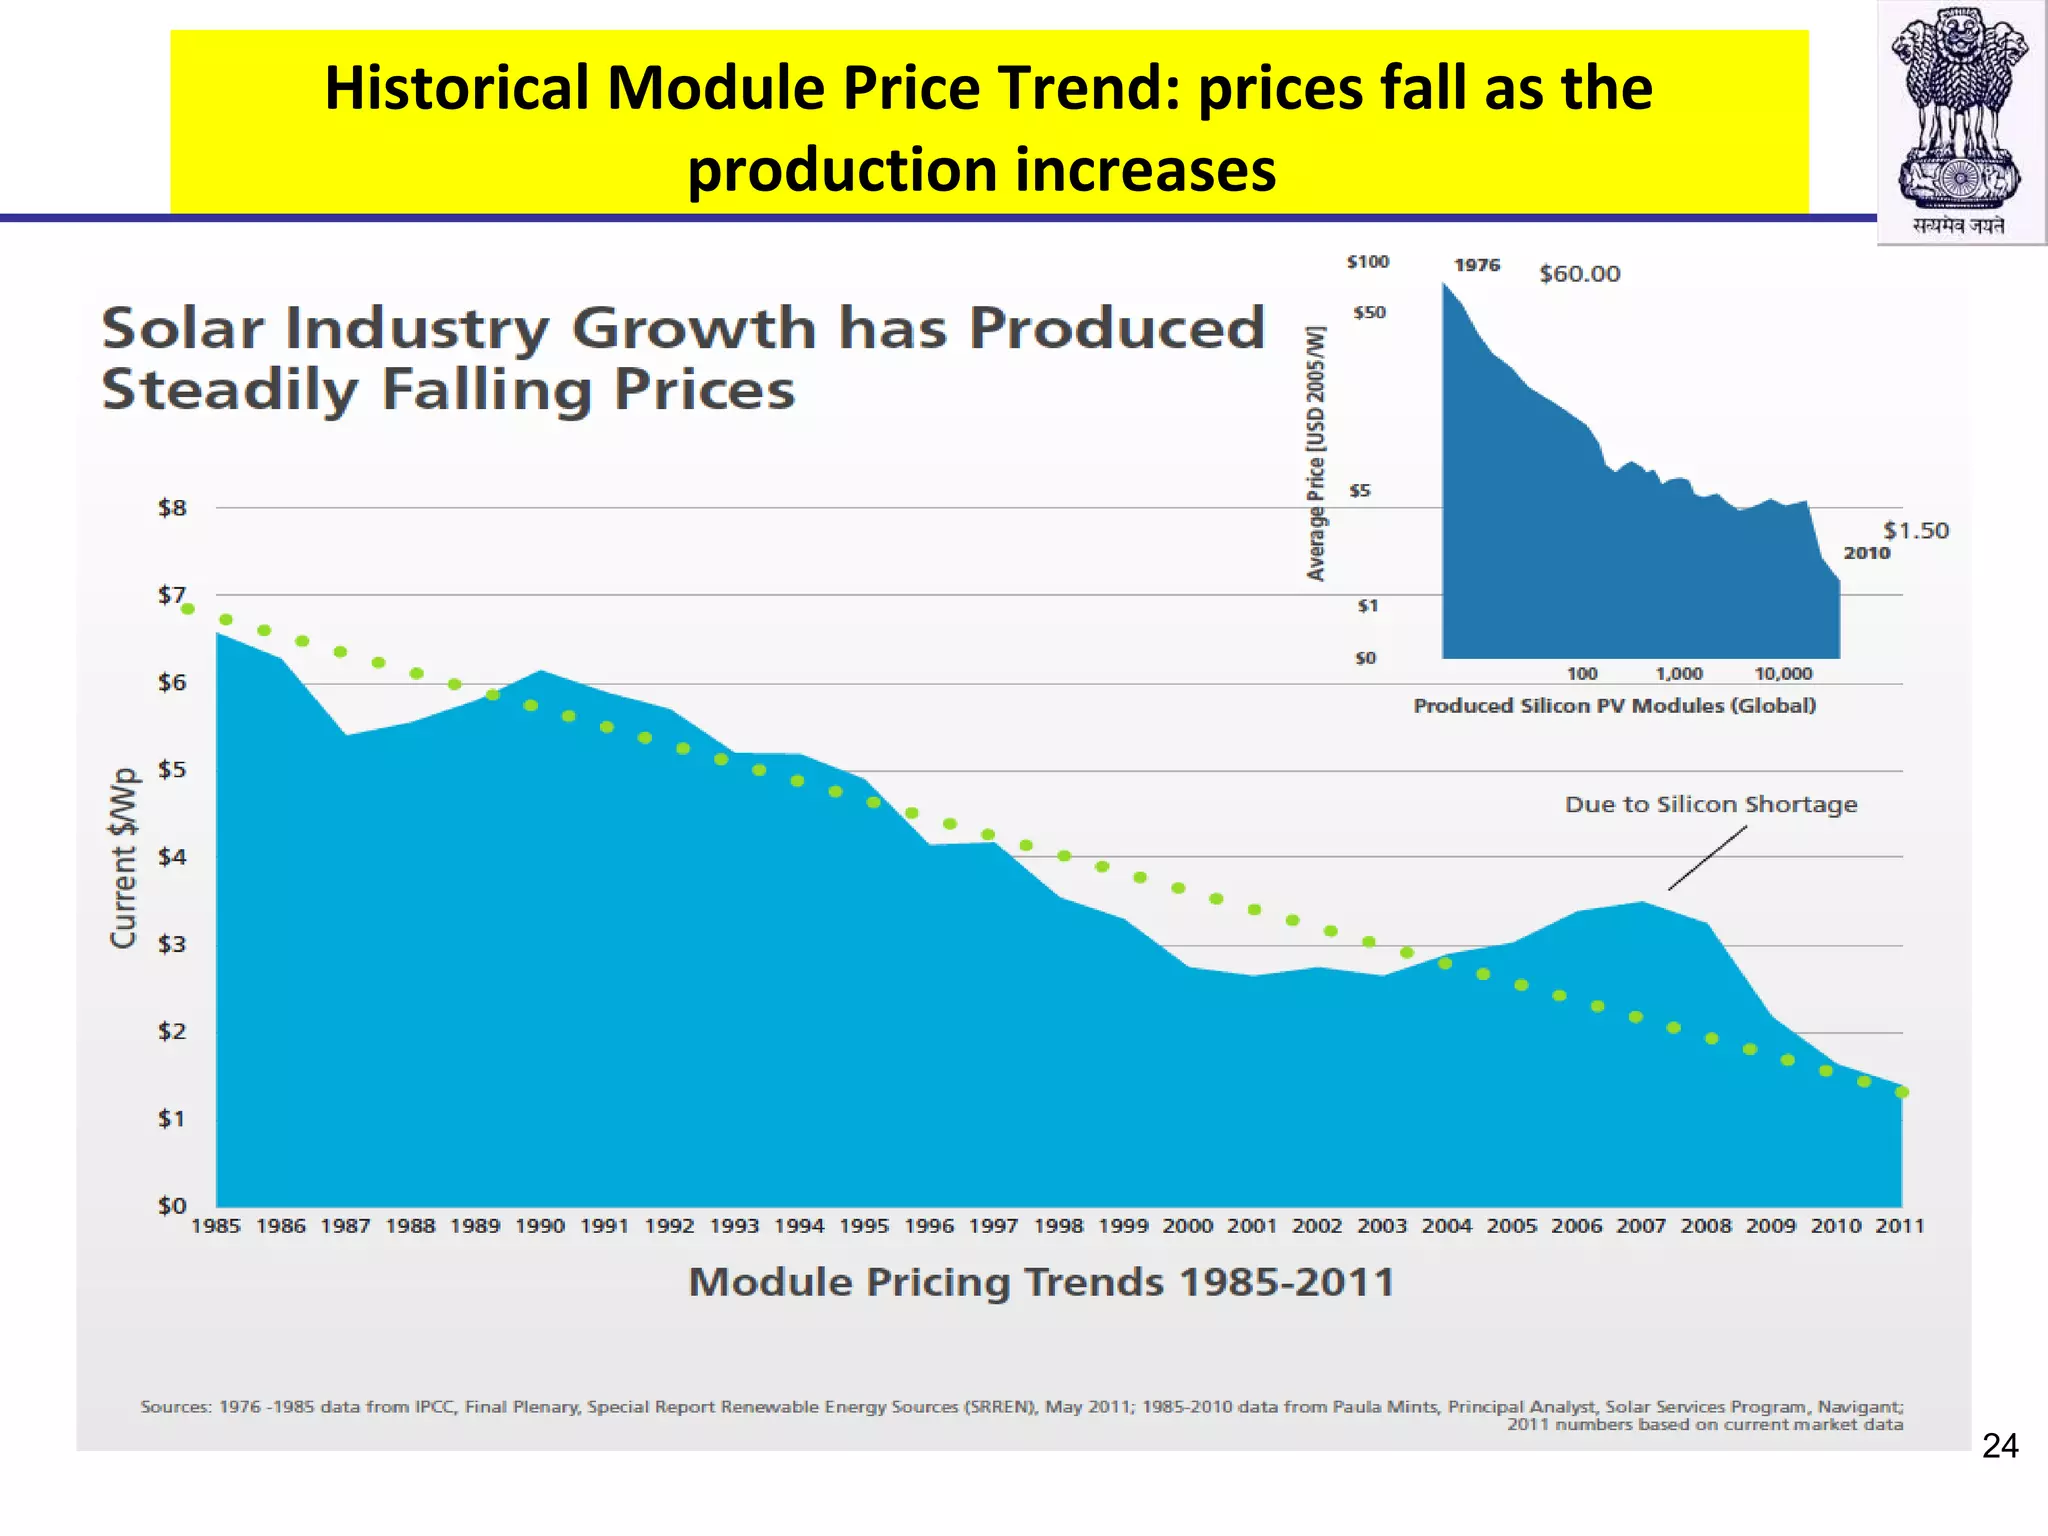
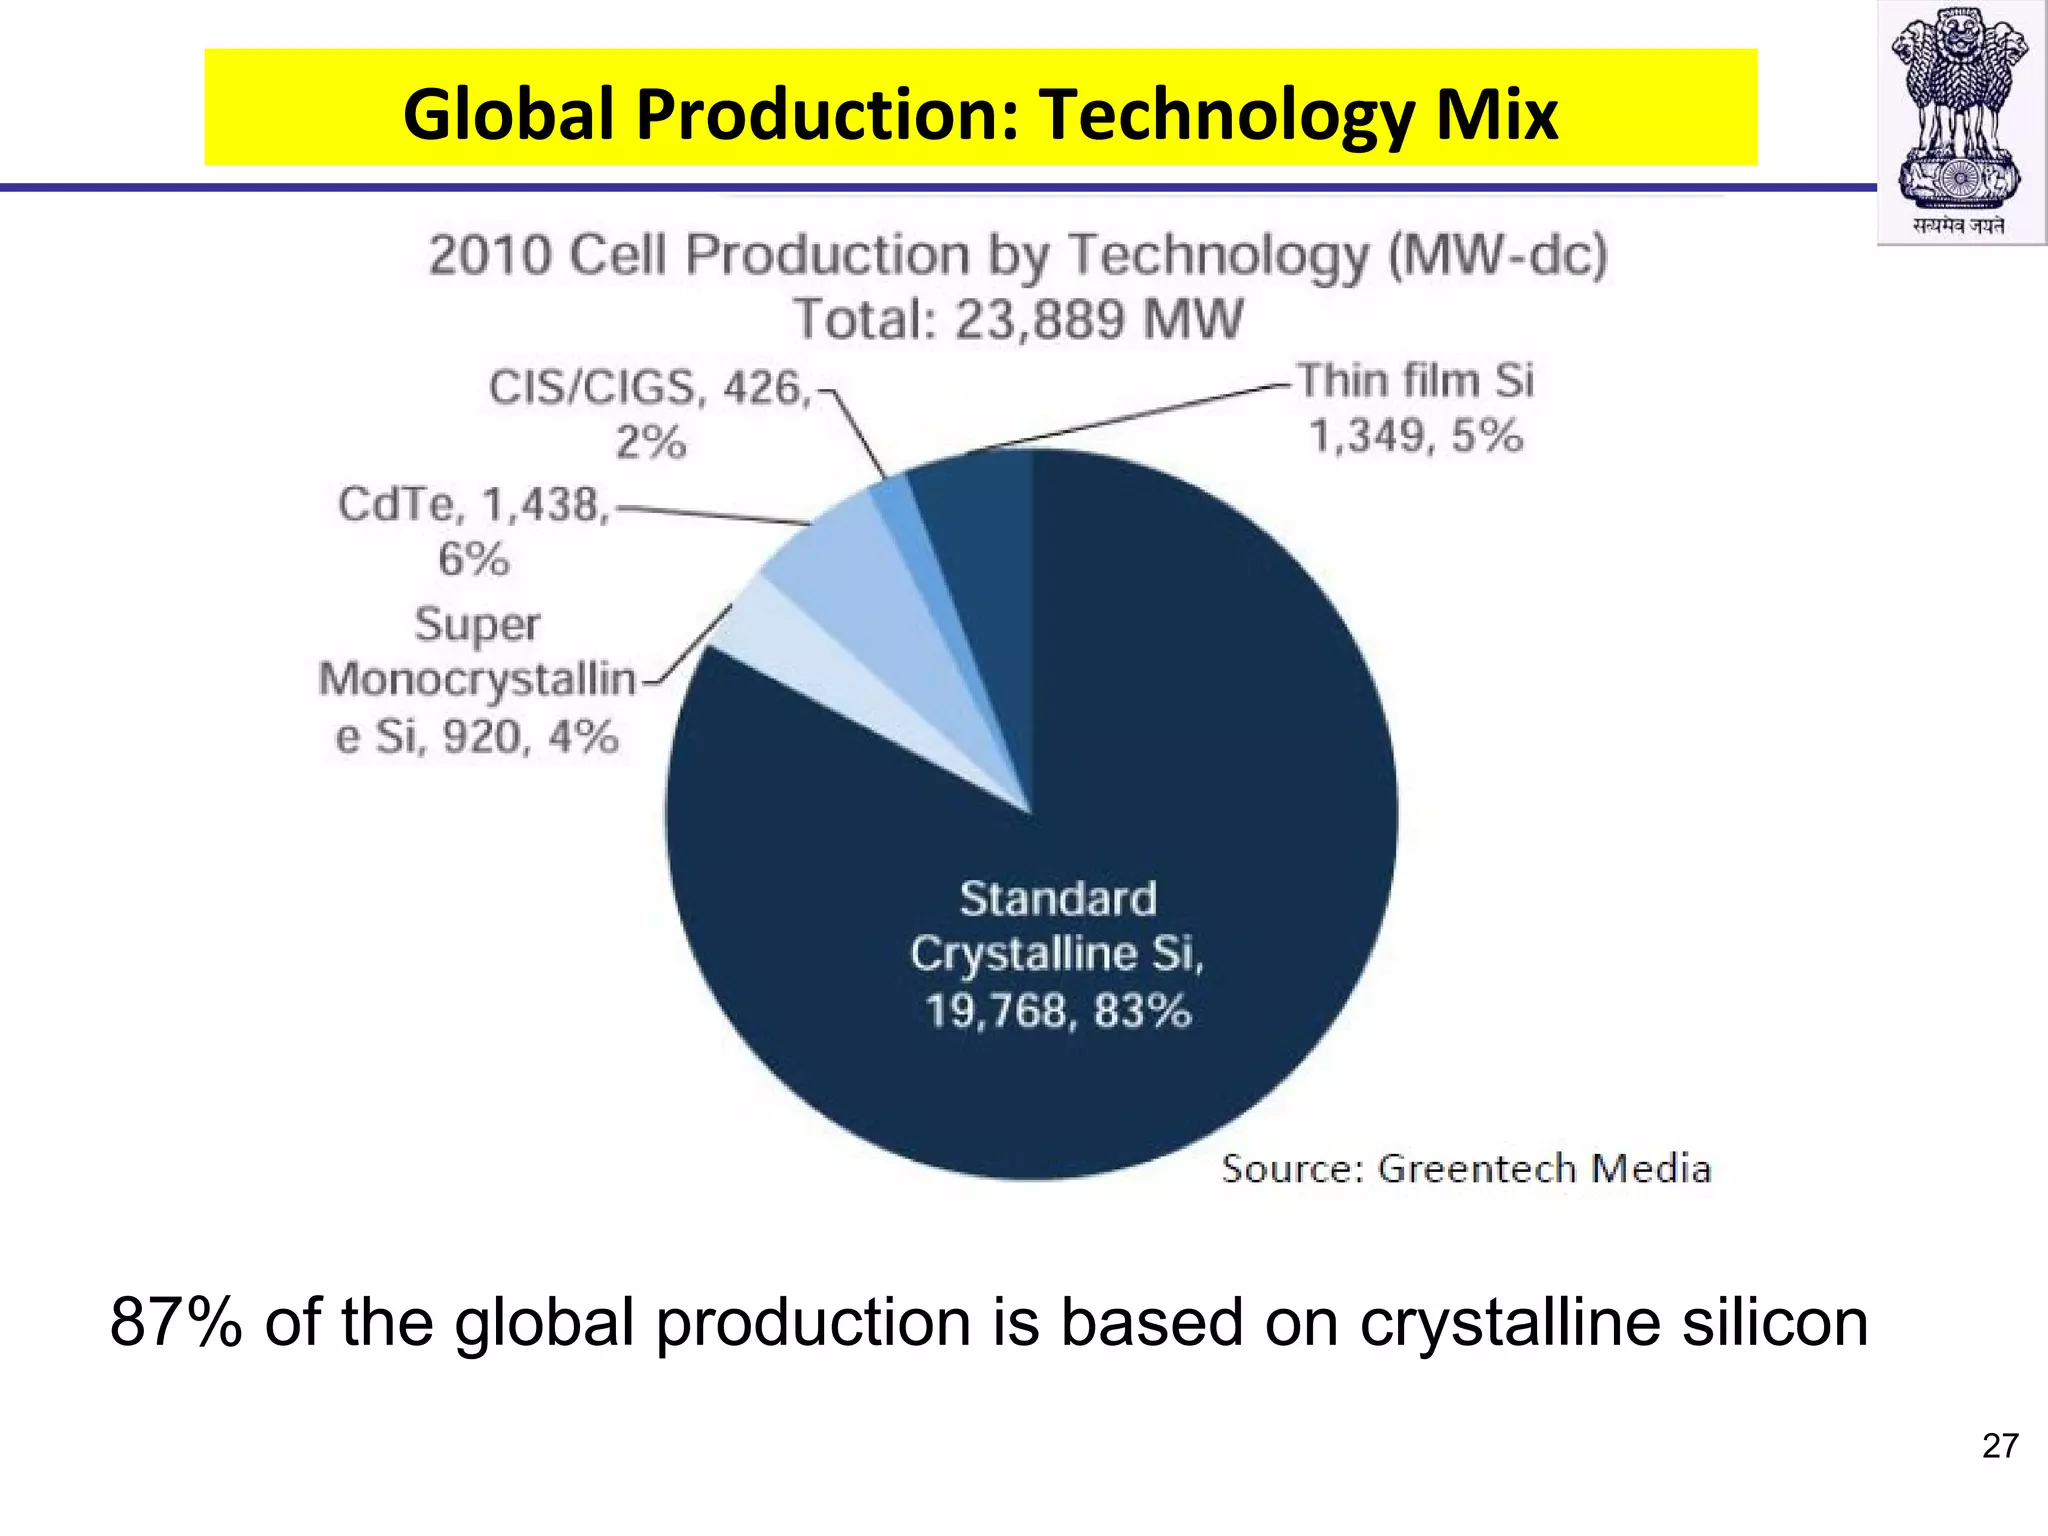
- Manufacturing capacity and targets are increasing to reduce costs and support domestic content requirements in solar programs.
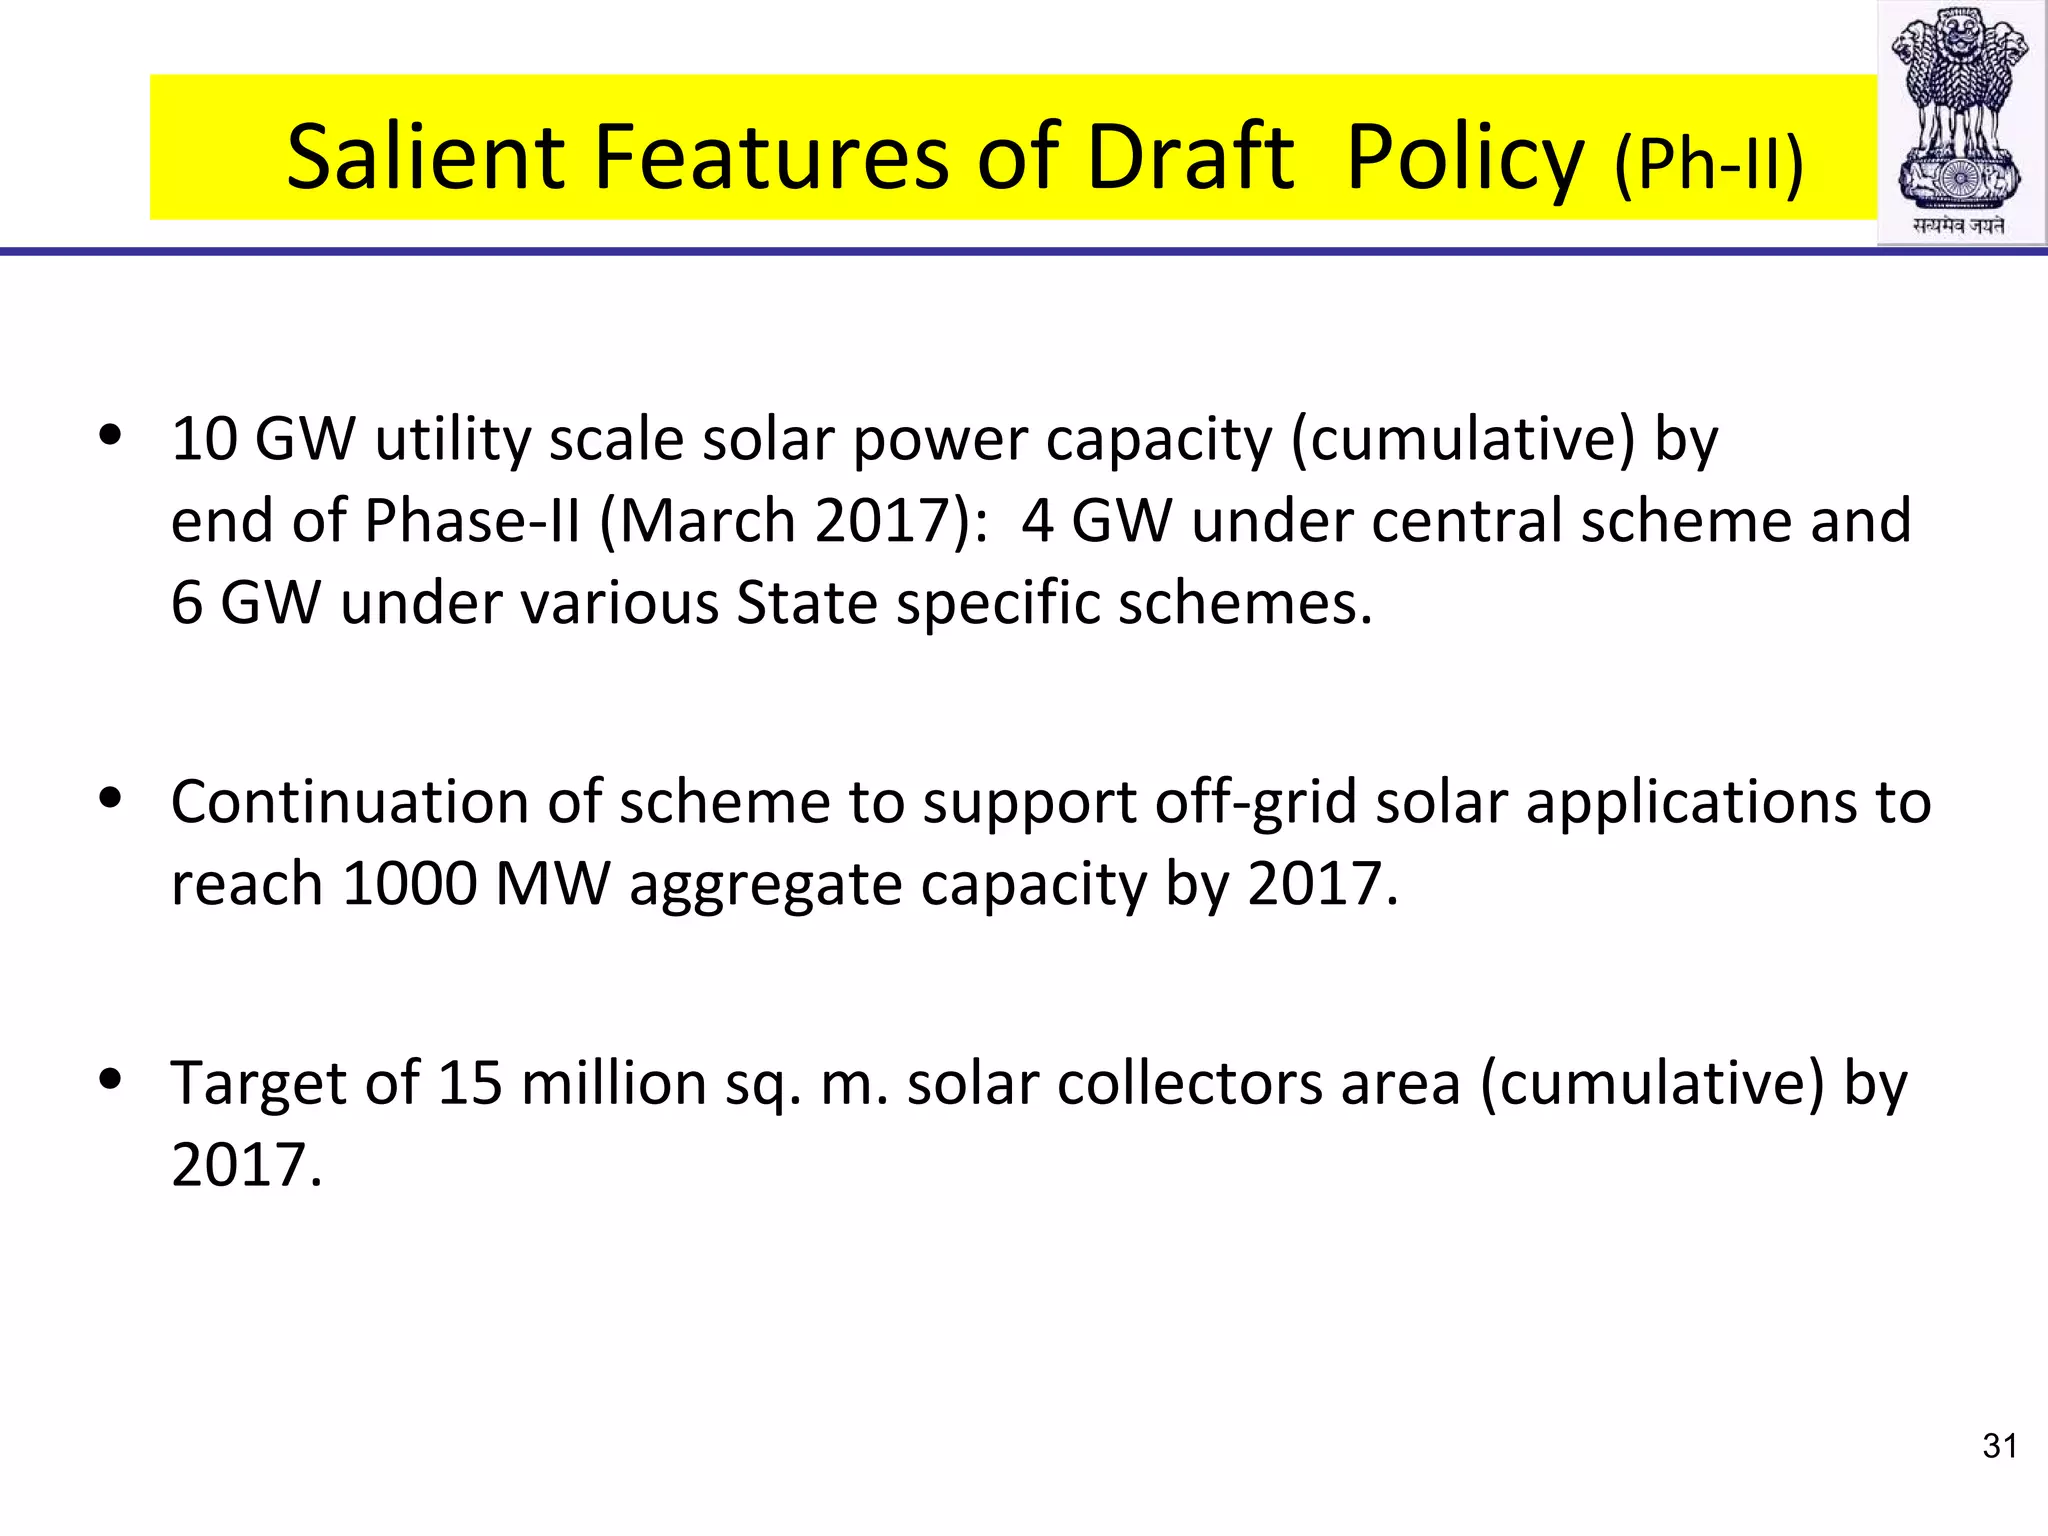
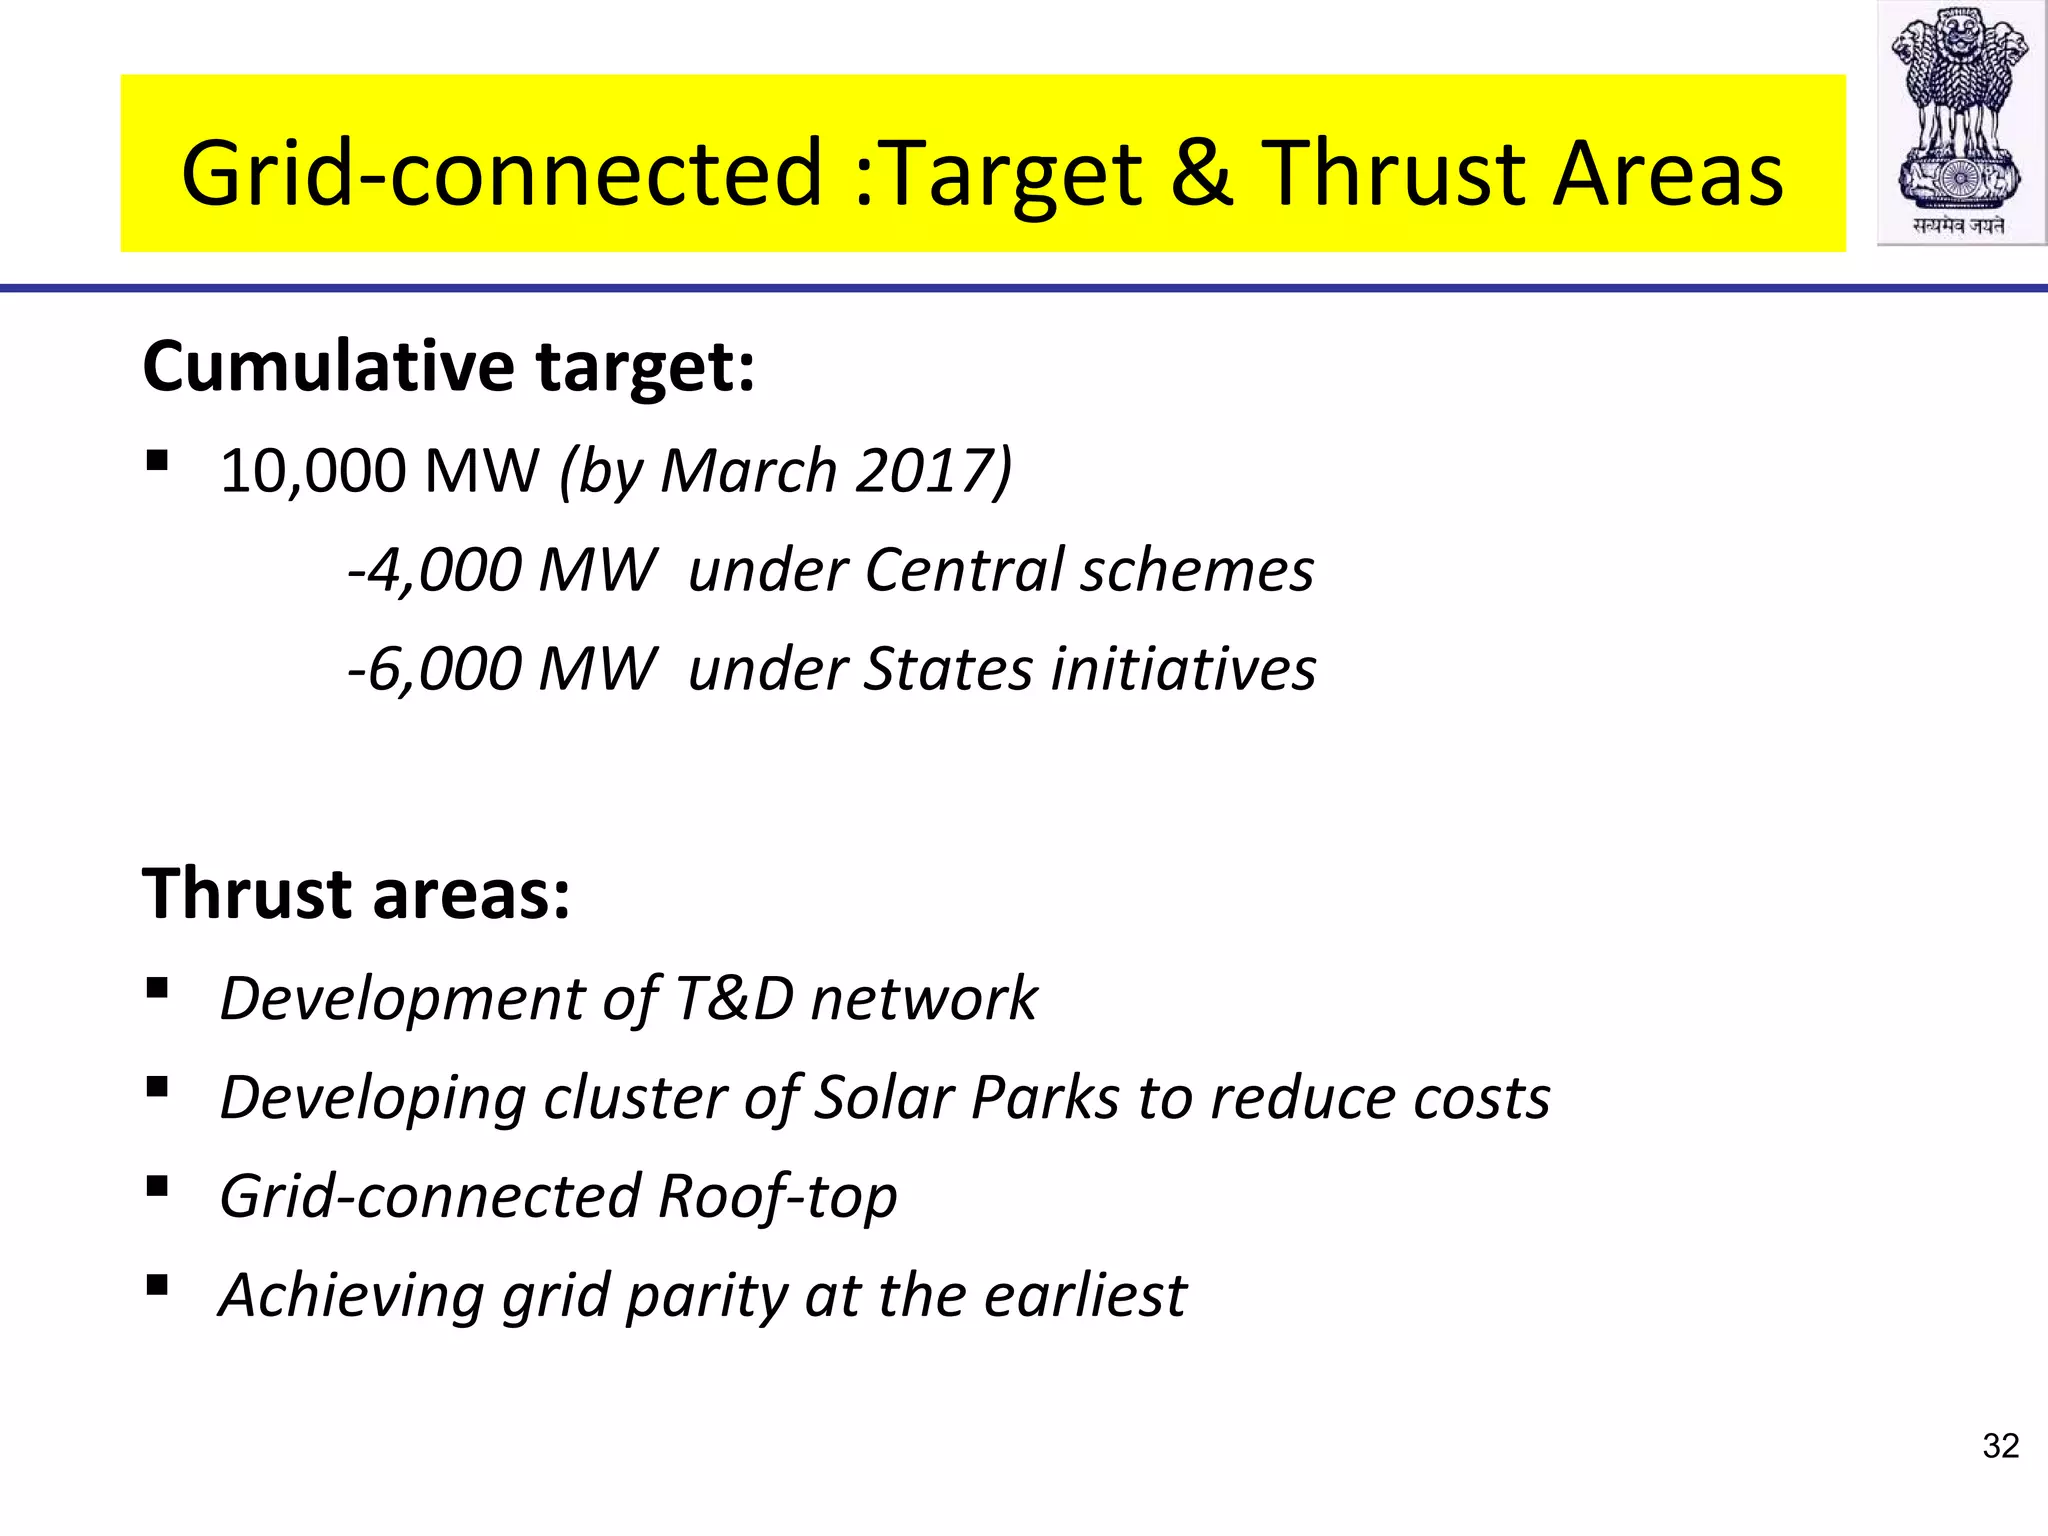
- The second phase of the mission from 2013-2017 targets 10 GW of utility-scale solar and aims to further increase rooftop and off-grid solar.