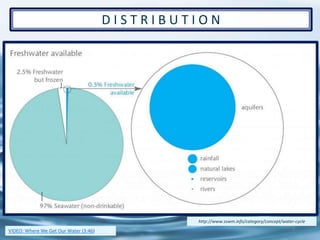
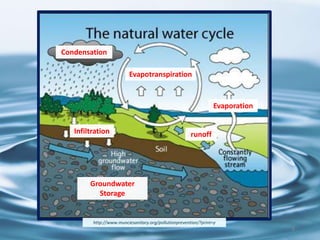
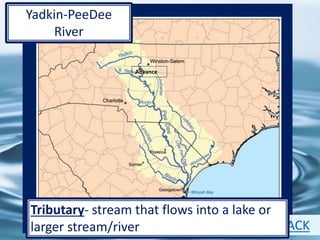
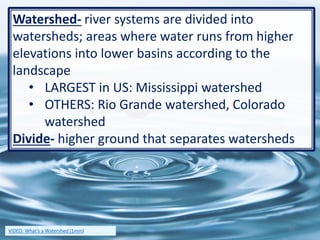
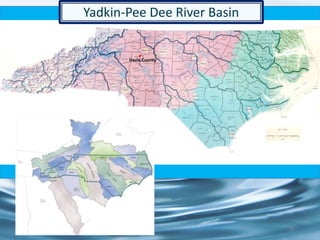
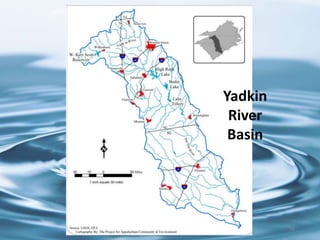
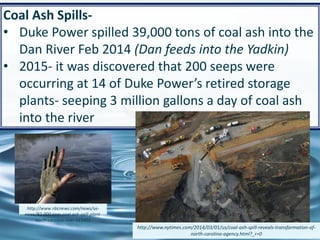
1. Soil & Water 2:
Water Quality
1
HOOK VIDEO: Last Call at the Oasis
ppt. by Robin D. Seamon
2. Humans need freshwater sources
• Rivers and coastlines influence human
settlement
• We learned to control water for our benefit:
• Dams
• Irrigation systems
• Water treatment facilities
• wells
• recreation
2
3. 3
D I S T R I B U T I O N
http://www.sswm.info/category/concept/water-cycle
VIDEO: Where We Get Our Water (3:46)
11. Watershed- river systems are divided into
watersheds; areas where water runs from higher
elevations into lower basins according to the
landscape
• LARGEST in US: Mississippi watershed
• OTHERS: Rio Grande watershed, Colorado
watershed
Divide- higher ground that separates watersheds
11VIDEO: What’s a Watershed (1min)
13. 13
River basin- portion of land drained into a river; river
is the lowest elevation point of the basin
Run-off: rainwater, storm water, or snowmelt that
flows across the surface of the land rather than
infiltrating the soil
16. 1. Gradient- measure of change in elevation over
a certain distance
• Gradient erosive Energy
16
http://surfacewater.wikispaces.com/River+Gradient
17. 2. Discharge- amount of water a river carries;
storms, snowmelt
• Discharge erosive Energy
17
http://www.bigelow.org/virtual/water_sub2.html
18. 3. Load- materials carried by stream
• Fast moving water carries larger particles
• Bed load- bounces larger pebbles or
boulders
• Suspended load- small rocks & soil in
suspension (muddy)
• Dissolved load- minerals (Na, Cl…)
18
http://www.indiana.edu/~g103/G103lectures/rivers/wk6.html*VIDEO: Stream Flow (7min)
19. F O R M A T I O N S
Deposition- dropping of sediments (eroded
rock/soil particles)
Placer deposit- heavy minerals deposited where
current slows (gold)
Delta- mouth/end of a river, current slows,
sediments drop (mud)
- form new land, coast grows
19
23. G R O U N D W A T E R
• Zone of aeration- upper layer of soil & rock;
water passes through
• Zone of saturation- water collects- spaces
between rock particles are filled with water
• Water table- where those two zones meet;
rises & lowers with rainfall & drought from
above
• Recharge zone- ground surface where water
enters an aquifer (how permeable?) 23
25. Aquifer- rock layer of limestone, sand/gravel
that stores groundwater
Porosity- more open spaces/pores can hold
water
• Depends on the size of rock particles
1. Same sized particles= high porosity
2. Different sized particles= low porosity
POROSITY DEMONSTRATION
25
26. Percolation & permeability- rock’s ability to let
water pass
• Larger particles increase permeability because
there are spaces for the water to flow
• Friction
26http://rmccs.org/sitecharacterization/experimental3.html
28. Spring- water table reaches surface; can make a
lake
Artesian spring- spring whose water flows from
crack in cap rock of aquifer
• Sloping layer of permeable rock (aquifer)
sandwiched between two layers of
impermeable rock (cap rock)
28
http://www.health.state.mn.us/divs/eh/wells/waterquality/springs.html
29. 29
gaining streams- streams receive water from
ground water
losing streams- streams lose water to ground
water
30. Well- human-made hole, deeper than water table
• Must be drilled deep enough so that when
water table drops, well still has water
30VIDEO: What is groundwater? (5min)
31. 31
subsidence- pumping so much water from the
water table that the crust sinks (California)
saltwater intrusion- saltwater can enter
groundwater tables naturally or by human
pumping of the water table
33. 33
karst topography- landscape of caves,
sinkholes, fissures, and underground streams
caves- naturally formed underground chambers
formed from chemical weathering;
• acidic ground-
water dissolves
limestone
• caves near the
surface may
produce sinkholes
35. W A T E R Q U A L I T Y
• 3 % of Earth’s water is freshwater (drinkable)
• 75% of that is frozen
• Pollution- introduction of harmful substances
into the environment
• Point-source pollution: pollution from one
specific site (wastewater from a factory)
• Nonpoint-source pollution: pollution comes
from many sources (runoff from agriculture,
urban areas, land clearing, construction,
logging)
35
VIDEO: What is Nonpoint Source Pollution (2 min)
36. M O N I T O R I N G W A T E R Q U A L I T Y
PHYSICAL
turbidity,
temperature
CHEMICAL
measure pH, nitrates,
DO, metals
BIOLOGICAL
count species
36VIDEO: Ecosystems on the Edge (8min)
37. 37
HOW DO YOU DESCRIBE THE WATER?
Instream conditions:
• Litter/garbage- human trash
• Algae- floating, attached, color
• Water color- clear, muddy, milky, tea-colored,
red, gray, green black
• Water appearance- oily sheen, foam/bubbles,
scum
• Water odor- sewage, gas, rotten eggs, fishy,
chlorine, soapy
• Discharge pipes- storm drain, industry,
municipal wastewater, sewer,
PHYSICAL INDICATORS
38. Turbidity-
• Measure of the concentration of particles
suspended in water
• High turbidity = cloudy/ low light penetration
• Suspended sediments of silt, clay, wastewater,
high phytoplankton
38
http://www.learnnc.org/lp/editions/mudcreek/6594
*VIDEO: Turbidity (5min)
39. 39
Habitat structure
Natural river flow
is more productive
a habitat than
man-made
channels.
dams-
block flow of
water; waters
warm & become
dead zones
40. 40
Embeddedness: How much of the streambed that
is under sediment
affects ecosystem- fish, mussels, plants
42. 42
Sediment impacts streams:
• Heat is absorbed by particles
• Clarity is lower
• Organic material can change the chemistry
• Extra fertilizer (phosphorus, nitrogen) causes
HABs (harmful algal blooms)
• Heavy metals leach into water
ppm- parts per million
*one inch in 16 miles *one ounce in 32 tons
*one cent in $10,000 *one minute in two years
THAT’s LIKE:
43. 43
DO- Dissolved
Oxygen
Temperature
• Affects DO levels:
• Cold water holds more O
• Thermal pollution: Factories increase lake
temperatures
• Loss of shade trees on riparian bank
REMEMBER: Colder water
absorbs more gas
2
Habitat Assessment
(14 min)
46. 46
Pathogens
Bacteria: e coli
• Enter water systems when septic systems leak
or municipal sewage systems fail & through
factory farm waste
http://www.cbsnews.com/news/20-sickened-by-e-coli-in-nc-toddler-dies/
VIDEO: Ganges Pollution (1:30)
47. Dissolved oxygen (DO)
• Organisms in water need oxygen
• Low DO can stress/kill organisms
• Pollution reduces DO
• Anoxia- lack of oxygen
47
CHEMICAL INDICATORS
1. Temperature (lower temp, more O2)
2. Altitude (pressure affects gas)
3. Plant growth (respiration, transpiration,
photosynthesis cycles gases)
4. Decay (cycles gases)
5. Turbulence (rough water, catches air bubbles)
*VIDEO: Dissolved Oxygen (13 min)
48. 48
1. Temperature (lower temp, more O )
DO Thermal pollution
DO changes with seasonal temp. changes
2. Altitude (pressure affects gas)
3. Plant growth (respiration, transpiration,
photosynthesis cycles gases)
• Time of Day:
DO day b/c of plant respiration
DO night
4. Decay (cycles gases)
DO Lots of bacteria/decay
5. Turbulence (rough water, catches air bubbles)
What time of the day/year will water
have more DO due to temperature?
What time of the day/year will water
have more DO due to plants?
When will there be more DO due to
decay?
2
49. 49
pH- power of Hydrogen
• The acid/base balance
• Normal: 6.5-8.5
• Lower or higher pH disrupts availability of
nutrients in water system
VIDEO: Strengths & Weaknesses of acids & bases (3:50)
VIDEO: Crash Course Chemistry#30 pH & pOH (11min)
51. 51
Dissolved solutions of water can be hard to
separate & so collect in Earth’s water supply.
A lot of metals are
TOXIC… can become
dissolved into
drinking water
http://thisismyfinalyearproject.blogspot.com/2010/07/critique-2-research-and-analysis.html
Industrial
storage/contaminated land
transpiration
Manure spreading
Uncovered road salt
Septic tank
Oil
storage
tanks
Public
Water
Pesticides
& fertilizers
Gas
station
landfill
Urban runoff
Leaking
sewers
plowing
53. 53
NEWS- Flint, Michigan
• April 2014- Flint’s officials shift to Flint River
water from Detroit system to save money
• Foul-smelling tap-water reported; E.coli found;
corrodes metal; city tells residents to boil
water
• Lead- anti-corrosive chemicals were not added
to the water to prevent corrosion of old pipes
• Lead poisoning & brain damage
• Citizens on bottled water
• Charges being issued for government failure in
Flint
54. 54
LeeAnne Walters displays tap water samples at a public meeting in January
2015. Ryan Garza/Detroit Free Press/ZUMA
FLINT VIDEO
57. 57
Y A D K I N R I V E R ‘ S C U R R E N T I S S U E S
Yadkin-PeeDee River currently supports 1.6 million
people
• Urbanization- building of roads, buildings, &
parking lots replace natural vegetation and soil
• High Rock Lake most threatened section
• High levels of nutrients, chlorophyll, turbidity, DO,
toxic levels of mercury in fish
• Swimming advisories in upper watershed
• Global climate change- droughts
• Coal Ash- Duke Power
58. 58
SOURCES OF THE POLLUTION:
• Point source- piped discharges from local
municipal wastewater treatment plants, local
industrial facilities, large storm water systems
• Non-Point source- timber harvesting, agriculture,
road, building & parking lot construction, failing
septic systems
59. 59
Industry in the Yadkin-PeeDee Watershed
• American Drew
• Weyerhauser
• ABTCO
• RJR Tobaccoville
• RJR Winston-Salem
• ASMO
• International Paper
• Freightliner
• Duke Power
• Arteva Kosa
• National Starch
• AlCOA
• Solite
60. 60
Coal Ash Spills-
• Duke Power spilled 39,000 tons of coal ash into the
Dan River Feb 2014 (Dan feeds into the Yadkin)
• 2015- it was discovered that 200 seeps were
occurring at 14 of Duke Power’s retired storage
plants- seeping 3 million gallons a day of coal ash
into the river
http://www.nbcnews.com/news/us-
news/82-000-tons-coal-ash-spill-plant-
north-carolina-river-n23401
http://www.nytimes.com/2014/03/01/us/coal-ash-spill-reveals-transformation-of-
north-carolina-agency.html?_r=0
61. 61
May 2015-
• Duke pled guilty to 9 violations of federal Clean
Water Act despite warnings of their pollution
• 32 ash dumps; 14 power plants: Eden, Moncure,
Asheville, Goldsboro, Mt. Holly
• Coal Ash Management Act 2014: Gives Duke until
2029 to shut down and cleanup all ash ponds
• 60,000 tons being removed from Dan River site per
month: ½ to landfill in Virginia; ½ stored on-site
• Currently paying $102 million in fines & working on
cleanup
VIDEO 1 Toxic Waste Spill in NC (24 min)
VIDEO: Dan River suffers major coal ash spill (2 min)
63. Fracking-the process of injecting water &
chemicals at high pressure into underground shale
to fissure and release natural gas
63
Could this enter our
water supply?
VIDEO: How does Fracking work? (6min)
66. 66
GenX Pollution
• GenX- chemical used in Teflon
• Also known as PFA, PFC, PFOA, PFOS
• Untested health effects
• Has been found 11 NC Counties (Cape Fear
basin) in rivers, lakes, well water, food
(honey)
• Company Chemours has been accused of
dumping
67. 67
1/2018
Areas testing positive for GenX
This map of EPA data, as prepared by the Environmental
Work Group, shows in red the North Carolina counties
that have tested positive for GenX or similar chemicals
in the drinking water. Gray counties show where the
chemicals were not detected, and white counties were
not tested. The Environmental Work Group
VIDEO: Drinking water in
NC tested for
68. 68
Hurricane Florence
September 2018
• 36 inches of rain: wettest tropical storm in
the Carolinas (8th in the nation)
• Category 1 Hurricane at landfall but very slow
moving; (2-3 mph) dumped rain for days
• spawned tornados
• inland flooding, roads closed, no electricity
for the coast
• flooding = water spoilage
VIDEO NC’s Florence flood disaster growing (4 min)
70. 70
S T E W A R D S H I P
Clean Water Act 1972- to restore and maintain the
health of US waters to include wetlands by
preventing point and nonpoint pollution
Safe Drinking Water Act 1974- regulates US public
drinking supply; amended in 1986 & 1996 to
protect drinking water & its sources: rivers, lakes,
reservoirs, springs & ground water wells
VIDEO2: Freshwater Scarcity
71. Sewage treatment plants- facilities that clean
waste materials out of water
1. Primary treatment
• screens collect solid particles
2. Secondary treatment-
• Water sent to aeration tank; mixed with
oxygen & bacteria; bacteria eats wastes,
use O2
• Water sent to chlorinator to disinfect
• Water released into river, lake, ocean
71
W A T E R T R E A T M E N T
75. Agriculture- most of the world’s usage of water
• Evaporation
• Runoff
• Sprinklers
• BETTER: Drip irrigation systems- irrigate roots
75http://www.austinirrigationgroup.com/why-drip-irrigation-makes-perfect-sense-in-
dry-climates/
Industry
• 19% world water use
• Manufacturing goods
• Extract minerals
• Generate electricity
76. C O N S E R V I N G W A T E R A T H O M E
• Low-flow shower heads
• Low-flush toilets
• Native plants
• Shorter showers
• Turn off water while
brushing teeth
• Washing machine &
dishwasher full
before running
76
VIDEO: Water Crisis (3min)
77. CITIZEN POWER
• 1980’s citizens organized beach cleanups
• Semi-annual Adopt-a-Beach program
http://greatlakes.org/SAAB
77
79. 79
1. Draining of wetlands
• for farmland & development
• estuaries are crucial nurseries and migration
locations for millions of birds, fish, and insects
• peat- rich organic soil harvested for fuel &
fertilizer
80. 2. Sludge dumping- part of treated raw sewage
• By 1990 US had discharged 38 trillion liters of
treated sludge into coastal waters
• Pollutes beaches & estuaries; kills marine life
• Banned, but still practicedhttp://mugsysrapsheet.com/2013/03/
80
81. 3. Trash dumping-
• 1980’s scientists alarmed at type of trash
washing on beaches; bandages, vials of HIV
blood, syringes
• EPA investigated: 3 million tons of medical
waste/yr now has to go into landfills
• Dumping in deeper ocean still common
http://asklizweston.com/are-you-ready-for-a-zero-waste-lifestyle/
81
82. 4. Plastic-
• Plastic never decomposes
• Pacific garbage pack- kills wildlife
• microplastics
http://www.energydigital.com/greentech/1982/Plastic-
in-the-Ocean:-What039s-the-Solution
82
Plastic in Ocean VIDEO (3 min)