Download as PDF, PPTX
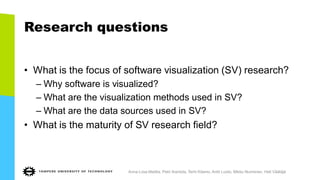
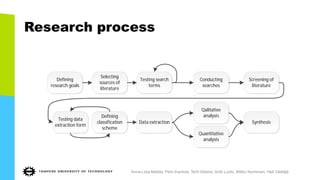
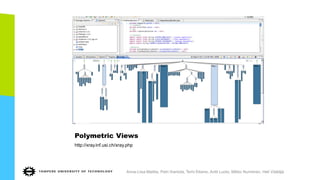
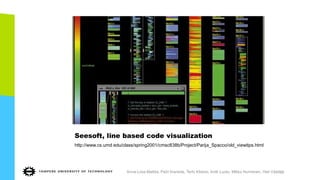
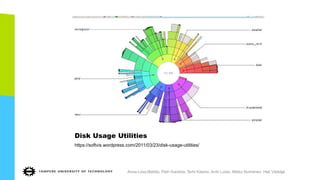
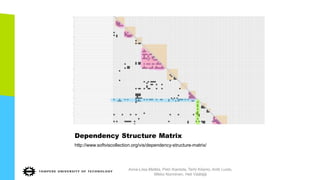
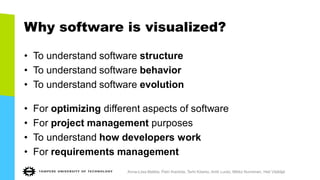
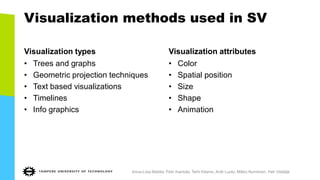
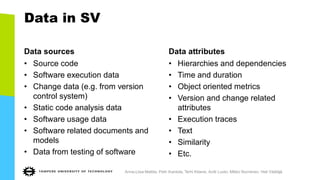

The document reviews the current state of software visualization (SV) research, focusing on its purposes, methods, data sources, and maturity. It identifies key visualization types such as trees, graphs, and geometric projections, along with the attributes and sources of data used in SV. The analysis includes the effectiveness of visualization methods in understanding software structure, behavior, and optimization.


![[台灣人工智慧學校] 主題演講 - 張智威總經理 (President of HTC DeepQ)](https://cdn.slidesharecdn.com/ss_thumbnails/aischoolhsinzhukeynoteedwardchang-180725074840-thumbnail.jpg?width=640&height=640&fit=bounds)