SlideShare a Scribd company logo
0
Guidelines to use IT implementation metrics
• The document lists key quality metrics covered across software product development lifecycle
• Some of these metrics are specific to Agile project methodology, some to waterfall while some of these
apply to both the methodologies (indicated across the metrics)
• At the start of the project, the project manager should define which of these metrics can be used for
tracking the quality elements of the delivery
• Once decided, the project team should ensure to digitize and integrate the selected metrics into the
development environment
• If the team decides to not track metric, then they should have a clear rationale for not using these
metrics
• Directly responsible individuals/group across the metrics laid out in the document
Product Owner
Project Manager Engineering Manager
Scrum Team
1
Key IT implementation metrics across project lifecycle
CloseExecutePlan
Agile process metrics
(Lead/cycle/burndown/velocity/cumulative flow/flow efficiency/Backlog health/Scope creep/story estimation)
Req./Ini.
Development > Testing > Implementation Support > MaintenancePlanning > Analysis > Design
Plan metrics
Planning
and
Analysis
A. Sizing estimate
B. Level of
completeness
C. Definition of
Ready
D. Backlog
management
index (BMI)
Design
metric
A. Prototype testing
(Design
acceptance)
Execution metrics
Develop-
ment
A. Code coverage
B. Code churn
Testing
A. Percentage of Automation coverage
per feature
B. Cost of Poor Quality
C. Defect removal efficiency
D. SIT success criteria
E. UAT success criteria
F. Coding standards adherence
Implem-
entation
A. Number of High priority/severity
defects remaining open
B. Application crash rate
C. Release success rate
D. Release adoption rate
Go-live/
Rollout
A. % of target user on-boarded
B. Training and Education resources
completeness
Closure metrics
Support
and
Mainten-
ance
A. Endpoint incidents
reports
B. Incident
response/resolutio
n rate
C. Application
availability time
User
adoption
metric
A. % of target user
group adopted
B. Frequency of use
C. Phase out % for
legacy systems
D. Advocacy rate
1
2
3
4
7
8
5
6
9
Orange highlighted metrics are used
for Agile project delivery
2
Planning & Analysis metrics
Backup
1A
1B
Metric Description How to measure Measure of goodness
Sizing
estimation
• Relative estimation for size of software
application to agree on work scope
• Methods – Planning poker, T-shirt sizing,
Dot-voting, Affinity mapping
• T-shirt sizing is most commonly used
• Measured as storypoints, tracked on Jira
• For, large backlog or epics/concurrent scrum
teams, T-shirt sizing done is XS,S,M,L,XL
Completeness &
Exclusivity of stories
Level of
complete-
ness
• Completeness of a backlog covers each
story with end-user identified, product
feature defined and benefits are traced.
• Definition of Done (DoD) is used to
assess when user story has been
completed & reviewed at the release
level
• Measured by aligning DoD to each user story
• DoD=(Number of user stories delivered
/Number of user stories forecasted)*100
• DoD should be configured and PO should click
& accept the Done button for each story
• Fully filled product
backlog
• DoD % > 90% is a
good measure of
acceptance
Definition of
Ready
• Stories must be immediately actionable
• Determine what needs to be done &
amount of work required to complete
each User Story
DoR for User story
• User Story defined and dependencies identified
• User Story sized by Delivery Team
• Scrum Team accepts User Experience artefacts
• Performance criteria identified, where appropriate
• Person who will accept the User Story is identified
• Team has a good idea what it will mean to Demo the User Story
Backlog
management
index (BMI)
(replenish-
ment index)
• Backlog management index (BMI) is an
indication of success of project work &
understanding of the stability & control
• Backlog should have N+2 worth of
effort, where N is number of sprints to
be delivered
• (Total number of problems closed during a
month/Total number of problems opened
during the month)*100
• BMI > 100% is a
good measure of
stability & control
A WAgile Waterfall
A
A
1C
A
Product Owner Scrum team
1D
A
3
Design metrics:
Backup
2A
Metric Description How to measure Tools Measure of goodness
Prototype
testing
(Design
acceptance
rate)
• System Usability Scale – reliable
and most widely used tool to
measure usability
• Rate the heuristics on their level of
agreement on 5-point scale on the
high-fidelity prototypes
• Surveys
(Score >80)
• Task time • Time to complete the allocated task • Silverback
• Crazyegg
• Five second
test
• Optimizely
• Usabilla
• User
testing
• Use of Search vs Navigation • (Total number of tasks completed
through search or navigation/ Total
number of completed tasks)*100
• User error occurrence rate for
- Single error opportunity/task (I)
- Multiple error opportunity/task (II)
• (I)=(Total number of occurred errors
for all users)/(Total number of error
opportunities for all users)*100
• (II)=(Number of errors)/(Total number
of task attempts) *100
• Task success rate • (Total Number of user task completed
successfully) / (Total Number of user
attempts defined for the prototype
test)*100
A WAgile Waterfall
A
*Only for development teams - as input from UX Team
UX /Usability analyst
4
Development Metric: Code coverage
Backup
Source: From Dev tool - Coveralls
3A
Metric Description How to measure Tools
Measure of
goodness
Code
Coverage
• Critical metric for the test-driven
development (TDD) practice and
continuous delivery
• Measure how many lines of code or
blocks are executed while automated
tests are running
• Coveralls
• SonarQube
• Junits
• Corbertura
(Better
Performance)WA
A WAgile WaterfallEngineering Manager
5
Development Metric: Code churn
Backup
3B
Metric Description How to measure Tools
Measure of
goodness
Code
Churn
• Allows for assessing the code stability
at different development stages
through visualization of trends and
fluctuations that happen to a code base
• Measure how many lines of code
were added, removed, or changed
• Can be automated with tools or at the
code repository level
• Git or Jira
• Codescene
• Codecount
• Code analyzer
• StatSVN
Better
PerformanceWA
A WAgile Waterfall
* For Sample reference
Engineering Manager
6
Test Metric: % of automation coverage per feature
Backup
4A
Metric Description How to measure Tools Measure of goodness
% of
automation
coverage
per feature
• If the product undergoes constant
improvements, testing for regression
should be automated
• Allows to prioritize the features that
o may suffer from regression after updates
o for which automated tests are critical
• Measure proportion per feature
covered with automated tests
against those tested manually
• Automation index = (Number
of Automated tests/ Total
number of tests)
• Tricentis
• HP UFT
• Selenium
• Appium
• Jmeter
• Load-
runner
>80%
(Higher the Number of
Manual tests that can
be automated)
WA
A WAgile WaterfallProduct Owner
7
Test Metrics:
4A
4B
4C
Metric Description How to measure Tools
Measure of
goodness
Cost of Poor
Quality
(COPQ)
• The cost a company pays when
all of its products are not perfect.
• Defects in development effort
(DDE) is proportional to COPQ
• COPQ = Cost related to detection of defects
+ Cost due to occurrence of defects
• DDE = (Total number of defects reported)
/(Work-man hrs. consumed in sprint)
• Retrace
• Appdynamics
• New Relic Better
Performance
Defect
Removal
Efficiency
• Development quality for the
defect removal is reported before
production (QA testing) & after
production (live state)
• It identifies the test effectiveness
of the system.
• (Number of defects found before
production) / (Number of defects found
before production + Number of defects
found after production)
• Retrace
• Appdynamics
• New Relic
Better Efficiency
UAT
Success
Criteria
(UAT Defect
leakage)
• UAT Defect leakage is used to
identify the efficiency of the QA
testing during the UAT phase
• Defect Leakage is also called as
Bug Leak
• UAT Defect leakage = (Total Number of UAT
Defects) / (Total Number of Valid Test
Defects+ Total Number of UAT
Defects)*100
• Valid tests are assigned priority/severity
levels
• Tricentis
• HP UFT
(% of
successfully
passed test
cases at UAT
gate)
• Percentage of successfully passed
test cases at the UAT gate
• (Total number of successfully passed test
cases/Total number of test cases agreed for
UAT)*100
• Tircentis
• HP UFT
• Jira 95% > to pass
UAT gate
Backup
W
W
WA
A WAgile Waterfall
WA
Engineering Manager Product Owner
8
Test Metrics:
4D
Metric Description How to measure Tools
Measure of
goodness
SIT
success
Criteria
(SIT Defect
leakage)
• SIT Defect leakage leakage
is used to identify the
efficiency of the QA testing
during the SIT phase
• Defect Leakage is also called
as Bug Leak
• (Total Number of SIT Defects) / ((Total
Number of Valid Test Defects) + (Total
Number of SIT Defects))*100
• Tricentis
• HP UFT
(Quality
ratio)
• Quality ratio helps to assess
the success in the QA
environment
• Quality ratio= (Successful Test Cases/ Total
Test Cases) * 100
• Jira
• HP UFT
• Tricentis
90-95%>
quality ratio
Coding
standards
adherence
• Set of guidelines, best
practice, programming styles
& conventions that developers
adhere to when writing
source code for a project
• Commenting
• Naming convention
• Simplicity in code
• Portability
• Code refactoring
• W3C Code validations
• W3C
standards
• Code
validator
• Extensive code
reviews
4E
Backup
W
W
A WAgile Waterfall
WA
Engineering Manager
9
Implementation Metric:
Backup
5A
5B
5C
5D
Metric Description How to measure Tools
Measure of
goodness
Number of
high priority
defects open
• Defects are reported basis
priority and severity levels,
with development team
assigned to close high/medium
priority
• Count of the high priority or high severity
defects in open state after release
• Jira
• Confluence
(Better
Performance)
Application
crash rate
• Application crash is measured
by number of times the
application failed or features
were non-functional
• Number of application fails times (F) per
usage (U) [F/U]
• Retrace
• Appdynamics
• New Relic
Better Adoption
Release
success rate
• Release success is planned by
scrum team' agreement to
software release
• Attributes to the improvement
in velocity, efficiency, quality,
as the key indicators
• Improved velocity to deliver (pace of
implementation ) or
• Improvement in Efficiency (fewer cycles in
production)
• Improved Quality (Fewer defects)
• XebiaLabs
• Electriccloud
• CA tech
Release
adoption rate
• Release adoption is determined
by number of active users
during the initial release period
• (Number of user active for the new release
/ Total Number of targeted users )*100
• Platform
dependent
tools
WA
WA
WA
WA
A WAgile WaterfallEngineering Manager Project Manager
10
Go-live/Roll-out metrics
6A
6B
Metric Description How to measure Tools
Measure of
goodness
% of
target
users on-
boarded
• During the product roll-out, user
on-boarding is done through
tracking the number of
installs/sign-ups etc.
• Product owner measures and analyses user
onboarding
• Number of user on-boarded per application
install or signup/ Total Number of targeted
users
• Platform
dependent
tools
Better
Performance
Training
and
Education
resources
complete
ness
• Training material like release
notes, product walkthroughs and
the education resources like how-
tos, videos etc. for the release
• Completeness/effectiveness in training
material is usually measured through trainee
surveys or assessments
• Published
release notes
• Educational
resources
available to
end-user
Backup
W
W
A WAgile WaterfallProduct Owner Project Manager
11
Support/Maintenance metrics
7A
7B
7C
Metric Description How to measure Tools
Measure of
goodness
Endpoint
incidents
reports
• Reports on incidents classified as
High priority / High severity post
implementation & system gene-
rated logs on system down-time
• Endpoints incidents are classified in types –
software, hardware, service request etc.
• SiT
• Jira
Better
Performance
Incident
response/
resolution
rate
• Incident response is
acknowledgement to end-user
on reported incident
• Incident resolution is solution
implemented by technical team
to bring back system to
functional state
• (Number of incidents responded within
defined target response time / Total number
of incidents reported)*100
• (Number of incidents resolved within defined
target resolution time / Total number of
incidents reported)*100
• Managed through triage on Jira/SiT before
taking up for resolution
• SiT
• Jira
Better
Performance
Application
availability
time
• Continuous application
availability reported by the
system
• Project manager reviews the application
availability time on a daily basis
• (1-application downtime/24 hours)*100%
• Platform
dependent
tools High availability
rate is 99.99%.
Backup
W
W
W
A WAgile WaterfallProject Manager
12
Metric Description How to measure Tools
Measure of
goodness
% of target
user group
adopted
• Adoption rate for target user
group, that determines the
success of the product
• (Number of user fully-adopted the product)
/(Number of targeted user base for
adoption)*100
• Platform
dependent
tools Better
Performance
Frequency of
use
• Frequency of product usage
tracked over week or month for a
software release vis-à-vis
expected frequency of use
• (Number of user sessions per user)/(week or
month)
• Total Time spent (sum of session time) by
users over days or weeks
• Jira
Better Adoption
Legacy
applications
phase out
effective-
ness
• To ensure better adoption of
product and new systems,
business needs to sunset legacy
applications
• (Time spent by target users on legacy
systems in use/ Total number of hours spent
by target users on applications)*100
• Platform
dependent
tools
Advocacy
rate
• Advocacy for adoption of product
and new systems is done through
existing users or senior users,
usually tracked through a
satisfaction survey
• Net promoter score from satisfaction survey.
• (Number of Promoters - Number of
Detractors) / (Number of Respondents) *100
• Google
surveys
• Survey-
monkey
• Qualtrics
(Better Adoption)
User adoption metrics
8A
8B
8C
8D
Backup
W
W
W
W
A WAgile Waterfall
A
A
A
A
Product Owner
Note: In addition to above, software teams use Google Analytics to analyze data like session quality, page insights, active users, LTV, workflow
behavior etc. and draw insights and reports on user adoption.
13
Metric Description How to measure Measure of goodness
Sprint
velocity
• Key metric of a scrum
• Measure of the amount of work a Team
can tackle during a single Sprint and is
the key metric in Scrum
• Product owner measures the number of
features completed in a sprint
• Velocity index is number of sprint/project
& unique for realistic team commitment (Better Performance)
Sprint
Burndown
• Amount of work remaining to be done
before the end of a sprint
• Displays progress towards the goal
instead of listing items
• Helps to uncover planning mistakes
• Number of story points remaining/day.
• Extrapolating the line of sprint burn down
results to the forecasted release date
(Steeper graph)
Agile Process Metrics
Backup
9
A
A
Tool used - Jira
Product Owner
14
Agile Process Metrics
Backup
9
Metric Description How to measure Measure of goodness
Cumulative
Flow
• Identifies when the work-in-progress
(WIP) limits are exceeded
• Cycle time is a mechanical measure of
process capability while lead time is what
the customer sees
• Teams with shorter cycle times are likely
to have higher throughput
• Value delivered against time
• Lead time clock starts when the request
is made and ends at delivery
• Cycle time clock starts when work begins
on the request and ends when the item is
ready for delivery
(Steeper graph)
Flow
Efficiency
• Complements cumulative flow, it gives
insights into the distribution between
actual work and waiting periods
• (Actual work time)/(Overall lead
time)*100
(Steeper graph)
A
A
Tool used - Jira
Product Owner
15
Agile Process Metrics9
Backup
Metric Description How to measure Measure of goodness
Risk
Burndown
• Plot of the sum of the risk in the Product
Backlog
• Preferred tool for assessing risks to
create a Risk Burndown Chart is Expected
Monetary Value (EMV)
• Number of stories carrying significant risk
(in this case marked as “architecturally
significant” in the backlog) multiplied by
10 (weighted)
• Applying 80:20 rule, a factor of 5 or 10 is
expected to work, as a rule of thumb
about 20% of the backlog carries risk
(steeper graph)
A
Tool used - Jira
Product Owner
Software quality metrics

More Related Content

What's hot

QA metrics in Agile (GUIDE)
QA metrics in Agile (GUIDE)QA metrics in Agile (GUIDE)
QA metrics in Agile (GUIDE)
Vladimir Primakov (Volodymyr Prymakov)
 
[Paul Holland] Bad Metrics and What You Can Do About It
[Paul Holland] Bad Metrics and What You Can Do About It[Paul Holland] Bad Metrics and What You Can Do About It
[Paul Holland] Bad Metrics and What You Can Do About It
Ho Chi Minh City Software Testing Club
 
A Software Testing Intro
A Software Testing IntroA Software Testing Intro
A Software Testing Intro
Evozon Test Lab
 
[Vu Van Nguyen] Test Estimation in Practice
[Vu Van Nguyen]  Test Estimation in Practice[Vu Van Nguyen]  Test Estimation in Practice
[Vu Van Nguyen] Test Estimation in Practice
Ho Chi Minh City Software Testing Club
 
Measuring Quality: Testing Metrics and Trends in Practice
Measuring Quality: Testing Metrics and Trends in PracticeMeasuring Quality: Testing Metrics and Trends in Practice
Measuring Quality: Testing Metrics and Trends in Practice
TechWell
 
Presentation1
Presentation1Presentation1
Presentation1
anuvip
 
Software Testing- Principles of testing- Mazenet Solution
Software Testing- Principles of testing- Mazenet SolutionSoftware Testing- Principles of testing- Mazenet Solution
Software Testing- Principles of testing- Mazenet Solution
Mazenetsolution
 
Chromatography Data System: Getting It “Right First Time” Seminar Series – Pa...
Chromatography Data System: Getting It “Right First Time” Seminar Series – Pa...Chromatography Data System: Getting It “Right First Time” Seminar Series – Pa...
Chromatography Data System: Getting It “Right First Time” Seminar Series – Pa...
Chromatography & Mass Spectrometry Solutions
 
Measurement and Metrics for Test Managers
Measurement and Metrics for Test ManagersMeasurement and Metrics for Test Managers
Measurement and Metrics for Test Managers
TechWell
 
Qa management in big agile teams
Qa management in big agile teamsQa management in big agile teams
Qa management in big agile teams
Vladimir Primakov (Volodymyr Prymakov)
 
Manual estimation approach for Pre-sale phase of a project
Manual estimation approach for Pre-sale phase of a projectManual estimation approach for Pre-sale phase of a project
Manual estimation approach for Pre-sale phase of a project
Vladimir Primakov (Volodymyr Prymakov)
 
Don’t Be Another Statistic! Develop a Long-Term Test Automation Strategy
Don’t Be Another Statistic! Develop a Long-Term Test Automation StrategyDon’t Be Another Statistic! Develop a Long-Term Test Automation Strategy
Don’t Be Another Statistic! Develop a Long-Term Test Automation Strategy
Josiah Renaudin
 
Software testing regression testing
Software testing  regression testingSoftware testing  regression testing
Software testing regression testing
GaneshKumarKanthiah
 
Testing Best Practices
Testing Best PracticesTesting Best Practices
Testing Best Practices
Axway Appcelerator
 
ISTQB - CTFL Summary v1.0
ISTQB - CTFL Summary v1.0ISTQB - CTFL Summary v1.0
ISTQB - CTFL Summary v1.0Samer Desouky
 
QTest
QTest QTest
Introduction to Software Test Automation
Introduction to Software Test AutomationIntroduction to Software Test Automation
Introduction to Software Test Automation
Amr Ali (ISTQB CTAL Full, CSM, ITIL Foundation)
 
QA Club Kiev #18 - Test Management in Google Sheets
QA Club Kiev #18 - Test Management in Google SheetsQA Club Kiev #18 - Test Management in Google Sheets
QA Club Kiev #18 - Test Management in Google Sheets
QA Club Kiev
 
Attribute MSA
Attribute MSAAttribute MSA
Attribute MSA
dishashah4993
 
TRACK H: Using Formal Tools to Improve the Productivity of Verification at ST...
TRACK H: Using Formal Tools to Improve the Productivity of Verification at ST...TRACK H: Using Formal Tools to Improve the Productivity of Verification at ST...
TRACK H: Using Formal Tools to Improve the Productivity of Verification at ST...chiportal
 

What's hot (20)

QA metrics in Agile (GUIDE)
QA metrics in Agile (GUIDE)QA metrics in Agile (GUIDE)
QA metrics in Agile (GUIDE)
 
[Paul Holland] Bad Metrics and What You Can Do About It
[Paul Holland] Bad Metrics and What You Can Do About It[Paul Holland] Bad Metrics and What You Can Do About It
[Paul Holland] Bad Metrics and What You Can Do About It
 
A Software Testing Intro
A Software Testing IntroA Software Testing Intro
A Software Testing Intro
 
[Vu Van Nguyen] Test Estimation in Practice
[Vu Van Nguyen]  Test Estimation in Practice[Vu Van Nguyen]  Test Estimation in Practice
[Vu Van Nguyen] Test Estimation in Practice
 
Measuring Quality: Testing Metrics and Trends in Practice
Measuring Quality: Testing Metrics and Trends in PracticeMeasuring Quality: Testing Metrics and Trends in Practice
Measuring Quality: Testing Metrics and Trends in Practice
 
Presentation1
Presentation1Presentation1
Presentation1
 
Software Testing- Principles of testing- Mazenet Solution
Software Testing- Principles of testing- Mazenet SolutionSoftware Testing- Principles of testing- Mazenet Solution
Software Testing- Principles of testing- Mazenet Solution
 
Chromatography Data System: Getting It “Right First Time” Seminar Series – Pa...
Chromatography Data System: Getting It “Right First Time” Seminar Series – Pa...Chromatography Data System: Getting It “Right First Time” Seminar Series – Pa...
Chromatography Data System: Getting It “Right First Time” Seminar Series – Pa...
 
Measurement and Metrics for Test Managers
Measurement and Metrics for Test ManagersMeasurement and Metrics for Test Managers
Measurement and Metrics for Test Managers
 
Qa management in big agile teams
Qa management in big agile teamsQa management in big agile teams
Qa management in big agile teams
 
Manual estimation approach for Pre-sale phase of a project
Manual estimation approach for Pre-sale phase of a projectManual estimation approach for Pre-sale phase of a project
Manual estimation approach for Pre-sale phase of a project
 
Don’t Be Another Statistic! Develop a Long-Term Test Automation Strategy
Don’t Be Another Statistic! Develop a Long-Term Test Automation StrategyDon’t Be Another Statistic! Develop a Long-Term Test Automation Strategy
Don’t Be Another Statistic! Develop a Long-Term Test Automation Strategy
 
Software testing regression testing
Software testing  regression testingSoftware testing  regression testing
Software testing regression testing
 
Testing Best Practices
Testing Best PracticesTesting Best Practices
Testing Best Practices
 
ISTQB - CTFL Summary v1.0
ISTQB - CTFL Summary v1.0ISTQB - CTFL Summary v1.0
ISTQB - CTFL Summary v1.0
 
QTest
QTest QTest
QTest
 
Introduction to Software Test Automation
Introduction to Software Test AutomationIntroduction to Software Test Automation
Introduction to Software Test Automation
 
QA Club Kiev #18 - Test Management in Google Sheets
QA Club Kiev #18 - Test Management in Google SheetsQA Club Kiev #18 - Test Management in Google Sheets
QA Club Kiev #18 - Test Management in Google Sheets
 
Attribute MSA
Attribute MSAAttribute MSA
Attribute MSA
 
TRACK H: Using Formal Tools to Improve the Productivity of Verification at ST...
TRACK H: Using Formal Tools to Improve the Productivity of Verification at ST...TRACK H: Using Formal Tools to Improve the Productivity of Verification at ST...
TRACK H: Using Formal Tools to Improve the Productivity of Verification at ST...
 

Similar to Software quality metrics

ISTQB foundation level - day 2
ISTQB foundation level - day 2ISTQB foundation level - day 2
ISTQB foundation level - day 2
Shuchi Singla AKT,SPC4,PMI-ACP,ITIL(F),CP-AAT
 
What is Test Matrix?
What is Test Matrix?What is Test Matrix?
What is Test Matrix?
QA InfoTech
 
Questions for successful test automation projects
Questions for successful test automation projectsQuestions for successful test automation projects
Questions for successful test automation projects
Daniel Ionita
 
Software test management
Software test managementSoftware test management
Software test managementVishad Garg
 
The QA/Testing Process
The QA/Testing ProcessThe QA/Testing Process
The QA/Testing Process
Synerzip
 
Testing strategy for agile projects updated
Testing strategy for agile projects updatedTesting strategy for agile projects updated
Testing strategy for agile projects updated
Tharinda Liyanage
 
Metrics based Management
Metrics based ManagementMetrics based Management
Metrics based Management
SPIN Chennai
 
unit-5 SPM.pptx
unit-5 SPM.pptxunit-5 SPM.pptx
unit-5 SPM.pptx
ssuser92282c
 
WINSEM2021-22_ITE2004_ETH_VL2021220500452_Reference_Material_I_21-04-2022_TES...
WINSEM2021-22_ITE2004_ETH_VL2021220500452_Reference_Material_I_21-04-2022_TES...WINSEM2021-22_ITE2004_ETH_VL2021220500452_Reference_Material_I_21-04-2022_TES...
WINSEM2021-22_ITE2004_ETH_VL2021220500452_Reference_Material_I_21-04-2022_TES...
madhurpatidar2
 
Continuous testing in agile projects 2015
Continuous testing in agile projects 2015Continuous testing in agile projects 2015
Continuous testing in agile projects 2015
Fabricio Epaminondas
 
Software Engineering (Software Quality Assurance & Testing: Supplementary Mat...
Software Engineering (Software Quality Assurance & Testing: Supplementary Mat...Software Engineering (Software Quality Assurance & Testing: Supplementary Mat...
Software Engineering (Software Quality Assurance & Testing: Supplementary Mat...
ShudipPal
 
Definition of Done and Product Backlog refinement
Definition of Done and Product Backlog refinementDefinition of Done and Product Backlog refinement
Definition of Done and Product Backlog refinement
Christian Vos
 
Test planning and software's engineering
Test planning and software's engineeringTest planning and software's engineering
Test planning and software's engineering
MansiganeshJawale
 
How to make Automation an asset for Organization
How to make Automation an asset for OrganizationHow to make Automation an asset for Organization
How to make Automation an asset for Organization
anuvip
 
Manual Testing software testing all slide
Manual Testing software testing all slideManual Testing software testing all slide
Manual Testing software testing all slide
SmileySmiley39
 
Testing Metrics and Tools, Analyse de tests
Testing Metrics and Tools, Analyse de testsTesting Metrics and Tools, Analyse de tests
Testing Metrics and Tools, Analyse de tests
HervKoya
 
manualtesting-170218090020 (1).pdf
manualtesting-170218090020 (1).pdfmanualtesting-170218090020 (1).pdf
manualtesting-170218090020 (1).pdf
peramdevi06
 
Software Testing Foundations Part 8 - Test Tools
Software Testing Foundations Part 8 - Test ToolsSoftware Testing Foundations Part 8 - Test Tools
Software Testing Foundations Part 8 - Test ToolsNikita Knysh
 
TEST_AUTOMATION_CASE_STUDY_(2)2[1]
TEST_AUTOMATION_CASE_STUDY_(2)2[1]TEST_AUTOMATION_CASE_STUDY_(2)2[1]
TEST_AUTOMATION_CASE_STUDY_(2)2[1]Clive Dall
 
software testing
 software testing software testing
software testing
Sara shall
 

Similar to Software quality metrics (20)

ISTQB foundation level - day 2
ISTQB foundation level - day 2ISTQB foundation level - day 2
ISTQB foundation level - day 2
 
What is Test Matrix?
What is Test Matrix?What is Test Matrix?
What is Test Matrix?
 
Questions for successful test automation projects
Questions for successful test automation projectsQuestions for successful test automation projects
Questions for successful test automation projects
 
Software test management
Software test managementSoftware test management
Software test management
 
The QA/Testing Process
The QA/Testing ProcessThe QA/Testing Process
The QA/Testing Process
 
Testing strategy for agile projects updated
Testing strategy for agile projects updatedTesting strategy for agile projects updated
Testing strategy for agile projects updated
 
Metrics based Management
Metrics based ManagementMetrics based Management
Metrics based Management
 
unit-5 SPM.pptx
unit-5 SPM.pptxunit-5 SPM.pptx
unit-5 SPM.pptx
 
WINSEM2021-22_ITE2004_ETH_VL2021220500452_Reference_Material_I_21-04-2022_TES...
WINSEM2021-22_ITE2004_ETH_VL2021220500452_Reference_Material_I_21-04-2022_TES...WINSEM2021-22_ITE2004_ETH_VL2021220500452_Reference_Material_I_21-04-2022_TES...
WINSEM2021-22_ITE2004_ETH_VL2021220500452_Reference_Material_I_21-04-2022_TES...
 
Continuous testing in agile projects 2015
Continuous testing in agile projects 2015Continuous testing in agile projects 2015
Continuous testing in agile projects 2015
 
Software Engineering (Software Quality Assurance & Testing: Supplementary Mat...
Software Engineering (Software Quality Assurance & Testing: Supplementary Mat...Software Engineering (Software Quality Assurance & Testing: Supplementary Mat...
Software Engineering (Software Quality Assurance & Testing: Supplementary Mat...
 
Definition of Done and Product Backlog refinement
Definition of Done and Product Backlog refinementDefinition of Done and Product Backlog refinement
Definition of Done and Product Backlog refinement
 
Test planning and software's engineering
Test planning and software's engineeringTest planning and software's engineering
Test planning and software's engineering
 
How to make Automation an asset for Organization
How to make Automation an asset for OrganizationHow to make Automation an asset for Organization
How to make Automation an asset for Organization
 
Manual Testing software testing all slide
Manual Testing software testing all slideManual Testing software testing all slide
Manual Testing software testing all slide
 
Testing Metrics and Tools, Analyse de tests
Testing Metrics and Tools, Analyse de testsTesting Metrics and Tools, Analyse de tests
Testing Metrics and Tools, Analyse de tests
 
manualtesting-170218090020 (1).pdf
manualtesting-170218090020 (1).pdfmanualtesting-170218090020 (1).pdf
manualtesting-170218090020 (1).pdf
 
Software Testing Foundations Part 8 - Test Tools
Software Testing Foundations Part 8 - Test ToolsSoftware Testing Foundations Part 8 - Test Tools
Software Testing Foundations Part 8 - Test Tools
 
TEST_AUTOMATION_CASE_STUDY_(2)2[1]
TEST_AUTOMATION_CASE_STUDY_(2)2[1]TEST_AUTOMATION_CASE_STUDY_(2)2[1]
TEST_AUTOMATION_CASE_STUDY_(2)2[1]
 
software testing
 software testing software testing
software testing
 

More from Sandeep Supal

Idea digital language - UX moodboard and content writing
Idea digital language  -  UX moodboard and content writingIdea digital language  -  UX moodboard and content writing
Idea digital language - UX moodboard and content writing
Sandeep Supal
 
CSF - UX iOS
CSF - UX iOSCSF - UX iOS
CSF - UX iOS
Sandeep Supal
 
ProHealth
ProHealthProHealth
ProHealth
Sandeep Supal
 
Restaurant application ux delivery
Restaurant application ux deliveryRestaurant application ux delivery
Restaurant application ux delivery
Sandeep Supal
 
The restaurant app
The restaurant app The restaurant app
The restaurant app
Sandeep Supal
 
Email template editor
Email template editorEmail template editor
Email template editor
Sandeep Supal
 
Email ck editor
Email ck editorEmail ck editor
Email ck editor
Sandeep Supal
 
Project iHeal
Project iHealProject iHeal
Project iHeal
Sandeep Supal
 
Datagrinch product experience
Datagrinch product experienceDatagrinch product experience
Datagrinch product experience
Sandeep Supal
 
Project ux intel
Project ux intelProject ux intel
Project ux intel
Sandeep Supal
 
Restaurant Application Project workflow
Restaurant Application Project workflowRestaurant Application Project workflow
Restaurant Application Project workflow
Sandeep Supal
 
Restaurant application UX delivery
Restaurant application UX deliveryRestaurant application UX delivery
Restaurant application UX deliverySandeep Supal
 
eCommerce sample wireframes
eCommerce sample wireframeseCommerce sample wireframes
eCommerce sample wireframes
Sandeep Supal
 
eTorF (MPAS) website-ecosystem
eTorF (MPAS) website-ecosystemeTorF (MPAS) website-ecosystem
eTorF (MPAS) website-ecosystemSandeep Supal
 
eTorF website-implementation-rules
eTorF website-implementation-ruleseTorF website-implementation-rules
eTorF website-implementation-rulesSandeep Supal
 
eTorF Website-template-documentation
eTorF Website-template-documentationeTorF Website-template-documentation
eTorF Website-template-documentationSandeep Supal
 
Stakeholder Questionnaire
Stakeholder QuestionnaireStakeholder Questionnaire
Stakeholder QuestionnaireSandeep Supal
 
Mundu entertainment Storyboard
Mundu entertainment StoryboardMundu entertainment Storyboard
Mundu entertainment StoryboardSandeep Supal
 
Course curriculum, Department of Design, IITG- India
Course curriculum, Department of Design, IITG- IndiaCourse curriculum, Department of Design, IITG- India
Course curriculum, Department of Design, IITG- IndiaSandeep Supal
 

More from Sandeep Supal (20)

Idea digital language - UX moodboard and content writing
Idea digital language  -  UX moodboard and content writingIdea digital language  -  UX moodboard and content writing
Idea digital language - UX moodboard and content writing
 
CSF - UX iOS
CSF - UX iOSCSF - UX iOS
CSF - UX iOS
 
ProHealth
ProHealthProHealth
ProHealth
 
Restaurant application ux delivery
Restaurant application ux deliveryRestaurant application ux delivery
Restaurant application ux delivery
 
The restaurant app
The restaurant app The restaurant app
The restaurant app
 
Email template editor
Email template editorEmail template editor
Email template editor
 
Email ck editor
Email ck editorEmail ck editor
Email ck editor
 
Project iHeal
Project iHealProject iHeal
Project iHeal
 
Datagrinch product experience
Datagrinch product experienceDatagrinch product experience
Datagrinch product experience
 
Project ux intel
Project ux intelProject ux intel
Project ux intel
 
Restaurant Application Project workflow
Restaurant Application Project workflowRestaurant Application Project workflow
Restaurant Application Project workflow
 
Restaurant application UX delivery
Restaurant application UX deliveryRestaurant application UX delivery
Restaurant application UX delivery
 
eCommerce sample wireframes
eCommerce sample wireframeseCommerce sample wireframes
eCommerce sample wireframes
 
eTorF task-lists
eTorF task-listseTorF task-lists
eTorF task-lists
 
eTorF (MPAS) website-ecosystem
eTorF (MPAS) website-ecosystemeTorF (MPAS) website-ecosystem
eTorF (MPAS) website-ecosystem
 
eTorF website-implementation-rules
eTorF website-implementation-ruleseTorF website-implementation-rules
eTorF website-implementation-rules
 
eTorF Website-template-documentation
eTorF Website-template-documentationeTorF Website-template-documentation
eTorF Website-template-documentation
 
Stakeholder Questionnaire
Stakeholder QuestionnaireStakeholder Questionnaire
Stakeholder Questionnaire
 
Mundu entertainment Storyboard
Mundu entertainment StoryboardMundu entertainment Storyboard
Mundu entertainment Storyboard
 
Course curriculum, Department of Design, IITG- India
Course curriculum, Department of Design, IITG- IndiaCourse curriculum, Department of Design, IITG- India
Course curriculum, Department of Design, IITG- India
 

Recently uploaded

Dev Dives: Train smarter, not harder – active learning and UiPath LLMs for do...
Dev Dives: Train smarter, not harder – active learning and UiPath LLMs for do...Dev Dives: Train smarter, not harder – active learning and UiPath LLMs for do...
Dev Dives: Train smarter, not harder – active learning and UiPath LLMs for do...
UiPathCommunity
 
Kubernetes & AI - Beauty and the Beast !?! @KCD Istanbul 2024
Kubernetes & AI - Beauty and the Beast !?! @KCD Istanbul 2024Kubernetes & AI - Beauty and the Beast !?! @KCD Istanbul 2024
Kubernetes & AI - Beauty and the Beast !?! @KCD Istanbul 2024
Tobias Schneck
 
Essentials of Automations: Optimizing FME Workflows with Parameters
Essentials of Automations: Optimizing FME Workflows with ParametersEssentials of Automations: Optimizing FME Workflows with Parameters
Essentials of Automations: Optimizing FME Workflows with Parameters
Safe Software
 
FIDO Alliance Osaka Seminar: FIDO Security Aspects.pdf
FIDO Alliance Osaka Seminar: FIDO Security Aspects.pdfFIDO Alliance Osaka Seminar: FIDO Security Aspects.pdf
FIDO Alliance Osaka Seminar: FIDO Security Aspects.pdf
FIDO Alliance
 
PCI PIN Basics Webinar from the Controlcase Team
PCI PIN Basics Webinar from the Controlcase TeamPCI PIN Basics Webinar from the Controlcase Team
PCI PIN Basics Webinar from the Controlcase Team
ControlCase
 
Slack (or Teams) Automation for Bonterra Impact Management (fka Social Soluti...
Slack (or Teams) Automation for Bonterra Impact Management (fka Social Soluti...Slack (or Teams) Automation for Bonterra Impact Management (fka Social Soluti...
Slack (or Teams) Automation for Bonterra Impact Management (fka Social Soluti...
Jeffrey Haguewood
 
FIDO Alliance Osaka Seminar: Passkeys and the Road Ahead.pdf
FIDO Alliance Osaka Seminar: Passkeys and the Road Ahead.pdfFIDO Alliance Osaka Seminar: Passkeys and the Road Ahead.pdf
FIDO Alliance Osaka Seminar: Passkeys and the Road Ahead.pdf
FIDO Alliance
 
Connector Corner: Automate dynamic content and events by pushing a button
Connector Corner: Automate dynamic content and events by pushing a buttonConnector Corner: Automate dynamic content and events by pushing a button
Connector Corner: Automate dynamic content and events by pushing a button
DianaGray10
 
Elevating Tactical DDD Patterns Through Object Calisthenics
Elevating Tactical DDD Patterns Through Object CalisthenicsElevating Tactical DDD Patterns Through Object Calisthenics
Elevating Tactical DDD Patterns Through Object Calisthenics
Dorra BARTAGUIZ
 
FIDO Alliance Osaka Seminar: Overview.pdf
FIDO Alliance Osaka Seminar: Overview.pdfFIDO Alliance Osaka Seminar: Overview.pdf
FIDO Alliance Osaka Seminar: Overview.pdf
FIDO Alliance
 
AI for Every Business: Unlocking Your Product's Universal Potential by VP of ...
AI for Every Business: Unlocking Your Product's Universal Potential by VP of ...AI for Every Business: Unlocking Your Product's Universal Potential by VP of ...
AI for Every Business: Unlocking Your Product's Universal Potential by VP of ...
Product School
 
Securing your Kubernetes cluster_ a step-by-step guide to success !
Securing your Kubernetes cluster_ a step-by-step guide to success !Securing your Kubernetes cluster_ a step-by-step guide to success !
Securing your Kubernetes cluster_ a step-by-step guide to success !
KatiaHIMEUR1
 
Encryption in Microsoft 365 - ExpertsLive Netherlands 2024
Encryption in Microsoft 365 - ExpertsLive Netherlands 2024Encryption in Microsoft 365 - ExpertsLive Netherlands 2024
Encryption in Microsoft 365 - ExpertsLive Netherlands 2024
Albert Hoitingh
 
LF Energy Webinar: Electrical Grid Modelling and Simulation Through PowSyBl -...
LF Energy Webinar: Electrical Grid Modelling and Simulation Through PowSyBl -...LF Energy Webinar: Electrical Grid Modelling and Simulation Through PowSyBl -...
LF Energy Webinar: Electrical Grid Modelling and Simulation Through PowSyBl -...
DanBrown980551
 
Epistemic Interaction - tuning interfaces to provide information for AI support
Epistemic Interaction - tuning interfaces to provide information for AI supportEpistemic Interaction - tuning interfaces to provide information for AI support
Epistemic Interaction - tuning interfaces to provide information for AI support
Alan Dix
 
Leading Change strategies and insights for effective change management pdf 1.pdf
Leading Change strategies and insights for effective change management pdf 1.pdfLeading Change strategies and insights for effective change management pdf 1.pdf
Leading Change strategies and insights for effective change management pdf 1.pdf
OnBoard
 
Monitoring Java Application Security with JDK Tools and JFR Events
Monitoring Java Application Security with JDK Tools and JFR EventsMonitoring Java Application Security with JDK Tools and JFR Events
Monitoring Java Application Security with JDK Tools and JFR Events
Ana-Maria Mihalceanu
 
State of ICS and IoT Cyber Threat Landscape Report 2024 preview
State of ICS and IoT Cyber Threat Landscape Report 2024 previewState of ICS and IoT Cyber Threat Landscape Report 2024 preview
State of ICS and IoT Cyber Threat Landscape Report 2024 preview
Prayukth K V
 
The Future of Platform Engineering
The Future of Platform EngineeringThe Future of Platform Engineering
The Future of Platform Engineering
Jemma Hussein Allen
 
The Art of the Pitch: WordPress Relationships and Sales
The Art of the Pitch: WordPress Relationships and SalesThe Art of the Pitch: WordPress Relationships and Sales
The Art of the Pitch: WordPress Relationships and Sales
Laura Byrne
 

Recently uploaded (20)

Dev Dives: Train smarter, not harder – active learning and UiPath LLMs for do...
Dev Dives: Train smarter, not harder – active learning and UiPath LLMs for do...Dev Dives: Train smarter, not harder – active learning and UiPath LLMs for do...
Dev Dives: Train smarter, not harder – active learning and UiPath LLMs for do...
 
Kubernetes & AI - Beauty and the Beast !?! @KCD Istanbul 2024
Kubernetes & AI - Beauty and the Beast !?! @KCD Istanbul 2024Kubernetes & AI - Beauty and the Beast !?! @KCD Istanbul 2024
Kubernetes & AI - Beauty and the Beast !?! @KCD Istanbul 2024
 
Essentials of Automations: Optimizing FME Workflows with Parameters
Essentials of Automations: Optimizing FME Workflows with ParametersEssentials of Automations: Optimizing FME Workflows with Parameters
Essentials of Automations: Optimizing FME Workflows with Parameters
 
FIDO Alliance Osaka Seminar: FIDO Security Aspects.pdf
FIDO Alliance Osaka Seminar: FIDO Security Aspects.pdfFIDO Alliance Osaka Seminar: FIDO Security Aspects.pdf
FIDO Alliance Osaka Seminar: FIDO Security Aspects.pdf
 
PCI PIN Basics Webinar from the Controlcase Team
PCI PIN Basics Webinar from the Controlcase TeamPCI PIN Basics Webinar from the Controlcase Team
PCI PIN Basics Webinar from the Controlcase Team
 
Slack (or Teams) Automation for Bonterra Impact Management (fka Social Soluti...
Slack (or Teams) Automation for Bonterra Impact Management (fka Social Soluti...Slack (or Teams) Automation for Bonterra Impact Management (fka Social Soluti...
Slack (or Teams) Automation for Bonterra Impact Management (fka Social Soluti...
 
FIDO Alliance Osaka Seminar: Passkeys and the Road Ahead.pdf
FIDO Alliance Osaka Seminar: Passkeys and the Road Ahead.pdfFIDO Alliance Osaka Seminar: Passkeys and the Road Ahead.pdf
FIDO Alliance Osaka Seminar: Passkeys and the Road Ahead.pdf
 
Connector Corner: Automate dynamic content and events by pushing a button
Connector Corner: Automate dynamic content and events by pushing a buttonConnector Corner: Automate dynamic content and events by pushing a button
Connector Corner: Automate dynamic content and events by pushing a button
 
Elevating Tactical DDD Patterns Through Object Calisthenics
Elevating Tactical DDD Patterns Through Object CalisthenicsElevating Tactical DDD Patterns Through Object Calisthenics
Elevating Tactical DDD Patterns Through Object Calisthenics
 
FIDO Alliance Osaka Seminar: Overview.pdf
FIDO Alliance Osaka Seminar: Overview.pdfFIDO Alliance Osaka Seminar: Overview.pdf
FIDO Alliance Osaka Seminar: Overview.pdf
 
AI for Every Business: Unlocking Your Product's Universal Potential by VP of ...
AI for Every Business: Unlocking Your Product's Universal Potential by VP of ...AI for Every Business: Unlocking Your Product's Universal Potential by VP of ...
AI for Every Business: Unlocking Your Product's Universal Potential by VP of ...
 
Securing your Kubernetes cluster_ a step-by-step guide to success !
Securing your Kubernetes cluster_ a step-by-step guide to success !Securing your Kubernetes cluster_ a step-by-step guide to success !
Securing your Kubernetes cluster_ a step-by-step guide to success !
 
Encryption in Microsoft 365 - ExpertsLive Netherlands 2024
Encryption in Microsoft 365 - ExpertsLive Netherlands 2024Encryption in Microsoft 365 - ExpertsLive Netherlands 2024
Encryption in Microsoft 365 - ExpertsLive Netherlands 2024
 
LF Energy Webinar: Electrical Grid Modelling and Simulation Through PowSyBl -...
LF Energy Webinar: Electrical Grid Modelling and Simulation Through PowSyBl -...LF Energy Webinar: Electrical Grid Modelling and Simulation Through PowSyBl -...
LF Energy Webinar: Electrical Grid Modelling and Simulation Through PowSyBl -...
 
Epistemic Interaction - tuning interfaces to provide information for AI support
Epistemic Interaction - tuning interfaces to provide information for AI supportEpistemic Interaction - tuning interfaces to provide information for AI support
Epistemic Interaction - tuning interfaces to provide information for AI support
 
Leading Change strategies and insights for effective change management pdf 1.pdf
Leading Change strategies and insights for effective change management pdf 1.pdfLeading Change strategies and insights for effective change management pdf 1.pdf
Leading Change strategies and insights for effective change management pdf 1.pdf
 
Monitoring Java Application Security with JDK Tools and JFR Events
Monitoring Java Application Security with JDK Tools and JFR EventsMonitoring Java Application Security with JDK Tools and JFR Events
Monitoring Java Application Security with JDK Tools and JFR Events
 
State of ICS and IoT Cyber Threat Landscape Report 2024 preview
State of ICS and IoT Cyber Threat Landscape Report 2024 previewState of ICS and IoT Cyber Threat Landscape Report 2024 preview
State of ICS and IoT Cyber Threat Landscape Report 2024 preview
 
The Future of Platform Engineering
The Future of Platform EngineeringThe Future of Platform Engineering
The Future of Platform Engineering
 
The Art of the Pitch: WordPress Relationships and Sales
The Art of the Pitch: WordPress Relationships and SalesThe Art of the Pitch: WordPress Relationships and Sales
The Art of the Pitch: WordPress Relationships and Sales
 

Software quality metrics

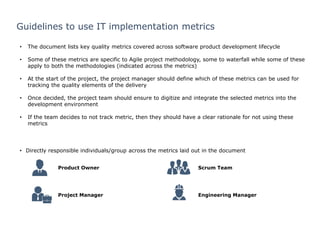
  • 1. 0 Guidelines to use IT implementation metrics • The document lists key quality metrics covered across software product development lifecycle • Some of these metrics are specific to Agile project methodology, some to waterfall while some of these apply to both the methodologies (indicated across the metrics) • At the start of the project, the project manager should define which of these metrics can be used for tracking the quality elements of the delivery • Once decided, the project team should ensure to digitize and integrate the selected metrics into the development environment • If the team decides to not track metric, then they should have a clear rationale for not using these metrics • Directly responsible individuals/group across the metrics laid out in the document Product Owner Project Manager Engineering Manager Scrum Team
  • 2. 1 Key IT implementation metrics across project lifecycle CloseExecutePlan Agile process metrics (Lead/cycle/burndown/velocity/cumulative flow/flow efficiency/Backlog health/Scope creep/story estimation) Req./Ini. Development > Testing > Implementation Support > MaintenancePlanning > Analysis > Design Plan metrics Planning and Analysis A. Sizing estimate B. Level of completeness C. Definition of Ready D. Backlog management index (BMI) Design metric A. Prototype testing (Design acceptance) Execution metrics Develop- ment A. Code coverage B. Code churn Testing A. Percentage of Automation coverage per feature B. Cost of Poor Quality C. Defect removal efficiency D. SIT success criteria E. UAT success criteria F. Coding standards adherence Implem- entation A. Number of High priority/severity defects remaining open B. Application crash rate C. Release success rate D. Release adoption rate Go-live/ Rollout A. % of target user on-boarded B. Training and Education resources completeness Closure metrics Support and Mainten- ance A. Endpoint incidents reports B. Incident response/resolutio n rate C. Application availability time User adoption metric A. % of target user group adopted B. Frequency of use C. Phase out % for legacy systems D. Advocacy rate 1 2 3 4 7 8 5 6 9 Orange highlighted metrics are used for Agile project delivery
  • 3. 2 Planning & Analysis metrics Backup 1A 1B Metric Description How to measure Measure of goodness Sizing estimation • Relative estimation for size of software application to agree on work scope • Methods – Planning poker, T-shirt sizing, Dot-voting, Affinity mapping • T-shirt sizing is most commonly used • Measured as storypoints, tracked on Jira • For, large backlog or epics/concurrent scrum teams, T-shirt sizing done is XS,S,M,L,XL Completeness & Exclusivity of stories Level of complete- ness • Completeness of a backlog covers each story with end-user identified, product feature defined and benefits are traced. • Definition of Done (DoD) is used to assess when user story has been completed & reviewed at the release level • Measured by aligning DoD to each user story • DoD=(Number of user stories delivered /Number of user stories forecasted)*100 • DoD should be configured and PO should click & accept the Done button for each story • Fully filled product backlog • DoD % > 90% is a good measure of acceptance Definition of Ready • Stories must be immediately actionable • Determine what needs to be done & amount of work required to complete each User Story DoR for User story • User Story defined and dependencies identified • User Story sized by Delivery Team • Scrum Team accepts User Experience artefacts • Performance criteria identified, where appropriate • Person who will accept the User Story is identified • Team has a good idea what it will mean to Demo the User Story Backlog management index (BMI) (replenish- ment index) • Backlog management index (BMI) is an indication of success of project work & understanding of the stability & control • Backlog should have N+2 worth of effort, where N is number of sprints to be delivered • (Total number of problems closed during a month/Total number of problems opened during the month)*100 • BMI > 100% is a good measure of stability & control A WAgile Waterfall A A 1C A Product Owner Scrum team 1D A
  • 4. 3 Design metrics: Backup 2A Metric Description How to measure Tools Measure of goodness Prototype testing (Design acceptance rate) • System Usability Scale – reliable and most widely used tool to measure usability • Rate the heuristics on their level of agreement on 5-point scale on the high-fidelity prototypes • Surveys (Score >80) • Task time • Time to complete the allocated task • Silverback • Crazyegg • Five second test • Optimizely • Usabilla • User testing • Use of Search vs Navigation • (Total number of tasks completed through search or navigation/ Total number of completed tasks)*100 • User error occurrence rate for - Single error opportunity/task (I) - Multiple error opportunity/task (II) • (I)=(Total number of occurred errors for all users)/(Total number of error opportunities for all users)*100 • (II)=(Number of errors)/(Total number of task attempts) *100 • Task success rate • (Total Number of user task completed successfully) / (Total Number of user attempts defined for the prototype test)*100 A WAgile Waterfall A *Only for development teams - as input from UX Team UX /Usability analyst
  • 5. 4 Development Metric: Code coverage Backup Source: From Dev tool - Coveralls 3A Metric Description How to measure Tools Measure of goodness Code Coverage • Critical metric for the test-driven development (TDD) practice and continuous delivery • Measure how many lines of code or blocks are executed while automated tests are running • Coveralls • SonarQube • Junits • Corbertura (Better Performance)WA A WAgile WaterfallEngineering Manager
  • 6. 5 Development Metric: Code churn Backup 3B Metric Description How to measure Tools Measure of goodness Code Churn • Allows for assessing the code stability at different development stages through visualization of trends and fluctuations that happen to a code base • Measure how many lines of code were added, removed, or changed • Can be automated with tools or at the code repository level • Git or Jira • Codescene • Codecount • Code analyzer • StatSVN Better PerformanceWA A WAgile Waterfall * For Sample reference Engineering Manager
  • 7. 6 Test Metric: % of automation coverage per feature Backup 4A Metric Description How to measure Tools Measure of goodness % of automation coverage per feature • If the product undergoes constant improvements, testing for regression should be automated • Allows to prioritize the features that o may suffer from regression after updates o for which automated tests are critical • Measure proportion per feature covered with automated tests against those tested manually • Automation index = (Number of Automated tests/ Total number of tests) • Tricentis • HP UFT • Selenium • Appium • Jmeter • Load- runner >80% (Higher the Number of Manual tests that can be automated) WA A WAgile WaterfallProduct Owner
  • 8. 7 Test Metrics: 4A 4B 4C Metric Description How to measure Tools Measure of goodness Cost of Poor Quality (COPQ) • The cost a company pays when all of its products are not perfect. • Defects in development effort (DDE) is proportional to COPQ • COPQ = Cost related to detection of defects + Cost due to occurrence of defects • DDE = (Total number of defects reported) /(Work-man hrs. consumed in sprint) • Retrace • Appdynamics • New Relic Better Performance Defect Removal Efficiency • Development quality for the defect removal is reported before production (QA testing) & after production (live state) • It identifies the test effectiveness of the system. • (Number of defects found before production) / (Number of defects found before production + Number of defects found after production) • Retrace • Appdynamics • New Relic Better Efficiency UAT Success Criteria (UAT Defect leakage) • UAT Defect leakage is used to identify the efficiency of the QA testing during the UAT phase • Defect Leakage is also called as Bug Leak • UAT Defect leakage = (Total Number of UAT Defects) / (Total Number of Valid Test Defects+ Total Number of UAT Defects)*100 • Valid tests are assigned priority/severity levels • Tricentis • HP UFT (% of successfully passed test cases at UAT gate) • Percentage of successfully passed test cases at the UAT gate • (Total number of successfully passed test cases/Total number of test cases agreed for UAT)*100 • Tircentis • HP UFT • Jira 95% > to pass UAT gate Backup W W WA A WAgile Waterfall WA Engineering Manager Product Owner
  • 9. 8 Test Metrics: 4D Metric Description How to measure Tools Measure of goodness SIT success Criteria (SIT Defect leakage) • SIT Defect leakage leakage is used to identify the efficiency of the QA testing during the SIT phase • Defect Leakage is also called as Bug Leak • (Total Number of SIT Defects) / ((Total Number of Valid Test Defects) + (Total Number of SIT Defects))*100 • Tricentis • HP UFT (Quality ratio) • Quality ratio helps to assess the success in the QA environment • Quality ratio= (Successful Test Cases/ Total Test Cases) * 100 • Jira • HP UFT • Tricentis 90-95%> quality ratio Coding standards adherence • Set of guidelines, best practice, programming styles & conventions that developers adhere to when writing source code for a project • Commenting • Naming convention • Simplicity in code • Portability • Code refactoring • W3C Code validations • W3C standards • Code validator • Extensive code reviews 4E Backup W W A WAgile Waterfall WA Engineering Manager
  • 10. 9 Implementation Metric: Backup 5A 5B 5C 5D Metric Description How to measure Tools Measure of goodness Number of high priority defects open • Defects are reported basis priority and severity levels, with development team assigned to close high/medium priority • Count of the high priority or high severity defects in open state after release • Jira • Confluence (Better Performance) Application crash rate • Application crash is measured by number of times the application failed or features were non-functional • Number of application fails times (F) per usage (U) [F/U] • Retrace • Appdynamics • New Relic Better Adoption Release success rate • Release success is planned by scrum team' agreement to software release • Attributes to the improvement in velocity, efficiency, quality, as the key indicators • Improved velocity to deliver (pace of implementation ) or • Improvement in Efficiency (fewer cycles in production) • Improved Quality (Fewer defects) • XebiaLabs • Electriccloud • CA tech Release adoption rate • Release adoption is determined by number of active users during the initial release period • (Number of user active for the new release / Total Number of targeted users )*100 • Platform dependent tools WA WA WA WA A WAgile WaterfallEngineering Manager Project Manager
  • 11. 10 Go-live/Roll-out metrics 6A 6B Metric Description How to measure Tools Measure of goodness % of target users on- boarded • During the product roll-out, user on-boarding is done through tracking the number of installs/sign-ups etc. • Product owner measures and analyses user onboarding • Number of user on-boarded per application install or signup/ Total Number of targeted users • Platform dependent tools Better Performance Training and Education resources complete ness • Training material like release notes, product walkthroughs and the education resources like how- tos, videos etc. for the release • Completeness/effectiveness in training material is usually measured through trainee surveys or assessments • Published release notes • Educational resources available to end-user Backup W W A WAgile WaterfallProduct Owner Project Manager
  • 12. 11 Support/Maintenance metrics 7A 7B 7C Metric Description How to measure Tools Measure of goodness Endpoint incidents reports • Reports on incidents classified as High priority / High severity post implementation & system gene- rated logs on system down-time • Endpoints incidents are classified in types – software, hardware, service request etc. • SiT • Jira Better Performance Incident response/ resolution rate • Incident response is acknowledgement to end-user on reported incident • Incident resolution is solution implemented by technical team to bring back system to functional state • (Number of incidents responded within defined target response time / Total number of incidents reported)*100 • (Number of incidents resolved within defined target resolution time / Total number of incidents reported)*100 • Managed through triage on Jira/SiT before taking up for resolution • SiT • Jira Better Performance Application availability time • Continuous application availability reported by the system • Project manager reviews the application availability time on a daily basis • (1-application downtime/24 hours)*100% • Platform dependent tools High availability rate is 99.99%. Backup W W W A WAgile WaterfallProject Manager
  • 13. 12 Metric Description How to measure Tools Measure of goodness % of target user group adopted • Adoption rate for target user group, that determines the success of the product • (Number of user fully-adopted the product) /(Number of targeted user base for adoption)*100 • Platform dependent tools Better Performance Frequency of use • Frequency of product usage tracked over week or month for a software release vis-à-vis expected frequency of use • (Number of user sessions per user)/(week or month) • Total Time spent (sum of session time) by users over days or weeks • Jira Better Adoption Legacy applications phase out effective- ness • To ensure better adoption of product and new systems, business needs to sunset legacy applications • (Time spent by target users on legacy systems in use/ Total number of hours spent by target users on applications)*100 • Platform dependent tools Advocacy rate • Advocacy for adoption of product and new systems is done through existing users or senior users, usually tracked through a satisfaction survey • Net promoter score from satisfaction survey. • (Number of Promoters - Number of Detractors) / (Number of Respondents) *100 • Google surveys • Survey- monkey • Qualtrics (Better Adoption) User adoption metrics 8A 8B 8C 8D Backup W W W W A WAgile Waterfall A A A A Product Owner Note: In addition to above, software teams use Google Analytics to analyze data like session quality, page insights, active users, LTV, workflow behavior etc. and draw insights and reports on user adoption.
  • 14. 13 Metric Description How to measure Measure of goodness Sprint velocity • Key metric of a scrum • Measure of the amount of work a Team can tackle during a single Sprint and is the key metric in Scrum • Product owner measures the number of features completed in a sprint • Velocity index is number of sprint/project & unique for realistic team commitment (Better Performance) Sprint Burndown • Amount of work remaining to be done before the end of a sprint • Displays progress towards the goal instead of listing items • Helps to uncover planning mistakes • Number of story points remaining/day. • Extrapolating the line of sprint burn down results to the forecasted release date (Steeper graph) Agile Process Metrics Backup 9 A A Tool used - Jira Product Owner
  • 15. 14 Agile Process Metrics Backup 9 Metric Description How to measure Measure of goodness Cumulative Flow • Identifies when the work-in-progress (WIP) limits are exceeded • Cycle time is a mechanical measure of process capability while lead time is what the customer sees • Teams with shorter cycle times are likely to have higher throughput • Value delivered against time • Lead time clock starts when the request is made and ends at delivery • Cycle time clock starts when work begins on the request and ends when the item is ready for delivery (Steeper graph) Flow Efficiency • Complements cumulative flow, it gives insights into the distribution between actual work and waiting periods • (Actual work time)/(Overall lead time)*100 (Steeper graph) A A Tool used - Jira Product Owner
  • 16. 15 Agile Process Metrics9 Backup Metric Description How to measure Measure of goodness Risk Burndown • Plot of the sum of the risk in the Product Backlog • Preferred tool for assessing risks to create a Risk Burndown Chart is Expected Monetary Value (EMV) • Number of stories carrying significant risk (in this case marked as “architecturally significant” in the backlog) multiplied by 10 (weighted) • Applying 80:20 rule, a factor of 5 or 10 is expected to work, as a rule of thumb about 20% of the backlog carries risk (steeper graph) A Tool used - Jira Product Owner