Research in the Age of the Context MachineCarsten Keßler
This document discusses research challenges in context-aware systems as context becomes more integrated into technology. It outlines the evolution from early location-based systems to modern context-aware systems that consider location as well as other contextual factors like weather, points of interest, connected devices, social relationships, schedules and interests. Three key research challenges are presented: 1) effective representation and integration of different types of context data, 2) determining what context is relevant for a given task and how this may differ between users, and 3) ensuring user privacy and control over what context data is shared while still enabling useful services.
GIS for the Masses: Volunteered Geographic InformationCarsten Keßler
Volunteered geographic information (VGI) refers to geographic data created, assembled, and disseminated by individuals voluntarily. Examples of VGI projects include OpenStreetMap, where over 1.4 million registered users have mapped over 2 billion nodes and 200 million ways. OpenStreetMap is a major VGI project that started in 2004 and now has comprehensive mapping data for the entire planet. Research on VGI focuses on data quality assessment, understanding contributor motivations, and integrating VGI into authoritative geographic systems.
Establishment of Remote Sensing Data Centre in NASTShristi Pradhan
My presentation at the Faculty of Technology, Nepal Academy of Science and Technology during my tenure as a researcher. I discussed on how remote sensing is applicable in the context of Nepal and our vision of establishing a remote sensing data centre in NAST.
Lemmens kessler-agile-linked data v3-slideshareRob Lemmens
Geo-Information Visualizations of Linked Data. Linked Data provides an ever-growing source of geographically referenced data for application development. In this paper, we analyse the workflow behind the development of such an application. Using two examples based on worldwide development aid and refugee data, we discuss the steps from locating data for use and data integration, up to the actual visualization in a web-based application. At each step, we discuss the skill set required for completion and point to potential challenges. This includes RDF, SPARQL, HTTP requests, HTML, and JavaScript. We conclude the paper by putting our case study in the context of GIScience curriculum development.
A presentation conducted by Dr Rohan Wickramasuriya, SMART Infrastructure Facility, University of Wollongong. Presented on Tuesday the 1st of October 2013.
Business Intelligence (BI) has popularly been adopted as a process that enables easy access, analysis and visualization of information through specialized set of tools for informed decision making. Two most noticeable characteristics of traditional BI is that it (a) is largely used in single-organization environments and (b) uses predominantly aspatial data. We believe that BI has applications beyond single-organization environments, but it very much requires integration of geospatial capabilities given the increasing availability of large volumes of spatial data and a growing interest to see things spatial. The SMART Infrastructure Dashboard (SID), our innovative solution that fuses BI and Geographic Information Systems (GIS), fills this significant gap. In this study, we demonstrate how SID can be used to perform spatio-temporal analysis and
visualization of diverse sets of data to uncover complex interrelationships among utility usage, demographics and weather patterns at local and regional scale.
Crowdsourcing and citizen science are becoming increasingly important sources of environmental data. Three eras of environmental information were outlined: 1) by experts for experts, 2) by experts for experts and the public, and 3) by experts and the public for both groups. However, citizen-produced data presents challenges like inconsistent metadata. A case study on noise maps highlighted these challenges and how additional context from websites or unknown sources can improve integration and use of crowdsourced geographic data.
Total Learning Architecture - Kalle Huhtala - Edita Publishing OyCOSS
Kehitysjohtaja Kalle Huhtalan esitys aiheesta Total Learning Architecture 22.5.2017 järjestetyssä Oppimisanalytiikka ja EU:n uudistuva tietosuojalainsäädäntö -seminaarissa. TIlaisuuden järjesti EduCloud Alliance.
Compass Informatics provides geographic information systems and environmental services including operating Ireland's National Biodiversity Data Centre. The company offers services in information management, geospatial technologies, and planning/environmental services. It has developed tools to support biodiversity data collection and sharing, water resource management, and pre-planning assessment of development sites.
softGIS API provides a JSON REST API with combined client JavaScript functions written in Dojo for querying geoJSON features and profiles according to their properties. The API uses a set of geoDjango/Django applications with Dojo JavaScript AJAX functions and MongoDB and PostGIS databases under an MIT license and is published on GitHub. Future plans include adding OpenID support, a production server, and algorithms for geographical statistical analysis, additional client libraries, and support for additional data formats.
An Assessment of Online PPGIS Case Studies in Urban Planning Geisa Bugs - Fe...Beniamino Murgante
The document summarizes and assesses four case studies of online Public Participation Geographic Information Systems (PPGIS) tools used in urban planning. It finds that while PPGIS tools have potential to improve public participation in decision making, few experiences have implemented them for urban planning. The document evaluates the case studies based on their level of interactivity, types of participation supported, and usability of the geographic information system components.
1. The document discusses the HTML5 Geolocation API which allows websites to retrieve a user's location with their permission.
2. The Geolocation API provides functions like getCurrentPosition and watchPosition to retrieve a user's location and track their location over time.
3. The API returns data like latitude, longitude, altitude and accuracy about a user's location that can be used for applications like social networking, search queries and mobile advertising with the user's consent.
Ralph Gimeno has over 6 years of experience in accounting and real estate. He currently works as an Assistant Property Appraiser in Abu Dhabi, with previous experience as an Accounting Assistant. He has skills in property valuation, Microsoft Office, accounting software, and typing over 60 words per minute. He has received several awards for performance and has worked in property management, accounting, and banking roles in the Philippines.
This document provides an overview of the Living+ platform at Aalto University, which brings together multiple schools and research groups to collaborate on projects related to sustainable living environments. It outlines some past and upcoming platform activities, including strategic research calls and breakfast meetings. The agenda for an event on the Living+ platform is presented, including welcome remarks, a presentation by the deputy mayor of Helsinki on city planning, and short research group presentations. Context, working methods, and special interests of some of the participating research groups are briefly described, focusing on areas like user experience, urban planning, sustainability, architecture, and technologies to support living environments.
Urban planning is a technical process that guides development while also considering public welfare and the environment. However, politics can interfere with planning when politicians pursue personal or party interests over strategic goals. This leads to issues like poor planning and decision making, poor project implementation, wasted resources, bias in planning, and unnecessary delays. To achieve effective development, political interference in the planning process must be reduced so that urban planners can do their jobs.
February 2012 Street Talks
Tim Gill, Rethinking Childhood: There's a salmon in my street - The outdoor child as an indicator species for the quality of urban environments
Brought to you by Movement for Liveable London - movementforliveablelondon.com
New Map Librarians: Local Perspectives and Local Experiences on Digital Spati...Rose Holley
The document discusses the challenges faced by map librarians in transitioning to digital spatial data and services. It outlines two projects at the University of Auckland to create a digital map library and spatial data collection called Landscoper and an index tool called MapLibrarian. The biggest challenges are having a clear vision and leadership, managing changing needs and expectations, securing funding, managing information, delivering access, and gaining support from stakeholders over time.
The document discusses how MapTable, a table-shaped computer interface controlled via pen, can improve the urban planning process. MapTable allows different stakeholders to collaboratively create, test, and evaluate plans. It provides advantages like calculating sustainability profiles and sound contours to get feedback and iteratively adjust plans, potentially improving quality and speeding up the planning process.
Towards 'Resilient Cities' - Harmonisation of Spatial Planning Information as...Beniamino Murgante
Towards 'Resilient Cities' - Harmonisation of Spatial Planning Information as One Step Along the Way
Manfred Schrenk, Julia Neuschmid, Daniela Patti - Department for Urbanism, Transport, Environment and Information Society, Central European Institute of Technology, Austria
This document provides a profile summary for Aleksander Karol Gumos. It includes his contact details, professional experience as a GIS specialist and engineer working for oil and gas companies, educational background including degrees in geoinformatics and geography, software skills and qualifications, publications, references, and interests. Over a career spanning more than 15 years, Gumos has gained extensive expertise in applied geographic information systems, 3D visualizations, simulations, and geoinformatics solutions for survey, life of field, and subsea engineering projects.
School on the Cloud: lessons from Digital Earth, Karl DonertBrussels, Belgium
The document discusses the School on the Cloud network, which aims to promote the use of cloud computing in education. It provides an overview of the Digital Earth network established by EUROGEO to connect geography educators and researchers across Europe. Through this network, several projects have been implemented to develop tools and resources for teaching geography concepts like spatial citizenship. Evaluation found the network helped raise awareness of geospatial topics and connect members to other European initiatives. The School on the Cloud network builds on these efforts and aims to facilitate cloud-based collaboration, easy sharing of resources, and personalized learning.
Crowdsourcing involves breaking large tasks into smaller pieces that can be completed by members of the general public, often online. It provides benefits like lower costs, greater scale and access to citizen data. However, it also faces challenges like ensuring data quality and sustained participation. Well-designed projects and engagement are needed to motivate crowds and address issues. Quality assurance processes are important to build trust in citizen science.
The document discusses I-GIS, a geoscience software company based in Denmark. It describes I-GIS's groundwater mapping work in Denmark, which involved a 15-year, $200 million campaign to map groundwater using tools like GeoScene3D. GeoScene3D is now used by the Danish government and private companies to build 3D geological models, share data, and conduct advanced groundwater analysis and modeling.
This file contains my experience and showcase of my work in GIS and Remote Sensing.
I hope it will help you to make it easy to understand my skill in Geospatial Science.
Plannning Parks for Liveable Cities: Green Technology Design Practice for Tas...Rijal Saffuan
The document discusses planning a park to make cities more livable. It proposes a multi-disciplinary design for a park near Kuala Lumpur that incorporates green technology innovations. Soil, water and site analyses were conducted to inform the design which includes active areas like sports facilities and more passive areas like gardens and walking paths. The goal is for the park to serve the community while addressing climate change through sustainable features.
GI Learner: A project to develop geospatial thinking learning lines in second...Karl Donert
Almost all aspects of our economy and society are based on geoinformation and geotechnologies. People are tracking, mapping and communicating geographically on an unprecedented scale. Citizens can be empowered by geospatial technologies and open geodata. The sector is booming, however there has been a clear mismatch between workforce demand and supply. Study programmes focus more on informatics than on the scientific background of spatial thinking.
This presentation seeks to introduce a newly EU funded project titled, GI-Learner: Developing a learning line on GIScience in school education. This project aims to support the introduction of GI Science in secondary (high school) education, by addressing policy developments and deliver materials with the capacity and capability to raise awareness of the GI sector, create a geospatially literate workforce and citizens who can benefit from these developments.
The Center for Learning and Knowledge Technologies (CeLeKT) at Linnæus University in Sweden conducts research on mobile systems and social media to support collaborative learning. Their current projects include LETS GO on mobile science collaboratories, GeM on mobile math learning, mLearn2go on a learning toolbox, and Gifted Math utilizing classroom technologies. They discussed collaborating with Taiwan researchers on future projects and exchanging students and researchers.
Extreme Citizen Science: the socio-political potential of citizen scienceMuki Haklay
Slides from a talk at the International Congress for Conservation Biology / European Congress for Conservation Biology 2015 (Montpellier 2-6 August). The talk positioned citizen science within the wider context of production and use of environmental information, and emphasised the need to extend citizen science to a wider audience. It also demonstrated how technology can be used within a careful participatory process.
This document announces a conference on Big Data from Space to be held from 12-14 November 2014 in Frascati, Italy. The conference aims to bring together researchers, engineers, and users in the area of Big Data from the space sector to discuss topics across the data lifecycle from acquisition to analysis and exploitation. It seeks to foster networking and synergies across domains like Earth observation, space science, and other fields dealing with large, complex datasets. The call invites abstract submissions on major Big Data topics until July 31, addressing data volume, velocity, variety and veracity across the space domain.
The document describes the Dublin Dashboard, an interactive online platform that provides real-time data and visualizations about Dublin to help answer questions about how the city is performing. It was developed by researchers at Maynooth University in partnership with Dublin City Council. The dashboard includes indicators of Dublin's economy, environment and society. It aims to make city data openly available to help with decision making, debate and policy. The researchers plan to continue expanding the dashboard's functions and encouraging others to build applications that utilize the data.
Similar to SoftGIS for colloborative Impact Assessment (20)
Travis Hills' Endeavors in Minnesota: Fostering Environmental and Economic Pr...Travis Hills MN
Travis Hills of Minnesota developed a method to convert waste into high-value dry fertilizer, significantly enriching soil quality. By providing farmers with a valuable resource derived from waste, Travis Hills helps enhance farm profitability while promoting environmental stewardship. Travis Hills' sustainable practices lead to cost savings and increased revenue for farmers by improving resource efficiency and reducing waste.
Immersive Learning That Works: Research Grounding and Paths ForwardLeonel Morgado
We will metaverse into the essence of immersive learning, into its three dimensions and conceptual models. This approach encompasses elements from teaching methodologies to social involvement, through organizational concerns and technologies. Challenging the perception of learning as knowledge transfer, we introduce a 'Uses, Practices & Strategies' model operationalized by the 'Immersive Learning Brain' and ‘Immersion Cube’ frameworks. This approach offers a comprehensive guide through the intricacies of immersive educational experiences and spotlighting research frontiers, along the immersion dimensions of system, narrative, and agency. Our discourse extends to stakeholders beyond the academic sphere, addressing the interests of technologists, instructional designers, and policymakers. We span various contexts, from formal education to organizational transformation to the new horizon of an AI-pervasive society. This keynote aims to unite the iLRN community in a collaborative journey towards a future where immersive learning research and practice coalesce, paving the way for innovative educational research and practice landscapes.
EWOCS-I: The catalog of X-ray sources in Westerlund 1 from the Extended Weste...Sérgio Sacani
Context. With a mass exceeding several 104 M⊙ and a rich and dense population of massive stars, supermassive young star clusters
represent the most massive star-forming environment that is dominated by the feedback from massive stars and gravitational interactions
among stars.
Aims. In this paper we present the Extended Westerlund 1 and 2 Open Clusters Survey (EWOCS) project, which aims to investigate
the influence of the starburst environment on the formation of stars and planets, and on the evolution of both low and high mass stars.
The primary targets of this project are Westerlund 1 and 2, the closest supermassive star clusters to the Sun.
Methods. The project is based primarily on recent observations conducted with the Chandra and JWST observatories. Specifically,
the Chandra survey of Westerlund 1 consists of 36 new ACIS-I observations, nearly co-pointed, for a total exposure time of 1 Msec.
Additionally, we included 8 archival Chandra/ACIS-S observations. This paper presents the resulting catalog of X-ray sources within
and around Westerlund 1. Sources were detected by combining various existing methods, and photon extraction and source validation
were carried out using the ACIS-Extract software.
Results. The EWOCS X-ray catalog comprises 5963 validated sources out of the 9420 initially provided to ACIS-Extract, reaching a
photon flux threshold of approximately 2 × 10⁻⁸ photons cm−2
s
−1
. The X-ray sources exhibit a highly concentrated spatial distribution,
with 1075 sources located within the central 1 arcmin. We have successfully detected X-ray emissions from 126 out of the 166 known
massive stars of the cluster, and we have collected over 71 000 photons from the magnetar CXO J164710.20-455217.
Remote Sensing and Computational, Evolutionary, Supercomputing, and Intellige...University of Maribor
Slides from talk:
Aleš Zamuda: Remote Sensing and Computational, Evolutionary, Supercomputing, and Intelligent Systems.
11th International Conference on Electrical, Electronics and Computer Engineering (IcETRAN), Niš, 3-6 June 2024
Inter-Society Networking Panel GRSS/MTT-S/CIS Panel Session: Promoting Connection and Cooperation
https://www.etran.rs/2024/en/home-english/
Authoring a personal GPT for your research and practice: How we created the Q...Leonel Morgado
Thematic analysis in qualitative research is a time-consuming and systematic task, typically done using teams. Team members must ground their activities on common understandings of the major concepts underlying the thematic analysis, and define criteria for its development. However, conceptual misunderstandings, equivocations, and lack of adherence to criteria are challenges to the quality and speed of this process. Given the distributed and uncertain nature of this process, we wondered if the tasks in thematic analysis could be supported by readily available artificial intelligence chatbots. Our early efforts point to potential benefits: not just saving time in the coding process but better adherence to criteria and grounding, by increasing triangulation between humans and artificial intelligence. This tutorial will provide a description and demonstration of the process we followed, as two academic researchers, to develop a custom ChatGPT to assist with qualitative coding in the thematic data analysis process of immersive learning accounts in a survey of the academic literature: QUAL-E Immersive Learning Thematic Analysis Helper. In the hands-on time, participants will try out QUAL-E and develop their ideas for their own qualitative coding ChatGPT. Participants that have the paid ChatGPT Plus subscription can create a draft of their assistants. The organizers will provide course materials and slide deck that participants will be able to utilize to continue development of their custom GPT. The paid subscription to ChatGPT Plus is not required to participate in this workshop, just for trying out personal GPTs during it.
Current Ms word generated power point presentation covers major details about the micronuclei test. It's significance and assays to conduct it. It is used to detect the micronuclei formation inside the cells of nearly every multicellular organism. It's formation takes place during chromosomal sepration at metaphase.
ESR spectroscopy in liquid food and beverages.pptxPRIYANKA PATEL
With increasing population, people need to rely on packaged food stuffs. Packaging of food materials requires the preservation of food. There are various methods for the treatment of food to preserve them and irradiation treatment of food is one of them. It is the most common and the most harmless method for the food preservation as it does not alter the necessary micronutrients of food materials. Although irradiated food doesn’t cause any harm to the human health but still the quality assessment of food is required to provide consumers with necessary information about the food. ESR spectroscopy is the most sophisticated way to investigate the quality of the food and the free radicals induced during the processing of the food. ESR spin trapping technique is useful for the detection of highly unstable radicals in the food. The antioxidant capability of liquid food and beverages in mainly performed by spin trapping technique.
ESPP presentation to EU Waste Water Network, 4th June 2024 “EU policies driving nutrient removal and recycling
and the revised UWWTD (Urban Waste Water Treatment Directive)”
When I was asked to give a companion lecture in support of ‘The Philosophy of Science’ (https://shorturl.at/4pUXz) I decided not to walk through the detail of the many methodologies in order of use. Instead, I chose to employ a long standing, and ongoing, scientific development as an exemplar. And so, I chose the ever evolving story of Thermodynamics as a scientific investigation at its best.
Conducted over a period of >200 years, Thermodynamics R&D, and application, benefitted from the highest levels of professionalism, collaboration, and technical thoroughness. New layers of application, methodology, and practice were made possible by the progressive advance of technology. In turn, this has seen measurement and modelling accuracy continually improved at a micro and macro level.
Perhaps most importantly, Thermodynamics rapidly became a primary tool in the advance of applied science/engineering/technology, spanning micro-tech, to aerospace and cosmology. I can think of no better a story to illustrate the breadth of scientific methodologies and applications at their best.
Describing and Interpreting an Immersive Learning Case with the Immersion Cub...Leonel Morgado
Current descriptions of immersive learning cases are often difficult or impossible to compare. This is due to a myriad of different options on what details to include, which aspects are relevant, and on the descriptive approaches employed. Also, these aspects often combine very specific details with more general guidelines or indicate intents and rationales without clarifying their implementation. In this paper we provide a method to describe immersive learning cases that is structured to enable comparisons, yet flexible enough to allow researchers and practitioners to decide which aspects to include. This method leverages a taxonomy that classifies educational aspects at three levels (uses, practices, and strategies) and then utilizes two frameworks, the Immersive Learning Brain and the Immersion Cube, to enable a structured description and interpretation of immersive learning cases. The method is then demonstrated on a published immersive learning case on training for wind turbine maintenance using virtual reality. Applying the method results in a structured artifact, the Immersive Learning Case Sheet, that tags the case with its proximal uses, practices, and strategies, and refines the free text case description to ensure that matching details are included. This contribution is thus a case description method in support of future comparative research of immersive learning cases. We then discuss how the resulting description and interpretation can be leveraged to change immersion learning cases, by enriching them (considering low-effort changes or additions) or innovating (exploring more challenging avenues of transformation). The method holds significant promise to support better-grounded research in immersive learning.
Describing and Interpreting an Immersive Learning Case with the Immersion Cub...
SoftGIS for colloborative Impact Assessment
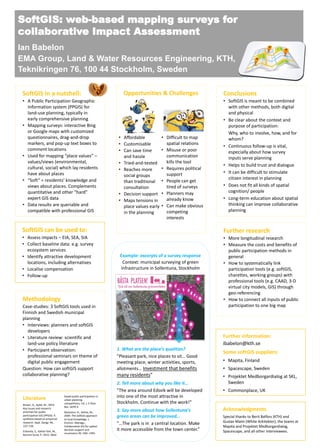
1. Literature
Brown, G., Kyttä, M., 2014.
Key issues and research
priorities for public
participation GIS (PPGIS): A
synthesis based on empirical
research. Appl. Geogr. 46,
122–136.
Eräranta, S., Kahila-Tani, M.,
Nummi-Sund, P., 2015. Web-
based public participation in
urban planning
competitions. Int. J. E-Plan.
Res. IJEPR 4.
Rantanen, H., Kahila, M.,
2009. The SoftGIS approach
to local knowledge. J.
Environ. Manage.,
Collaborative GIS for spatial
decision support and
visualization 90, 1981–1990.
Acknowledgments
Special thanks to Berit Balfors (KTH) and
Gustav Malm (White Arkitekter); the teams at
Mapita and Projektet Medborgardialog,
Spacescape, and all other interviewees.
Further information:
ibabelon@kth.se
Some softGIS suppliers:
• Mapita, Finland
• Spacescape, Sweden
• Projektet Medborgardialog at SKL,
Sweden
• Commonplace, UK
Methodology
Case-studies: 3 SoftGIS tools used in
Finnish and Swedish municipal
planning
• Interviews: planners and softGIS
developers
• Literature review: scientific and
land-use policy literature
• Participant observation:
professional seminars on theme of
digital public engagement
Question: How can softGIS support
collaborative planning?
Conclusions
• SoftGIS is meant to be combined
with other methods, both digital
and physical
• Be clear about the context and
purpose of participation:
Why, who to involve, how, and for
whom?
• Continuous follow-up is vital,
especially about how survey
inputs serve planning
• Helps to build trust and dialogue
• It can be difficult to stimulate
citizen interest in planning
• Does not fit all kinds of spatial
cognition/ people
• Long-term education about spatial
thinking can improve collaborative
planning
SoftGIS in a nutshell:
• A Public Participation Geographic
Information system (PPGIS) for
land-use planning, typically in
early comprehensive planning
• Mapping surveys: interactive Bing
or Google maps with customized
questionnaires, drag-and-drop
markers, and pop-up text boxes to
comment locations
• Used for mapping “place values” –
values/views (environmental,
cultural, social) which lay residents
have about places
• “Soft” = residents’ knowledge and
views about places. Complements
quantitative and other “hard”
expert GIS data
• Data results are queriable and
compatible with professional GIS
Opportunities & Challenges
SoftGIS: web-based mapping surveys for
collaborative Impact Assessment
Ian Babelon
EMA Group, Land & Water Resources Engineering, KTH,
Teknikringen 76, 100 44 Stockholm, Sweden
SoftGIS can be used to:
• Assess impacts – EIA, SEA, SIA
• Collect baseline data: e.g. survey
ecosystem services
• Identify attractive development
locations, including alternatives
• Localise compensation
• Follow-up
Example: excerpts of a survey response
Context: municipal surveying of green
infrastructure in Sollentuna, Stockholm
1. What are the place’s qualities?
”Pleasant park, nice places to sit… Good
meeting place, winter activities, sports,
allotments… Investment that benefits
many residents”
2. Tell more about why you like it…
”The area around Edsvik will be developed
into one of the most attractive in
Stockholm. Continue with the work!”
3. Say more about how Sollentuna’s
green areas can be improved…
”…The park is in a central location. Make
it more accessible from the town center.”
• Affordable
• Customisable
• Can save time
and hassle
• Tried-and-tested
• Reaches more
social groups
than traditional
consultation
• Decision support
• Maps tensions in
place values early
in the planning
• Difficult to map
spatial relations
• Misuse or poor
communication
kills the tool
• Requires political
support
• People can get
tired of surveys
• Planners may
already know
• Can make obvious
competing
interests
Further research
• More longitudinal research
• Measure the costs and benefits of
public participation methods in
general
• How to systematically link
participation tools (e.g. softGIS,
charettes, working groups) with
professional tools (e.g. CAAD, 3-D
virtual city models, GIS) through
geo-referencing
• How to connect all inputs of public
participation to one big map