Downloaded 53 times

![income gaps can also be inefficient, because
they can bar talented poor people from access
to education or feed resentment that results in
growth-destroying populist policies.
The mainstream consensus has long been
that a growing economy raises all boats, to
much better effect than incentive-dulling
redistribution. Robert Lucas, a Nobel prize-
winner, epitomised the orthodoxy when
he wrote in 2003 that “of the tendencies
that are harmful to sound economics, the
most seductive and…poisonous is to focus
on questions of distribution.”
But now the economics establishment has
become concerned about who gets what.
Research by economists at the IMF suggests
that income inequality slows growth, causes
financialcrisesandweakensdemand.Inarecent
report the Asian Development Bank argued
that if emerging Asia’s income distribution
had not worsened over the past 20 years, the
region’s rapid growth would have lifted an
extra 240m people out of extreme poverty.
More controversial studies purport to link
widening income gaps with all manner of
ills, from obesity to suicide.
The widening gaps within many countries
are beginning to worry even the plutocrats.
A survey for the World Economic Forum
meeting at Davos pointed to inequality as the
most pressing problem of the coming decade
(alongside fiscal imbalances). In all sections of
society, there is growing agreement that the
world is becoming more unequal, and that
today’s disparities and their likely trajectory
are dangerous.
Not so fast
That is too simplistic. Inequality, as measured
by Gini coefficients, is simply a snapshot of
outcomes. It does not tell you why those gaps
have opened up or what the trend is over
time. And like any snapshot, the picture can
be misleading. Income gaps can arise for good
reasons (such as when people are rewarded
for productive work) or for bad ones (if poorer
children do not get the same opportunities as
richer ones). Equally, inequality of outcomes
might be acceptable if the gaps are between
young people and older folk, so may shrink
over time. But in societies without this sort
of mobility a high Gini is troubling.
Some societies are more concerned about
equality of opportunity, others more about
equality of outcome. Europeans tend to be
more egalitarian, believing that in a fair society
there should be no bigincome gaps.Americans
and Chinese put more emphasis on equality
of opportunity. Provided people can move up
the social ladder, they believe a society with
wide income gaps can still be fair. Whatever
people’s preferences, static measures ofincome
gaps tell only half the story.
Despitethelackofnuance,today’sdebateover
inequality will have important consequences.
The unstable history ofLatin America, longthe
continentwiththebiggestincome gaps,suggests
that countries run by entrenched wealthy elites
do notdoverywell.Yetthe 20th century’sfocus
on redistribution brought its own problems.
Too often high-tax welfare states turned out to
be inefficient and unsustainable. Government
cures for inequality have sometimes been
worse than the disease itself.
This special report will explore how 21st-
centurycapitalismshouldrespondtothepresent
challenge; it will examine the recent history
of both inequality and social mobility; and it
will offer four contemporary case studies: the
United States, emerging Asia, Latin America
and Sweden. Based on this evidence it will
make three arguments. First, although the
modern global economy is leading to wider
gaps between the more and the less educated,
a big driver of today’s income distributions
is government policy. Second, a lot of today’s
inequality is inefficient, particularly in the
most unequal countries. It reflects market and
government failures that also reduce growth.
And where this is happening, bigger income
gaps themselves are likely to reduce both social
mobility and future prosperity.
Third, there is a reform agenda to reduce
income disparities that makes sense whatever
your attitude towards fairness. It is not about
higher taxes and more handouts. Both in rich
and emerging economies, it is about attacking
cronyism and investingin the young.You could
call it a “True Progressivism”. n
Poverty
Not always with us
Reprinted from The Economist, Jun 1st 2013
The world has an astonishing chance to
take a billion people out ofextreme poverty
by 2030
IN SEPTEMBER 2000 the heads of 147
governments pledged that they would halve
the proportion ofpeople on the Earth living in
the direst poverty by 2015, using the poverty
rate in 1990 as a baseline. It was the first of
a litany of worthy aims enshrined in the
United Nations “millennium development
goals” (MDGs). Many of these aims—such as
cutting maternal mortality by three quarters
and child mortality by two thirds—have not
been met. But the goal of halving poverty has
been. Indeed, it was achieved five years early.
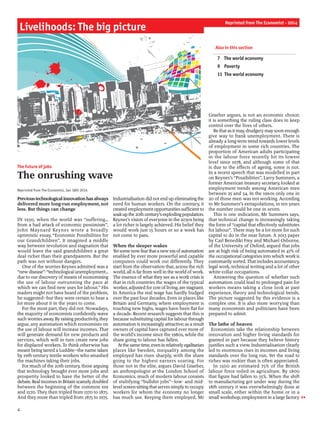
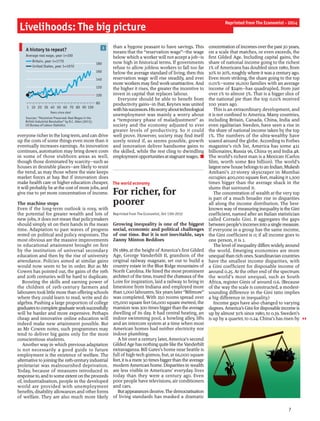
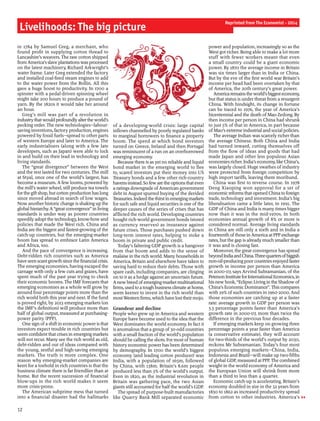
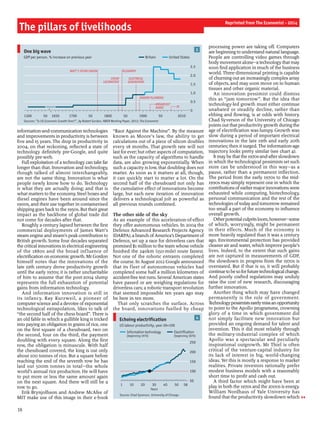
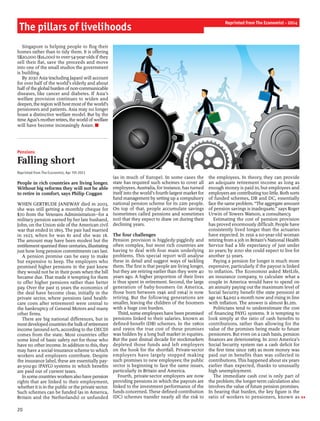
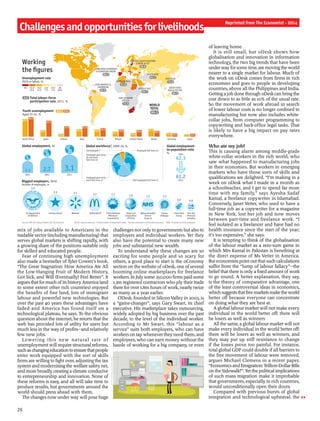
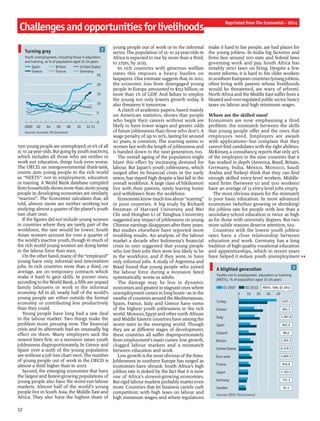
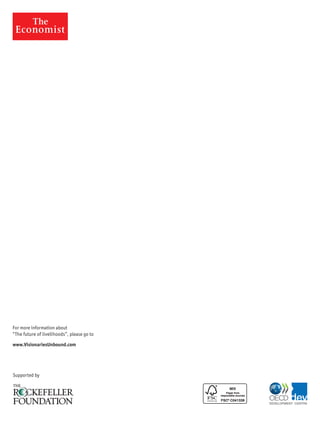
In 1990, 43% ofthe population ofdeveloping
countries lived in extreme poverty (then
defined as subsisting on $1 a day); the absolute
number was 1.9 billion people. By 2000 the
proportion was down to a third. By 2010 it was
21% (or 1.2 billion; the poverty line was then
$1.25, the average of the 15 poorest countries’
own poverty lines in 2005 prices, adjusted for
differences in purchasing power). The global
poverty rate had been cut in half in 20 years.
That raised an obvious question. If extreme
povertycouldbehalvedinthepasttwodecades,
why should the other half not be got rid of
in the next two? If 21% was possible in 2010,
why not 1% in 2030?
Whynotindeed?InAprilatapressconference
during the spring meeting ofthe international
financial institutions in Washington, DC, the
president of the World Bank, Jim Yong Kim,
scrawled the figure “2030” on a sheet of
paper, held it up and announced, “This is it.
This is the global target to end poverty.” He
was echoing Barack Obama who, in February,
promised that “the United States will join with
our allies to eradicate such extreme poverty
in the next two decades.”
This week, that target takes its first step
towards formal endorsement as an aim of
policy round the world. The leaders of Britain,
Indonesia and Liberia are due to recommend
to the UN a list of post-2015 MDGs. It will be
headed by a promise to end extreme poverty
by 2030.
There is a lot of debate about what exactly
counts as poverty and how best to measure
it. But by any measure, the eradication of
$1.25-a-day poverty would be an astonishing
achievement. Throughout history, dire poverty
has been a basic condition of the mass of
mankind.ThomasMalthus, a British clergyman
who foundedthescience ofdemography,wrote
in 1798 that it was impossible for people to
“feel no anxiety about providing the means of
subsistence forthemselves and [their] families”
and that “no possible form of society could
prevent the almost constant action of misery
upon a great part of mankind.” For most
countries, poverty was not even a problem;
it was a plain, unchangeable fact.
To eradicate extreme poverty would also
be remarkable given the number of occasions
Livelihoods: The big picture
9
Reprinted from The Economist - 2014
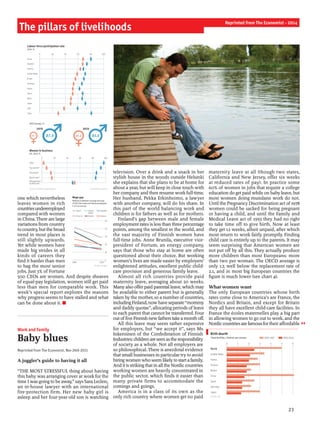
1Hooray!
Source: Laurence Chandy, Natasha Ledlie and
Veronika Penciakova
Global poverty rate, %
0
10
20
30
40
50
1990 95 2000 05 10 15 20 25 30
Range based on best
and worst scenarios
Baseline scenario](https://image.slidesharecdn.com/securinglivelihoodslimitededitionmagazinefinalaugust2014-2-140805080302-phpapp02/85/The-Economist-Securing-Livelihoods-Special-Edition-9-320.jpg)

![Challengesandopportunitiesforlivelihoods
Reprinted from The Economist - 2014
who works hasa reasonable income, through a
bold expansion ofthe tax credits that countries
such as America and Britain use.
Innovation has brought great benefits to
humanity. Nobody in their right mind would
want to return to the world of handloom
weavers. But the benefits of technological
progress are unevenly distributed, especially
in the early stages of each new wave, and it
is up to governments to spread them. In the
19th century it took the threat of revolution
to bring about progressive reforms. Today’s
governments would do well to start making
the changes needed before their people get
angry. n
Working conditions in factories
When the jobs
inspector calls
Reprinted from The Economist, Mar 31st 2012
Do campaigns for “ethical supply chains”
help workers?
“DEATH to Apple executives,” a protester
shouted after a recent performance of “The
Agony and Ecstasy of Steve Jobs”, a popular
off-Broadway play. Apple executives must
have been delighted when Mike Daisey, the
playwright and star, recently retracted his
nastiest allegations about the mistreatment of
workers making Apple’s products in China.
Apparently, he did not meet a worker poisoned
by exposure to chemicals, or child workers at
the factory gate. With its share price soaring as
the latest iPad storms the market, Apple might
be tempted to forget about the fuss over its
labour practices. But that would be a mistake.
Any big company that makes things in
poor countries faces scrutiny of its supply
chain. Campaigners against harsh working
conditions (and unions back home that hate
competition from low-wage countries) will
pounce on any hint of scandal. Horrified
headlines can tarnish a brand. Companies
need to pay heed.
Wages for factory workers in China have
been soaring at double-digit rates for years,
for reasons that have little if anything to do
with Western activists and a lot to do with
productivity improvements. But some workers
are abused, as even Apple admits. In February
it invited the Fair Labour Association (FLA),
a prominent non-governmental organisation
(NGO), to lookat the factories it uses in China,
including those of Foxconn, which assembles
iPhones and iPads for Apple and is owned by
Hon Hai,aTaiwanese.The FLAreport, expected
soon, is unlikely to give Apple a clean bill of
health. Auret van Heerden, the organisation’s
boss, gripes that although conditions in the
factories are better than he expected, there
are “tons of issues”.
Inthe past20yearswhathasbecome known
as the “ethical supply chain” movement has
targeted brands such as Nike, Gap and Coca-
Cola. But its army ofactivists, some in business
themselves,aregrapplingwithgrowingevidence
that appointing an outside body to audit and
set standards, as Apple has done, is not going
as well as it should. Apple could turn into a
test case of how to improve things.
Not a bad Apple
Tim Cook, Apple’s boss, this week visited a
new Foxconn factory in central China which
employs 120,000 people. He has insisted
that Apple is doing a lot to improve working
conditions. But he also echoes the concerns of
critics. “We think the use of underage labour
is abhorrent. It’s extremely rare in our supply
chain, but our top priority is to eliminate it
totally,” he declared.
After a bad press in the early 1990s, Nike is
now one ofthe loudestadvocates ofimproving
working conditions. In 1992 it established a
code of conduct for suppliers. (Apple did not
get around to that until 2005.) In 1996 Nike
helped create theApparel Industry Partnership,
which drew up a code ofconduct for factories,
and in 1999 evolved into the FLA.
Having a code of conduct and being part of
an industry initiative on workers’ rights has
become standard practice for multinationals.
But there are big differences in the toughness of
codes, how rigorously compliance is monitored
and how remedial action is taken.
Factory audits also vary. Nike first published
the overall results of its monitoring in 2000,
but did not list details of all the factories in its
supply chain until 2006. (Apple did not publish
details of its supply chain until this year.)
When Nike opened up it was a conscious
effort to challenge industry norms. Clothing
and shoe firms tookit for granted that revealing
which factories they used would put them at
a competitive disadvantage. But Nike reckoned
the downside was negligible and the lack
of transparency hindered the monitoring
process, says Hannah Jones, the firm’s head
of corporate social responsibility. Secrecy led
to some factories that worked for a variety of
companies undergoing multiple audits. Other
factories escaped entirely.
Another challenge is preventing corruption,
says Alan Hassenfeld, a former boss ofHasbro
who is now the driving force behind the
International Council ofToy Industries’ code,
called ICTI Care. Factory managers sometimes
bribe auditors. Some firms use fake books
showing shorter hours and higher pay. Some
workers collaborate in these violations more
willingly than is assumed. Many migrants, for
example, want to work long hours to save as
much money as possible in a short time—and
then go home.
NGOs can be both a help and a hindrance,
reckons Mr Hassenfeld. Some only campaign.
Others workwith firms to help put things right.
Some do both. Campaigning NGOs can put
pressure on a firm to do better, but they rarely
support it when expelling a factory from its
supply chain, which also hurts workers, says
Mr Hassenfeld. “One of the things we need
to do is be tougher with repeat offenders, to
make an example of them,” he adds.
“Governments are not pulling their
weight,” complains Aron Cramer of BSR, an
NGO. He thinks there has been “too much
outsourcing of enforcement to the private
sector”. Individual firms may find enforcement
difficult. Governments may do better, but few
governments of emerging markets like to be
bossed around.
“Nobody thinks this process is perfect, but
we have made progress,” says Mr Hassenfeld.
Mr Cramer agrees. At least for firms at the top
ofthe supply chain, “the old problems offorced
labour and child labour are largely gone,” he
says. The worstabusestend to be further down
the supply chain, and in particular sectors,
such as agriculture and mining. Nonetheless,
there remains much to do even among first-tier
suppliers on things like excessive hours and
inadequate pay, says Mr Cramer.
Richard Locke ofthe Massachusetts Institute
ofTechnology has taken a detailed lookat how
things really work. He persuaded four global
firms regarded as leaders in ethical supply
chains (Nike, Coca-Cola, HP and PVH, a big
American producer of clothing) to let him
analyse six years of data from their factory
audits, starting in 2005. His research, to be
published this year in a book, “Promoting
Labour Rights in a Global Economy”, drew
four conclusions.
First, codes of conduct, compliance
programmes and audits “[do] not deliver
sustained improvements in labour conditions
over time,” he says. Rather, these things help
gather information that highlights the problem
without remedying it. At HP, for example, only
seven of the 276 factories in its supply chain
fully complied with its code of conduct at the
last audit. At the factories he visited, Mr Locke
typically found that many suppliers serving
global brands drift in and out of compliance.
Down the chain
Second, investing time and money in helping
28](https://image.slidesharecdn.com/securinglivelihoodslimitededitionmagazinefinalaugust2014-2-140805080302-phpapp02/85/The-Economist-Securing-Livelihoods-Special-Edition-28-320.jpg)

This document discusses the complex factors affecting future livelihoods, including technology, jobs, pensions, migration, and climate change. It emphasizes the need for collaboration among various stakeholders to create sustainable livelihoods amid challenges such as inequality, unemployment, and environmental changes. The document also highlights the implications of technological advancement on job creation and the necessity for educational reform to adapt to evolving labor market demands.


