Downloaded 522 times

![c. Based on your answer in point b, do you think Mia should buy an
insurance to protect her from the uncertainty? How much money worth to
pay?
JAWABAN
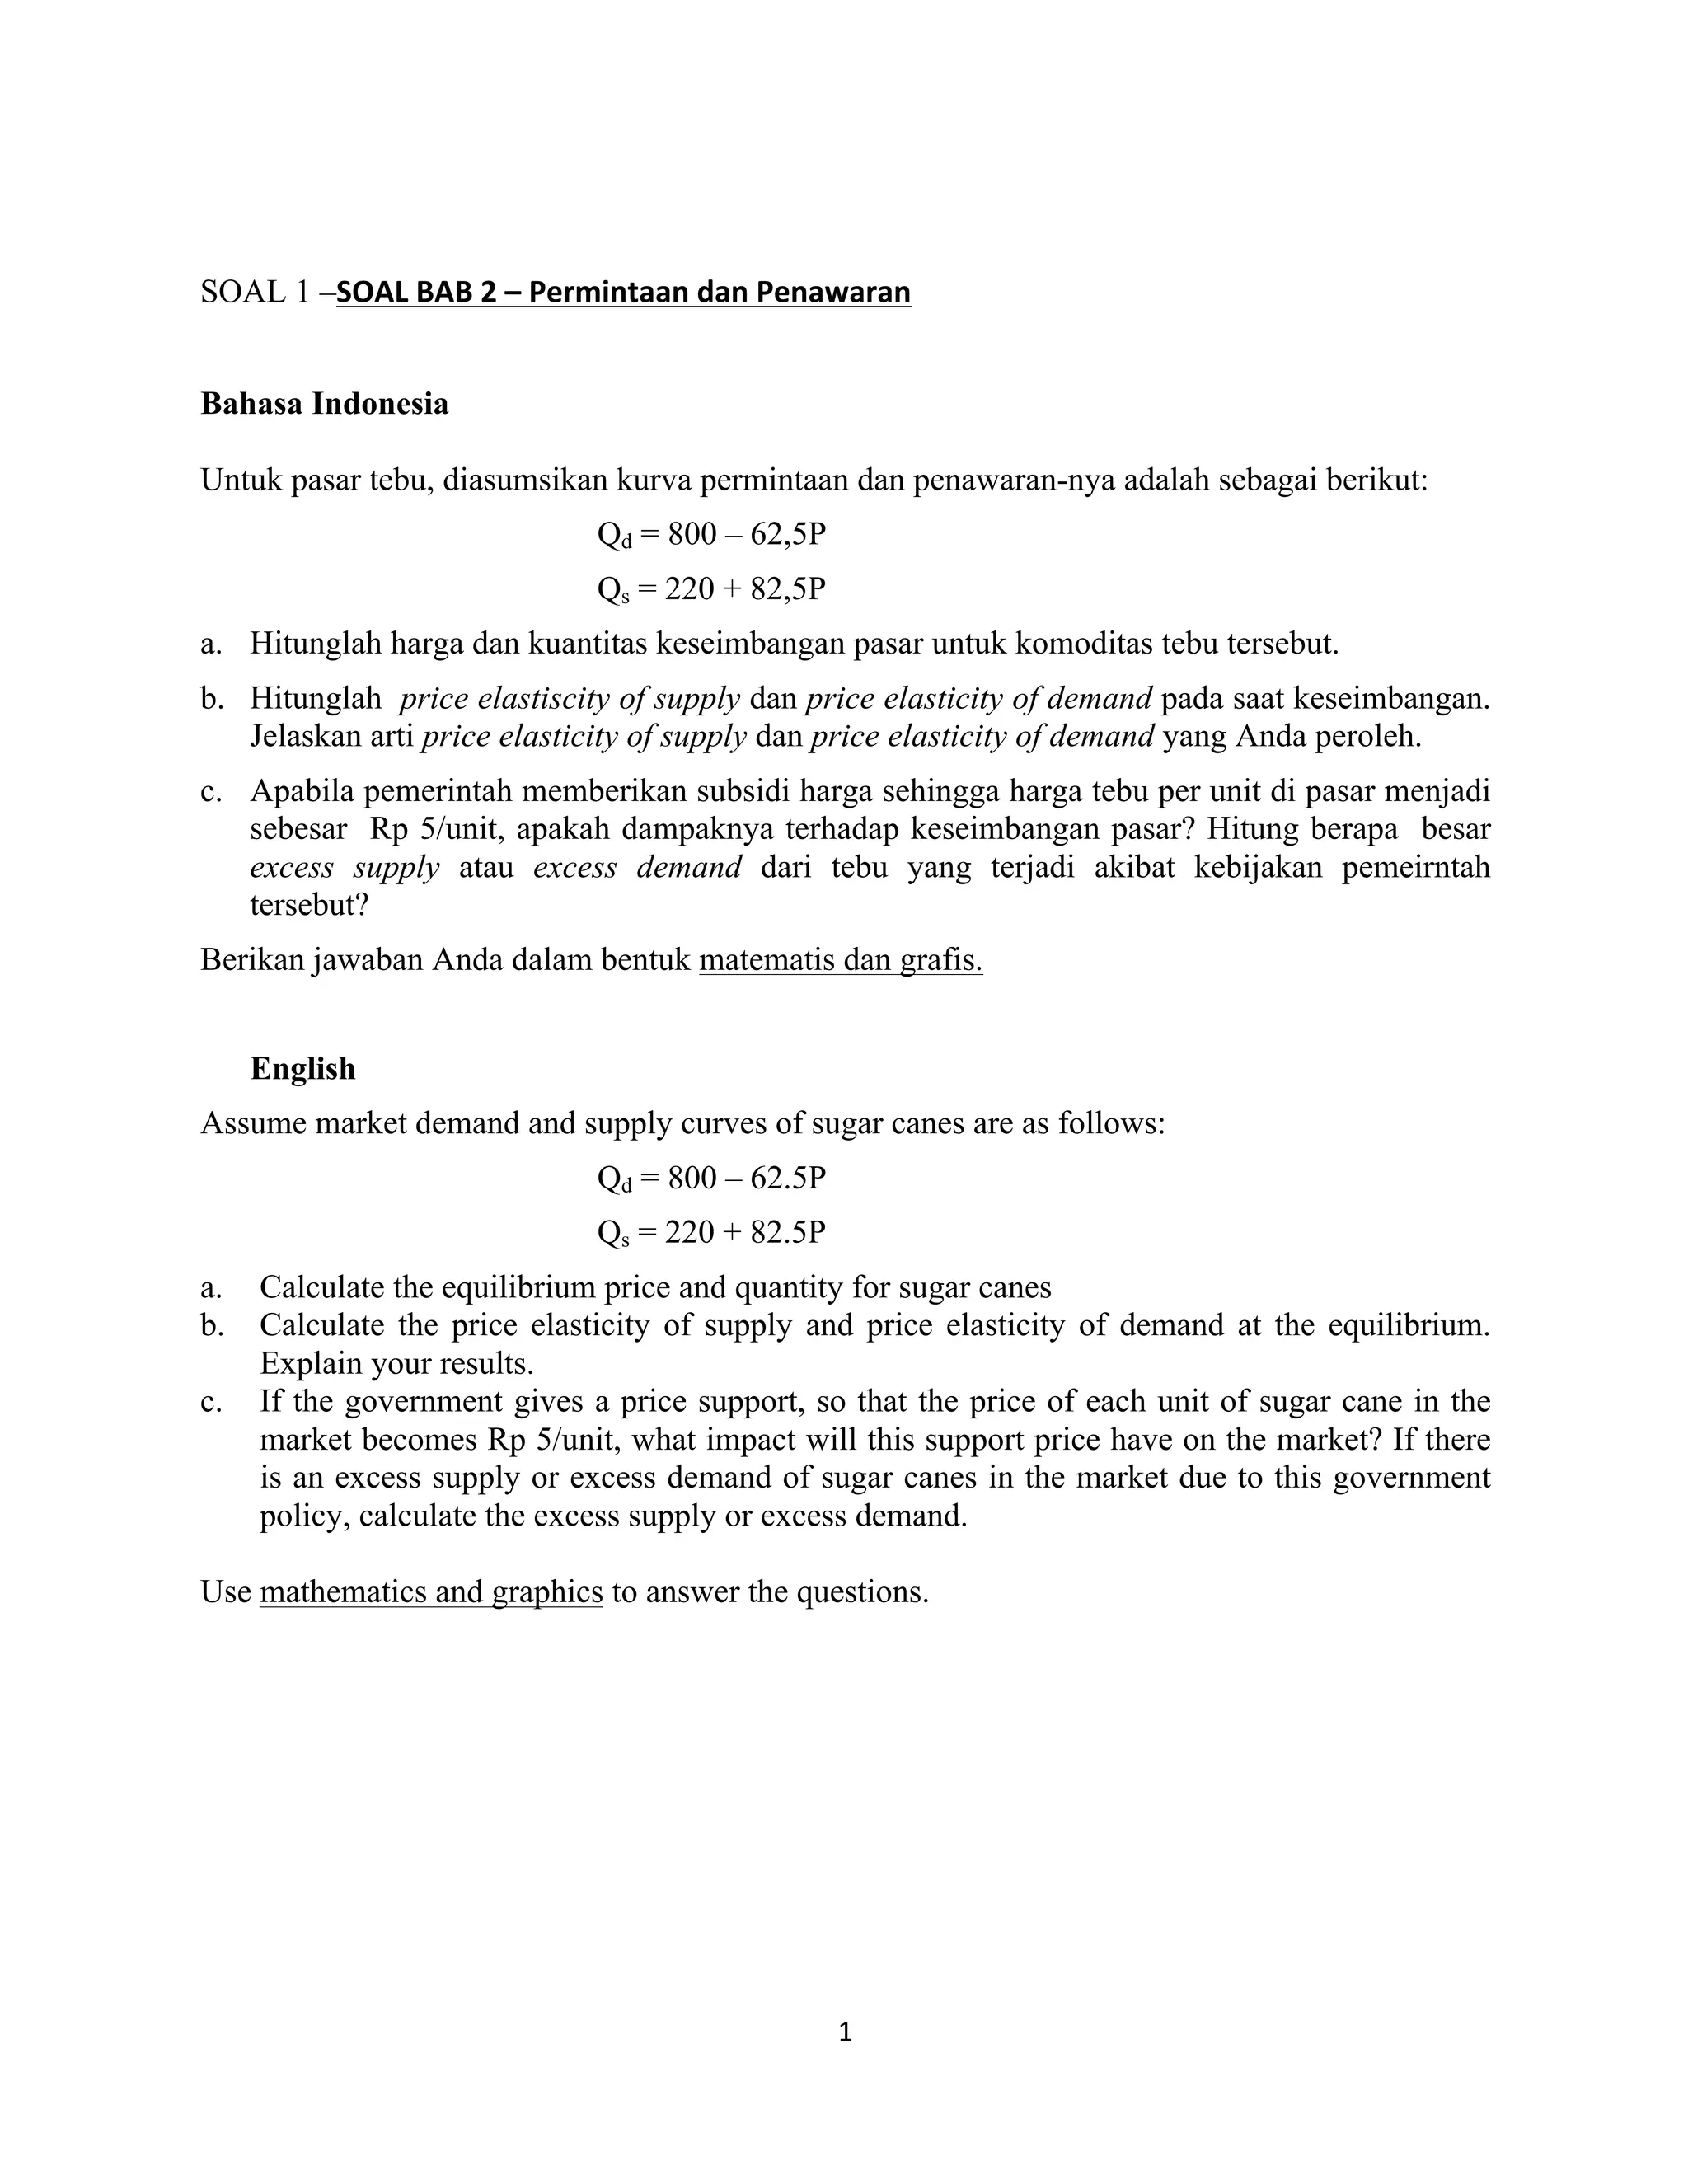
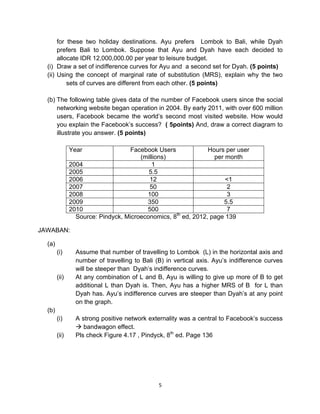
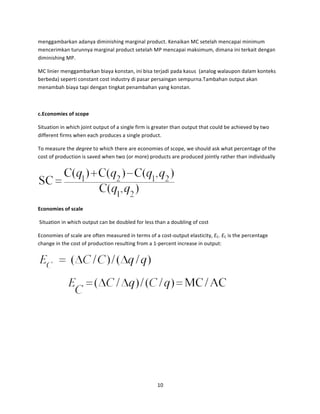
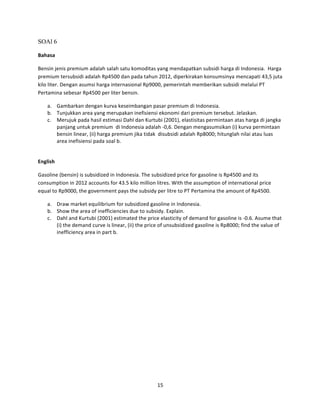
a. Mia merupakan seorang yang Risk Averse, tergambar dari kurva di bawah ini
Fungsi utilitas merupakan
bentuk kuadratik dari income,
sehingga kurva akan bebentuk
cembung dan melambangkan
bahwa Mia merupakan
seorang yang Risk Averse
b. Iya, karena Expected
Utility [E(u)] dari Pekerjaan baru lebih besar dari Expected Utility dati pekerjaan
lama
E(u) old job = I2 = 102 = 100
E(u) new job = Prob . u(4) + Prob u(20)
= 0.5 . (42) + 0.5 (202)
= 8 + 200
= 208
c.
Karena Mia merupakan seorang Risk Averse, maka Mia akan
bersedia membeli asuransi sebesar kerugian yang di ekspektasi. Besarnya
kerugian tersebut adalah selisih gaji per bulan terendah yang di dapat dengan
gaji yang semula di terima, yaitu
10 juta – 4 juta = 6 juta, kemudian dikalikan dengan probabilitas terjadinya gaji
terendah tersebut
7](https://image.slidesharecdn.com/soaldanjawabanuts25-131122201208-phpapp02/85/Soal-dan-jawaban-UTS-25-10-2012-7-320.jpg)
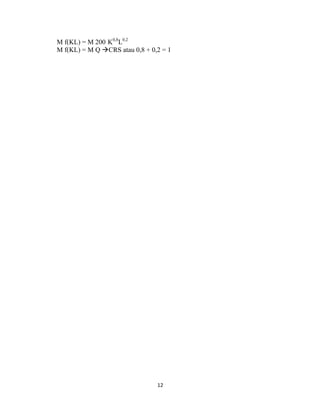
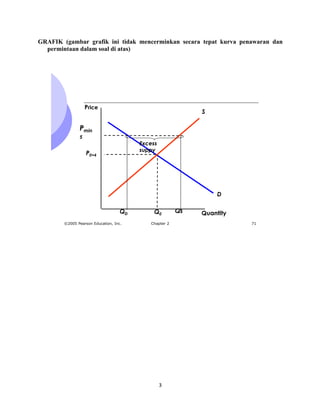
![Solutions
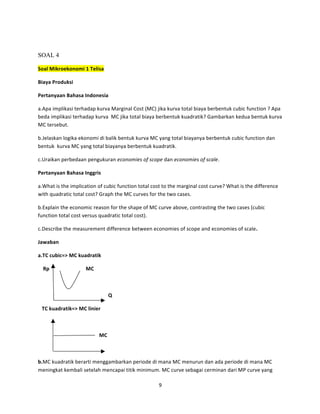
1.
To
maximise
profit,
set
Q
such
that
MR
=
MC.
MR
=
13
at
each
level
of
output
level.
MC
schedule
is
shown
below:
Q
0
1
2
3
4
5
6
7
8
9
10
MC
-‐
11
10
9
8
7
6
7
10
13
19
AVC
-‐
11
10,5
10
9,5
9
8,25
8,3
8,5
9
10
Profit
is
maximized
at
Q
such
that
MR
=
MC.
Since
MR
=
13
everywhere,
MC
will
produce
9
units
Π
=
TR
–
TC
=
(13
x
9)
–
90
=
117
–
90
=
27
Maximum
profit
is
27
2.
Again,
since
the
firm
is
in
a
perfectly
competitive
industry,
MR
=
P
=
6.
Setting
MR
=
MC,
we
find
that
profit
is
maximized
where
MC
=
6,
or
at
an
output
of
6
units.
However,
when
we
calculate
profit,
we
find:
Π
=
TR
–
TC
=
(P
x
Q)
–
TC
=
(6
x
6)
–
60
=
36
–
60
=
-‐24
That
is,
the
firm
suffers
a
loss
of
24.
However4,
if
the
firm
shuts
down
and
produces
nothing,
it
will
incur
a
total
cost
of
9
and
earn
no
revenue,
and
thus
suffer
a
loss
of
9.
Therefore,
the
firm
will
choose
to
produce
nothing
and
lose
9
(rather
than
produce
6
ubits
and
lose
24).
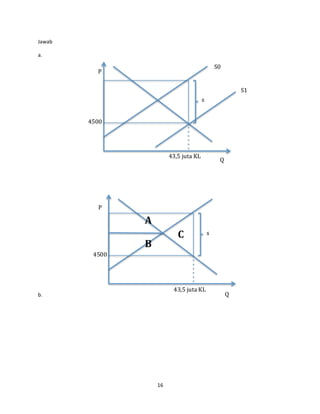
3.
The
darkly
shaded
curve
are
the
firm’s
supply
curve.
For
any
P,
a
competitive
firm
has
MR
=
P,
so
MR
=
MC
is
satisfied
for
P,
Q
combinations
represented
by
the
rising
portion
of
the
MC
curve.
However,
if
P
<
AVC,
the
firm’s
revenues
do
not
cover
variable
costs:
as
a
result,
the
fiem
would
lose
more
than
its
fixed
costs
by
producing
where
P
<
AVC,
or
where
MC
[=P]
<
AVC,
(which
is
the
same
thing).
Thus,
the
supply
curve
is
the
same
as
the
MC
curve
above
the
AVC
curve,
and
Q
=
0
for
any
lower
price.
14](https://image.slidesharecdn.com/soaldanjawabanuts25-131122201208-phpapp02/85/Soal-dan-jawaban-UTS-25-10-2012-14-320.jpg)

Dokumen ini membahas soal-soal mengenai permintaan dan penawaran, elastisitas harga, sampai dengan analisis fungsional ekonomi terkait produksi dan biaya. Materi mencakup perhitungan keseimbangan pasar tebu, penggunaan kurva indiferens, serta konsep utilitas dan pengambilan risiko dalam ekonomi. Selain itu, juga dijelaskan tentang biaya produksi untuk perusahaan dalam pasar kompetitif dan bagaimana menentukan output dan laba maksimum.


