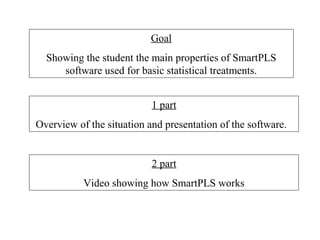
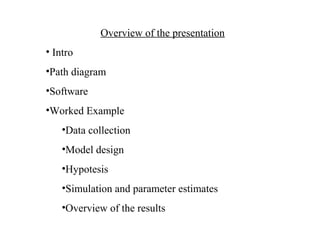
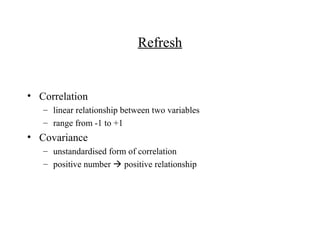
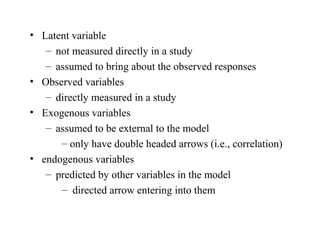
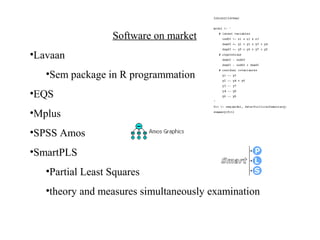
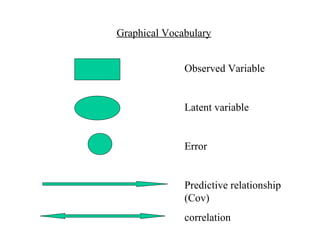
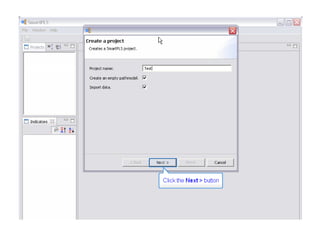
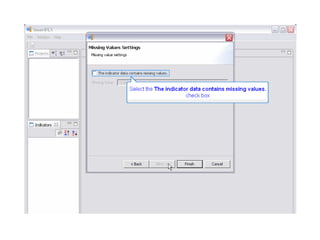
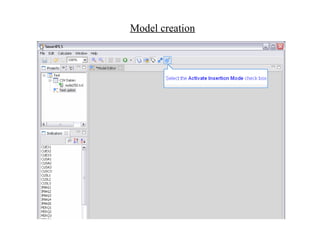
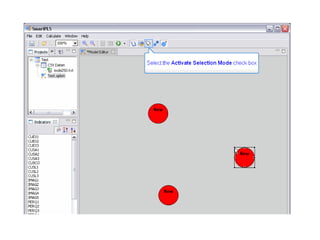
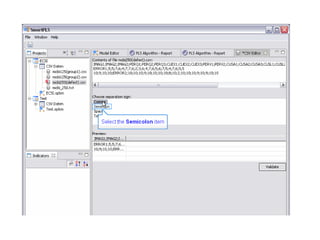
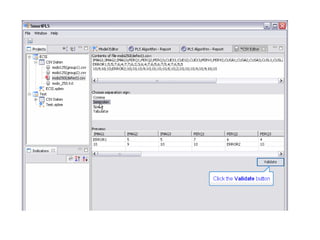
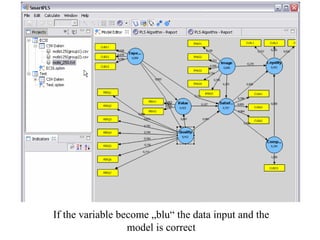
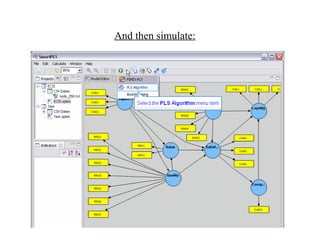
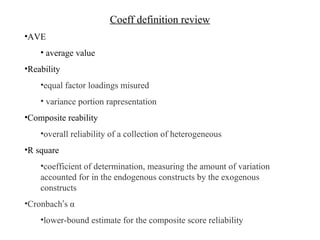
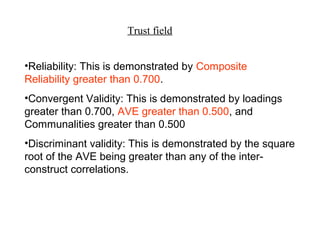
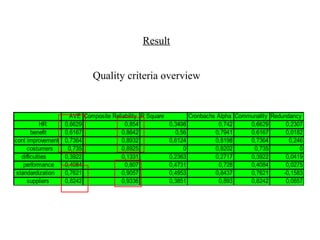
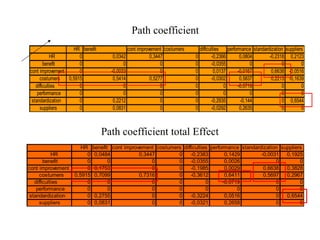
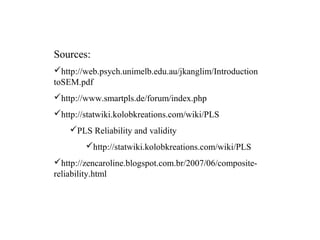
Structural Equation Modelling
              &
   Path Analysis Resources
                    Performed by
                      SmartPLS

          Prof. Livre Docente Otávio J. Oliveira
            Bolsista Produtividade DT/CNPq
             e-mail: otavio@feb.unesp.br 
    Currículo: http://lattes.cnpq.br/8045074316518664
                         FEG/UNESP
Contact student:

Raphaella de M. Cezar
Trainee - Jr. Eng.Eng. de Produção Mecânica
UNESP Guaratinguetá
Cel.: (12) 8172 6064
e-mail: raphaella@globo.com


Francesco Andreoli
ETH Zuerich, Switzerland
e-mail: francesco.andreoli@hotmail.com
      http://www.linkedin.com/in/francescoandreoli
Goal
  Showing the student the main properties of SmartPLS
     software used for basic statistical treatments.


                           1 part
Overview of the situation and presentation of the software.


                           2 part
           Video showing how SmartPLS works
1 part
Overview of the presentation
• Intro
•Path diagram
•Software
•Worked Example
    •Data collection
    •Model design
    •Hypotesis
    •Simulation and parameter estimates
    •Overview of the results
Refresh


• Correlation
   – linear relationship between two variables
   – range from -1 to +1
• Covariance
   – unstandardised form of correlation
   – positive number  positive relationship
• Latent variable
   – not measured directly in a study
   – assumed to bring about the observed responses
• Observed variables
   – directly measured in a study
• Exogenous variables
   – assumed to be external to the model
      – only have double headed arrows (i.e., correlation)
• endogenous variables
   – predicted by other variables in the model
      – directed arrow entering into them
Software on market
•Lavaan
   •Sem package in R programmation
•EQS
•Mplus
•SPSS Amos
•SmartPLS
   •Partial Least Squares
   •theory and measures simultaneously examination
Graphical Vocabulary


              Observed Variable


              Latent variable


              Error


              Predictive relationship
              (Cov)
              correlation
SmartPlS
Quick Tutorial


                 Source: http://www.smartpls.de/
Create new project
Model creation
Import data
If the variable become color blu the data input and
                 the model is correct
And then simulate:
Report
Resume             simulation   Variable
                                   insertion
Model design


 Data input


               Box description
Our Final case examinated in
         SmartPLS
Questionnaire development


 Answer range from 1 to 5
Excel data
Question nr.                   Supp. Infos


 Case studied     Quest. res
Data input in smartPLS


                This Matrix is only a
             preview!! The all data is in
Construct         Model in SmartPLS


                            Benefit


                          Difficulties


            Performance
Coeff definition review
•AVE
    • average value
•Reability
    •equal factor loadings misured
    • variance portion rapresentation
•Composite reability
    •overall reliability of a collection of heterogeneous
•R square
    •coefficient of determination, measuring the amount of variation
    accounted for in the endogenous constructs by the exogenous
    constructs
•Cronbach’s α
    •lower-bound estimate for the composite score reliability
Trust field


•Reliability: This is demonstrated by Composite
Reliability greater than 0.700.
•Convergent Validity: This is demonstrated by loadings
greater than 0.700, AVE greater than 0.500, and
Communalities greater than 0.500
•Discriminant validity: This is demonstrated by the square
root of the AVE being greater than any of the inter-
construct correlations.
Result


                             Quality criteria overview


                     AVE Composite Reliability R Square            Cronbachs Alpha Communality Redundancy
            HR     0,6629               0,854             0,3498             0,742     0,6629       0,2307
        benefit    0,6167              0,8642               0,56            0,7941     0,6167       0,0182
cont improvement   0,7364              0,8932             0,6124            0,8198     0,7364        0,246
      costumers     0,735              0,8925                  0            0,8202      0,735            0
   difficulties    0,3922              0,1331             0,2363            0,2717     0,3922       0,0419
    performance    0,4084               0,807             0,4731             0,728     0,4084       0,0275
 standardization   0,7621              0,9057             0,4953            0,8437     0,7621      -0,1583
      suppliers    0,8242              0,9336             0,3851             0,893     0,8242       0,0657
Path coefficient
                   HR benefit              cont improvement costumers     difficulties    performance standardization suppliers
            HR        0             0,0342            0,3447            0         -0,2366        0,0804       -0,2318 0,2123
        benefit       0                  0                 0            0         -0,0355             0             0         0
cont improvement      0            -0,0033                 0            0          0,0137       -0,0167        0,6638 -0,0516
      costumers  0,5915             0,5414            0,5277            0         -0,0302        0,5837        0,2213 -0,1639
   difficulties       0                  0                 0            0               0       -0,0719             0         0
    performance       0                  0                 0            0               0             0             0         0
 standardization      0             0,2212                 0            0         -0,2935        -0,144             0 0,6544
      suppliers       0             0,0831                 0            0         -0,0292        0,2635             0         0


                                Path coefficient total Effect
                      HR    benefit cont improvement costumers difficulties performance standardization suppliers
            HR          0    0,0484            0,3447        0     -0,2383        0,1429        -0,0031   0,1925
        benefit         0          0                0        0     -0,0355        0,0026              0         0
cont improvement        0    0,1753                 0        0     -0,1985        0,0029         0,6638   0,3828
      costumers    0,5915    0,7099            0,7316        0     -0,3612        0,6411         0,5697   0,2967
   difficulties         0          0                0        0            0      -0,0719              0         0
    performance         0          0                0        0            0            0              0         0
 standardization        0    0,2755                 0        0     -0,3224        0,0516              0   0,6544
      suppliers         0    0,0831                 0        0     -0,0321        0,2658              0         0
Sources:
http://web.psych.unimelb.edu.au/jkanglim/Introduction
toSEM.pdf
http://www.smartpls.de/forum/index.php
http://statwiki.kolobkreations.com/wiki/PLS
    PLS Reliability and validity
        http://statwiki.kolobkreations.com/wiki/PLS
http://zencaroline.blogspot.com.br/2007/06/composite-
reliability.html
2 part
Tutorial video

SmartPLS presentation

  • 1.
    Structural Equation Modelling & Path Analysis Resources Performed by SmartPLS Prof. Livre Docente Otávio J. Oliveira Bolsista Produtividade DT/CNPq e-mail: otavio@feb.unesp.br  Currículo: http://lattes.cnpq.br/8045074316518664 FEG/UNESP
  • 2.
    Contact student: Raphaella deM. Cezar Trainee - Jr. Eng.Eng. de Produção Mecânica UNESP Guaratinguetá Cel.: (12) 8172 6064 e-mail: raphaella@globo.com Francesco Andreoli ETH Zuerich, Switzerland e-mail: francesco.andreoli@hotmail.com http://www.linkedin.com/in/francescoandreoli
  • 3.
    Goal Showingthe student the main properties of SmartPLS software used for basic statistical treatments. 1 part Overview of the situation and presentation of the software. 2 part Video showing how SmartPLS works
  • 4.
  • 5.
    Overview of thepresentation • Intro •Path diagram •Software •Worked Example •Data collection •Model design •Hypotesis •Simulation and parameter estimates •Overview of the results
  • 6.
    Refresh • Correlation – linear relationship between two variables – range from -1 to +1 • Covariance – unstandardised form of correlation – positive number  positive relationship
  • 7.
    • Latent variable – not measured directly in a study – assumed to bring about the observed responses • Observed variables – directly measured in a study • Exogenous variables – assumed to be external to the model – only have double headed arrows (i.e., correlation) • endogenous variables – predicted by other variables in the model – directed arrow entering into them
  • 8.
    Software on market •Lavaan •Sem package in R programmation •EQS •Mplus •SPSS Amos •SmartPLS •Partial Least Squares •theory and measures simultaneously examination
  • 9.
    Graphical Vocabulary Observed Variable Latent variable Error Predictive relationship (Cov) correlation
  • 10.
    SmartPlS Quick Tutorial Source: http://www.smartpls.de/
  • 11.
  • 14.
  • 21.
  • 26.
    If the variablebecome color blu the data input and the model is correct
  • 27.
  • 28.
  • 29.
    Resume simulation Variable insertion Model design Data input Box description
  • 30.
    Our Final caseexaminated in SmartPLS
  • 31.
  • 32.
    Excel data Question nr. Supp. Infos Case studied Quest. res
  • 33.
    Data input insmartPLS This Matrix is only a preview!! The all data is in
  • 35.
    Construct Model in SmartPLS Benefit Difficulties Performance
  • 36.
    Coeff definition review •AVE • average value •Reability •equal factor loadings misured • variance portion rapresentation •Composite reability •overall reliability of a collection of heterogeneous •R square •coefficient of determination, measuring the amount of variation accounted for in the endogenous constructs by the exogenous constructs •Cronbach’s α •lower-bound estimate for the composite score reliability
  • 37.
    Trust field •Reliability: Thisis demonstrated by Composite Reliability greater than 0.700. •Convergent Validity: This is demonstrated by loadings greater than 0.700, AVE greater than 0.500, and Communalities greater than 0.500 •Discriminant validity: This is demonstrated by the square root of the AVE being greater than any of the inter- construct correlations.
  • 38.
    Result Quality criteria overview AVE Composite Reliability R Square Cronbachs Alpha Communality Redundancy HR 0,6629 0,854 0,3498 0,742 0,6629 0,2307 benefit 0,6167 0,8642 0,56 0,7941 0,6167 0,0182 cont improvement 0,7364 0,8932 0,6124 0,8198 0,7364 0,246 costumers 0,735 0,8925 0 0,8202 0,735 0 difficulties 0,3922 0,1331 0,2363 0,2717 0,3922 0,0419 performance 0,4084 0,807 0,4731 0,728 0,4084 0,0275 standardization 0,7621 0,9057 0,4953 0,8437 0,7621 -0,1583 suppliers 0,8242 0,9336 0,3851 0,893 0,8242 0,0657
  • 39.
    Path coefficient HR benefit cont improvement costumers difficulties performance standardization suppliers HR 0 0,0342 0,3447 0 -0,2366 0,0804 -0,2318 0,2123 benefit 0 0 0 0 -0,0355 0 0 0 cont improvement 0 -0,0033 0 0 0,0137 -0,0167 0,6638 -0,0516 costumers 0,5915 0,5414 0,5277 0 -0,0302 0,5837 0,2213 -0,1639 difficulties 0 0 0 0 0 -0,0719 0 0 performance 0 0 0 0 0 0 0 0 standardization 0 0,2212 0 0 -0,2935 -0,144 0 0,6544 suppliers 0 0,0831 0 0 -0,0292 0,2635 0 0 Path coefficient total Effect HR benefit cont improvement costumers difficulties performance standardization suppliers HR 0 0,0484 0,3447 0 -0,2383 0,1429 -0,0031 0,1925 benefit 0 0 0 0 -0,0355 0,0026 0 0 cont improvement 0 0,1753 0 0 -0,1985 0,0029 0,6638 0,3828 costumers 0,5915 0,7099 0,7316 0 -0,3612 0,6411 0,5697 0,2967 difficulties 0 0 0 0 0 -0,0719 0 0 performance 0 0 0 0 0 0 0 0 standardization 0 0,2755 0 0 -0,3224 0,0516 0 0,6544 suppliers 0 0,0831 0 0 -0,0321 0,2658 0 0
  • 40.
    Sources: http://web.psych.unimelb.edu.au/jkanglim/Introduction toSEM.pdf http://www.smartpls.de/forum/index.php http://statwiki.kolobkreations.com/wiki/PLS PLS Reliability and validity http://statwiki.kolobkreations.com/wiki/PLS http://zencaroline.blogspot.com.br/2007/06/composite- reliability.html
  • 41.