The document is a project report submitted by G.Yamini for the partial fulfillment of an MCA degree. It includes a declaration signed by G.Yamini stating that the project titled "SMART TRAFFIC CONTROL SYSTEM USING CANNY EDGE DETECTION ALGORITHM" is her original work and has not been submitted elsewhere. It also includes certificates from the guide and institution confirming that the project is G.Yamini's original work. The project report describes implementing a smart traffic control system using image processing and Canny edge detection algorithm.


![P a g e | 36
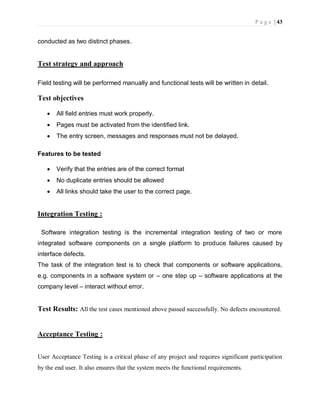
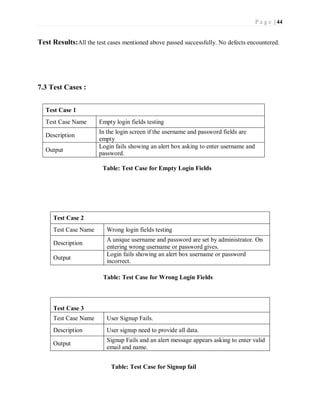
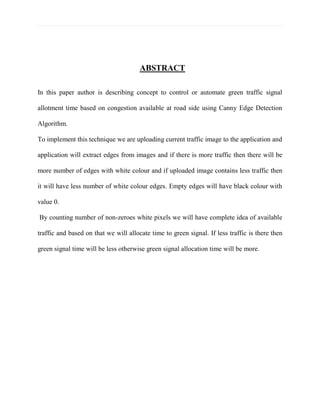
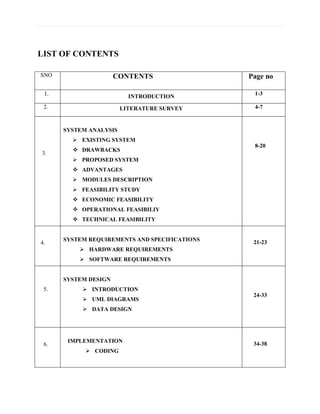
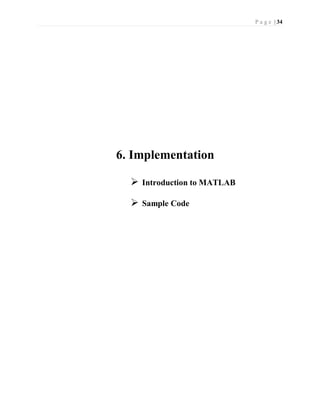
6.2 SampleCode
from tkinter import messagebox
from tkinter import *
from tkinter import simpledialog
import tkinter
from tkinter import filedialog
import numpy as np
from tkinter.filedialog import askopenfilename
import numpy as np
from CannyEdgeDetector import *
import skimage
import matplotlib.image as mpimg
import os
import scipy.misc as sm
import cv2
import matplotlib.pyplot as plt
main = tkinter.Tk()
main.title("Density Based Smart Traffic Control System")
main.geometry("1300x1200")
def uploadTrafficImage():
global filename
filename = filedialog.askopenfilename(initialdir="images")
pathlabel.config(text=filename)
def visualize(imgs, format=None, gray=False):
j = 0
plt.figure(figsize=(20, 40))
for i, img in enumerate(imgs):
if img.shape[0] == 3:
img = img.transpose(1,2,0)
plt_idx = i+1
plt.subplot(2, 2, plt_idx)
if j == 0:
plt.title('Sample Image')
plt.imshow(img, format)
j = j + 1
elif j > 0:
plt.title('Reference Image')
plt.imshow(img, format)
plt.show()
def applyCanny():](https://image.slidesharecdn.com/smarttrafficcontrolsystemusingcannyedgedetectionalgorithm4-220822051313-d06a0e77/85/smart-traffic-control-system-using-canny-edge-detection-algorithm-4-pdf-45-320.jpg)
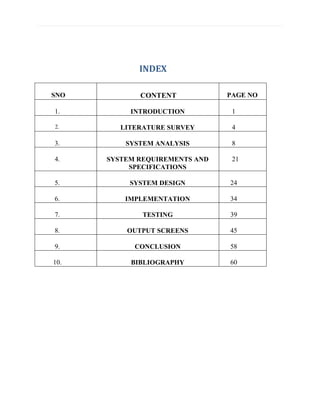
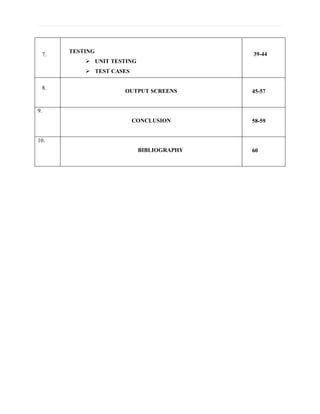
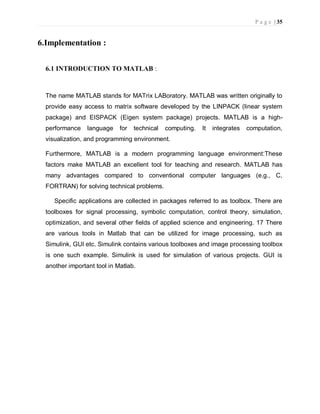
![P a g e | 37
imgs = []
img = mpimg.imread(filename)
img = rgb2gray(img)
imgs.append(img)
edge = CannyEdgeDetector(imgs, sigma=1.4, kernel_size=5, lowthreshold=0.09, highthreshold=0.20,
weak_pixel=100)
imgs = edge.detect()
for i, img in enumerate(imgs):
if img.shape[0] == 3:
img = img.transpose(1,2,0)
cv2.imwrite("gray/test.png",img)
temp = []
img1 = mpimg.imread('gray/test.png')
img2 = mpimg.imread('gray/refrence.png')
temp.append(img1)
temp.append(img2)
visualize(temp)
def pixelcount():
global refrence_pixels
global sample_pixels
img = cv2.imread('gray/test.png', cv2.IMREAD_GRAYSCALE)
sample_pixels = np.sum(img == 255)
img = cv2.imread('gray/refrence.png', cv2.IMREAD_GRAYSCALE)
refrence_pixels = np.sum(img == 255)
messagebox.showinfo("Pixel Counts", "Total Refrence White Pixels Count :
"+str(sample_pixels)+"nTotal Sample White Pixels Count : "+str(refrence_pixels))
def timeAllocation():
avg = (sample_pixels/refrence_pixels) *100
if avg >= 90:
messagebox.showinfo("Green Signal Allocation Time","Traffic is very high allocation green signal
time : 60 secs")
if avg > 85 and avg < 90:
messagebox.showinfo("Green Signal Allocation Time","Traffic is high allocation green signal time :
50 secs")
if avg > 75 and avg <= 85:
messagebox.showinfo("Green Signal Allocation Time","Traffic is moderate green signal time : 40
secs")
if avg > 50 and avg <= 75:
messagebox.showinfo("Green Signal Allocation Time","Traffic is low allocation green signal time : 30
secs")
if avg <= 50:
messagebox.showinfo("Green Signal Allocation Time","Traffic is very low allocation green signal
time : 20 secs")](https://image.slidesharecdn.com/smarttrafficcontrolsystemusingcannyedgedetectionalgorithm4-220822051313-d06a0e77/85/smart-traffic-control-system-using-canny-edge-detection-algorithm-4-pdf-46-320.jpg)