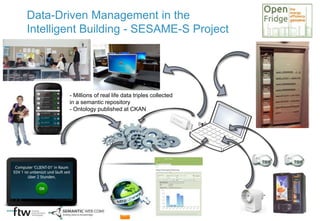
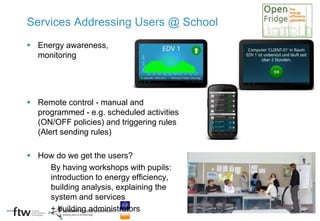
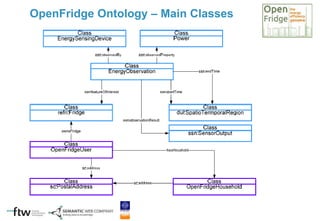
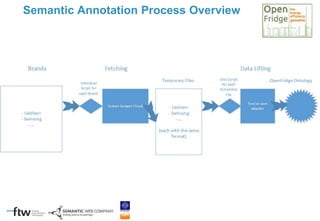
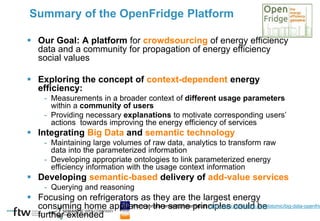
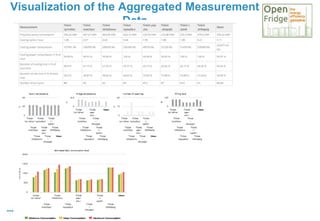
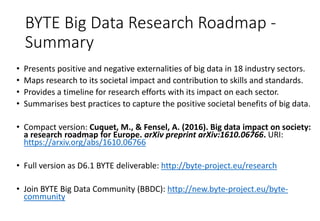
SMART DATA FOR BEHAVIOURAL CHANG
E:
TOWARDS ENERGY EFFICIENT BUILDINGS
Anna Fensel
Semantic Technology Institute (STI) Innsbruck, University of Innsbruck, Austria
Contact: anna.fensel@sti2.at
23.03.2017, Lunch Seminar of Institute of Computer Science, University Innsbruck, Austria
 Motivation
 Background
 Main Story: OpenFridge
 Extensions / Ongoing further work
- ENTROPY project: linking to psychology
- BYTE project and BBDC: linking to sociology
- DALICC project: linking to law
Outline
MOTIVATION
 From: “The Semantic Web is not a separate
Web but an extension of the current one, in
which information is given well-defined
meaning, better enabling computers and people
to work in cooperation.” – Tim Berners-Lee, James
Hendler, Ora Lassila, 2001
 Till: Smart Data??
Solved Problem
 Going mainstream:
schema.org,...
 Linked Open Data cloud
counts 25 billion triples
 Open government initiatives
 BBC, Facebook, Google,
Yahoo, etc. use semantics
 SPARQL becomes W3C
recommendation
 Life science and other
scientific communities use
ontologies
 RDF, OWL become W3C
recommedations
 Research field on ontologies
and semantics appears
 Term „Semantic Web“ has
been „seeded“, Scientific
American article, Tim
Semantic Web Evolution in One
Slide
2008
2001
2010
2004 Source: Open Knowledge Foundation
Unsolved Problem: Climate Change
Climate Change, Nordkette Innbruck
Climate Change, North of Russia
Computers still depend on humans in energy
delivery
Image credit: ClinGroup Holding
Finally – societal impact of (Big-)data…
BACKGROUND
Making Smart Data from Big Data with
semantics for energy efficient buildings -
Where it started…
Image credit: kurier.at
 In the topic since 2009, with 5 national and EU funded projects
 Was present in media such as:
 Graduated several PhD, Master and Bachelor students
 Published and reviewed at high quality energy venues e.g. Energy
Efficiency journal (SCI IF 2015: 1.183), but also at high quality Computer
Science venues
 Received awards e.g. Highly Commended Paper 2015 of Int. J. of
Pervasive Computing and Communications, Best Short Paper Award
of iiWAS 2013
 Gave invited talks e.g. at Skolkovo, ESTC
My credentials in the topic of energy
efficiency, smart buildings, responsible use
of associated data
Semantic Smart Home Demonstrator – SESAME
Project
 School in Upper
Austria
 Factory floor in Russia
Real Smart Building Setups
Smart Building Installations
Motivation: work with real buildings, real data
and real users
Technology:
 Several Smart Meters
 Sensors (e.g. light, temperature, humidity)
 Smart plugs, for individual sockets
 Multi-utility management
(i.e. electricity, heating)
 Shutdown services for PCs
 User interfaces and apps: Web, tablet,
smartphone (Android)
Data-Driven Management in the
Intelligent Building - SESAME-S Project
- Millions of real life data triples collected
in a semantic repository
- Ontology published at CKAN
Services Addressing Users @ School
 Energy awareness,
monitoring
 Remote control - manual and
programmed - e.g. scheduled activities
(ON/OFF policies) and triggering rules
(Alert sending rules)
 How do we get the users?
By having workshops with pupils:
introduction to energy efficiency,
building analysis, explaining the
system and services
+ building administrators
MAIN STORY: OPENFRIDGE
 Fensel, A., Tomic, S.D.K., Koller, A. “Contributing to
Appliances’ Energy Efficiency with Internet of Things, Smart
Data and User Engagement”. Future Generation Computer
Systems, Elsevier.
DOI:
SCI-indexed journal, 2015 Impact Factor: 2.430; CORE journal
rank: A
• Fensel, A., Gasser, F., Mayr, C., Ott, L., & Sarigianni, C. (2014). Selecting
Ontologies and Publishing Data of Electrical Appliances: A Refrigerator
Example. In On the Move to Meaningful Internet Systems: OTM 2014 Workshops
(pp. 494-503). Springer.
The presentation is based on…
http://dx.doi.org/10.1016/j.future.2016.11.026
Smart Grid is a Showcase for Data Economy
Smart Grid
Operation
Energy Markets
Synchro
Phasers
Renewables
Parks
Compliance
Smart Buildings
Electro
Mobility
Smart Cities
Smart
Appliances
Smart
Metering
Plant
Automation
Business
DSM
Compliance
Price Signals
Demand
Response
Capacity
Management
Prosumers
From general project presentation: http://www.slideshare.net/slotomic/big-data-openfrid
 What is energy efficiency?
– Using less energy to provide equivalent
service.
– A life-cycle characteristic of home
appliances.
Economy for Energy Efficiency Data
(Knowledge)?
 How energy efficiency is being assessed?
– By measuring and comparison.
– EE of Design: Efficiency labels awarded by
– verification institutes.
– EE of Use: Best practices, comparisons.
 How potential for increasing energy efficiency
is being assessed?
– By measuring/comparison  More context
needed
More info: http://www.atlete.eu, http://eetd.lbl.gov/ee/ee-1.htmlFrom general project presentation: http://www.slideshare.net/slotomic/big-data-openfrid
 Metering (Data)
- A source of big data, two-way exchange
- Dynamic tariffs, distributed generation, demand
management
- Granularity of measurements aggregated vs. appliance
level
- Provides energy awareness context
A Value-chain for Energy Efficiency Data
 Energy Awareness (Knowledge)
- Awareness context vs. usage context
- Awareness at the energy service level needed.
- Smart-plugs for individual measurements
- Label is a decision support tool pointing to technological
improvements in energy efficiency of appliances.
 Efficiency Increasing Actions
- Appliance replacement, more efficient use, technology
improvements From general project presentation: http://www.slideshare.net/slotomic/big-data-openfrid
 Developing a crowdsourcing platform for data collection
 Exploring the concept of context-dependent energy
efficiency
 Combining (big) data and semantics for add-value
services
OpenFridge : Opening and Processing
Appliances Data for Energy Efficiency
Improved
labeling
Improved
technology
and CRM
Better
decisions
about
replacement
and use
Home Users
Labeling Institutions
Manufacturers
Energy
Efficiency
Data
 Building an ecosystem around data
From general project presentation: http://www.slideshare.net/slotomic/big-data-openfrid
Usage profile
avg.
consumption,
cooling cycle,
defrost
cycle,…
Appliance profile
type, volume,
producer,
efficiency,
year of
production,
stand-
alone/built-in,
facing south,
location:
kitchen / cellar,
city, country,
number of users
Measurement profile
cooling level (1,2,3,..),
inside temperature, room
temperature, level of
filling,
doors opening events,
measurement duration
Comparisons, Recommendations & Analytics Services
Compare different refrigerators, refrigerators of the same type,
performance at different environmental conditions, set-points and
loadings, impact of opening the door, of aging, of installation, …
From Context to Recommendations
Measurements
power level (5s)
timestamp
From general project presentation: http://www.slideshare.net/slotomic/big-da
 Hardware & service interfaces for data acquisition
- Currently based on the existing commercial system with web-
service interface
 Big data & analytics for data processing
- Anticipating large user base
 Semantic technology for value-add services
- Easy integration of external data, vocabularies and ontologies
from the ecommerce and energy efficiency domain
- Logic-based reasoning
 Privacy and security protection of data
- Data provenance and veracity
 Community building and crowdsourcing
- Incentives based on high-quality recommendations
Platform Enablers
From general project presentation: http://www.slideshare.net/slotomic/big-data-openfrid
 Interfaces
- Attractiveness and usability of user interfaces for data acquisition
- Instrumentation for appliances data acquisition
- Privacy of user and appliances data
- Accuracy of data
 Big Data
- Analytics on raw data: mappers/reducers feed semantic
knowledgebase with model data
 Semantic Layer
- Ontology engineering
- External data integration
- Performance of the semantic knowledgebase
- Expressiveness of services via SPARQL queries for B2B/B2C
portal-based analytics
Challenges
From general project presentation: http://www.slideshare.net/slotomic/big-data-openfrid
Community &
Content Management
Big Data
Infrastructure
Data Acquisition
Web Service
Drupal Portal &
Web Service Client
Recommendations
&
Visualizations
Appliance Profile
Measurements
Profile
Appliance Profile
Measurements
Profile
Measurements
Business
Intelligence
Services
Users
Manufacturers
Labeling
Organisations
OpenFridge Architecture
Semantic
Knowledg
e
Base
Analytics
SPARQL: Data-
as-a-Service
Usage Profile
Volume?
Variety?
Velocity?
Veracity?
Value?
From general project presentation: http://www.slideshare.net/slotomic/big-d
OpenFridge Ontology – Main Classes
Semantic Annotation Process Overview
Tools for Data Fetching
Sources for Fridge Models Data
Results for Data Extraction
Tool: Python
• Importation process
• Restructure process
• Creation of the ontology-file
Result:
• OpenFridge ontology published at: http://www.sti-
innsbruck.at/results/ontologies, and indexed at LOV
portal
• 1032 refrigerator models with 18665 triples
Data Mapping – Implementation & Results
Technical:
● How to design an ontology 100% reusing other schemes
● How to fetch data from different HTML Web sources
● Screen scraping tools
● Creation of readable instances in protege
● How to get this data into a format that is readalbe for a tool like
Protege
○ How to develop
○ Challenges
Organizational:
● Managing project (devide tasks)
● Meetings (how to communicate)
● Engagement
Lessons Learned
 Actions
- Interactions with the users
- Instrumentation @Home
- Privacy & data quality
 Data (Big Data)
- Efficient storage
- Analytic processing, data structures
 Semantic Processing
- Ontology Design
- Integration of external data from structured and non-
structured sources
- Development and optimisation of queries (SPARQL)
for added value servies
 User Tests
- Project partner internal
- With test users & external
Implementation Steps
OpenFridge@WFF, Oct 2013
From general project presentation: http://www.slideshare.net/slotomic/big-data-openfrid
 Our Goal: A platform for crowdsourcing of energy efficiency
data and a community for propagation of energy efficiency
social values
 Exploring the concept of context-dependent energy
efficiency:
- Measurements in a broader context of different usage parameters
within a community of users
- Providing necessary explanations to motivate corresponding users’
actions towards improving the energy efficiency of services
 Integrating Big Data and semantic technology
- Maintaining large volumes of raw data, analytics to transform raw
data into the parameterized information
- Developing appropriate ontologies to link parameterized energy
efficiency information with the usage context information
 Developing semantic-based delivery of add-value services
- Querying and reasoning
 Focusing on refrigerators as they are the largest energy
consuming home appliance; the same principles could be
further extended
Summary of the OpenFridge Platform
From general project presentation: http://www.slideshare.net/slotomic/big-data-openfrid
Components of the OpenFridge Platform
Overview of High-level Concepts of OpenFridge
Ontologies
Visualization of a Single Measurement Data
Visualization of the Aggregated Measurement
Data
Aims:
 To identify whether the users were capable of using the
platform as a whole, and their response rates to it, on the
hardware, software and service levels
- between October 2014 and September 2015, the platform acquired 68
active users. Engaged were ca. 100, but for the rest the platform did
not work for different reasons (hardware failure, wireless
incompatibility, inability to set-up)
 To receive the feedback on the system’s existing and potential
features, particularly, regarding actual and potential usage of
collected data
- Survey at the end: 21 respondents (19 male, 2 female),
- 66,7%, came from Austria – the rest from the rest of the world,
- 90,5% of responders were running OpenFridge on Windows operation
system, and the rest were split between Linux, Android, iPhone/iPad.
Evaluation and Results
What do you see as the most useful
feature(s) and impact of the OpenFridge
portal?
Which data and knowledge engineering
issues on the portal have you experienced?
Would you share the data collected from
your appliances, and under which
conditions?
Which features do you think would increase
your engagement with the platform?
 An Internet of Things semantic platform OpenFridge is designed and
implemented.
 The platform has been deployed and evaluated with globally-
distributed real-life users.
 Real-life user and fridge measurements data has been collected and
published in open source repositories.
A set of selected characteristic anonymous fridge and freezer measurements,
including the detailed observation data of 426 complete cooling cycles, composition
of used ontologies, data of >1032 refrigerator models:
in the datahub: http://datahub.io/dataset/the-measurement-data-set-from-the-project-
open-fridge, http://www.sti-innsbruck.at/results/ontologies, and indexed at LOV portal
 High potential in facilitation of data economy has been
demonstrated in evaluations.
 Challenges in deployment of such platforms are discussed.
Summary - Highlights
EXTENSIONS / ONGOING FURTHER WORK
- ENTROPY
- BYTE, BBDC
- DALICC
• The H2020 ENTROPY project aims to design and deploy an innovative IT
ecosystem targeting at improving energy efficiency through consumers
understanding, engagement and behavioural changes.
• http://entropy-project.eu
• 3 real-life pilots (Italy, Spain, Switzerland)
• Energy efficiency facilitation taking into account personality profiles of
the users
• Ongoing work
Energy beliefs
• 97% believe energy conservation is something to be concerned
about
• 95% feel that conserving energy and natural resources is important
to them
• 94% believe conserving energy also their problem
• 91% have responsibility to conserve energy and resources
• 90% believe the organization they work for should conserve energy
• 92% believe they should and would help organization conserve
energy
• >85% willing to change daily routine to conserve energy
 however…
• Only 55% agree their country is in the middle of an energy crisis
• 20% feel news reports about energy crisis are blown out of
proportion
• >70% believe it is their right to use as much energy as they want
Innsbruck - Austria
2-3 February, 2017
Energy behaviour
• Almost all turn off the room/bathroom lights when
they leave
• 70% turn off computers
• >60% turn off the PC monitor
• ~50% turn off Air Conditioner(s)
• 23% turn off printer(s)
• 14% often leave the windows open with Aircon on
Innsbruck - Austria
2-3 February, 2017
Gamification User Types
• Using player typologies to understand individual
preferences is one of the common approaches for
personalization
• Personalizing gameful systems more effective than one-
size-fits-all approaches.
• Several studies indicated the need for personalizing
gamified systems to users’ personalities.
• Personalization can be used in gameful design to tailor
interaction mechanics to the user.
Innsbruck - Austria
2-3 February, 2017
HEXAD Gamification - User Types 1-3
Hexad gamification user types (Tondello et al., 2016):
• Philanthropists – motivated by purpose, altruistic and willing to give
without expecting a reward.
• Suggested design elements: collection and trading, gifting, knowledge sharing,
and administrative roles.
• Socialisers – motivated by relatedness – want to interact with others
and create social connections.
• Suggested design elements: guilds or teams, social networks, social
comparison, social competition, and social discovery.
• Free Spirits – motivated by autonomy, freedom to express themselves
and act without external control – like to create and explore within a
system.
• Suggested design elements: exploratory tasks, nonlinear gameplay, Easter
eggs, unlockable content, creativity tools, and customization.
Innsbruck - Austria
2-3 February, 2017
HEXAD Gamification - User Types 3-6
• Achievers – motivated by competence – seek to progress within a
system by completing tasks, or prove themselves by tackling difficult
challenges.
• Suggested design elements: challenges, certificates, learning new skills,
quests, levels or progression, and epic challenges (or “boss battles”).
• Players – motivated by extrinsic rewards – will do everything to earn a
reward within a system, independently of the type of the activity.
• Suggested design elements: points, rewards or prizes, leaderboards, badges or
achievements, virtual economy, and lotteries or games of chance.
• Disruptors – motivated by triggering changes – tend to disrupt the
system either directly or through others to force negative or positive
changes, test the system’s boundaries and try to push further. Although
disruption can be negative (e.g., cheaters or griefers), it can also work
towards improving the system.
• Suggested design elements: innovation platforms, voting mechanisms,
development tools, anonymity, anarchic gameplay.
Innsbruck - Austria
2-3 February, 2017
 Although users are likely to display a principal tendency, in most cases
they will also be motivated by all the other types to some degree
(Tondello et al., 2016).
Gamification user types
• Achiever rated high by 89% of participants.
• Philanthropist by 88%
• Socializer by 76%
• Free Spirit by 75%
• Player by 43%
• Disruptor by 12%
Innsbruck - Austria
2-3 February, 2017
Correlation of user types & game elements
In addition to gamification user type prefs offered in
bibliography, for an energy conservation app, our sample
prefer:
• Philanthropists  badges and roles.
• Socialisers  points, badges, rewards and roles.
• Free spirits  points, badges, progression, status, levels and
roles.
• Achievers  no specific preference towards any of the
elements.
• Disruptors  status.
• Players  rewards, points, badges, leaderboards, status
Innsbruck - Austria
2-3 February, 2017
Personality Profile
– The big 5 personality traits have been
correlated with:
– Pro-environmental attitudes & environmental
engagement
– Concern For Privacy in LBS & Usage Intention of
Location-Based Services
– Game Playing Style, Behaviour, Motivations to
Play, Difficulty adaptation
– Player typologies
– Game genre preferences
Innsbruck - Austria
2-3 February, 2017
Engagement
• The “positive work-related state of fulfilment that is
characterized by vigor, dedication, and absorption”, the
positive antipode of burnout. (Schaufeli, Bakker and
Salanova, 2006)
• Gallup’s categorization of employees, based on level of
engagement (Prakash and Rao, 2015):
• Engaged: work with passion and feel a profound connection to
their organization, drive innovation and move the organization
forward
• Non-engaged: are essentially “checked-out”, sleepwalking through
their workday, putting time but not energy or passion into their
work
• Actively disengaged: are not just unhappy at work, but busy acting
out their unhappiness, undermining what their colleagues
accomplish, every day
Innsbruck - Austria
2-3 February, 2017
BYTE:
The BYTE research roadmap
Anna Fensel and Marti Cuquet,
University of Innsbruck, Austria
BYTE final conference, London, UK, 9 February 2017
Big data roadmap and cross-disciplinary community for
addressing societal externalities
Starting points: research topics from
BDVA and literature survey
• Research topics from BDVA’s Strategic Research and Innovation Agenda.
• Defines overall goals, technical and non-technical priorities and a research and innovation
roadmap.
• 6 main priorities:
Data
management
Data
processing
Data
analytics
Data
protection
Data
visualisation
Non-technical
priorities
to handle
unstructured data,
ensure semantic
interoperability,
asses data quality
and provenance
Optimised and
efficient
architectures for
data-at-rest and
data-in-motion,
decentralised,
scalable
with improved
models and
simulations, semantic
analysis, pattern
discovery, business
intelligence and
predictive and
prescriptive analytics
and anonymisation
to enable not open
data enter the Data
Value Chain with a
complete data
protection
framework,anonymis
ation algorithms,
multiparty mining
and user experience,
with interactive and
personalised
visualisations,
simplified query and
discovery
mechanisms, linked
data visualisations
skills development,
standardisation,
social perceptions
and societal
implication.
Data management Data processing Data analytics Data protection Data visualisation
Non-technical
priorities
A1 Handling
unstructured data
B1 Architectures for
data-at-rest and
data-in-motion
C1 Improved models
and simulations
D1 Complete data
protection
framework
E1 End user
visualisation and
analytics
F1 Establish and
increase trust
A2 Semantic
interoperability
B2 Tools for processing
real-time
heterogeneous
data
C2 Semantic analysis D2 Data minimization E2 Dynamic clustering
of information
F2 Privacy-by-design
A3 Measuring and
assuring data
quality
B3 Scalable algorithms
and techniques for
real-time analytics
C3 Event and pattern
discovery
D3 Privacy-preserving
mining algorithms
E3 New visualisation
for geospatial data
F3 Ethical issues
A4 Data management
lifecycle
B4 Decentralised
architectures
C4 Multimedia
(unstructured) data
mining
D4 Robust
anonymisation
algorithms
E4 Interrelated data
and semantics
relationships
F4 Develop new
business models
A5 Data provenance,
control and IPR
B5 Efficient
mechanisms for
storage and
processing
C5 Deep learning
techniques for BI,
predictive and
prescriptive
analytics
D5 Protection against
reversibility
E5 Qualitative analysis
at a high semantic
level
F5 Citizen research
A6 Data-as-a-service
model and
paradigm
C6 Context-aware
analytics
D6 Pattern hiding
mechanism
E6 Real-time and
collaborative 3-D
visualisation
F6 Discrimination
discovery and
prevention
D7 Secure multiparty
mining mechanism
E7 Time dimension of
big data
E8 Real-time adaptable
and interactive
visualisation
Process
1) Discussion and validation of
research topics
•Work in small round tables.
• Are the topics representative?
• Are there other relevant topics or subtopics?
• Are there other relevant sources aside from SRIA you’d like to incorporate?
2) Alignment of research topics
and externalities
• BYTE identified externalities have been grouped in 4 groups
and 18 subgroups
3) Time alignment and prioritisation
BYTE Research Roadmap - Heatmaps
BYTE Big Data Research Roadmap -
Summary
• Presents positive and negative externalities of big data in 18 industry sectors.
• Maps research to its societal impact and contribution to skills and standards.
• Provides a timeline for research efforts with its impact on each sector.
• Summarises best practices to capture the positive societal benefits of big data.
• Compact version: Cuquet, M., & Fensel, A. (2016). Big data impact on society:
a research roadmap for Europe. arXiv preprint arXiv:1610.06766. URI:
https://arxiv.org/abs/1610.06766
• Full version as D6.1 BYTE deliverable: http://byte-project.eu/research
• Join BYTE Big Data Community (BBDC): http://new.byte-project.eu/byte-
community
Data licensing
Image from DALICC consortium: FH St Pölten, STI Innsbruck, WU Wien,
Semantic Web Company, Höhne i. d. Maur & Partner Rechtsanwälte OG
https://www.dalicc.net/
Data licensing is still complicated, formats for licensed data use are under-defined.
Semantic standards for license development are in progress e.g. ODRL, RightsML.
Automated semantic-based data licensing support for derivative works is our ongoing work.
Thank you for your attention!
Questions?

Smart Data for Behavioural Change: Towards Energy Efficient Buildings

  • 1.
    SMART DATA FORBEHAVIOURAL CHANG E: TOWARDS ENERGY EFFICIENT BUILDINGS Anna Fensel Semantic Technology Institute (STI) Innsbruck, University of Innsbruck, Austria Contact: anna.fensel@sti2.at 23.03.2017, Lunch Seminar of Institute of Computer Science, University Innsbruck, Austria
  • 2.
     Motivation  Background Main Story: OpenFridge  Extensions / Ongoing further work - ENTROPY project: linking to psychology - BYTE project and BBDC: linking to sociology - DALICC project: linking to law Outline
  • 3.
  • 4.
     From: “TheSemantic Web is not a separate Web but an extension of the current one, in which information is given well-defined meaning, better enabling computers and people to work in cooperation.” – Tim Berners-Lee, James Hendler, Ora Lassila, 2001  Till: Smart Data?? Solved Problem
  • 5.
     Going mainstream: schema.org,... Linked Open Data cloud counts 25 billion triples  Open government initiatives  BBC, Facebook, Google, Yahoo, etc. use semantics  SPARQL becomes W3C recommendation  Life science and other scientific communities use ontologies  RDF, OWL become W3C recommedations  Research field on ontologies and semantics appears  Term „Semantic Web“ has been „seeded“, Scientific American article, Tim Semantic Web Evolution in One Slide 2008 2001 2010 2004 Source: Open Knowledge Foundation
  • 6.
  • 7.
  • 8.
  • 9.
    Computers still dependon humans in energy delivery Image credit: ClinGroup Holding
  • 10.
    Finally – societalimpact of (Big-)data…
  • 11.
  • 12.
    Making Smart Datafrom Big Data with semantics for energy efficient buildings - Where it started… Image credit: kurier.at
  • 13.
     In thetopic since 2009, with 5 national and EU funded projects  Was present in media such as:  Graduated several PhD, Master and Bachelor students  Published and reviewed at high quality energy venues e.g. Energy Efficiency journal (SCI IF 2015: 1.183), but also at high quality Computer Science venues  Received awards e.g. Highly Commended Paper 2015 of Int. J. of Pervasive Computing and Communications, Best Short Paper Award of iiWAS 2013  Gave invited talks e.g. at Skolkovo, ESTC My credentials in the topic of energy efficiency, smart buildings, responsible use of associated data
  • 14.
    Semantic Smart HomeDemonstrator – SESAME Project
  • 15.
     School inUpper Austria  Factory floor in Russia Real Smart Building Setups
  • 16.
    Smart Building Installations Motivation:work with real buildings, real data and real users Technology:  Several Smart Meters  Sensors (e.g. light, temperature, humidity)  Smart plugs, for individual sockets  Multi-utility management (i.e. electricity, heating)  Shutdown services for PCs  User interfaces and apps: Web, tablet, smartphone (Android)
  • 17.
    Data-Driven Management inthe Intelligent Building - SESAME-S Project - Millions of real life data triples collected in a semantic repository - Ontology published at CKAN
  • 18.
    Services Addressing Users@ School  Energy awareness, monitoring  Remote control - manual and programmed - e.g. scheduled activities (ON/OFF policies) and triggering rules (Alert sending rules)  How do we get the users? By having workshops with pupils: introduction to energy efficiency, building analysis, explaining the system and services + building administrators
  • 19.
  • 20.
     Fensel, A.,Tomic, S.D.K., Koller, A. “Contributing to Appliances’ Energy Efficiency with Internet of Things, Smart Data and User Engagement”. Future Generation Computer Systems, Elsevier. DOI: SCI-indexed journal, 2015 Impact Factor: 2.430; CORE journal rank: A • Fensel, A., Gasser, F., Mayr, C., Ott, L., & Sarigianni, C. (2014). Selecting Ontologies and Publishing Data of Electrical Appliances: A Refrigerator Example. In On the Move to Meaningful Internet Systems: OTM 2014 Workshops (pp. 494-503). Springer. The presentation is based on… http://dx.doi.org/10.1016/j.future.2016.11.026
  • 21.
    Smart Grid isa Showcase for Data Economy Smart Grid Operation Energy Markets Synchro Phasers Renewables Parks Compliance Smart Buildings Electro Mobility Smart Cities Smart Appliances Smart Metering Plant Automation Business DSM Compliance Price Signals Demand Response Capacity Management Prosumers From general project presentation: http://www.slideshare.net/slotomic/big-data-openfrid
  • 22.
     What isenergy efficiency? – Using less energy to provide equivalent service. – A life-cycle characteristic of home appliances. Economy for Energy Efficiency Data (Knowledge)?  How energy efficiency is being assessed? – By measuring and comparison. – EE of Design: Efficiency labels awarded by – verification institutes. – EE of Use: Best practices, comparisons.  How potential for increasing energy efficiency is being assessed? – By measuring/comparison  More context needed More info: http://www.atlete.eu, http://eetd.lbl.gov/ee/ee-1.htmlFrom general project presentation: http://www.slideshare.net/slotomic/big-data-openfrid
  • 23.
     Metering (Data) -A source of big data, two-way exchange - Dynamic tariffs, distributed generation, demand management - Granularity of measurements aggregated vs. appliance level - Provides energy awareness context A Value-chain for Energy Efficiency Data  Energy Awareness (Knowledge) - Awareness context vs. usage context - Awareness at the energy service level needed. - Smart-plugs for individual measurements - Label is a decision support tool pointing to technological improvements in energy efficiency of appliances.  Efficiency Increasing Actions - Appliance replacement, more efficient use, technology improvements From general project presentation: http://www.slideshare.net/slotomic/big-data-openfrid
  • 24.
     Developing acrowdsourcing platform for data collection  Exploring the concept of context-dependent energy efficiency  Combining (big) data and semantics for add-value services OpenFridge : Opening and Processing Appliances Data for Energy Efficiency Improved labeling Improved technology and CRM Better decisions about replacement and use Home Users Labeling Institutions Manufacturers Energy Efficiency Data  Building an ecosystem around data From general project presentation: http://www.slideshare.net/slotomic/big-data-openfrid
  • 25.
    Usage profile avg. consumption, cooling cycle, defrost cycle,… Applianceprofile type, volume, producer, efficiency, year of production, stand- alone/built-in, facing south, location: kitchen / cellar, city, country, number of users Measurement profile cooling level (1,2,3,..), inside temperature, room temperature, level of filling, doors opening events, measurement duration Comparisons, Recommendations & Analytics Services Compare different refrigerators, refrigerators of the same type, performance at different environmental conditions, set-points and loadings, impact of opening the door, of aging, of installation, … From Context to Recommendations Measurements power level (5s) timestamp From general project presentation: http://www.slideshare.net/slotomic/big-da
  • 26.
     Hardware &service interfaces for data acquisition - Currently based on the existing commercial system with web- service interface  Big data & analytics for data processing - Anticipating large user base  Semantic technology for value-add services - Easy integration of external data, vocabularies and ontologies from the ecommerce and energy efficiency domain - Logic-based reasoning  Privacy and security protection of data - Data provenance and veracity  Community building and crowdsourcing - Incentives based on high-quality recommendations Platform Enablers From general project presentation: http://www.slideshare.net/slotomic/big-data-openfrid
  • 27.
     Interfaces - Attractivenessand usability of user interfaces for data acquisition - Instrumentation for appliances data acquisition - Privacy of user and appliances data - Accuracy of data  Big Data - Analytics on raw data: mappers/reducers feed semantic knowledgebase with model data  Semantic Layer - Ontology engineering - External data integration - Performance of the semantic knowledgebase - Expressiveness of services via SPARQL queries for B2B/B2C portal-based analytics Challenges From general project presentation: http://www.slideshare.net/slotomic/big-data-openfrid
  • 28.
    Community & Content Management BigData Infrastructure Data Acquisition Web Service Drupal Portal & Web Service Client Recommendations & Visualizations Appliance Profile Measurements Profile Appliance Profile Measurements Profile Measurements Business Intelligence Services Users Manufacturers Labeling Organisations OpenFridge Architecture Semantic Knowledg e Base Analytics SPARQL: Data- as-a-Service Usage Profile Volume? Variety? Velocity? Veracity? Value? From general project presentation: http://www.slideshare.net/slotomic/big-d
  • 29.
  • 30.
  • 31.
  • 32.
    Sources for FridgeModels Data
  • 33.
    Results for DataExtraction
  • 34.
    Tool: Python • Importationprocess • Restructure process • Creation of the ontology-file Result: • OpenFridge ontology published at: http://www.sti- innsbruck.at/results/ontologies, and indexed at LOV portal • 1032 refrigerator models with 18665 triples Data Mapping – Implementation & Results
  • 35.
    Technical: ● How todesign an ontology 100% reusing other schemes ● How to fetch data from different HTML Web sources ● Screen scraping tools ● Creation of readable instances in protege ● How to get this data into a format that is readalbe for a tool like Protege ○ How to develop ○ Challenges Organizational: ● Managing project (devide tasks) ● Meetings (how to communicate) ● Engagement Lessons Learned
  • 36.
     Actions - Interactionswith the users - Instrumentation @Home - Privacy & data quality  Data (Big Data) - Efficient storage - Analytic processing, data structures  Semantic Processing - Ontology Design - Integration of external data from structured and non- structured sources - Development and optimisation of queries (SPARQL) for added value servies  User Tests - Project partner internal - With test users & external Implementation Steps OpenFridge@WFF, Oct 2013 From general project presentation: http://www.slideshare.net/slotomic/big-data-openfrid
  • 37.
     Our Goal:A platform for crowdsourcing of energy efficiency data and a community for propagation of energy efficiency social values  Exploring the concept of context-dependent energy efficiency: - Measurements in a broader context of different usage parameters within a community of users - Providing necessary explanations to motivate corresponding users’ actions towards improving the energy efficiency of services  Integrating Big Data and semantic technology - Maintaining large volumes of raw data, analytics to transform raw data into the parameterized information - Developing appropriate ontologies to link parameterized energy efficiency information with the usage context information  Developing semantic-based delivery of add-value services - Querying and reasoning  Focusing on refrigerators as they are the largest energy consuming home appliance; the same principles could be further extended Summary of the OpenFridge Platform From general project presentation: http://www.slideshare.net/slotomic/big-data-openfrid
  • 38.
    Components of theOpenFridge Platform
  • 39.
    Overview of High-levelConcepts of OpenFridge Ontologies
  • 40.
    Visualization of aSingle Measurement Data
  • 41.
    Visualization of theAggregated Measurement Data
  • 42.
    Aims:  To identifywhether the users were capable of using the platform as a whole, and their response rates to it, on the hardware, software and service levels - between October 2014 and September 2015, the platform acquired 68 active users. Engaged were ca. 100, but for the rest the platform did not work for different reasons (hardware failure, wireless incompatibility, inability to set-up)  To receive the feedback on the system’s existing and potential features, particularly, regarding actual and potential usage of collected data - Survey at the end: 21 respondents (19 male, 2 female), - 66,7%, came from Austria – the rest from the rest of the world, - 90,5% of responders were running OpenFridge on Windows operation system, and the rest were split between Linux, Android, iPhone/iPad. Evaluation and Results
  • 43.
    What do yousee as the most useful feature(s) and impact of the OpenFridge portal?
  • 44.
    Which data andknowledge engineering issues on the portal have you experienced?
  • 45.
    Would you sharethe data collected from your appliances, and under which conditions?
  • 46.
    Which features doyou think would increase your engagement with the platform?
  • 47.
     An Internetof Things semantic platform OpenFridge is designed and implemented.  The platform has been deployed and evaluated with globally- distributed real-life users.  Real-life user and fridge measurements data has been collected and published in open source repositories. A set of selected characteristic anonymous fridge and freezer measurements, including the detailed observation data of 426 complete cooling cycles, composition of used ontologies, data of >1032 refrigerator models: in the datahub: http://datahub.io/dataset/the-measurement-data-set-from-the-project- open-fridge, http://www.sti-innsbruck.at/results/ontologies, and indexed at LOV portal  High potential in facilitation of data economy has been demonstrated in evaluations.  Challenges in deployment of such platforms are discussed. Summary - Highlights
  • 48.
    EXTENSIONS / ONGOINGFURTHER WORK - ENTROPY - BYTE, BBDC - DALICC
  • 49.
    • The H2020ENTROPY project aims to design and deploy an innovative IT ecosystem targeting at improving energy efficiency through consumers understanding, engagement and behavioural changes. • http://entropy-project.eu • 3 real-life pilots (Italy, Spain, Switzerland) • Energy efficiency facilitation taking into account personality profiles of the users • Ongoing work
  • 50.
    Energy beliefs • 97%believe energy conservation is something to be concerned about • 95% feel that conserving energy and natural resources is important to them • 94% believe conserving energy also their problem • 91% have responsibility to conserve energy and resources • 90% believe the organization they work for should conserve energy • 92% believe they should and would help organization conserve energy • >85% willing to change daily routine to conserve energy  however… • Only 55% agree their country is in the middle of an energy crisis • 20% feel news reports about energy crisis are blown out of proportion • >70% believe it is their right to use as much energy as they want Innsbruck - Austria 2-3 February, 2017
  • 51.
    Energy behaviour • Almostall turn off the room/bathroom lights when they leave • 70% turn off computers • >60% turn off the PC monitor • ~50% turn off Air Conditioner(s) • 23% turn off printer(s) • 14% often leave the windows open with Aircon on Innsbruck - Austria 2-3 February, 2017
  • 52.
    Gamification User Types •Using player typologies to understand individual preferences is one of the common approaches for personalization • Personalizing gameful systems more effective than one- size-fits-all approaches. • Several studies indicated the need for personalizing gamified systems to users’ personalities. • Personalization can be used in gameful design to tailor interaction mechanics to the user. Innsbruck - Austria 2-3 February, 2017
  • 53.
    HEXAD Gamification -User Types 1-3 Hexad gamification user types (Tondello et al., 2016): • Philanthropists – motivated by purpose, altruistic and willing to give without expecting a reward. • Suggested design elements: collection and trading, gifting, knowledge sharing, and administrative roles. • Socialisers – motivated by relatedness – want to interact with others and create social connections. • Suggested design elements: guilds or teams, social networks, social comparison, social competition, and social discovery. • Free Spirits – motivated by autonomy, freedom to express themselves and act without external control – like to create and explore within a system. • Suggested design elements: exploratory tasks, nonlinear gameplay, Easter eggs, unlockable content, creativity tools, and customization. Innsbruck - Austria 2-3 February, 2017
  • 54.
    HEXAD Gamification -User Types 3-6 • Achievers – motivated by competence – seek to progress within a system by completing tasks, or prove themselves by tackling difficult challenges. • Suggested design elements: challenges, certificates, learning new skills, quests, levels or progression, and epic challenges (or “boss battles”). • Players – motivated by extrinsic rewards – will do everything to earn a reward within a system, independently of the type of the activity. • Suggested design elements: points, rewards or prizes, leaderboards, badges or achievements, virtual economy, and lotteries or games of chance. • Disruptors – motivated by triggering changes – tend to disrupt the system either directly or through others to force negative or positive changes, test the system’s boundaries and try to push further. Although disruption can be negative (e.g., cheaters or griefers), it can also work towards improving the system. • Suggested design elements: innovation platforms, voting mechanisms, development tools, anonymity, anarchic gameplay. Innsbruck - Austria 2-3 February, 2017  Although users are likely to display a principal tendency, in most cases they will also be motivated by all the other types to some degree (Tondello et al., 2016).
  • 55.
    Gamification user types •Achiever rated high by 89% of participants. • Philanthropist by 88% • Socializer by 76% • Free Spirit by 75% • Player by 43% • Disruptor by 12% Innsbruck - Austria 2-3 February, 2017
  • 56.
    Correlation of usertypes & game elements In addition to gamification user type prefs offered in bibliography, for an energy conservation app, our sample prefer: • Philanthropists  badges and roles. • Socialisers  points, badges, rewards and roles. • Free spirits  points, badges, progression, status, levels and roles. • Achievers  no specific preference towards any of the elements. • Disruptors  status. • Players  rewards, points, badges, leaderboards, status Innsbruck - Austria 2-3 February, 2017
  • 57.
    Personality Profile – Thebig 5 personality traits have been correlated with: – Pro-environmental attitudes & environmental engagement – Concern For Privacy in LBS & Usage Intention of Location-Based Services – Game Playing Style, Behaviour, Motivations to Play, Difficulty adaptation – Player typologies – Game genre preferences Innsbruck - Austria 2-3 February, 2017
  • 58.
    Engagement • The “positivework-related state of fulfilment that is characterized by vigor, dedication, and absorption”, the positive antipode of burnout. (Schaufeli, Bakker and Salanova, 2006) • Gallup’s categorization of employees, based on level of engagement (Prakash and Rao, 2015): • Engaged: work with passion and feel a profound connection to their organization, drive innovation and move the organization forward • Non-engaged: are essentially “checked-out”, sleepwalking through their workday, putting time but not energy or passion into their work • Actively disengaged: are not just unhappy at work, but busy acting out their unhappiness, undermining what their colleagues accomplish, every day Innsbruck - Austria 2-3 February, 2017
  • 59.
    BYTE: The BYTE researchroadmap Anna Fensel and Marti Cuquet, University of Innsbruck, Austria BYTE final conference, London, UK, 9 February 2017 Big data roadmap and cross-disciplinary community for addressing societal externalities
  • 60.
    Starting points: researchtopics from BDVA and literature survey • Research topics from BDVA’s Strategic Research and Innovation Agenda. • Defines overall goals, technical and non-technical priorities and a research and innovation roadmap. • 6 main priorities: Data management Data processing Data analytics Data protection Data visualisation Non-technical priorities to handle unstructured data, ensure semantic interoperability, asses data quality and provenance Optimised and efficient architectures for data-at-rest and data-in-motion, decentralised, scalable with improved models and simulations, semantic analysis, pattern discovery, business intelligence and predictive and prescriptive analytics and anonymisation to enable not open data enter the Data Value Chain with a complete data protection framework,anonymis ation algorithms, multiparty mining and user experience, with interactive and personalised visualisations, simplified query and discovery mechanisms, linked data visualisations skills development, standardisation, social perceptions and societal implication.
  • 61.
    Data management Dataprocessing Data analytics Data protection Data visualisation Non-technical priorities A1 Handling unstructured data B1 Architectures for data-at-rest and data-in-motion C1 Improved models and simulations D1 Complete data protection framework E1 End user visualisation and analytics F1 Establish and increase trust A2 Semantic interoperability B2 Tools for processing real-time heterogeneous data C2 Semantic analysis D2 Data minimization E2 Dynamic clustering of information F2 Privacy-by-design A3 Measuring and assuring data quality B3 Scalable algorithms and techniques for real-time analytics C3 Event and pattern discovery D3 Privacy-preserving mining algorithms E3 New visualisation for geospatial data F3 Ethical issues A4 Data management lifecycle B4 Decentralised architectures C4 Multimedia (unstructured) data mining D4 Robust anonymisation algorithms E4 Interrelated data and semantics relationships F4 Develop new business models A5 Data provenance, control and IPR B5 Efficient mechanisms for storage and processing C5 Deep learning techniques for BI, predictive and prescriptive analytics D5 Protection against reversibility E5 Qualitative analysis at a high semantic level F5 Citizen research A6 Data-as-a-service model and paradigm C6 Context-aware analytics D6 Pattern hiding mechanism E6 Real-time and collaborative 3-D visualisation F6 Discrimination discovery and prevention D7 Secure multiparty mining mechanism E7 Time dimension of big data E8 Real-time adaptable and interactive visualisation
  • 62.
    Process 1) Discussion andvalidation of research topics •Work in small round tables. • Are the topics representative? • Are there other relevant topics or subtopics? • Are there other relevant sources aside from SRIA you’d like to incorporate? 2) Alignment of research topics and externalities • BYTE identified externalities have been grouped in 4 groups and 18 subgroups 3) Time alignment and prioritisation
  • 63.
  • 65.
    BYTE Big DataResearch Roadmap - Summary • Presents positive and negative externalities of big data in 18 industry sectors. • Maps research to its societal impact and contribution to skills and standards. • Provides a timeline for research efforts with its impact on each sector. • Summarises best practices to capture the positive societal benefits of big data. • Compact version: Cuquet, M., & Fensel, A. (2016). Big data impact on society: a research roadmap for Europe. arXiv preprint arXiv:1610.06766. URI: https://arxiv.org/abs/1610.06766 • Full version as D6.1 BYTE deliverable: http://byte-project.eu/research • Join BYTE Big Data Community (BBDC): http://new.byte-project.eu/byte- community
  • 66.
    Data licensing Image fromDALICC consortium: FH St Pölten, STI Innsbruck, WU Wien, Semantic Web Company, Höhne i. d. Maur & Partner Rechtsanwälte OG https://www.dalicc.net/ Data licensing is still complicated, formats for licensed data use are under-defined. Semantic standards for license development are in progress e.g. ODRL, RightsML. Automated semantic-based data licensing support for derivative works is our ongoing work.
  • 67.
    Thank you foryour attention! Questions?

Editor's Notes

  • #22 Statement More complex and elaborate network Non trivial problems Smart grid, Objectives and business model Stakeholders Generate data Rules how these Generator of big data Operation on the consumer side Smart Cities Markets Consumer side is quite interesting – new business models – control of energy Smart metering smart appliances Energy efficiency
  • #23 Is there an economy for Energy efficiency Data? What data Three questions First question Using less for equivalent Life-cycle question Diagram Measurements –
  • #24 Let us look at the value chain All starts with the measurements – data Based on data new knowledge can be created And then some actions can be undertaken to increase energy efficiency So it all starts with the meter, the smart meter, We have been talking about Smart meters for years They can measure and communicate The support dynamic tariffs, distributed generation and What am I aware of Awareness context – how much we used – usage context much granular
  • #25 OpenFridge is a research project funded by the Austrian research funding agency
  • #31 Lukas
  • #32 Christina
  • #33 Christina
  • #34 Christina
  • #35 Fabian
  • #36 Fabian