Download to read offline


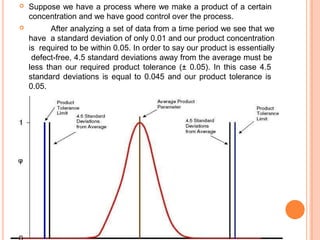


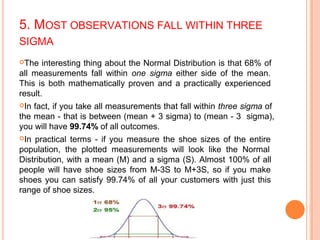

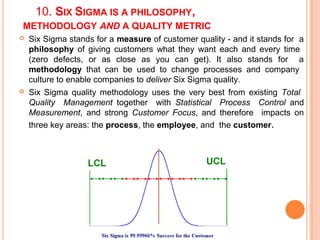


This document provides an overview of Six Sigma in 10 steps. It discusses key Six Sigma concepts like the normal distribution and defects per million opportunities (DPMO). The document explains that (1) processes can be measured and improved, (2) measurements typically follow a normal distribution, (3) most outcomes fall within 3 sigmas of the mean, and (4) Six Sigma aims for less than 4 defects per million by requiring 6 sigmas between the mean and specification limits. This achieves over 99.99966% success rate in meeting customer requirements.


