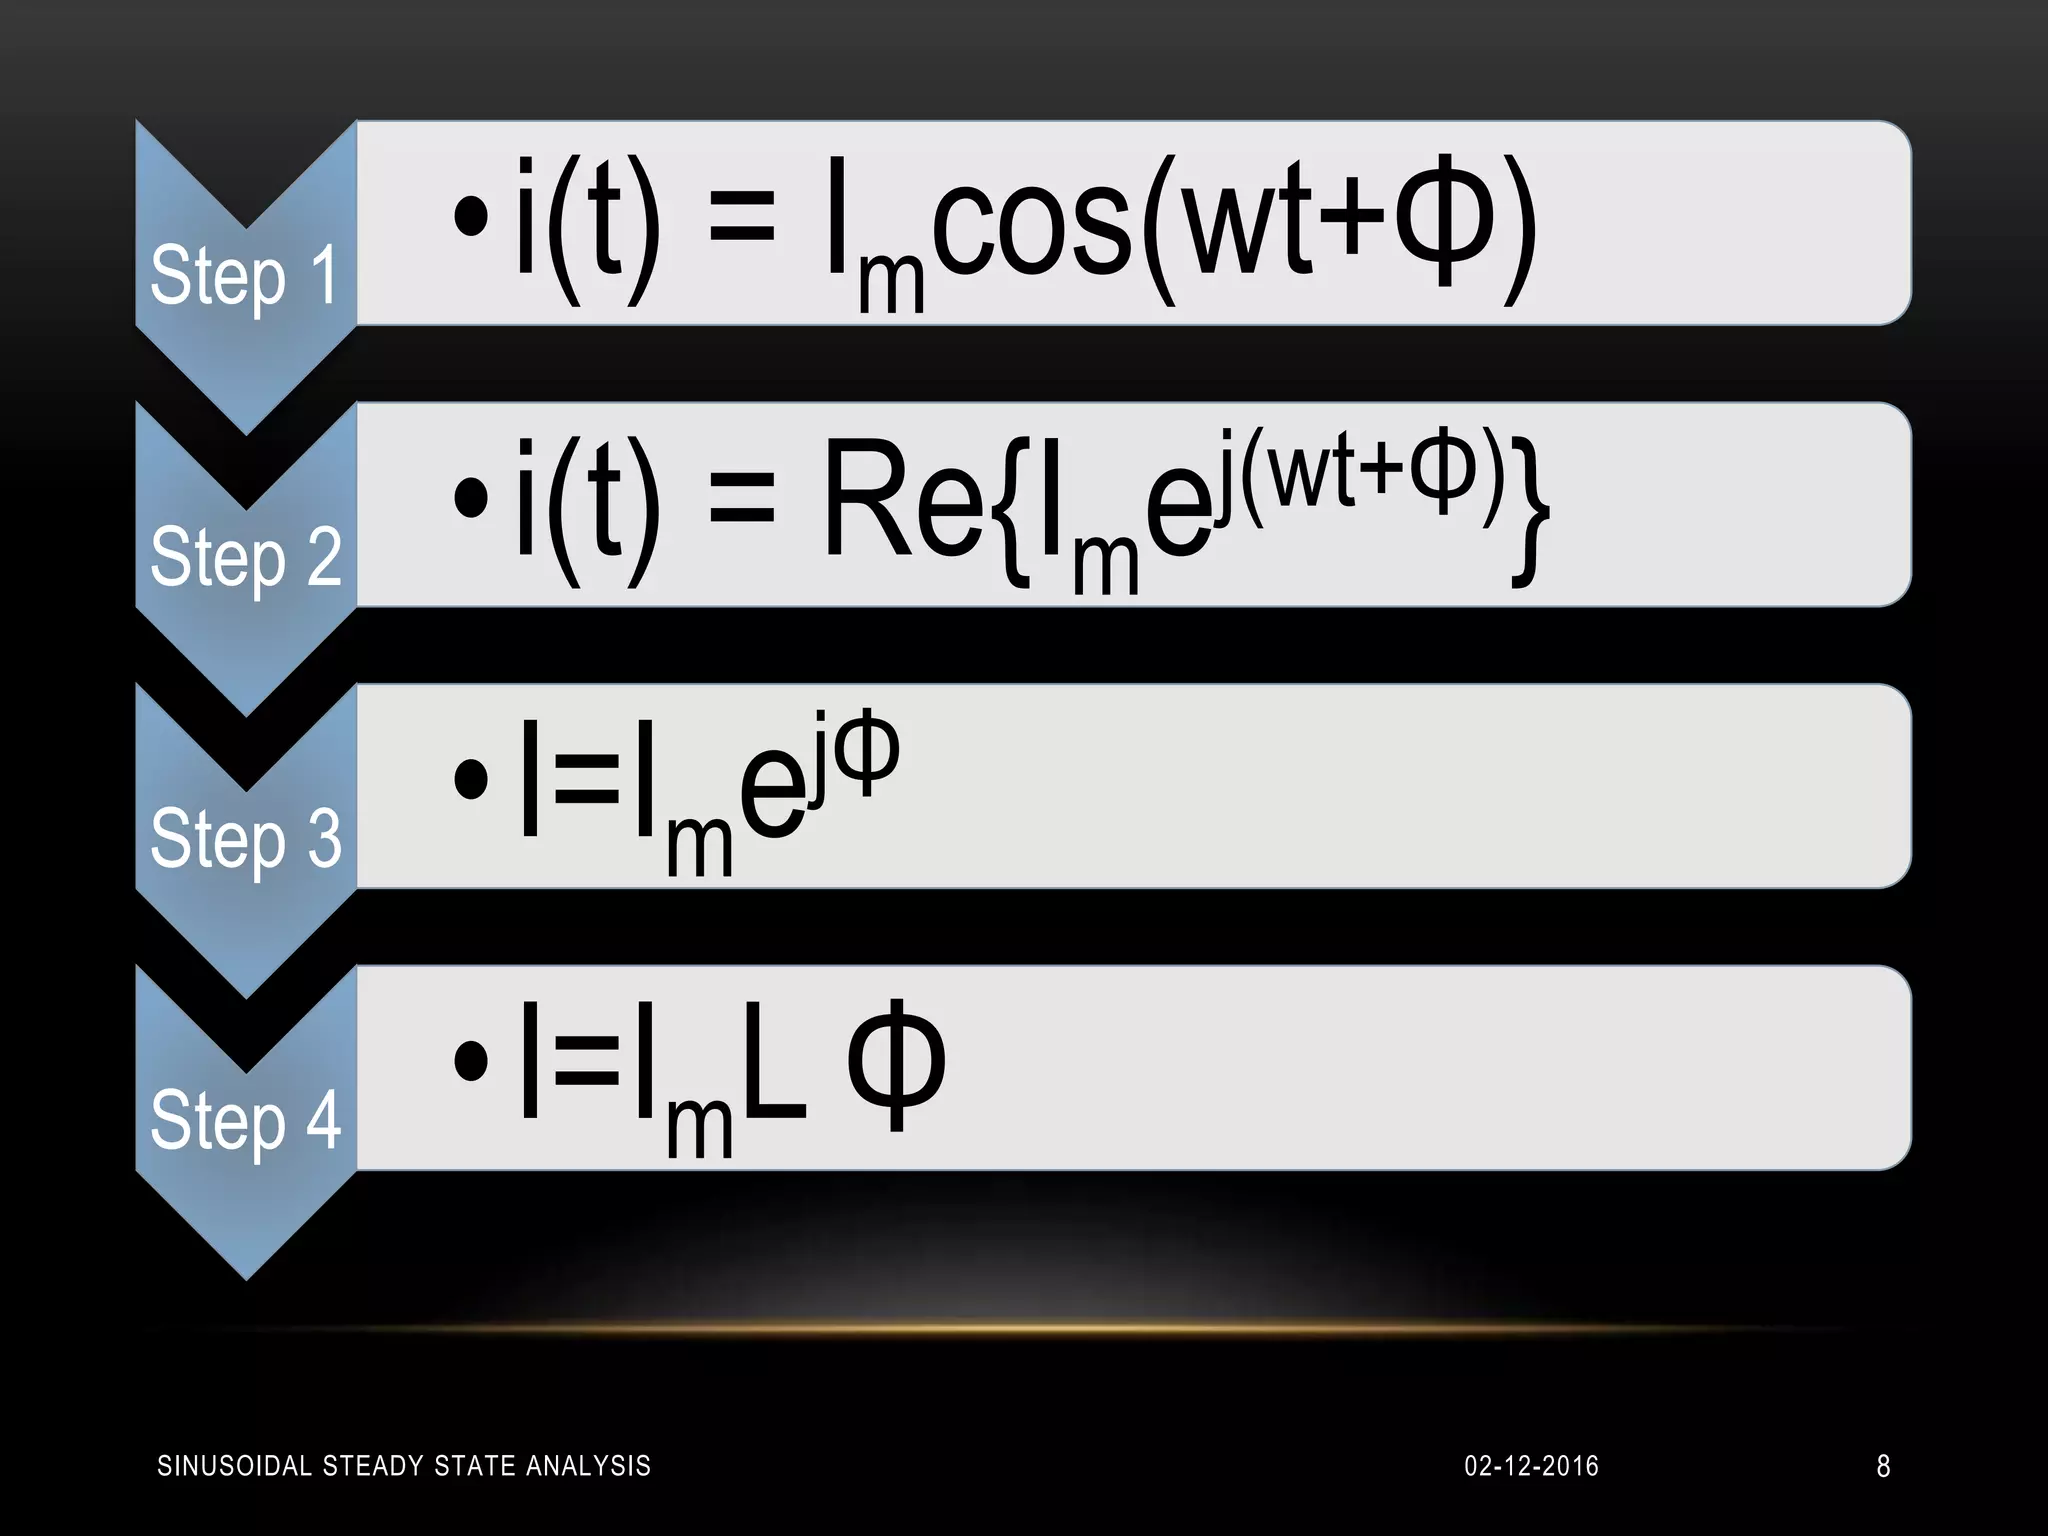
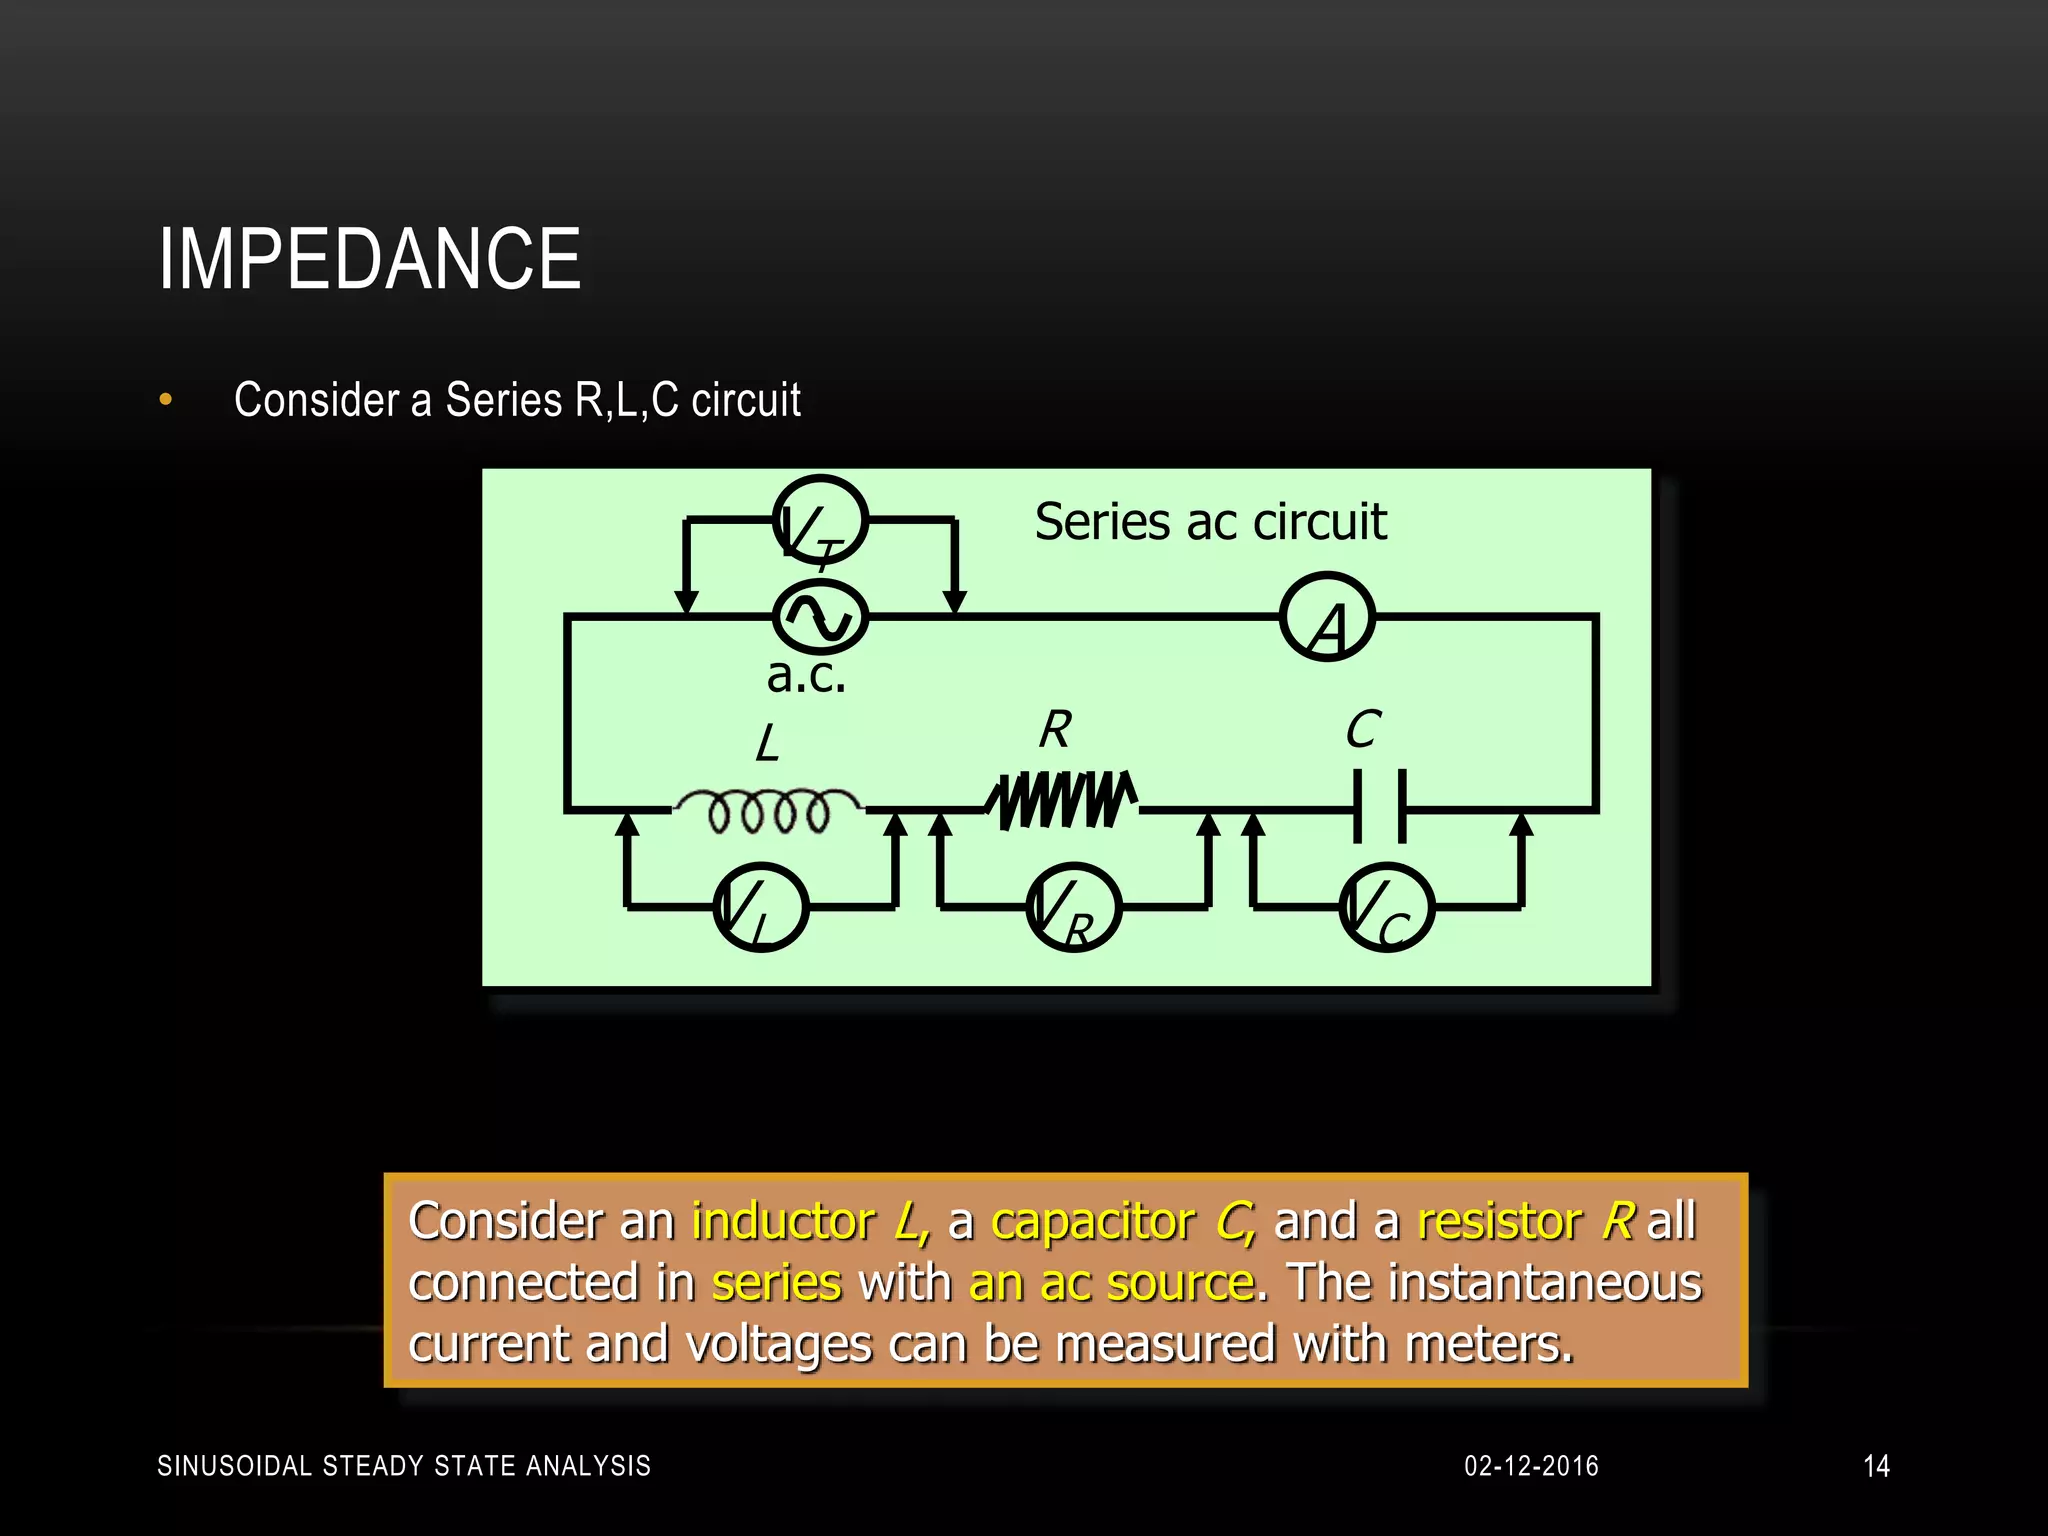
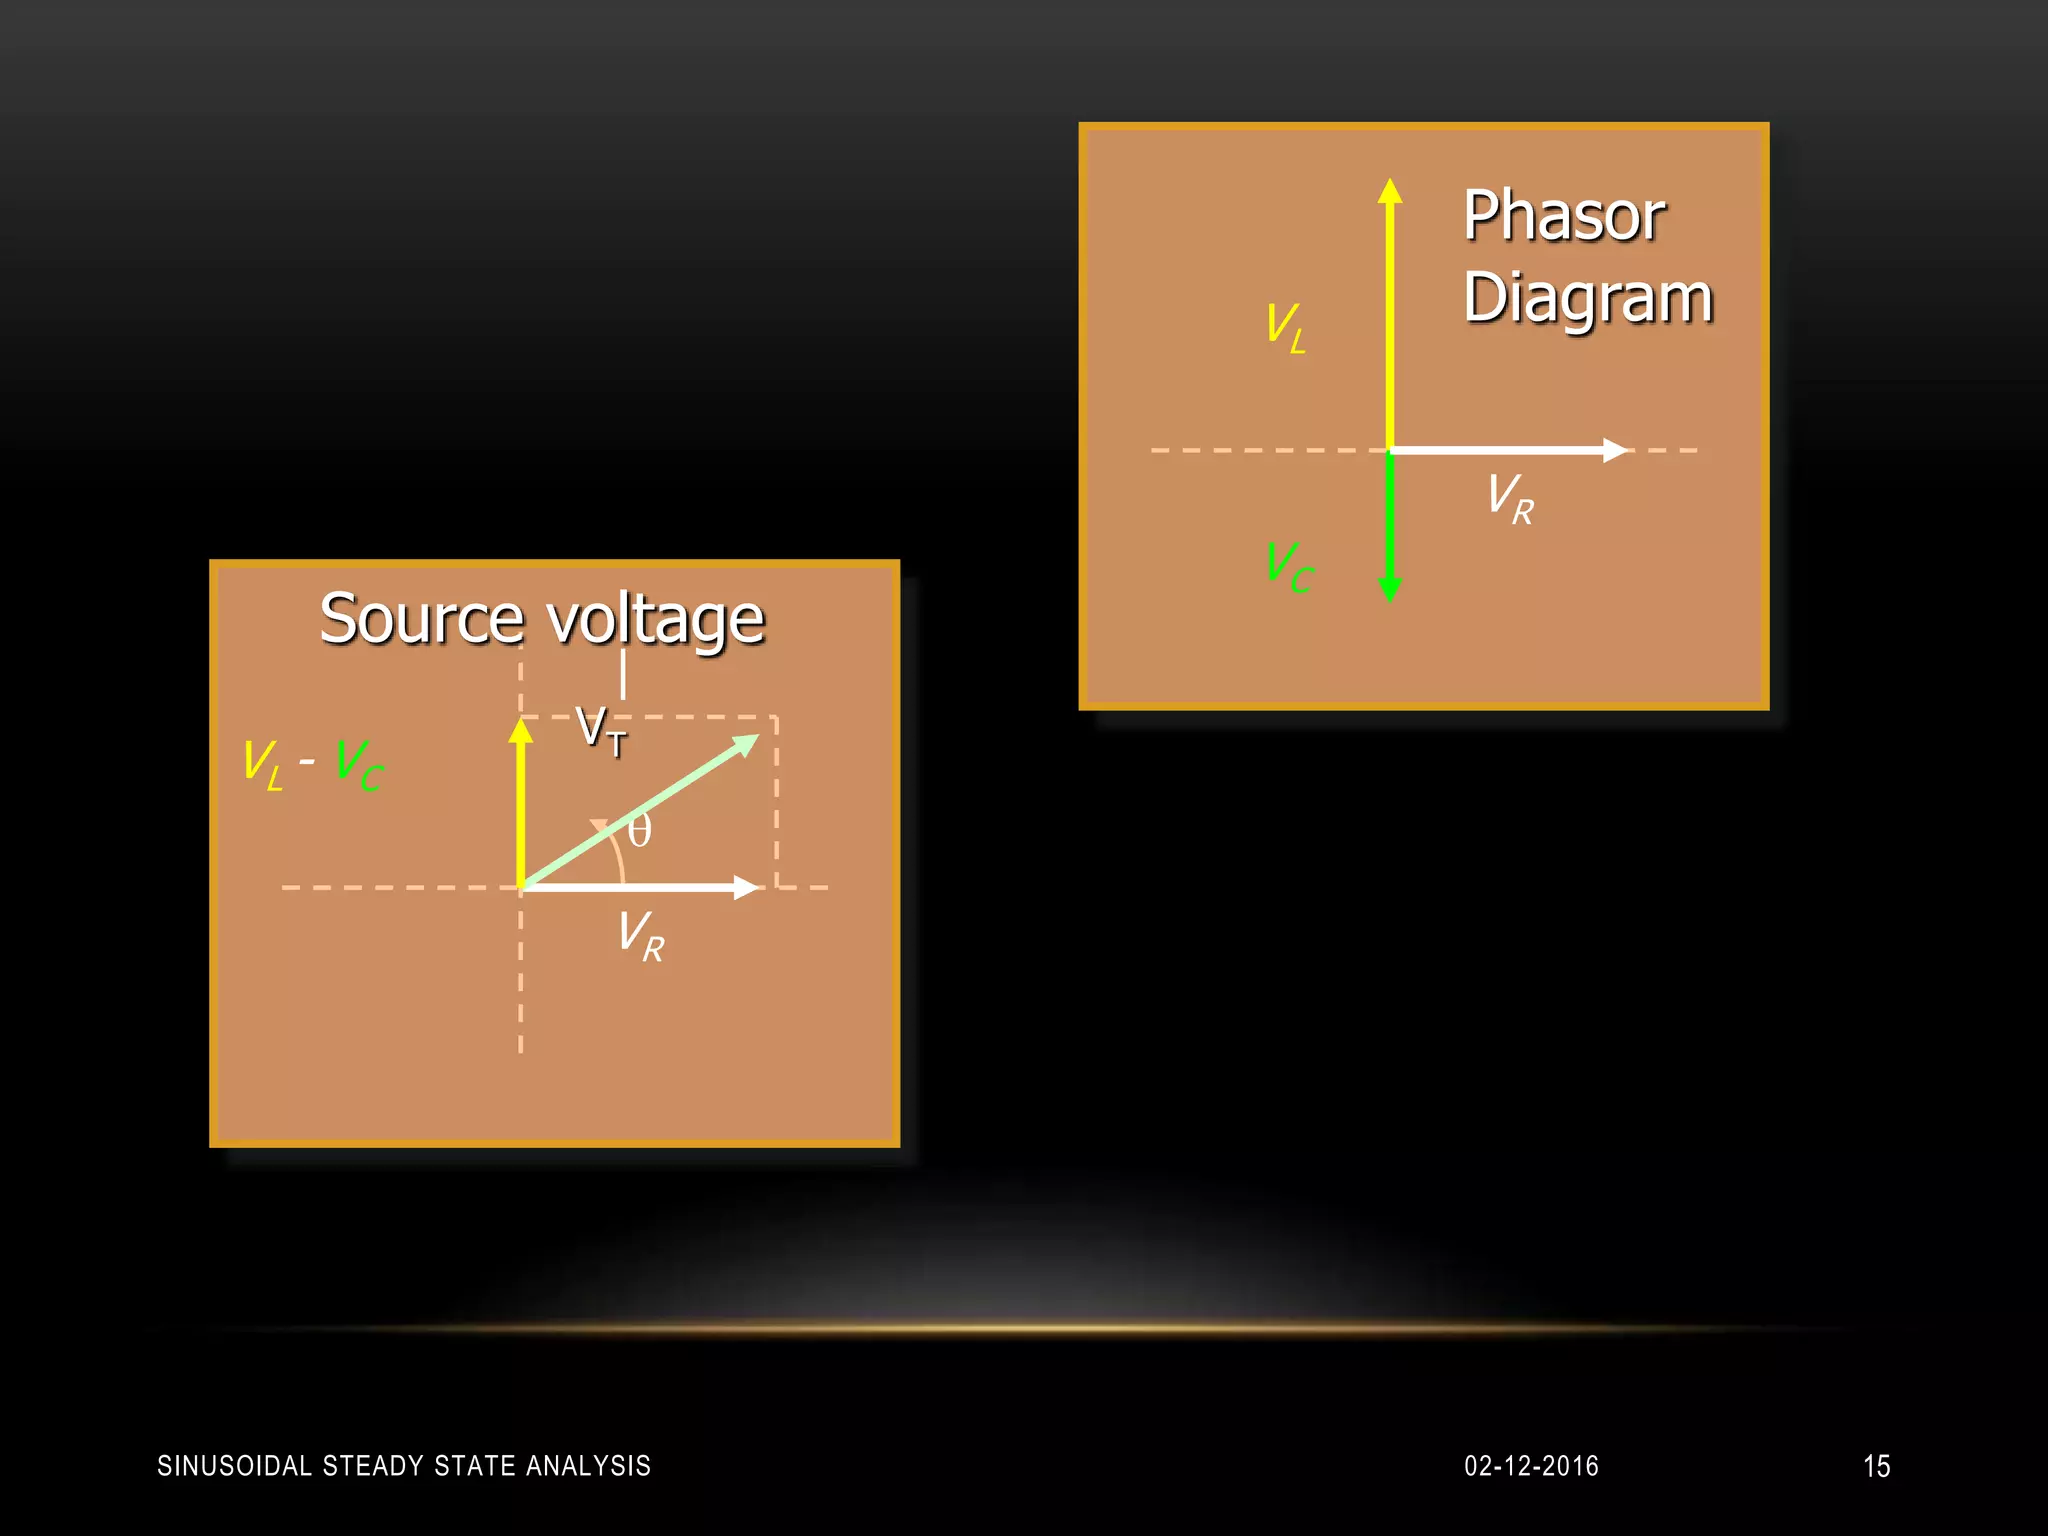
DONE BY:
ARUN
SINUSOIDAL STEADY STATE ANALYSIS
02-12-2016 1SINUSOIDAL STEADY STATE ANALYSIS
OBJECTIVES OF THIS PRESENTATION
• Learning how to represent a sine function with phase
• Learning about a phasor
• Converting rectangular form to polar form and vice versa
• Phase relationship for R,L,C and RLC circuits
• Impedance
• Phasor diagrams
• A sample problem
02-12-2016 2SINUSOIDAL STEADY STATE ANALYSIS
QUESTION???
• How will you represent mathematically a sine / cosine wave function with phase???
02-12-2016 3SINUSOIDAL STEADY STATE ANALYSIS
PHASOR
• A sinusoidal current or voltage at a given frequency is characterized by only two
parameters
• 1. amplitude
• 2. phase angle
• The complex representation of voltage is also characterized by the same two parameters.
02-12-2016 4SINUSOIDAL STEADY STATE ANALYSIS
• I=Imcos(wt+Φ)
• I=jImcos(wt+Φ)=Imej(wt+Φ)
Assumed sinusoidal form
Complex form of the corresponding current
02-12-2016 5SINUSOIDAL STEADY STATE ANALYSIS
• Throughout any linear circuit , operating in a sinusoidal steady state at a given frequency
w, every current or voltage may be characterized completely by the knowledge of its
amplitude and phase angle.
• None of the circuits we are considering will respond at a frequency other than that of the
excitation source, so that the value of ‘w’ is always known.
• The complex representation of every voltage will contain the same factor ejwt. Hence, we
can avoid carrying the redundant information throughout the solution.
02-12-2016 6SINUSOIDAL STEADY STATE ANALYSIS
• Hence,
• I=ImejΦ
• The complex quantities are usually written in polar form than exponential form to achieve
a slight addition of time saving and effort.
• Consider,
• v(t)=Vmcoswt
• It represented as VmL 0°
• i(t)=Imcos(wt+Φ)
• The real part of a complex quantity is i(t) = Re{Imej(wt+Φ)}
• I=ImL Φ
This abbreviated representation is called a phasor
02-12-2016 7SINUSOIDAL STEADY STATE ANALYSIS
Step 1 •i(t) = Imcos(wt+Φ)
Step 2 •i(t) = Re{Imej(wt+Φ)}
Step 3 •I=ImejΦ
Step 4 •I=ImL Φ
02-12-2016 8SINUSOIDAL STEADY STATE ANALYSIS
• Important Points to keep in mind:
1. In Phasor representation, phasors are complex quantities and hence are printed in boldface
type.
2. Capital letters are used for the phasor representation of an electrical quantity because the
phasor is not an instantaneous function of time; it contains only amplitude and phase angle
02-12-2016 9SINUSOIDAL STEADY STATE ANALYSIS
PHASOR RELATIONSHIP FOR R,L AND C
• Resistor
A
a.c. Source
R
V
Vmax
imax
Voltage
Current
Voltage and current are in phase, and Ohm’s law applies for effective
currents and voltages.
02-12-2016 10SINUSOIDAL STEADY STATE ANALYSIS
• Inductor
A
L
V
a.c.
Vmax
imax
Voltage
Current
The voltage peaks 900 before the current peaks. One builds as the other
falls and vice versa.
02-12-2016 11SINUSOIDAL STEADY STATE ANALYSIS
• Capacitor
Vmax
imax
Voltage
CurrentA V
a.c.
C
The voltage peaks 900 after the current peaks. One builds as the other falls
and vice versa.
02-12-2016 12SINUSOIDAL STEADY STATE ANALYSIS
• Resistor
• V=I*R
• Inductor
• V=jwL*I
• Capacitor
• I=jwC*V
wL is called the inductive reactance (XL)
1/wC is called the capacitive reactance(XC)
02-12-2016 13SINUSOIDAL STEADY STATE ANALYSIS
IMPEDANCE
• Consider a Series R,L,C circuit
L
VR VC
CR
a.c.
VL
VT
A
Series ac circuit
Consider an inductor L, a capacitor C, and a resistor R all
connected in series with an ac source. The instantaneous
current and voltages can be measured with meters.
02-12-2016 14SINUSOIDAL STEADY STATE ANALYSIS
VR
VC
VL
Phasor
Diagram
q
VR
VL - VC
VT
Source voltage
02-12-2016 15SINUSOIDAL STEADY STATE ANALYSIS
VT
= VR
2
+(VL
-VC
)2
tanf =
VL
-VC
VR
2 2
( )T L CV i R X X  
02-12-2016 16SINUSOIDAL STEADY STATE ANALYSIS
f
R
XL - XC
Z
Impedance 2 2
( )T L CV i R X X  
Z = R2
+(XL
- XC
)2
or T
T
V
V iZ i
Z
 
The impedance is the combined opposition to ac current consisting of both
resistance and reactance.
02-12-2016 17SINUSOIDAL STEADY STATE ANALYSIS
PHASOR DIAGRAMS
• 1. The phasor diagram is a name given to a sketch in the complex plane showing
relationships of the phasor voltages and phasor currents throughout a specific circuit.
• 2. It also provides a graphical method for solving certain problems which may be used to
check more exact analytical methods.
• 3.A phasor voltage 1cm long might represent 100V while a phasor current 1cm long might
represent 3mA. Plotting both the phasors on the same diagram enables us to determine
which waveform is leading or lagging.
02-12-2016 18SINUSOIDAL STEADY STATE ANALYSIS
• 4. The phasor diagram also offers an interesting interpretation of the time-domain to
frequency-domain transformation.
• 5. In summary, the frequency-domain phasor appears on the phasor diagram and the
transformation to the time domain is accomplished by allowing the phasor to rotate in a
counter clockwise direction at a angular velocity of ‘w’ rad/s and then visualising the
projection on the real axis
02-12-2016 19SINUSOIDAL STEADY STATE ANALYSIS
• Example:
• V=6+j8=10L 53.1°
j8
6
53.1°10
02-12-2016 20SINUSOIDAL STEADY STATE ANALYSIS
• THANK YOU
02-12-2016 21SINUSOIDAL STEADY STATE ANALYSIS

Sinusoidal Steady State Ananlysis

  • 1.
    DONE BY: ARUN SINUSOIDAL STEADYSTATE ANALYSIS 02-12-2016 1SINUSOIDAL STEADY STATE ANALYSIS
  • 2.
    OBJECTIVES OF THISPRESENTATION • Learning how to represent a sine function with phase • Learning about a phasor • Converting rectangular form to polar form and vice versa • Phase relationship for R,L,C and RLC circuits • Impedance • Phasor diagrams • A sample problem 02-12-2016 2SINUSOIDAL STEADY STATE ANALYSIS
  • 3.
    QUESTION??? • How willyou represent mathematically a sine / cosine wave function with phase??? 02-12-2016 3SINUSOIDAL STEADY STATE ANALYSIS
  • 4.
    PHASOR • A sinusoidalcurrent or voltage at a given frequency is characterized by only two parameters • 1. amplitude • 2. phase angle • The complex representation of voltage is also characterized by the same two parameters. 02-12-2016 4SINUSOIDAL STEADY STATE ANALYSIS
  • 5.
    • I=Imcos(wt+Φ) • I=jImcos(wt+Φ)=Imej(wt+Φ) Assumedsinusoidal form Complex form of the corresponding current 02-12-2016 5SINUSOIDAL STEADY STATE ANALYSIS
  • 6.
    • Throughout anylinear circuit , operating in a sinusoidal steady state at a given frequency w, every current or voltage may be characterized completely by the knowledge of its amplitude and phase angle. • None of the circuits we are considering will respond at a frequency other than that of the excitation source, so that the value of ‘w’ is always known. • The complex representation of every voltage will contain the same factor ejwt. Hence, we can avoid carrying the redundant information throughout the solution. 02-12-2016 6SINUSOIDAL STEADY STATE ANALYSIS
  • 7.
    • Hence, • I=ImejΦ •The complex quantities are usually written in polar form than exponential form to achieve a slight addition of time saving and effort. • Consider, • v(t)=Vmcoswt • It represented as VmL 0° • i(t)=Imcos(wt+Φ) • The real part of a complex quantity is i(t) = Re{Imej(wt+Φ)} • I=ImL Φ This abbreviated representation is called a phasor 02-12-2016 7SINUSOIDAL STEADY STATE ANALYSIS
  • 8.
    Step 1 •i(t)= Imcos(wt+Φ) Step 2 •i(t) = Re{Imej(wt+Φ)} Step 3 •I=ImejΦ Step 4 •I=ImL Φ 02-12-2016 8SINUSOIDAL STEADY STATE ANALYSIS
  • 9.
    • Important Pointsto keep in mind: 1. In Phasor representation, phasors are complex quantities and hence are printed in boldface type. 2. Capital letters are used for the phasor representation of an electrical quantity because the phasor is not an instantaneous function of time; it contains only amplitude and phase angle 02-12-2016 9SINUSOIDAL STEADY STATE ANALYSIS
  • 10.
    PHASOR RELATIONSHIP FORR,L AND C • Resistor A a.c. Source R V Vmax imax Voltage Current Voltage and current are in phase, and Ohm’s law applies for effective currents and voltages. 02-12-2016 10SINUSOIDAL STEADY STATE ANALYSIS
  • 11.
    • Inductor A L V a.c. Vmax imax Voltage Current The voltagepeaks 900 before the current peaks. One builds as the other falls and vice versa. 02-12-2016 11SINUSOIDAL STEADY STATE ANALYSIS
  • 12.
    • Capacitor Vmax imax Voltage CurrentA V a.c. C Thevoltage peaks 900 after the current peaks. One builds as the other falls and vice versa. 02-12-2016 12SINUSOIDAL STEADY STATE ANALYSIS
  • 13.
    • Resistor • V=I*R •Inductor • V=jwL*I • Capacitor • I=jwC*V wL is called the inductive reactance (XL) 1/wC is called the capacitive reactance(XC) 02-12-2016 13SINUSOIDAL STEADY STATE ANALYSIS
  • 14.
    IMPEDANCE • Consider aSeries R,L,C circuit L VR VC CR a.c. VL VT A Series ac circuit Consider an inductor L, a capacitor C, and a resistor R all connected in series with an ac source. The instantaneous current and voltages can be measured with meters. 02-12-2016 14SINUSOIDAL STEADY STATE ANALYSIS
  • 15.
    VR VC VL Phasor Diagram q VR VL - VC VT Sourcevoltage 02-12-2016 15SINUSOIDAL STEADY STATE ANALYSIS
  • 16.
    VT = VR 2 +(VL -VC )2 tanf = VL -VC VR 22 ( )T L CV i R X X   02-12-2016 16SINUSOIDAL STEADY STATE ANALYSIS
  • 17.
    f R XL - XC Z Impedance2 2 ( )T L CV i R X X   Z = R2 +(XL - XC )2 or T T V V iZ i Z   The impedance is the combined opposition to ac current consisting of both resistance and reactance. 02-12-2016 17SINUSOIDAL STEADY STATE ANALYSIS
  • 18.
    PHASOR DIAGRAMS • 1.The phasor diagram is a name given to a sketch in the complex plane showing relationships of the phasor voltages and phasor currents throughout a specific circuit. • 2. It also provides a graphical method for solving certain problems which may be used to check more exact analytical methods. • 3.A phasor voltage 1cm long might represent 100V while a phasor current 1cm long might represent 3mA. Plotting both the phasors on the same diagram enables us to determine which waveform is leading or lagging. 02-12-2016 18SINUSOIDAL STEADY STATE ANALYSIS
  • 19.
    • 4. Thephasor diagram also offers an interesting interpretation of the time-domain to frequency-domain transformation. • 5. In summary, the frequency-domain phasor appears on the phasor diagram and the transformation to the time domain is accomplished by allowing the phasor to rotate in a counter clockwise direction at a angular velocity of ‘w’ rad/s and then visualising the projection on the real axis 02-12-2016 19SINUSOIDAL STEADY STATE ANALYSIS
  • 20.
    • Example: • V=6+j8=10L53.1° j8 6 53.1°10 02-12-2016 20SINUSOIDAL STEADY STATE ANALYSIS
  • 21.
    • THANK YOU 02-12-201621SINUSOIDAL STEADY STATE ANALYSIS