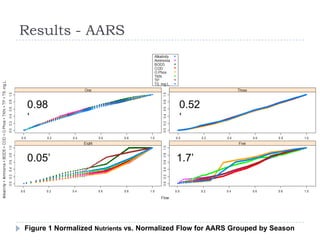
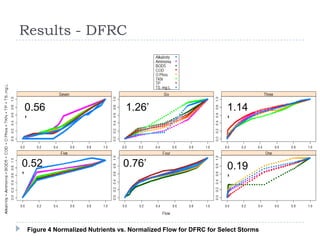
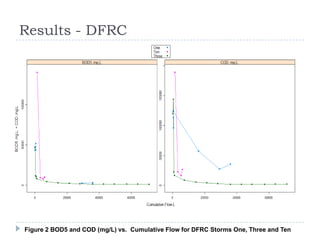
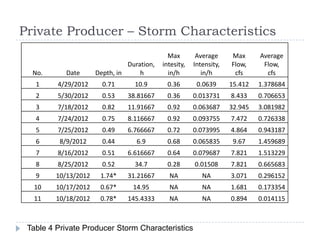
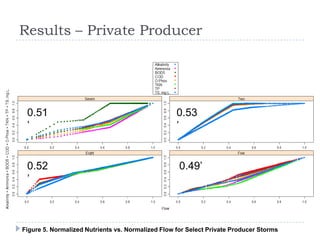
Silage Runoff Characteristics
                Michael Holly
      University of Wisconsin - Madison
         Dr. Rebecca Larson, Advisor
                April 3rd, 2013
Introduction
   Silage
       Fermented forage used as animal feed
       Corn and alfalfa are commonly used forage for dairy
        operations
   Silage Leachate
       Liquid by-product from ensiling forage
       High nutrient concentration
   Silage Runoff
       Flow of surface excess water over an area containing
        silage
Introduction
   Silage Runoff Characteristics
       Nutrient concentrations within silage runoff are variable
       Dependent on the following factors
           Event size
           Seasonality
           Bunker condition
           Silage quantity
       First-flush
           Analyzed in studies of urban runoff
           80% of the total pollutant mass is transported within the first
            30% of the total volume (Bertrand-Krajewski el al.,1998)
Introduction
   Impacts
   Surfacewater
       Phosphorus and nitrogen loading of watersheds
       Oxygen depletion
       Eutrophication and fish kills
       Low pH erodes structures and harms vegetation
   Groundwater
       Conversion of organic nitrogen to nitrates
       Metal leaching
       Contamination of aquifers
Introduction
   Benefits of Silage              watersheds
    Runoff
    Characterization
       Knowledge of
        relationship of loading
        throughout an event
           Reduction of utilized
            manure storage and
            hauling
           Improved treatment of
            silage runoff
           Standards for
            protection of
Introduction
       Characteristic Raw                           Silage Residential
                             Leachate                          Wastewater
          pH                            3.5-5.5                         6-9

      P (mg/L)                         300-600                         5-20

Organic N (mg/L)                      800-3,700                        5-40

   NH3 (mg/L)                          350-700                        10-50

   BOD5 (mg/L)                    12,000-90,000                     100-400


Table 1 Typical Silage Leachate and Residential Wastewater Characteristics (McDonald et. al.,
1991 and Burks, et al., 1994)
Introduction
   Horizontal Bunkers
       Common type of silage
        storage for large dairies
       Filled immediately after
        harvest
       Forage is compacted and
        sealed
       High potential for silage
        runoff
Methods
   Three Sites Sampled in WI over Spring, Summer
    and Fall
       Arlington Agricultural Research Station (AARS)
       US Dairy Forage Research Center (DFRC)
       Private Producer
   ISCO Automated Samplers Used for Sampling
       2 Samples per bottle, 14 bottles total
       Flow activated samples
       Samples refrigerated within sampler
   Analysis
       Completed at UW-Madison
       Alkalinity, NH3, BOD5, COD, NO2, NO2 + NO3, SRP, pH,
        total P and total solids
Methods - AARS
   530 head dairy
   1.3 acre concrete
    silage bunker
       0.3 acres pad
       1 acre bunker
   Separate surface
    and subsurface
    collection system
   Surface samples
    collected
Methods - AARS
Methods - DFRC
   350 Head Dairy
   0.6 acre asphalt
    bunker
       0.2 acres
        bunker pad
       0.4 acres
        bunker
   No subsurface
    collection
   Surface
    samples
    collected for
    analysis
Methods – DFRC
Methods - Private Producer
   3,500 head dairy
   1.7 acre bunker
       0.5 acres bunker pad
       1.2 acres bunker
   Surface and
    subsurface were
    routed to the same
    culvert
   Surface and
    subsurface was
    sampled
Methods – Data Analysis
   Average Storm Nutrient
    Concentrations (mg/L)


   Normalized Cumulative
    Pollution Load Curves

       Dimensionless plot of the
        distribution of pollutant
        load with volume


                                    (Tabei et. al., 2004)
AARS – Storm Characteristics

                                           Max      Average     Max     Average
                              Duration, intensity, Intensity,   Flow,    Flow,
  No.     Date      Depth, in     h        in/h       in/h       cfs      cfs
   1    11/2/2011     0.98       14.3      0.36      0.0698     0.639    0.046
  2*    11/5/2011     1.5        24.2      0.72      0.0190      n/a      n/a
   3    4/26/2012     0.52       86.5      0.04      0.0056     0.857    0.085
   4    5/30/2012     0.19       7.3       0.12      0.0267     0.699    0.236
   5    7/18/2012     1.7        17.7      0.36      0.0972     2.544    0.253
  6*    7/24/2012     0.64       7.7       0.92      0.0821      n/a      n/a
  7*    7/24/2012     0.56       46.9      1.16      0.0119      n/a      n/a
   8    8/2/2012      0.05       47.6      0.04      0.0010     1.818    0.016
   9    8/7/2012      0.18      103.7      0.04      0.0001     3.774    0.230


 Table 2 AARS Storm Characteristics
Results - AARS


 0.98                                      0.52
 ’                                         ’


 0.05’                                    1.7’


Figure 1 Normalized Nutrients vs. Normalized Flow for AARS Grouped by Season
Results - AARS
   Maximum average storm nutrient concentrations for
    NH3, BOD5 and TP took place during early spring

   Minimum concentrations for COD and TP occurred in
    the summer

   Storms three, five and eight illustrated an increase in
    concentrations with flow and a moderate delayed
    storm curve

   A mild first flush occurred in the fall
DFRC – Storm Characteristics
                                               Max        Average      Max     Average
                                 Duration,   intesity,   Intensity,   Flow,     Flow,
    No.       Date     Depth, in      h        in/h         in/h        cfs      cfs
     1    10/23/2011     0.19    7.283333      0.32       0.02375     0.628   0.048818
     2     11/2/2011     1.04    12.63333      0.48      0.152461     0.766   0.191801
     3     11/8/2011     1.14    17.33333      0.52         0.12       0.79   0.146787
     4     4/29/2012     0.76      12.25        0.4      0.057281     1.141   0.167488
     5     5/30/2012     0.28    6.983333      0.16      0.036894     0.348   0.059283
     6     7/18/2012     1.26       3.45       3.68       0.33767     0.684   0.127977
     7     7/24/2012     0.56    41.18333      0.84      0.013363     2.663   0.194389
     8     8/26/2012     0.38    21.78333      0.08      0.014462     1.536   0.051788
     9      9/6/2012     0.03    77.91667      0.04       0.00036     0.923   0.019656
    10     10/9/2012     0.19    6.466667      0.08      0.026525     0.036   0.009285
    11    10/13/2012     0.33       12.8       0.08      0.026946     0.171   0.019054
    12    10/14/2012     0.28    20.21667      0.04        0.0126      0.45   0.034852
    13    10/25/2012     0.28    9.266667       NA           NA        0.13   0.011481


 Table 3 DFRC Storm Characteristics
Results - DFRC


0.56                             1.26’                            1.14
’                                                                 ’


0.52                            0.76’                             0.19
’                                                                 ’


 Figure 4 Normalized Nutrients vs. Normalized Flow for DFRC for Select Storms
Results - DFRC


Figure 2 BOD5 and COD (mg/L) vs. Cumulative Flow for DFRC Storms One, Three and Ten
DFRC Sample Bottles October Event


 Figure 3 Samples Bottles for DFRC Storm Number One
Results - DFRC
   Maximum average storm concentrations for
    NH3, BOD5, COD, SRP, TKN, TP, and TS took place
    immediately after filling the bunker (large amount of feed
    on pad)

   Minimum average storm concentrations for
    BOD5, COD, and SRP occurred during the summer with
    a large storm (high dilution effect)

   In the fall runoff indicated strong decay of nutrient
    concentrations with accumulated flow

   In the spring weak first flush

   In summer with large storm events with high peak flows
    resulted in a more delayed nutrient loading
Private Producer – Storm Characteristics
                                              Max        Average     Max      Average
                                Duration,   intesity,   Intensity,   Flow,     Flow,
  No.       Date      Depth, in     h         in/h         in/h       cfs       cfs
   1     4/29/2012      0.71      10.9        0.36       0.0639      15.412   1.378684
   2     5/30/2012      0.53    38.81667      0.36      0.013731     8.433    0.706653
   3     7/18/2012      0.82    11.91667      0.92      0.063687     32.945   3.081982
   4     7/24/2012      0.75    8.116667      0.92      0.093755     7.472    0.726338
   5     7/25/2012      0.49    6.766667      0.72      0.073995     4.864    0.943187
   6      8/9/2012      0.44       6.9        0.68      0.065835      9.67    1.459689
   7     8/16/2012      0.51    6.616667      0.64      0.079687     7.821    1.513229
   8     8/25/2012      0.52      34.7        0.28      0.01508      7.821    0.665683
   9     10/13/2012    1.74*    31.21667      NA           NA        3.071    0.296152
  10     10/17/2012    0.67*      14.95       NA           NA        1.681    0.173354
  11     10/18/2012    0.78*    145.4333      NA           NA        0.894    0.014115


 Table 4 Private Producer Storm Characteristics
Results – Private Producer


 0.51                                              0.53
 ’                                                 ’


 0.52                                               0.49’
 ’


Figure 5. Normalized Nutrients vs. Normalized Flow for Select Private Producer Storms
Results – Private Producer
   Lag time in sample collection may have missed peak
    concentrations

   Max flow weighted nutrient concentrations for NH3, COD, TKN,
    TP, and TS took place during filling

   Minimum flow weighted concentrations for NH3, BOD5, SRP,
    TP and TS were in the spring (a large portion of the feed and
    all corn silage had been used)

   Some summer runoff events displayed a moderate delayed
    storm curve

   Following filling in the fall, data demonstrated a moderate first
    flush
Conclusions
   Strongest first flush evidence took place in the fall
    while strongest delayed storm curves were
    documented in the summer

   Highest average storm nutrient concentrations were
    in the fall following filling and sometimes in the
    spring

   Lowest average storm nutrient concentrations were
    in the summer

   Highest concentrations among all sites was for
    DFRC’s initial samples in the fall (due to collection
    methods)
Acknowledgements
   Wisconsin Groundwater Coordinating Council
       Funding
   Dr. Rebecca Larson
       Advisor
   Zach Zopp
       Lab and Field Tech
   Shayne Havlovitz
       Undergraduate Research Assistant
   Dr. John Panuska
       Committee Member
   Dr. KG Karthikeyan
       Committee Member
References
   Burks, B.D. and M.M. Minnis (1994). "Onsite
    Wastewater Treatment Systems. " Madison, WI:
    Hogarth House, Ltd.
   McDonald, P., et al. (1991). The Biochemistry of
    Silage, Scholium International: 340.
   Taebi, A. and R. Droste (2004). "First flush pollution
    load of urban stormwater runoff." Journal of
    Environmental Engineering and Science 3(4): 301-
    309.
Questions?

Silage Runoff Characterization

  • 1.
    Silage Runoff Characteristics Michael Holly University of Wisconsin - Madison Dr. Rebecca Larson, Advisor April 3rd, 2013
  • 2.
    Introduction  Silage  Fermented forage used as animal feed  Corn and alfalfa are commonly used forage for dairy operations  Silage Leachate  Liquid by-product from ensiling forage  High nutrient concentration  Silage Runoff  Flow of surface excess water over an area containing silage
  • 3.
    Introduction  Silage Runoff Characteristics  Nutrient concentrations within silage runoff are variable  Dependent on the following factors  Event size  Seasonality  Bunker condition  Silage quantity  First-flush  Analyzed in studies of urban runoff  80% of the total pollutant mass is transported within the first 30% of the total volume (Bertrand-Krajewski el al.,1998)
  • 4.
    Introduction  Impacts  Surfacewater  Phosphorus and nitrogen loading of watersheds  Oxygen depletion  Eutrophication and fish kills  Low pH erodes structures and harms vegetation  Groundwater  Conversion of organic nitrogen to nitrates  Metal leaching  Contamination of aquifers
  • 5.
    Introduction  Benefits of Silage watersheds Runoff Characterization  Knowledge of relationship of loading throughout an event  Reduction of utilized manure storage and hauling  Improved treatment of silage runoff  Standards for protection of
  • 6.
    Introduction Characteristic Raw Silage Residential Leachate Wastewater pH 3.5-5.5 6-9 P (mg/L) 300-600 5-20 Organic N (mg/L) 800-3,700 5-40 NH3 (mg/L) 350-700 10-50 BOD5 (mg/L) 12,000-90,000 100-400 Table 1 Typical Silage Leachate and Residential Wastewater Characteristics (McDonald et. al., 1991 and Burks, et al., 1994)
  • 7.
    Introduction  Horizontal Bunkers  Common type of silage storage for large dairies  Filled immediately after harvest  Forage is compacted and sealed  High potential for silage runoff
  • 8.
    Methods  Three Sites Sampled in WI over Spring, Summer and Fall  Arlington Agricultural Research Station (AARS)  US Dairy Forage Research Center (DFRC)  Private Producer  ISCO Automated Samplers Used for Sampling  2 Samples per bottle, 14 bottles total  Flow activated samples  Samples refrigerated within sampler  Analysis  Completed at UW-Madison  Alkalinity, NH3, BOD5, COD, NO2, NO2 + NO3, SRP, pH, total P and total solids
  • 9.
    Methods - AARS  530 head dairy  1.3 acre concrete silage bunker  0.3 acres pad  1 acre bunker  Separate surface and subsurface collection system  Surface samples collected
  • 10.
  • 11.
    Methods - DFRC  350 Head Dairy  0.6 acre asphalt bunker  0.2 acres bunker pad  0.4 acres bunker  No subsurface collection  Surface samples collected for analysis
  • 12.
  • 13.
    Methods - PrivateProducer  3,500 head dairy  1.7 acre bunker  0.5 acres bunker pad  1.2 acres bunker  Surface and subsurface were routed to the same culvert  Surface and subsurface was sampled
  • 14.
    Methods – DataAnalysis  Average Storm Nutrient Concentrations (mg/L)  Normalized Cumulative Pollution Load Curves  Dimensionless plot of the distribution of pollutant load with volume (Tabei et. al., 2004)
  • 15.
    AARS – StormCharacteristics Max Average Max Average Duration, intensity, Intensity, Flow, Flow, No. Date Depth, in h in/h in/h cfs cfs 1 11/2/2011 0.98 14.3 0.36 0.0698 0.639 0.046 2* 11/5/2011 1.5 24.2 0.72 0.0190 n/a n/a 3 4/26/2012 0.52 86.5 0.04 0.0056 0.857 0.085 4 5/30/2012 0.19 7.3 0.12 0.0267 0.699 0.236 5 7/18/2012 1.7 17.7 0.36 0.0972 2.544 0.253 6* 7/24/2012 0.64 7.7 0.92 0.0821 n/a n/a 7* 7/24/2012 0.56 46.9 1.16 0.0119 n/a n/a 8 8/2/2012 0.05 47.6 0.04 0.0010 1.818 0.016 9 8/7/2012 0.18 103.7 0.04 0.0001 3.774 0.230 Table 2 AARS Storm Characteristics
  • 16.
    Results - AARS 0.98 0.52 ’ ’ 0.05’ 1.7’ Figure 1 Normalized Nutrients vs. Normalized Flow for AARS Grouped by Season
  • 17.
    Results - AARS  Maximum average storm nutrient concentrations for NH3, BOD5 and TP took place during early spring  Minimum concentrations for COD and TP occurred in the summer  Storms three, five and eight illustrated an increase in concentrations with flow and a moderate delayed storm curve  A mild first flush occurred in the fall
  • 18.
    DFRC – StormCharacteristics Max Average Max Average Duration, intesity, Intensity, Flow, Flow, No. Date Depth, in h in/h in/h cfs cfs 1 10/23/2011 0.19 7.283333 0.32 0.02375 0.628 0.048818 2 11/2/2011 1.04 12.63333 0.48 0.152461 0.766 0.191801 3 11/8/2011 1.14 17.33333 0.52 0.12 0.79 0.146787 4 4/29/2012 0.76 12.25 0.4 0.057281 1.141 0.167488 5 5/30/2012 0.28 6.983333 0.16 0.036894 0.348 0.059283 6 7/18/2012 1.26 3.45 3.68 0.33767 0.684 0.127977 7 7/24/2012 0.56 41.18333 0.84 0.013363 2.663 0.194389 8 8/26/2012 0.38 21.78333 0.08 0.014462 1.536 0.051788 9 9/6/2012 0.03 77.91667 0.04 0.00036 0.923 0.019656 10 10/9/2012 0.19 6.466667 0.08 0.026525 0.036 0.009285 11 10/13/2012 0.33 12.8 0.08 0.026946 0.171 0.019054 12 10/14/2012 0.28 20.21667 0.04 0.0126 0.45 0.034852 13 10/25/2012 0.28 9.266667 NA NA 0.13 0.011481 Table 3 DFRC Storm Characteristics
  • 19.
    Results - DFRC 0.56 1.26’ 1.14 ’ ’ 0.52 0.76’ 0.19 ’ ’ Figure 4 Normalized Nutrients vs. Normalized Flow for DFRC for Select Storms
  • 20.
    Results - DFRC Figure2 BOD5 and COD (mg/L) vs. Cumulative Flow for DFRC Storms One, Three and Ten
  • 21.
    DFRC Sample BottlesOctober Event Figure 3 Samples Bottles for DFRC Storm Number One
  • 22.
    Results - DFRC  Maximum average storm concentrations for NH3, BOD5, COD, SRP, TKN, TP, and TS took place immediately after filling the bunker (large amount of feed on pad)  Minimum average storm concentrations for BOD5, COD, and SRP occurred during the summer with a large storm (high dilution effect)  In the fall runoff indicated strong decay of nutrient concentrations with accumulated flow  In the spring weak first flush  In summer with large storm events with high peak flows resulted in a more delayed nutrient loading
  • 23.
    Private Producer –Storm Characteristics Max Average Max Average Duration, intesity, Intensity, Flow, Flow, No. Date Depth, in h in/h in/h cfs cfs 1 4/29/2012 0.71 10.9 0.36 0.0639 15.412 1.378684 2 5/30/2012 0.53 38.81667 0.36 0.013731 8.433 0.706653 3 7/18/2012 0.82 11.91667 0.92 0.063687 32.945 3.081982 4 7/24/2012 0.75 8.116667 0.92 0.093755 7.472 0.726338 5 7/25/2012 0.49 6.766667 0.72 0.073995 4.864 0.943187 6 8/9/2012 0.44 6.9 0.68 0.065835 9.67 1.459689 7 8/16/2012 0.51 6.616667 0.64 0.079687 7.821 1.513229 8 8/25/2012 0.52 34.7 0.28 0.01508 7.821 0.665683 9 10/13/2012 1.74* 31.21667 NA NA 3.071 0.296152 10 10/17/2012 0.67* 14.95 NA NA 1.681 0.173354 11 10/18/2012 0.78* 145.4333 NA NA 0.894 0.014115 Table 4 Private Producer Storm Characteristics
  • 24.
    Results – PrivateProducer 0.51 0.53 ’ ’ 0.52 0.49’ ’ Figure 5. Normalized Nutrients vs. Normalized Flow for Select Private Producer Storms
  • 25.
    Results – PrivateProducer  Lag time in sample collection may have missed peak concentrations  Max flow weighted nutrient concentrations for NH3, COD, TKN, TP, and TS took place during filling  Minimum flow weighted concentrations for NH3, BOD5, SRP, TP and TS were in the spring (a large portion of the feed and all corn silage had been used)  Some summer runoff events displayed a moderate delayed storm curve  Following filling in the fall, data demonstrated a moderate first flush
  • 26.
    Conclusions  Strongest first flush evidence took place in the fall while strongest delayed storm curves were documented in the summer  Highest average storm nutrient concentrations were in the fall following filling and sometimes in the spring  Lowest average storm nutrient concentrations were in the summer  Highest concentrations among all sites was for DFRC’s initial samples in the fall (due to collection methods)
  • 27.
    Acknowledgements  Wisconsin Groundwater Coordinating Council  Funding  Dr. Rebecca Larson  Advisor  Zach Zopp  Lab and Field Tech  Shayne Havlovitz  Undergraduate Research Assistant  Dr. John Panuska  Committee Member  Dr. KG Karthikeyan  Committee Member
  • 28.
    References  Burks, B.D. and M.M. Minnis (1994). "Onsite Wastewater Treatment Systems. " Madison, WI: Hogarth House, Ltd.  McDonald, P., et al. (1991). The Biochemistry of Silage, Scholium International: 340.  Taebi, A. and R. Droste (2004). "First flush pollution load of urban stormwater runoff." Journal of Environmental Engineering and Science 3(4): 301- 309.
  • 29.

Editor's Notes

  • #2 Good afternoon everyone, my name is Michael Holly and Silage Runoff Characterizaion and Treatment is my Masters project. My advisor is Dr. Rebecca Larson
  • #3 Leachate moisture from within forage, runoff moisture from precip.
  • #4 First flush high percentage of loading in the beginning of a hydrograph
  • #5 Over application of wasewater leads to reducing conditions resulting in metal leaching
  • #6 Reduction in storage for facilities that are required to collect silage runoff
  • #7 Raw Silage Leachate nutrient concentration is higher than residential wastewater
  • #8 After Sealing fermentation of forage takes place