The 2005 Shell Creek Watershed Study:
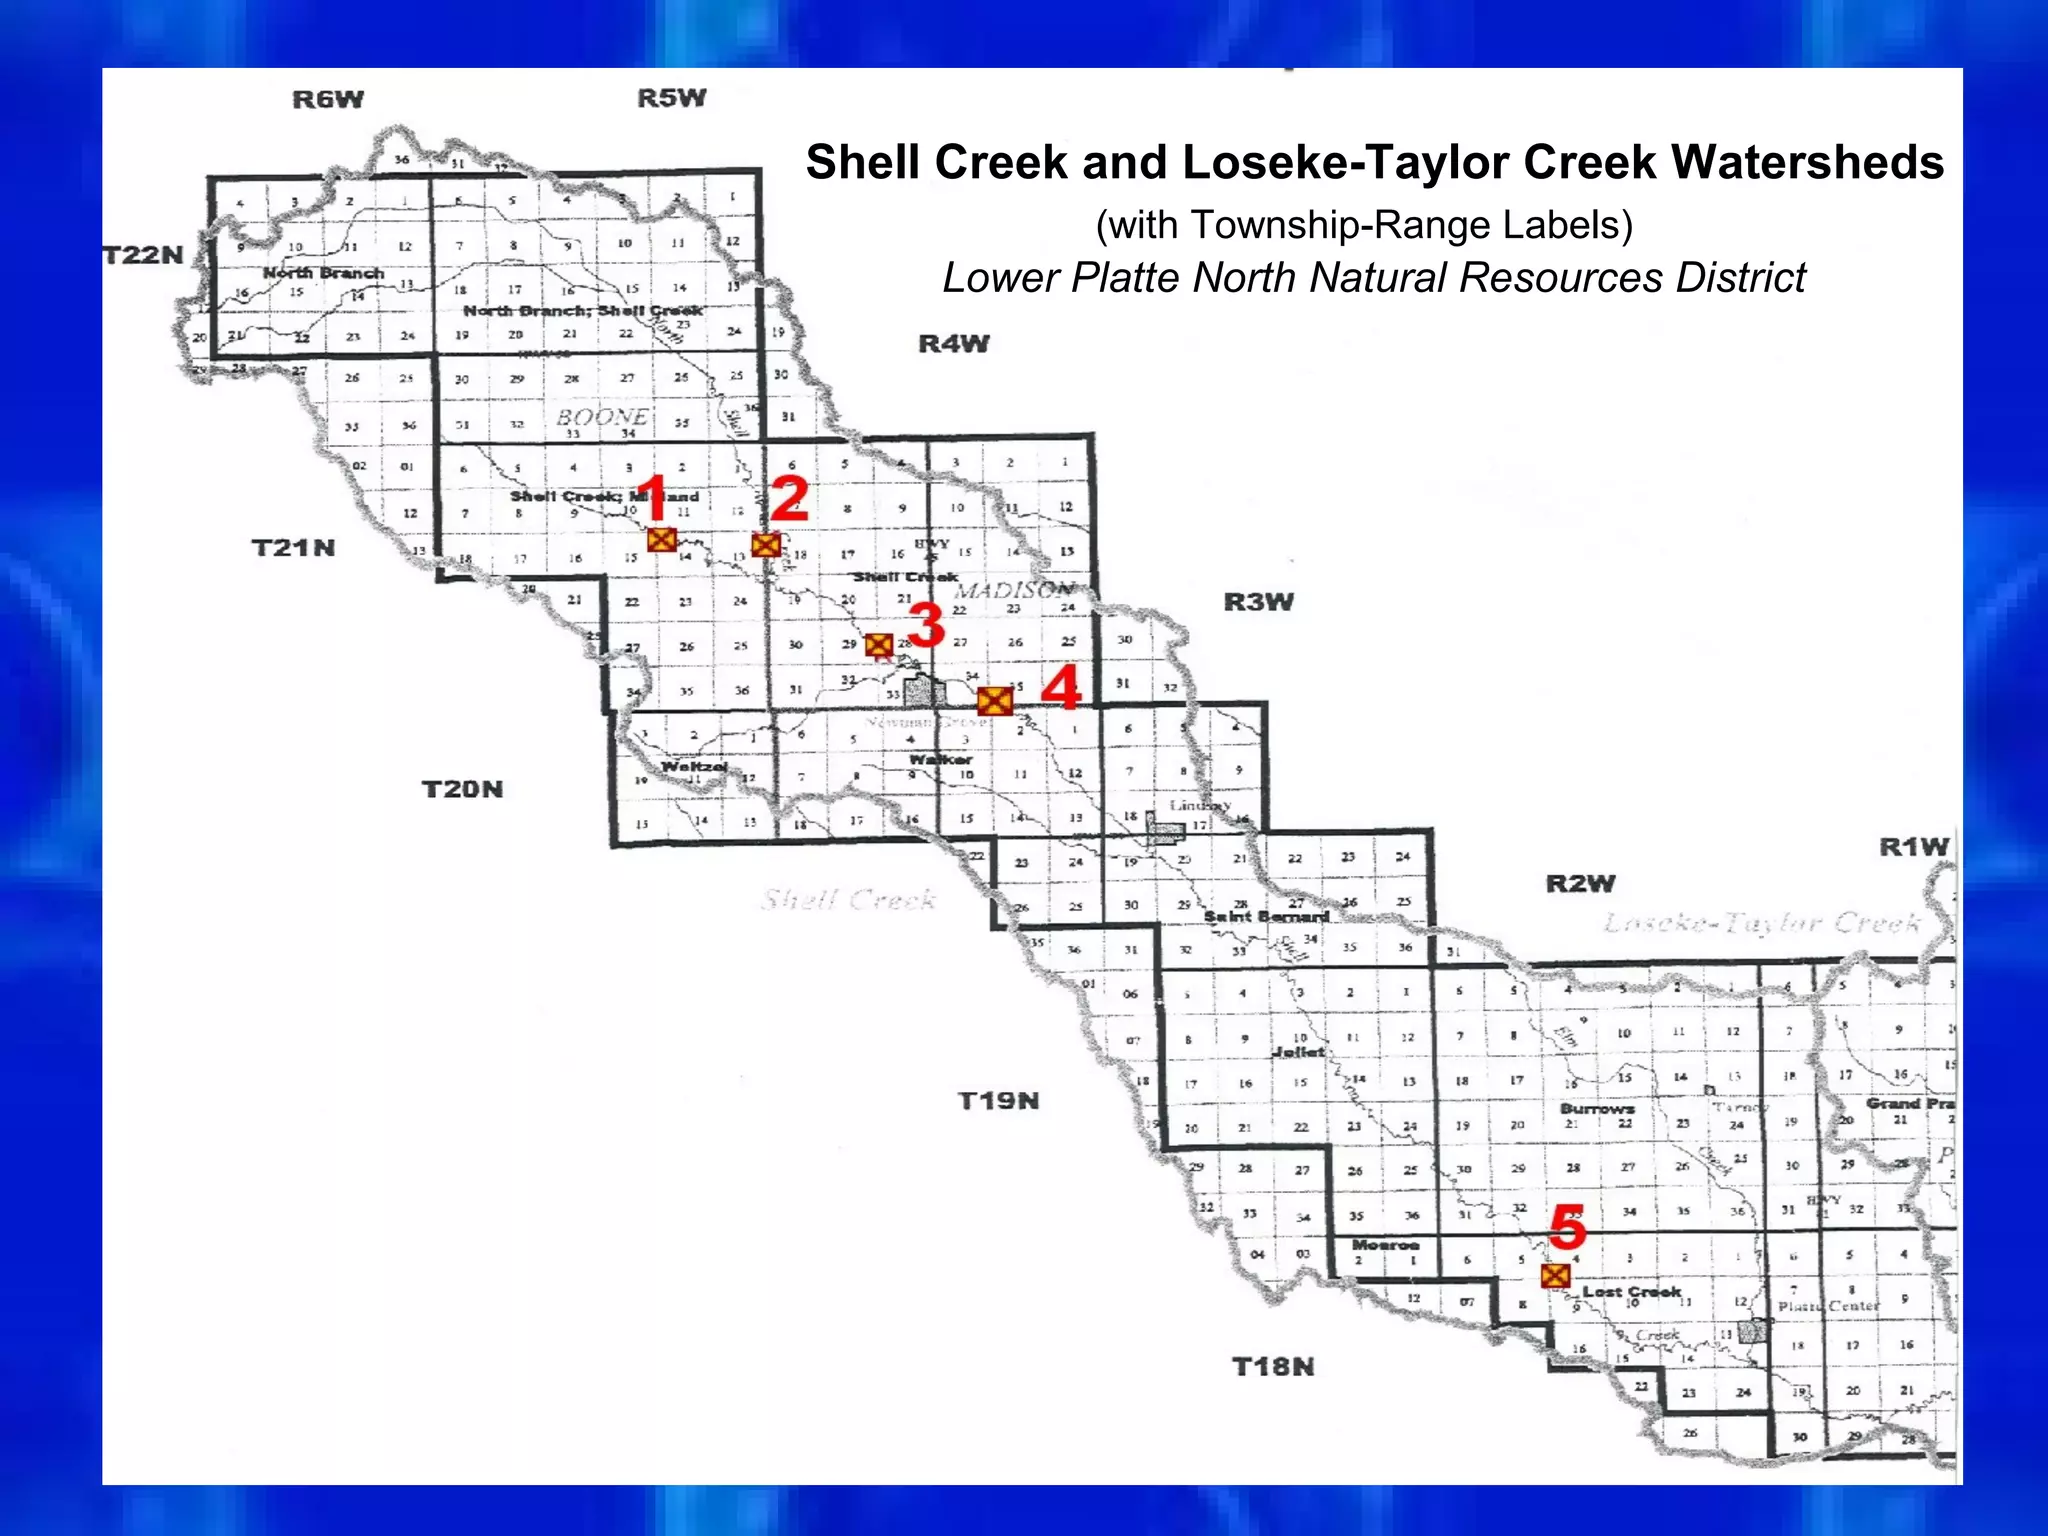
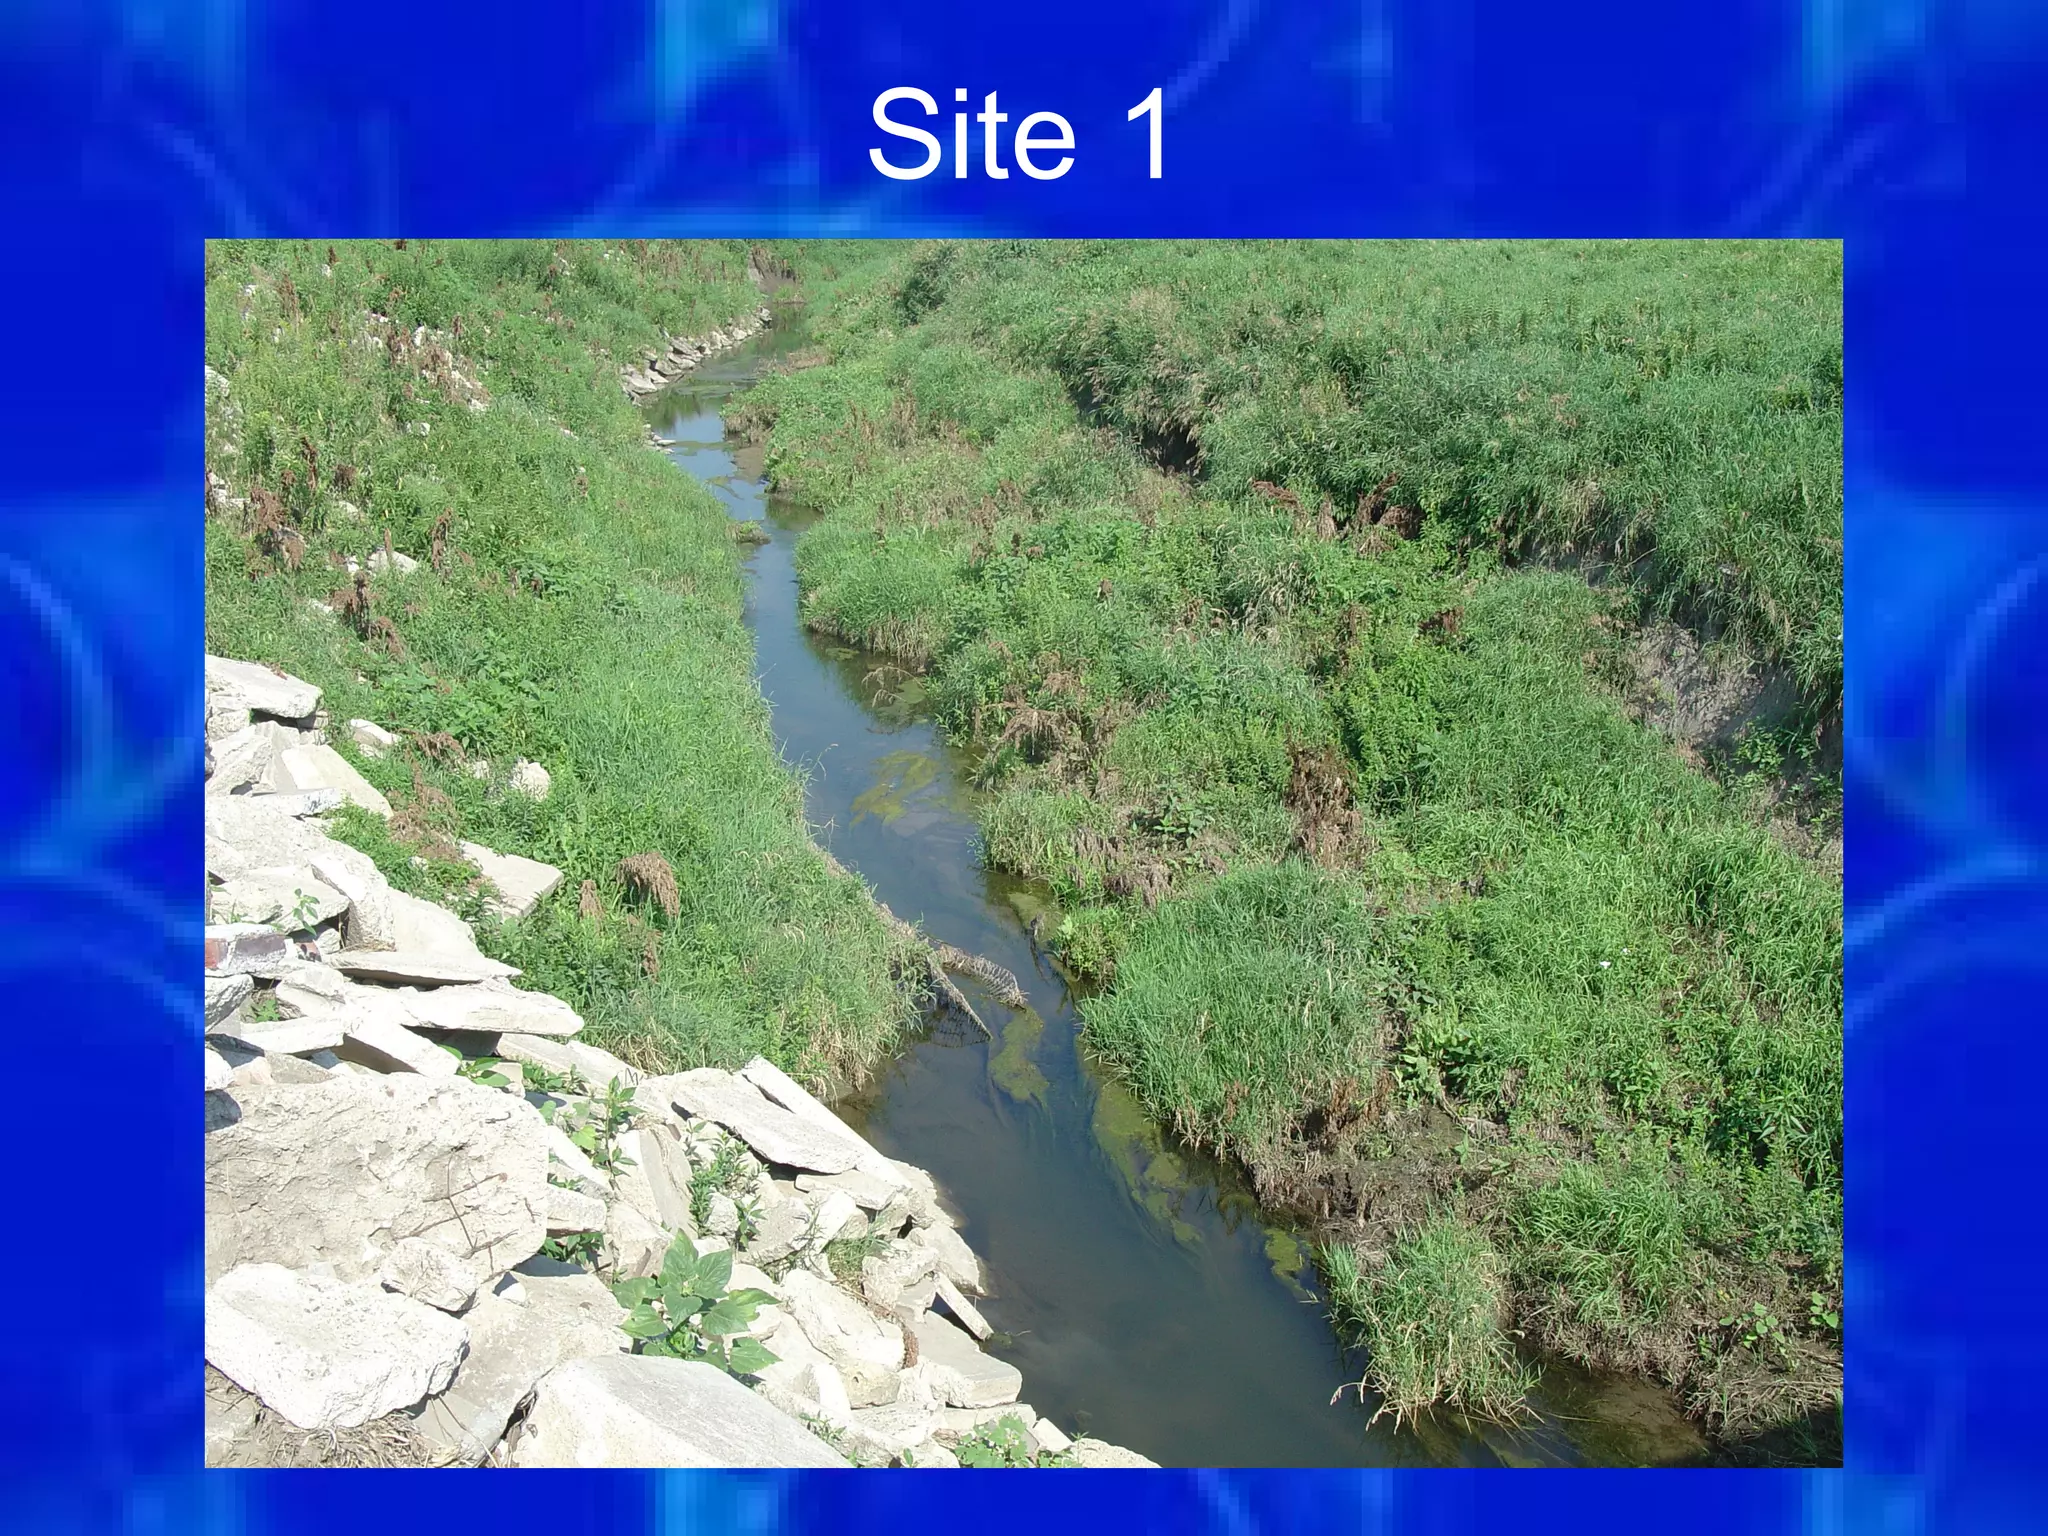
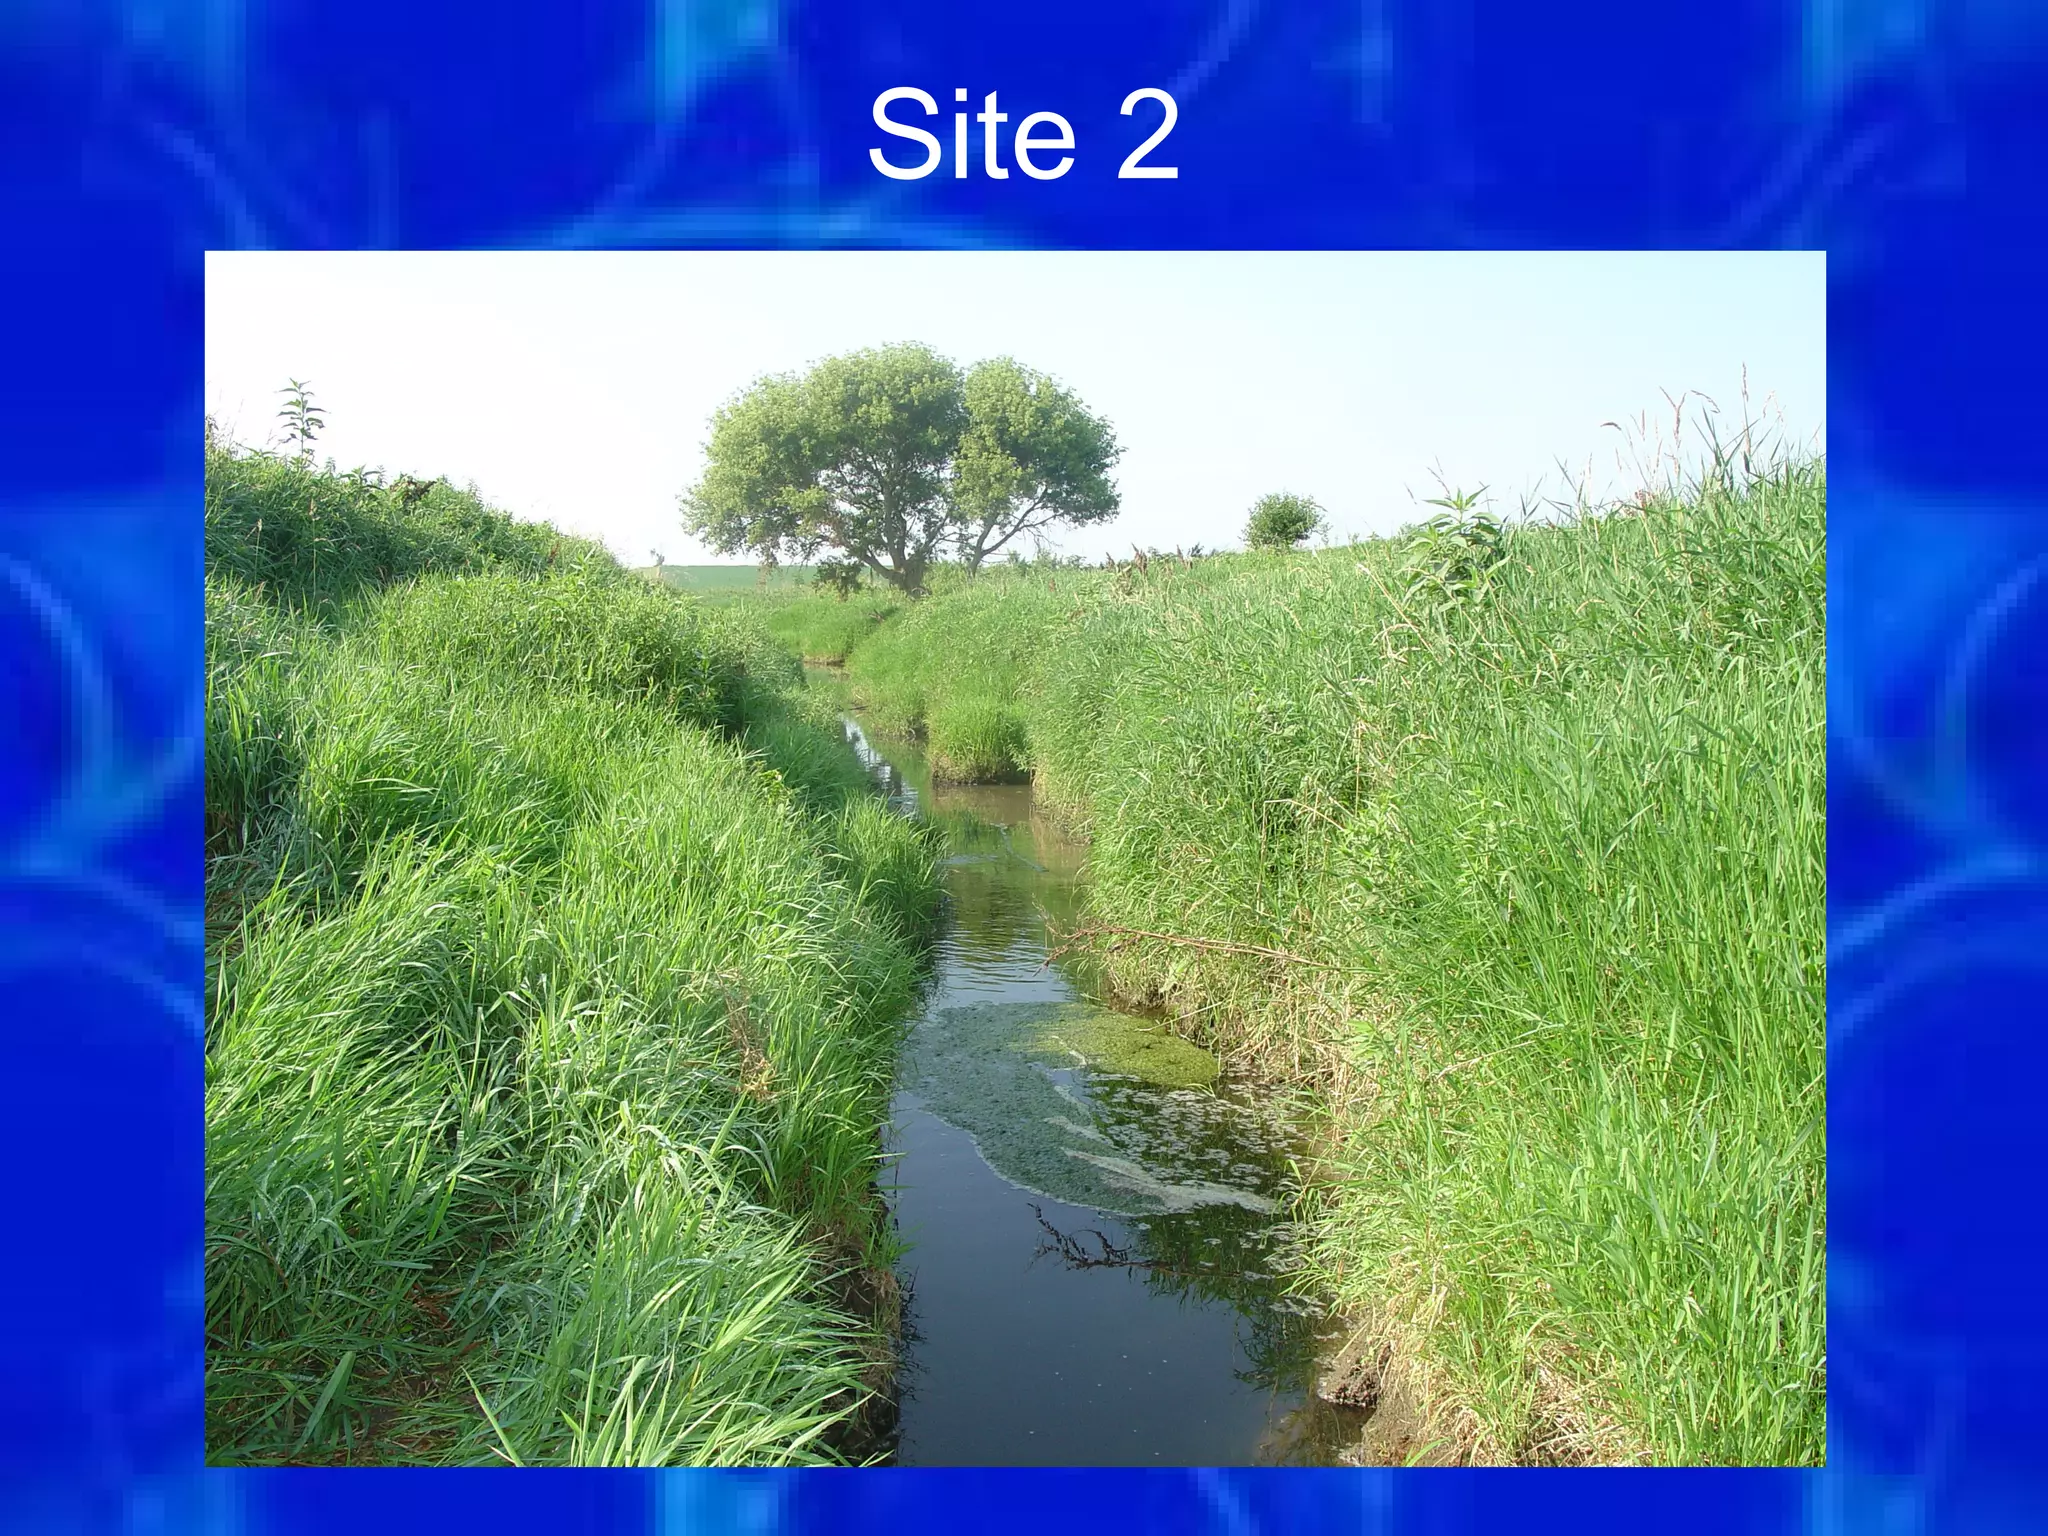
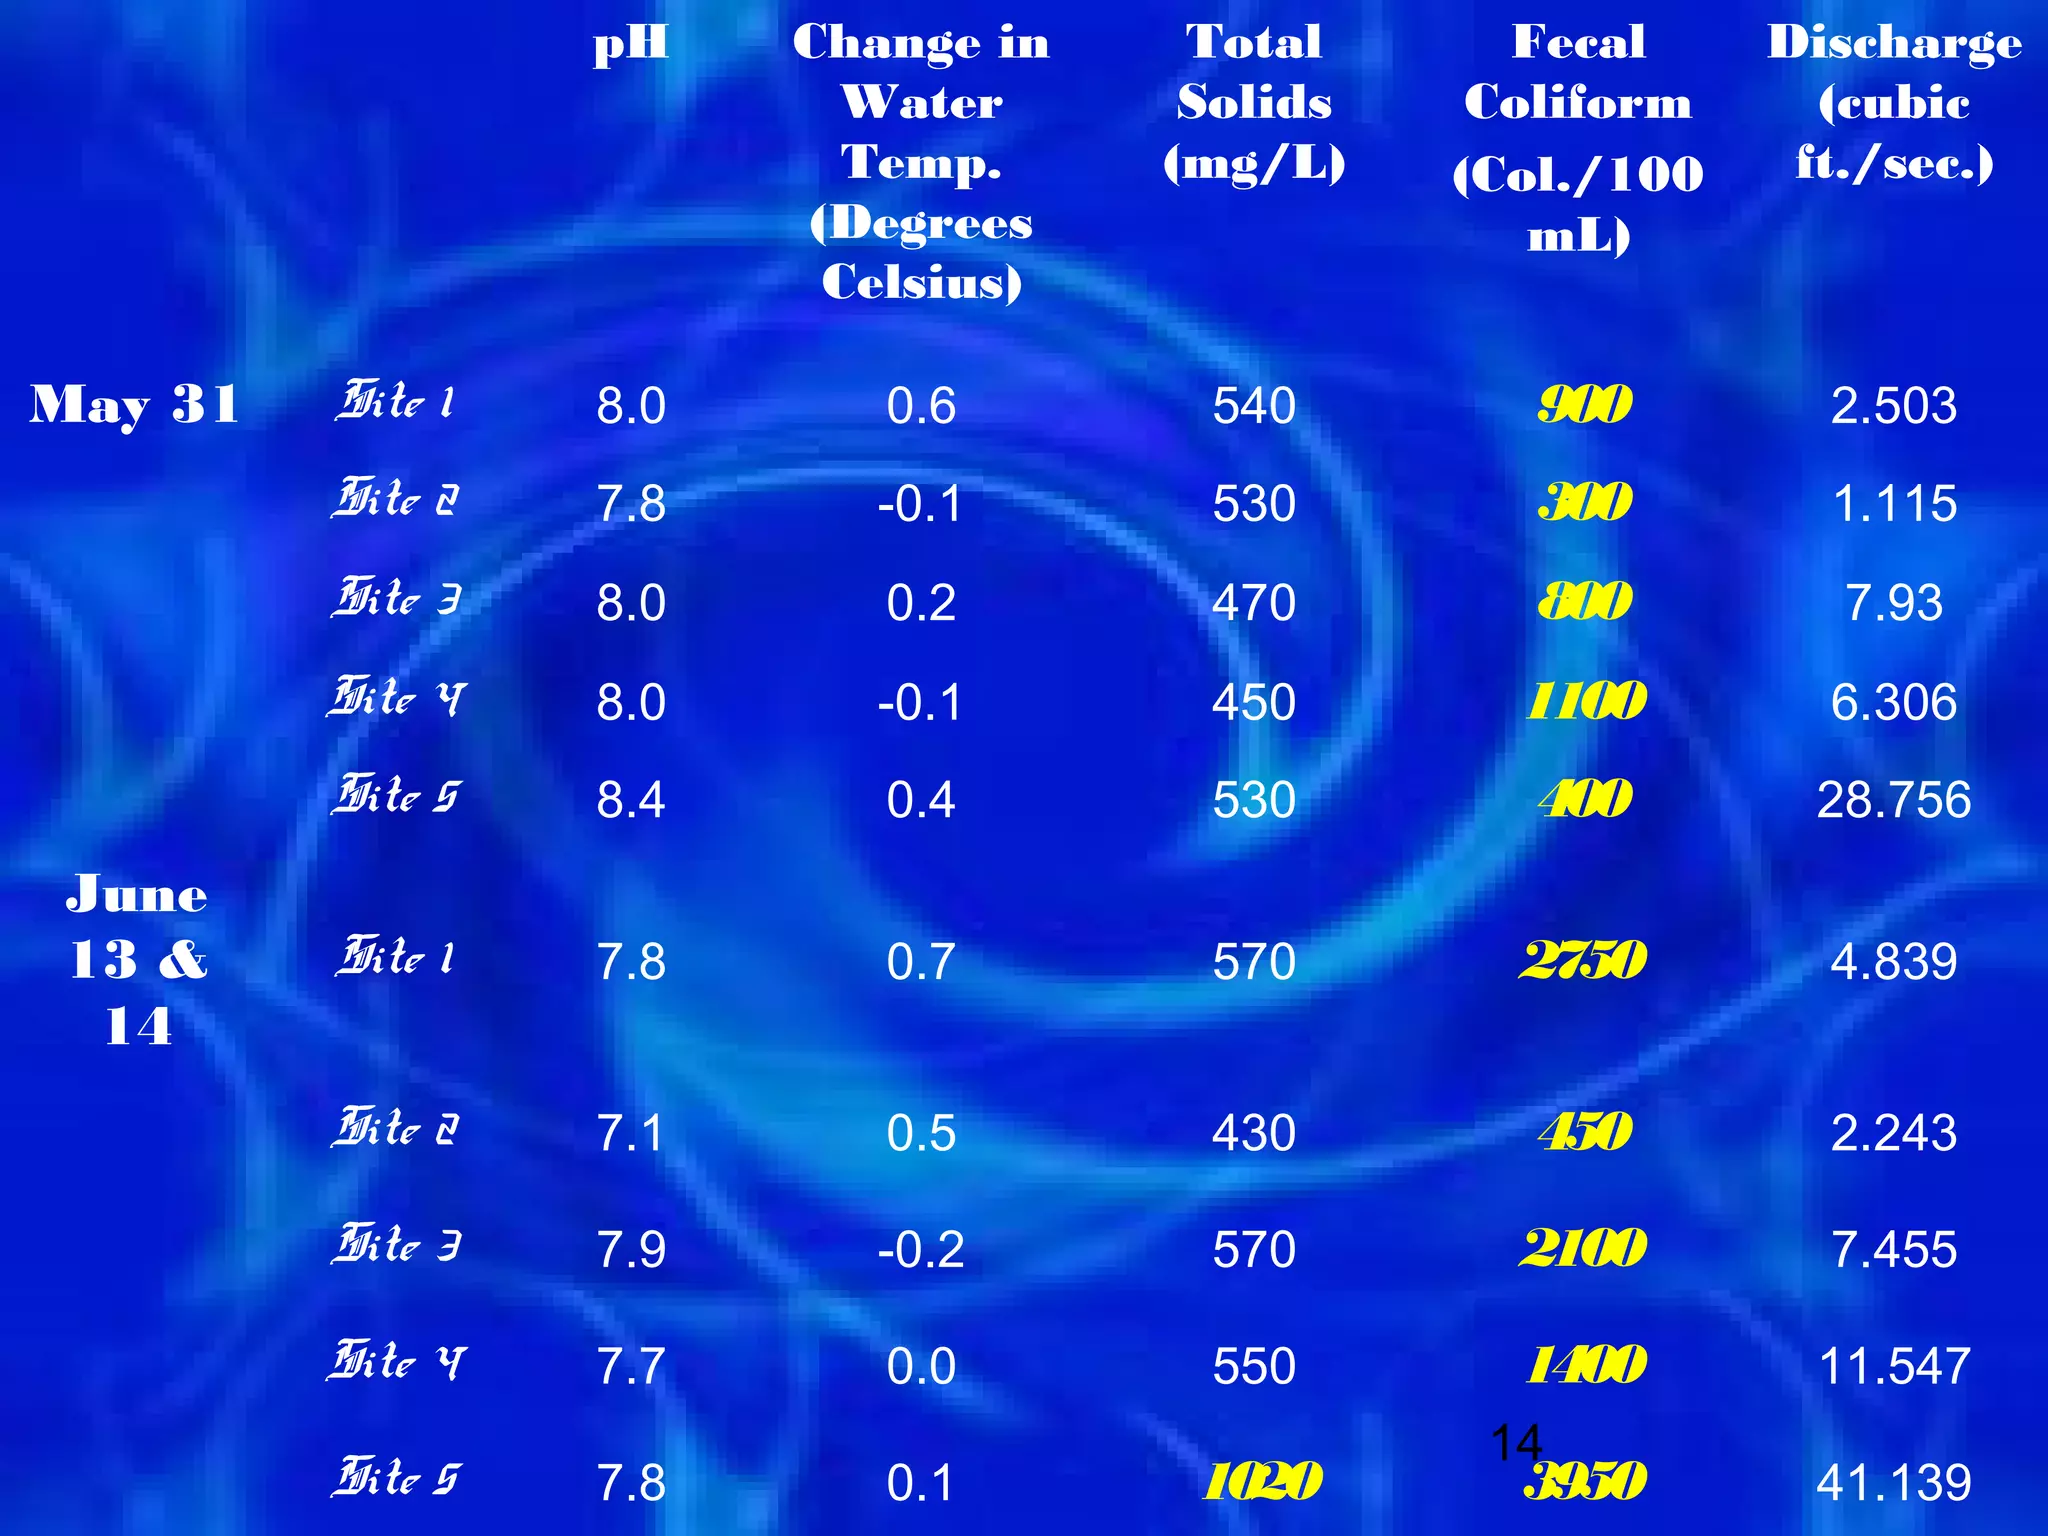
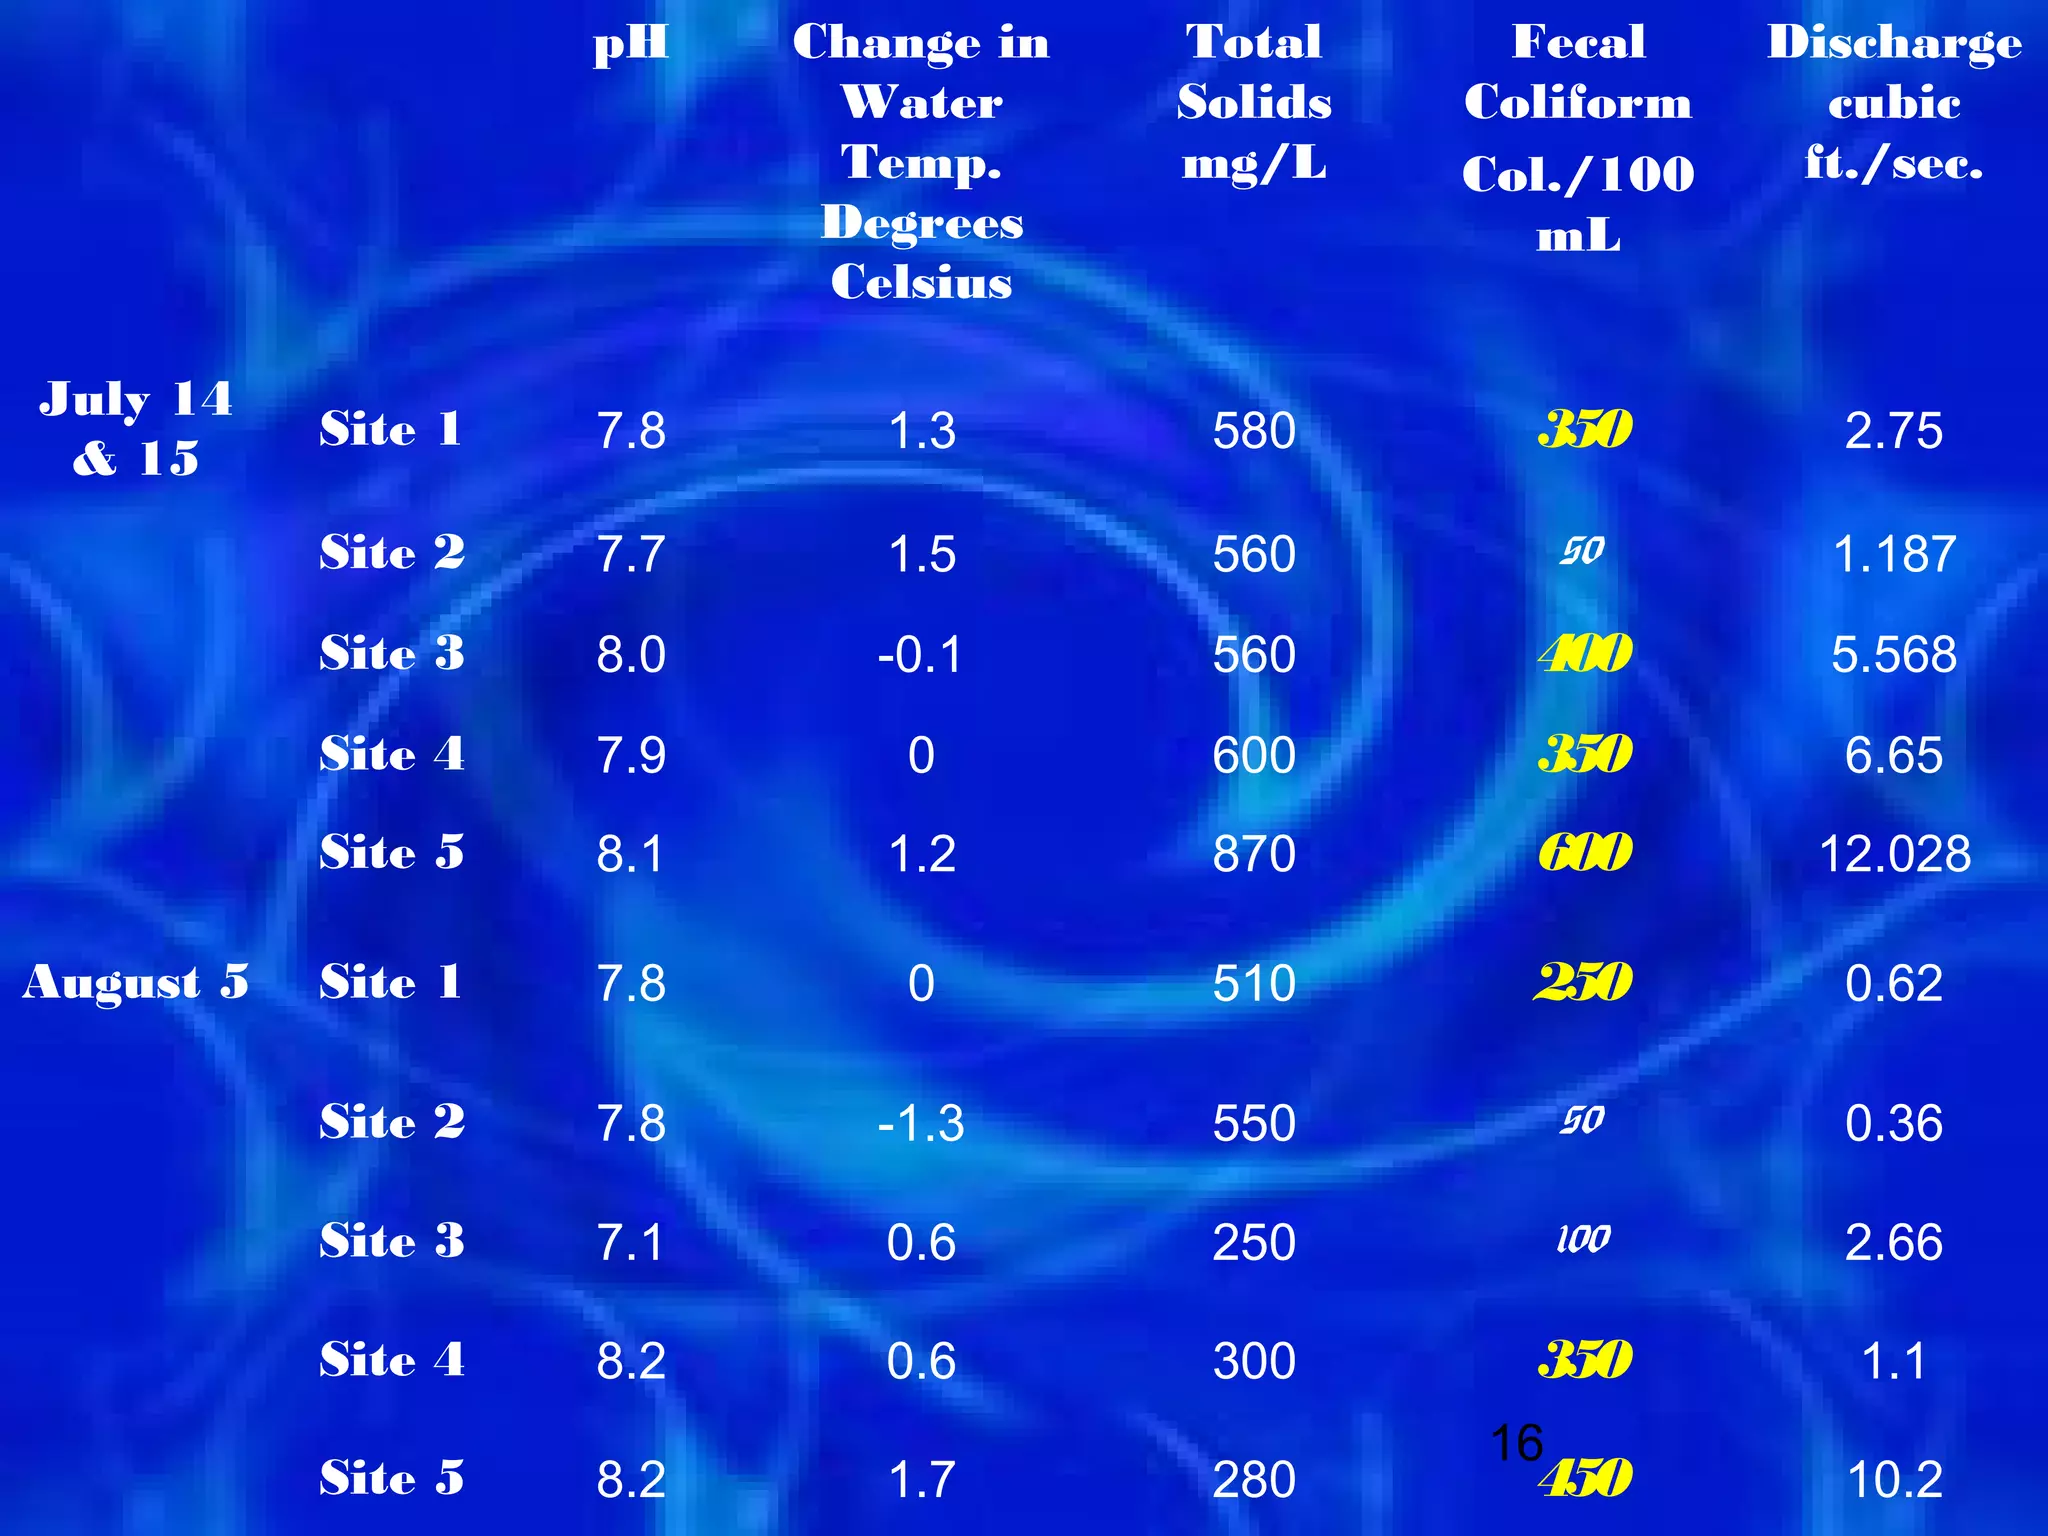
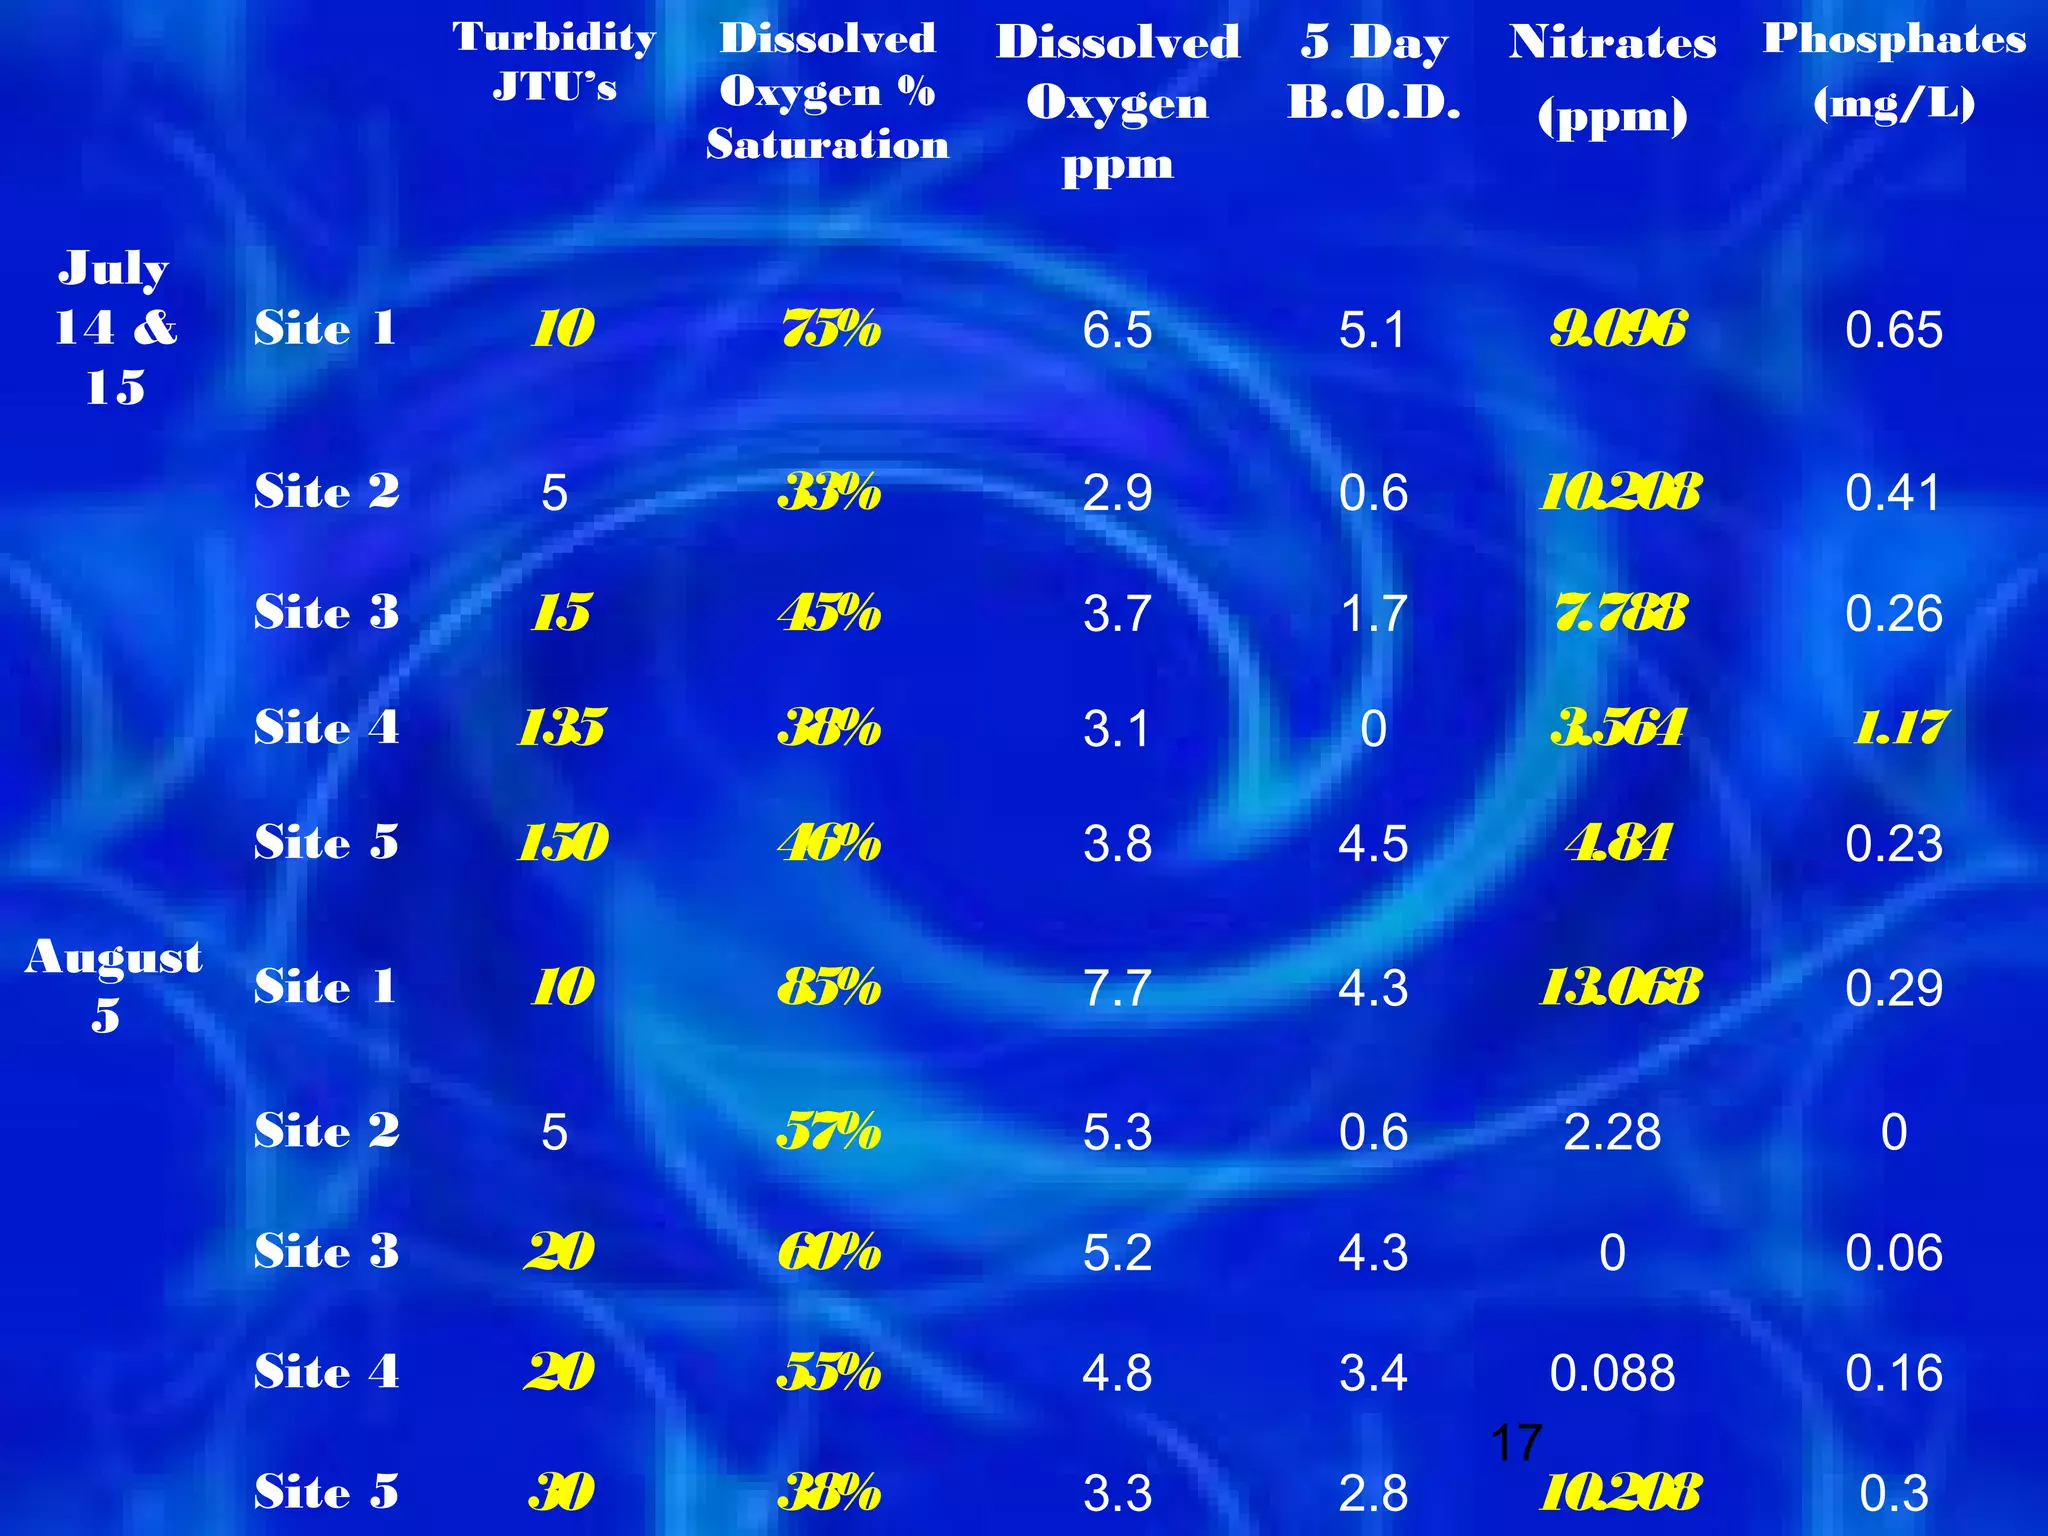
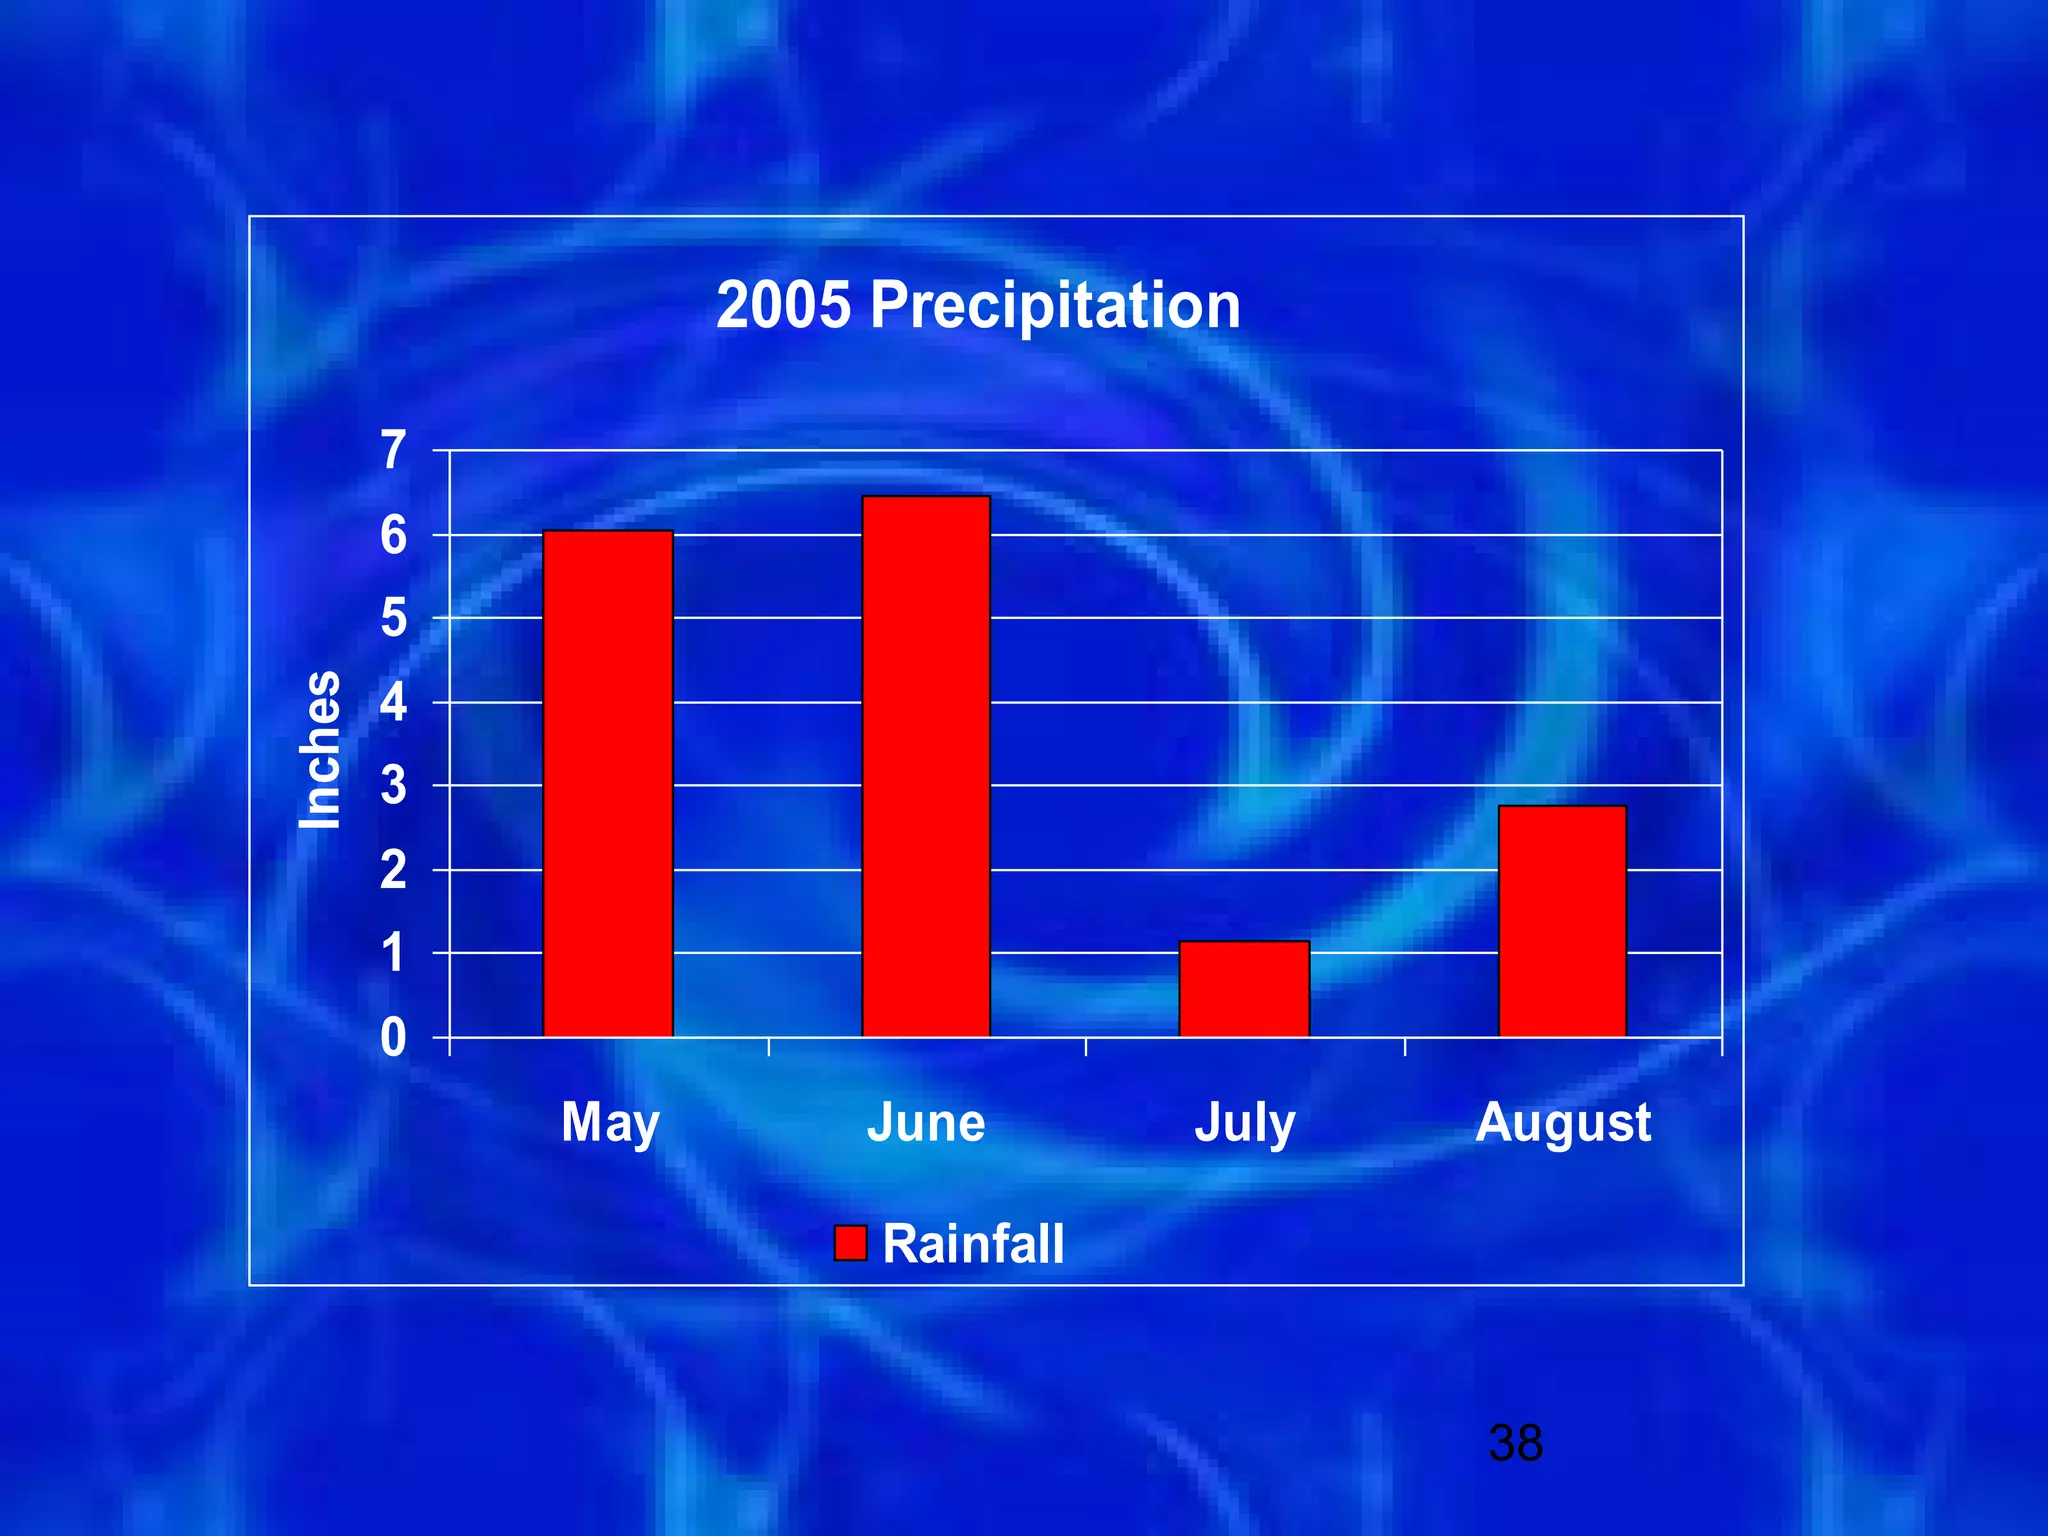
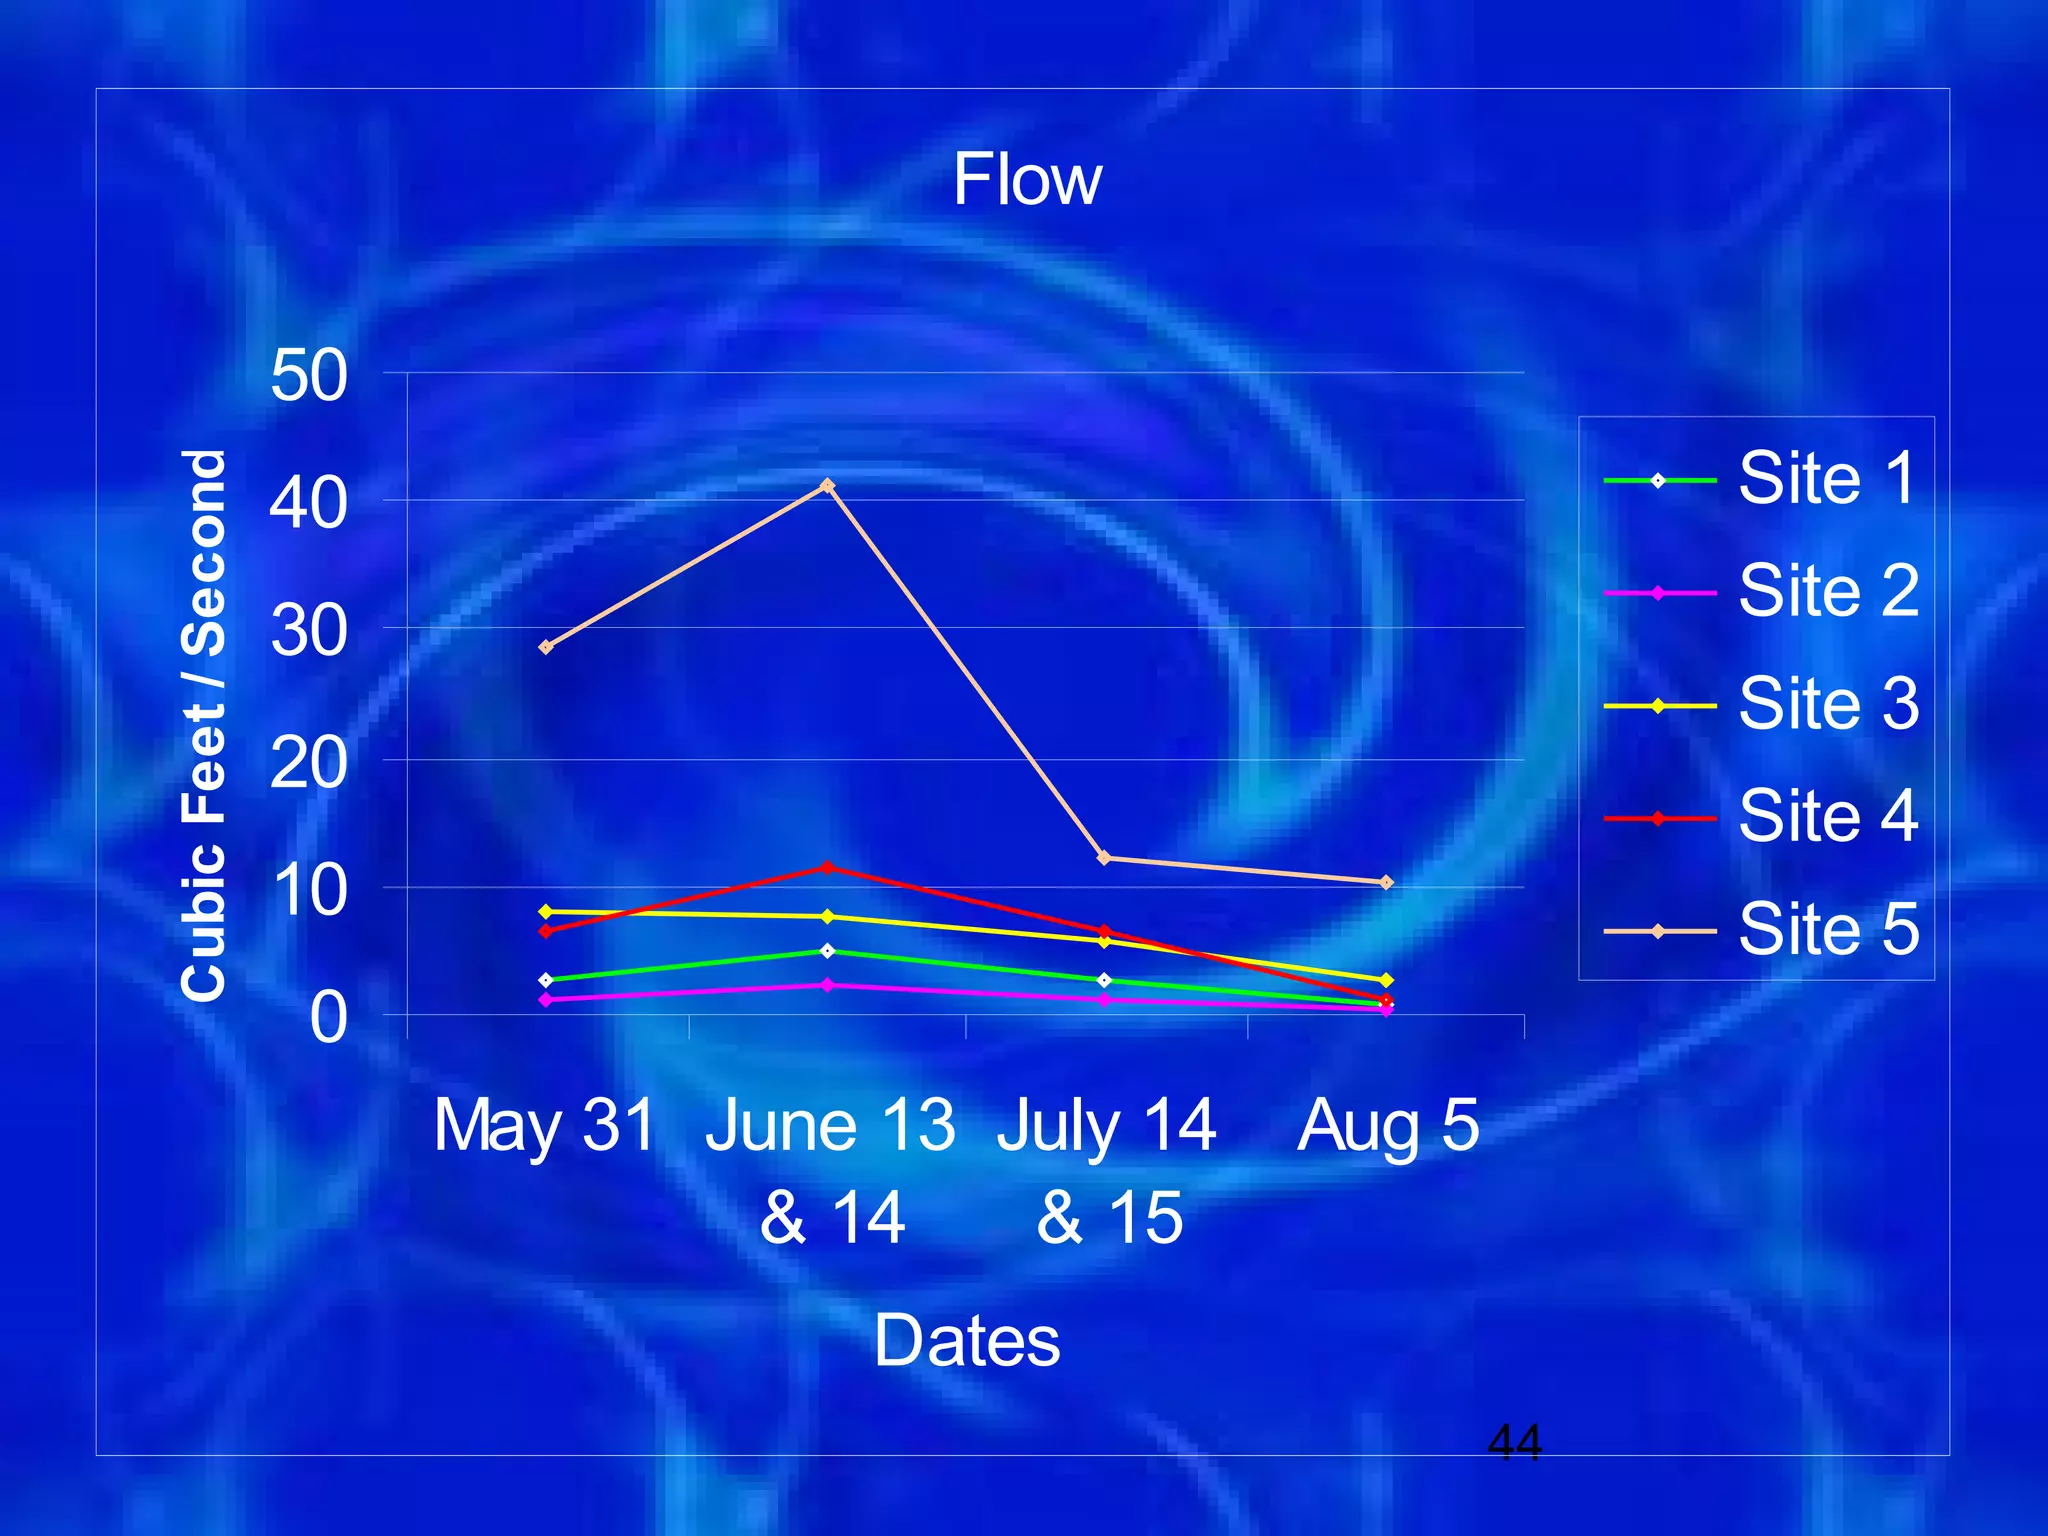
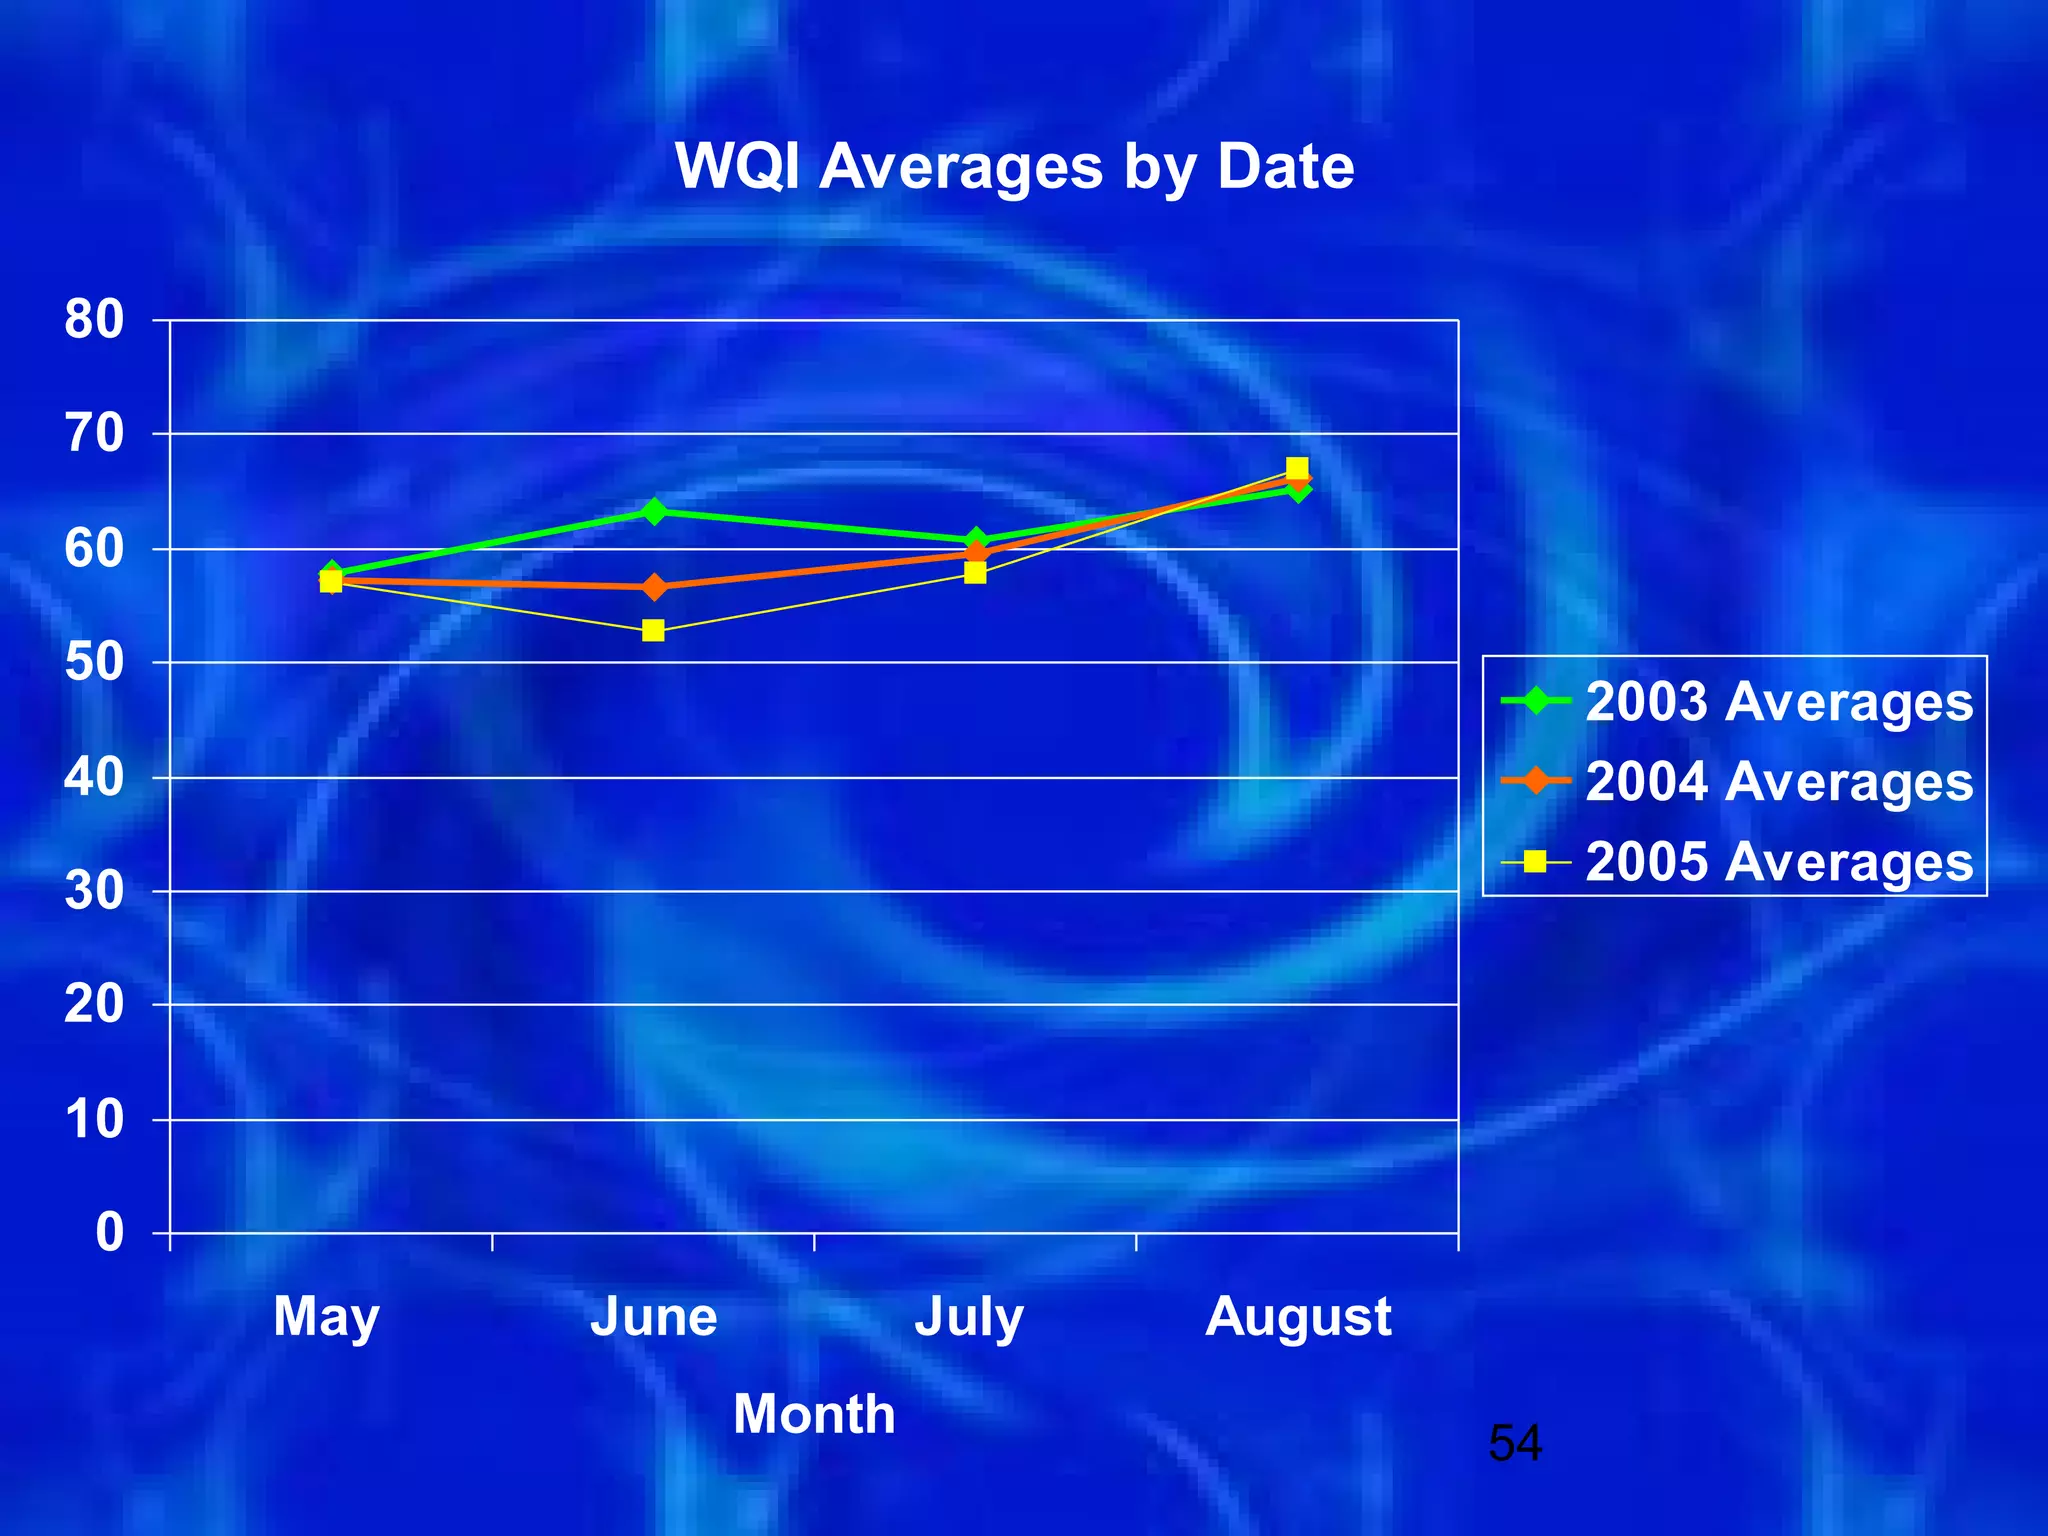
- Sampled 5 sites along Shell Creek in May, June, July, and August to test water quality.
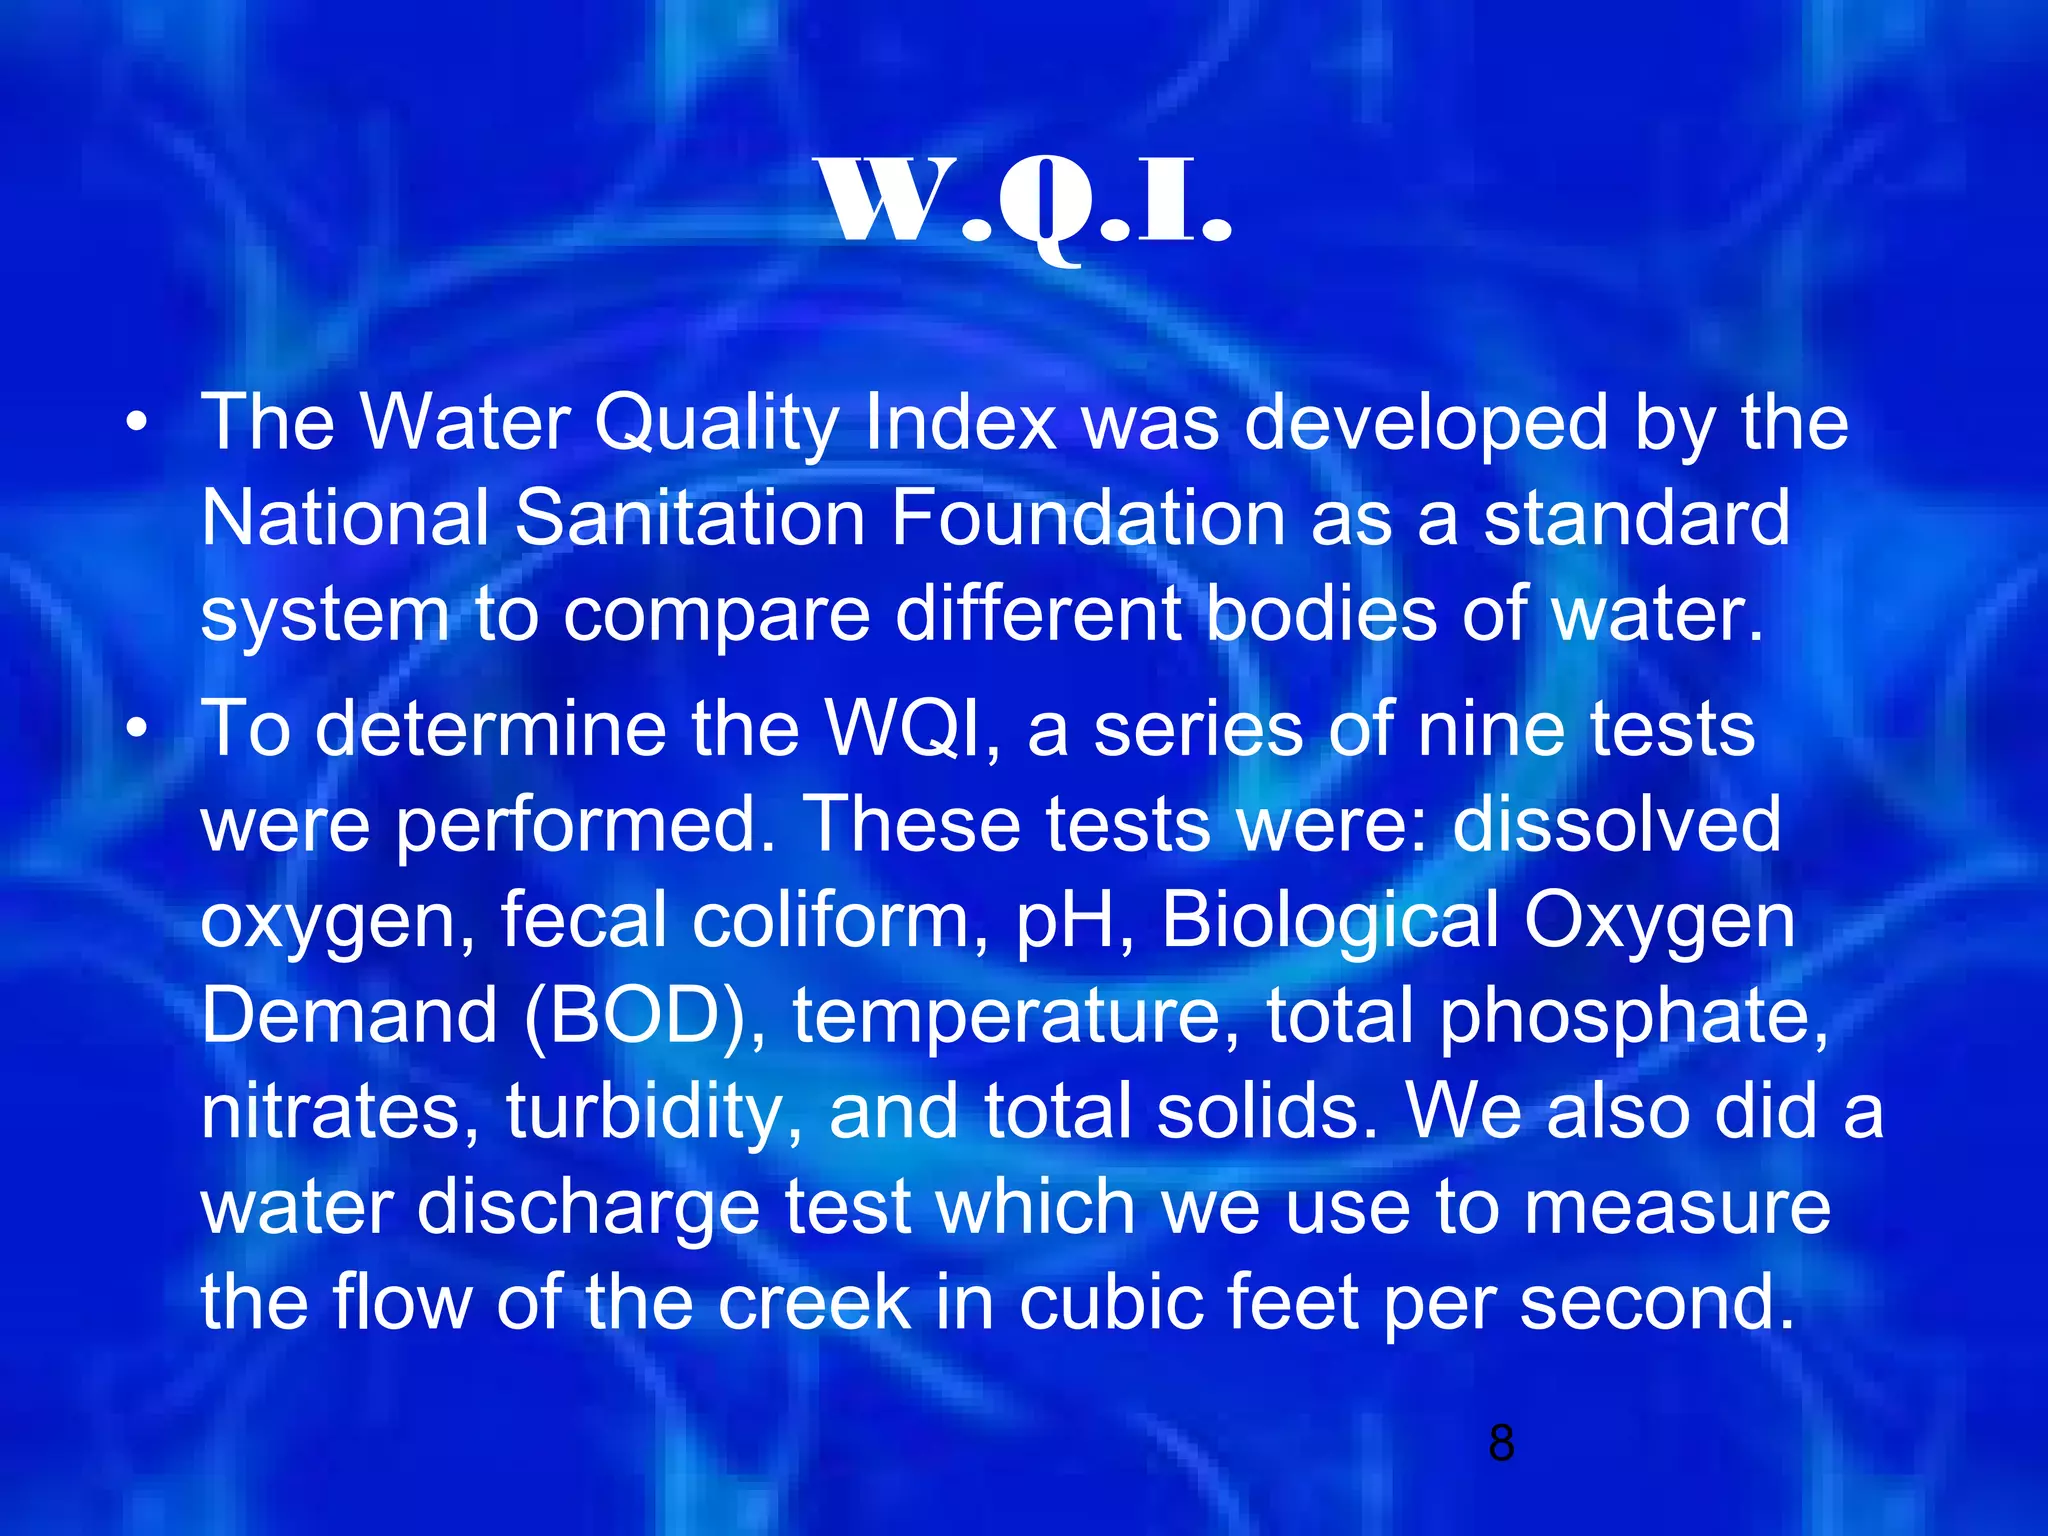
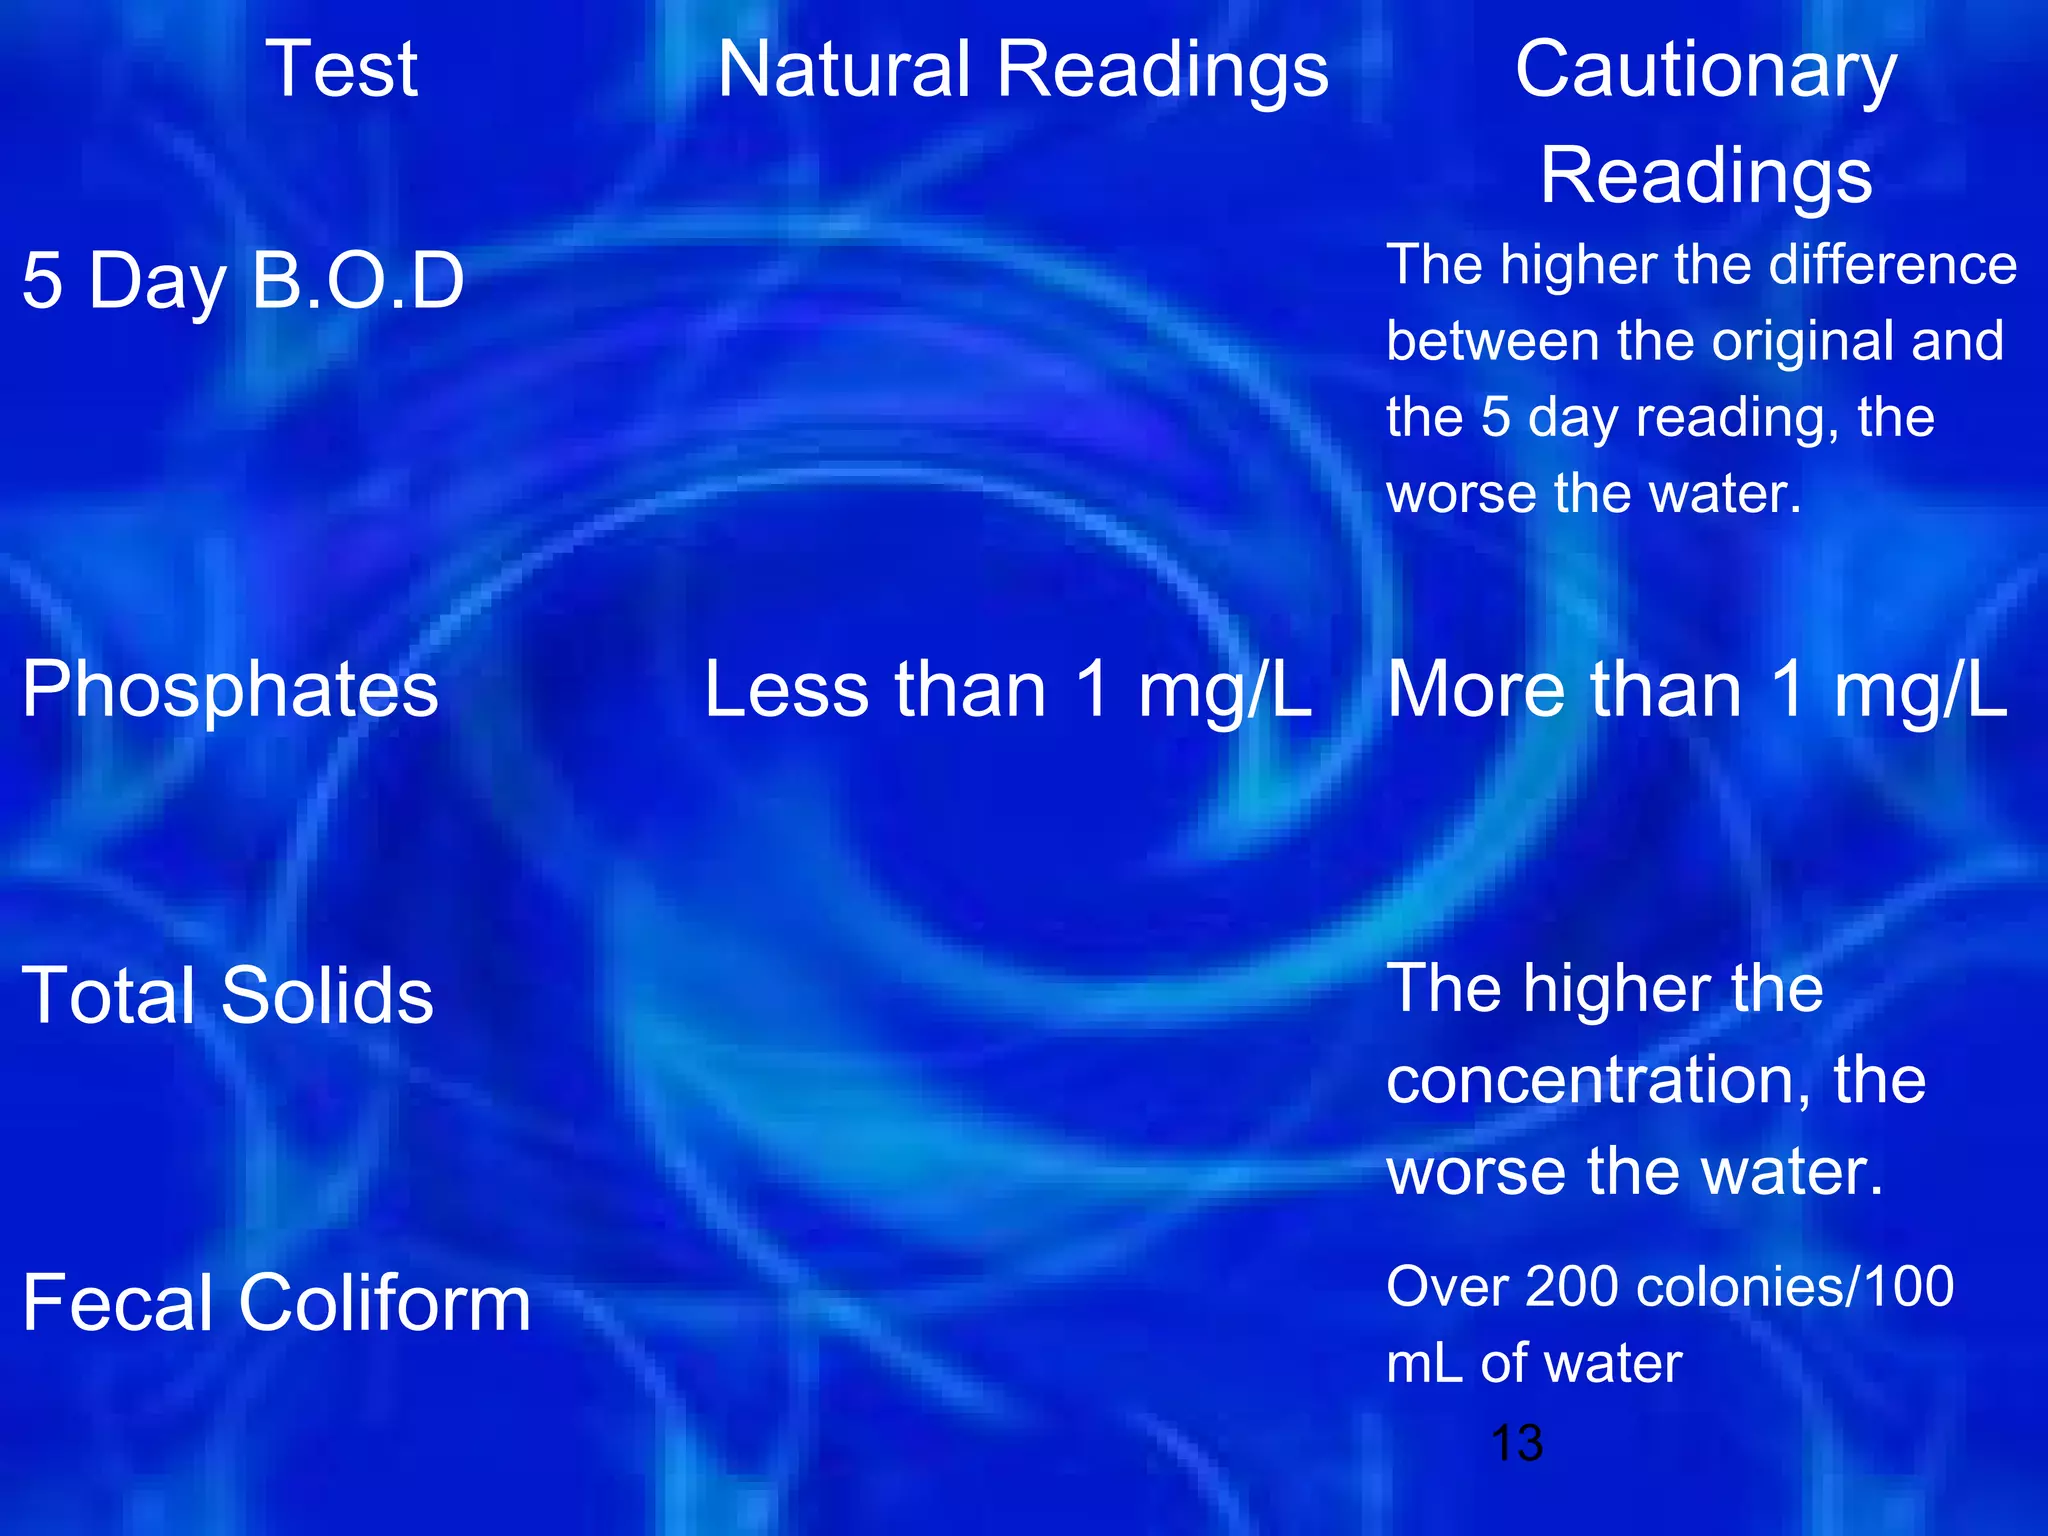
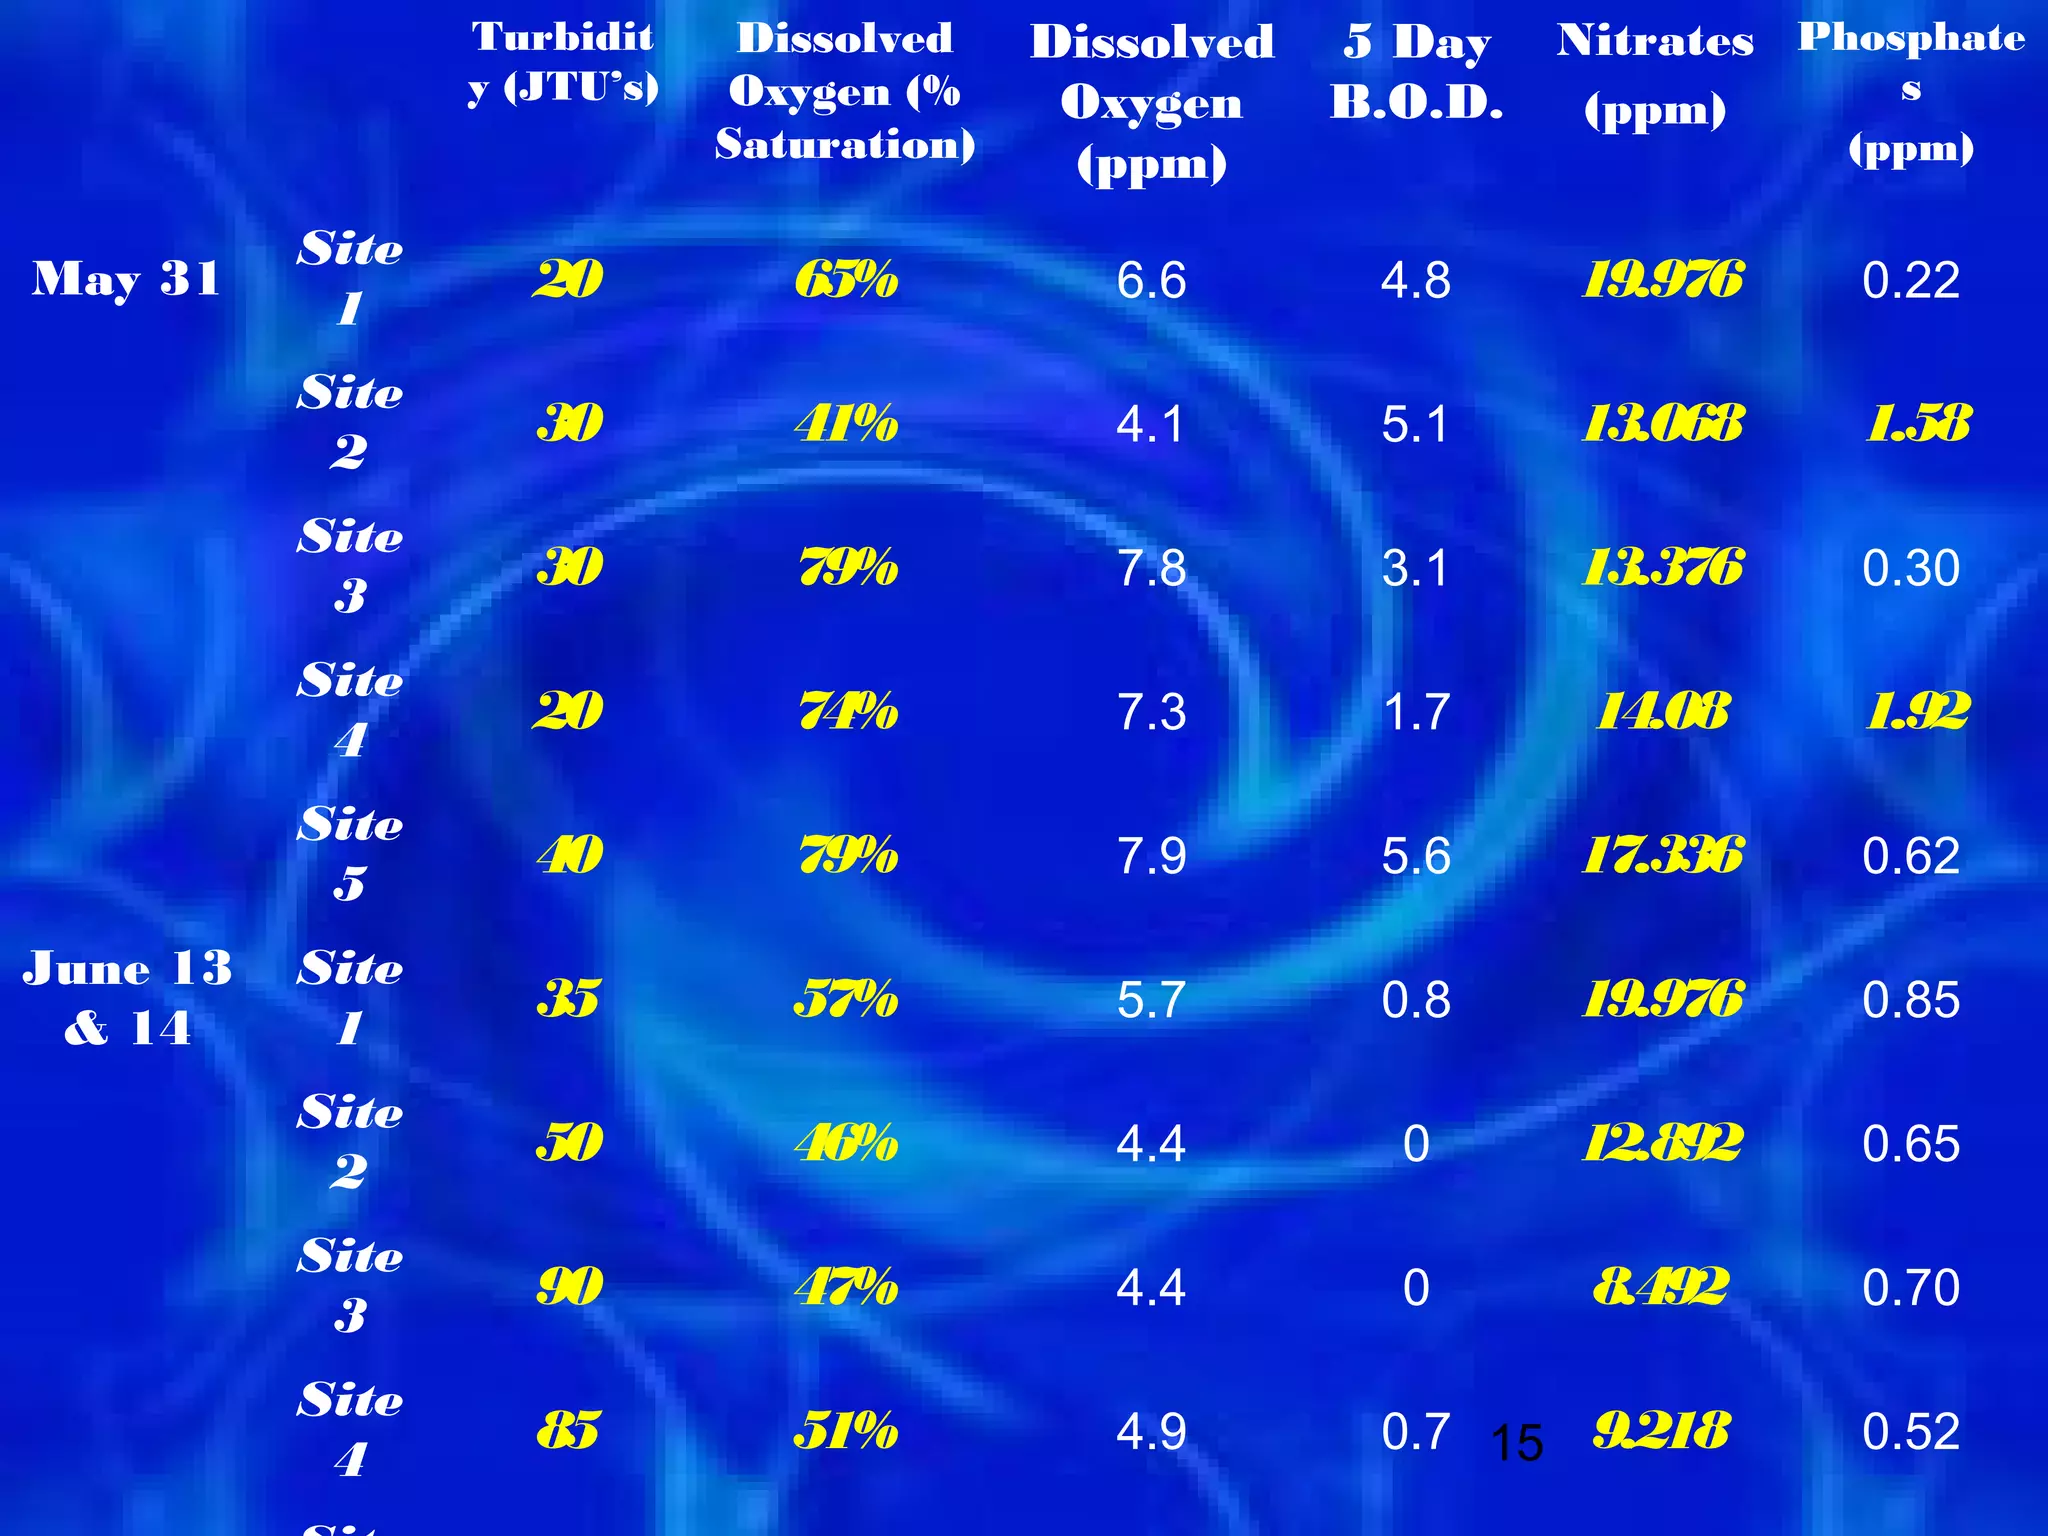
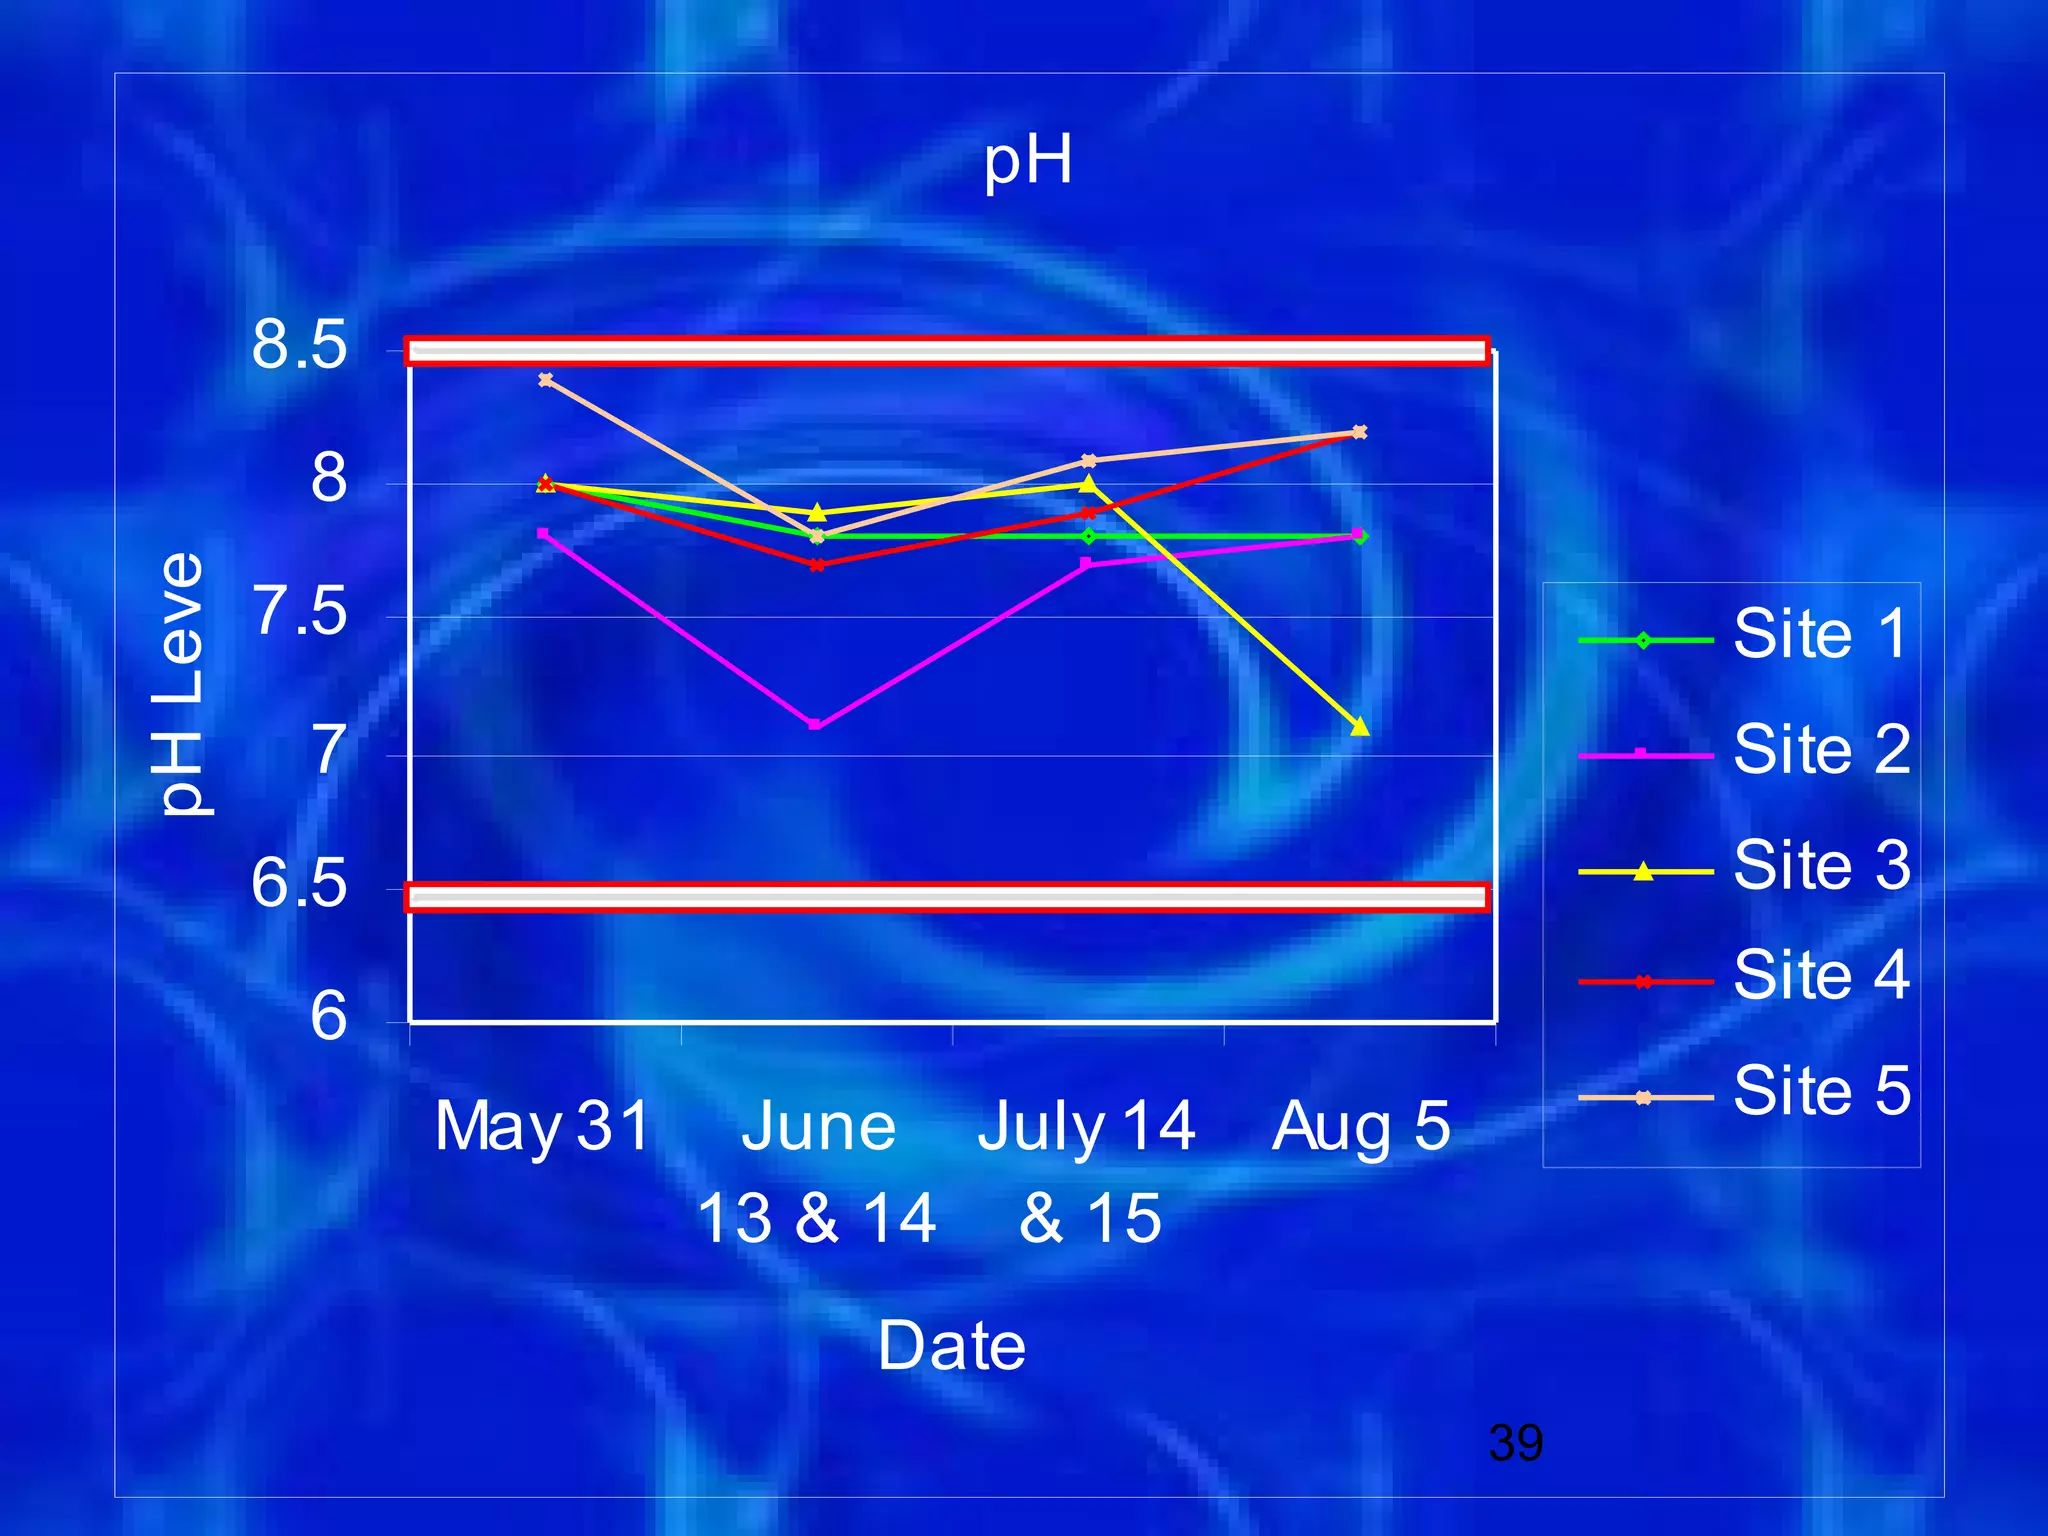
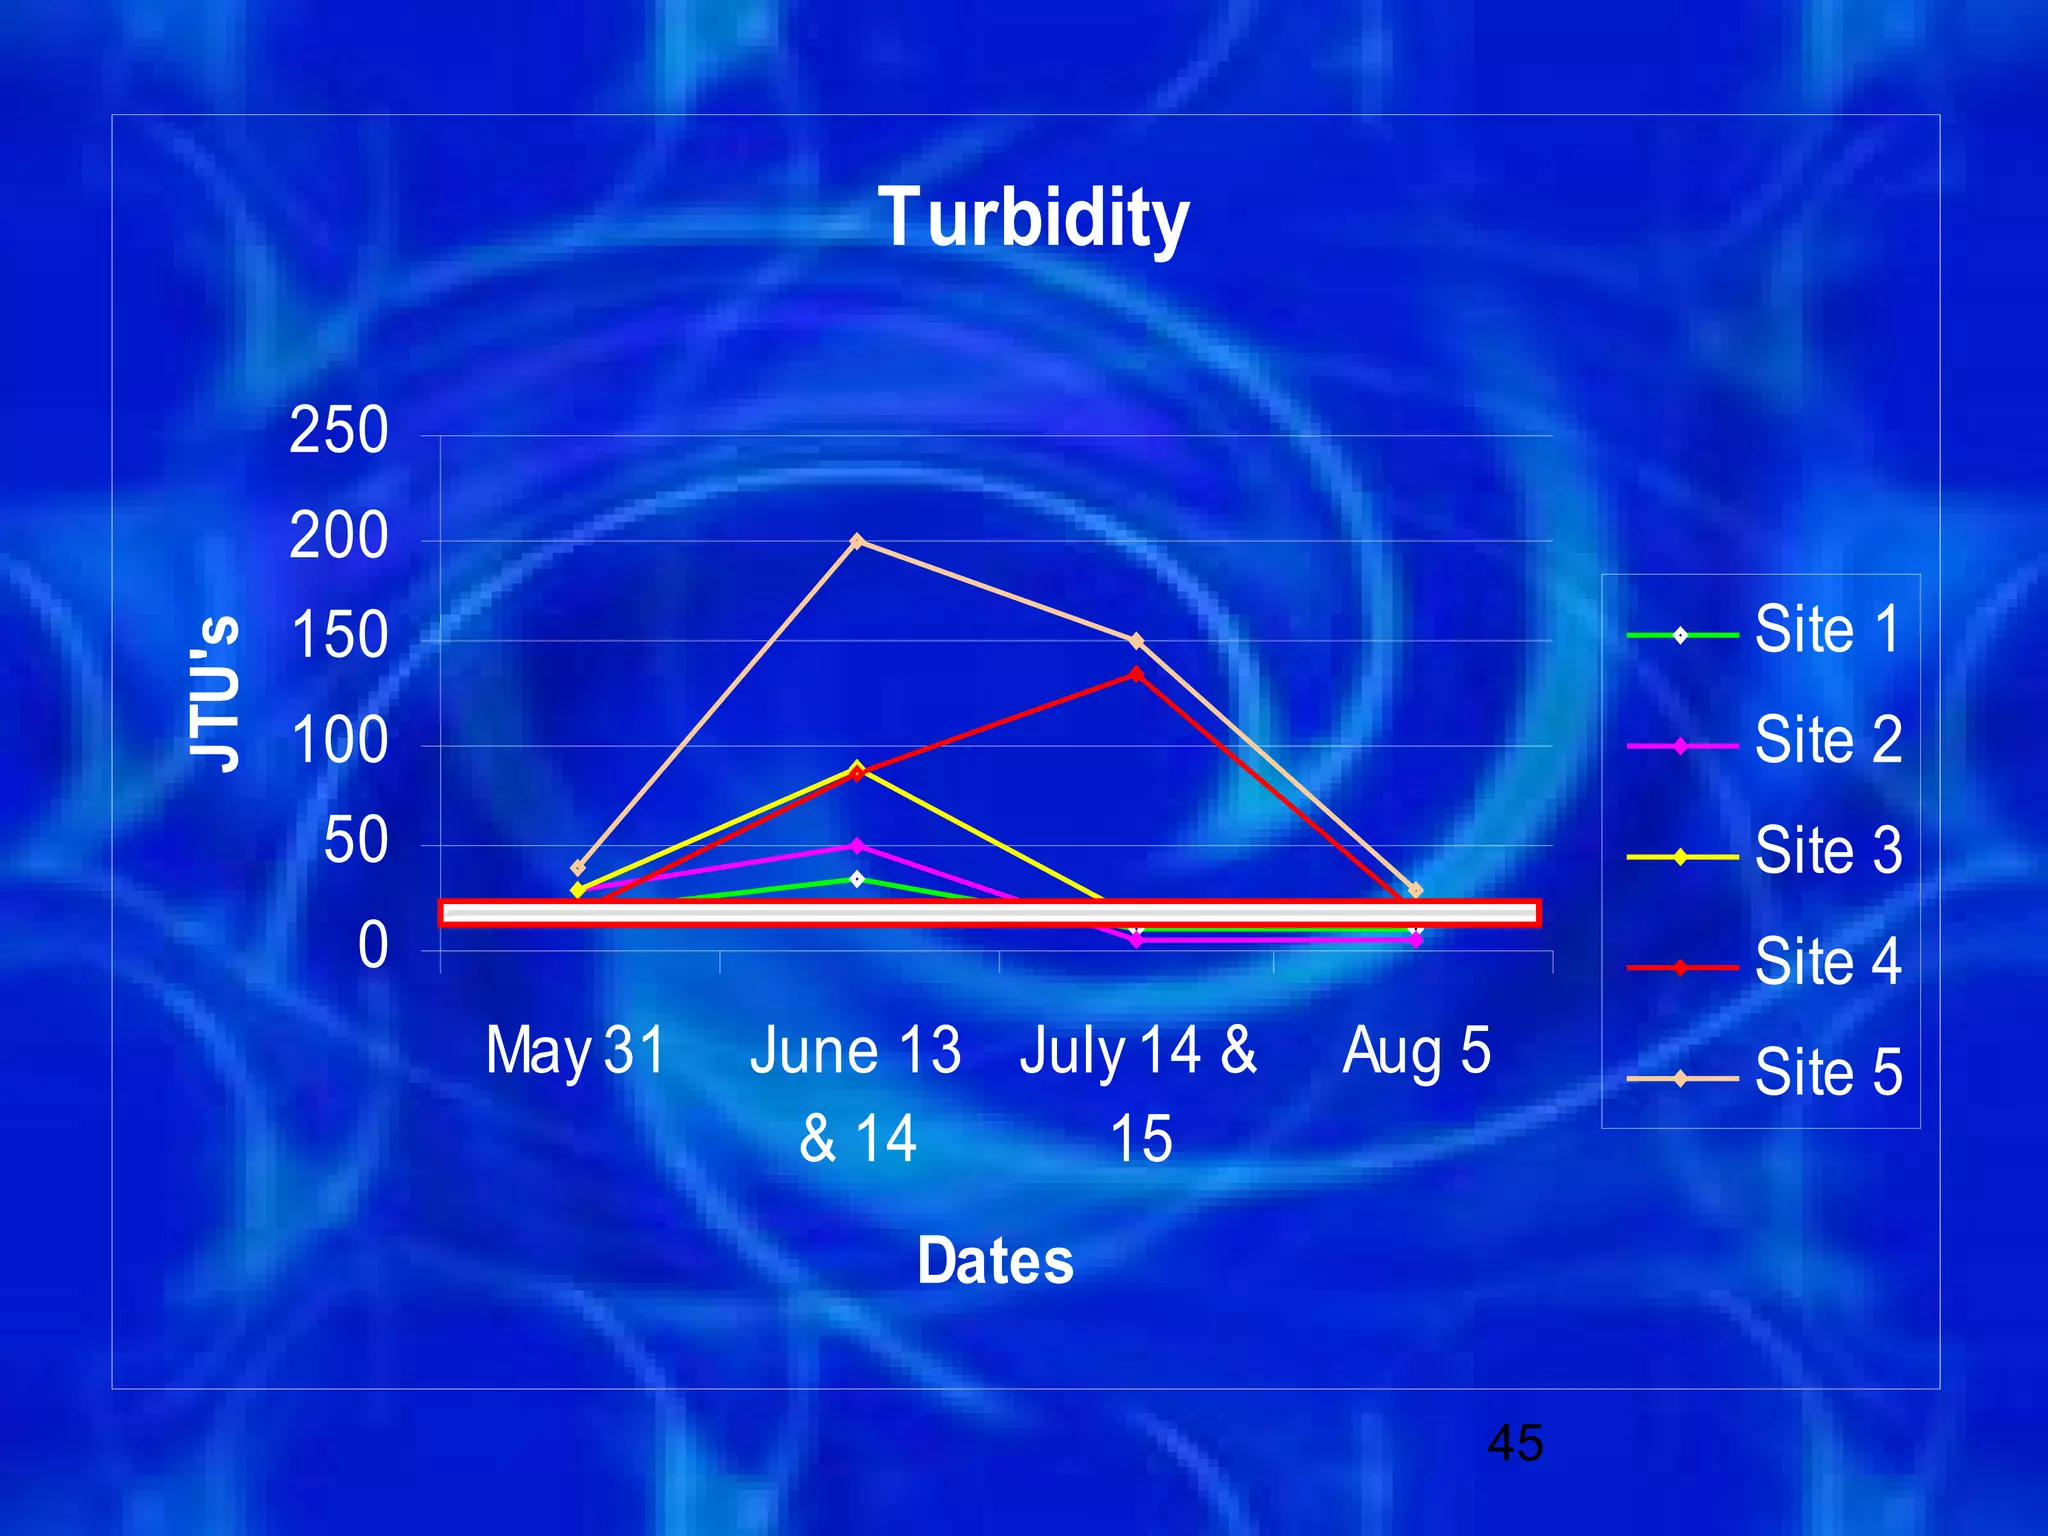
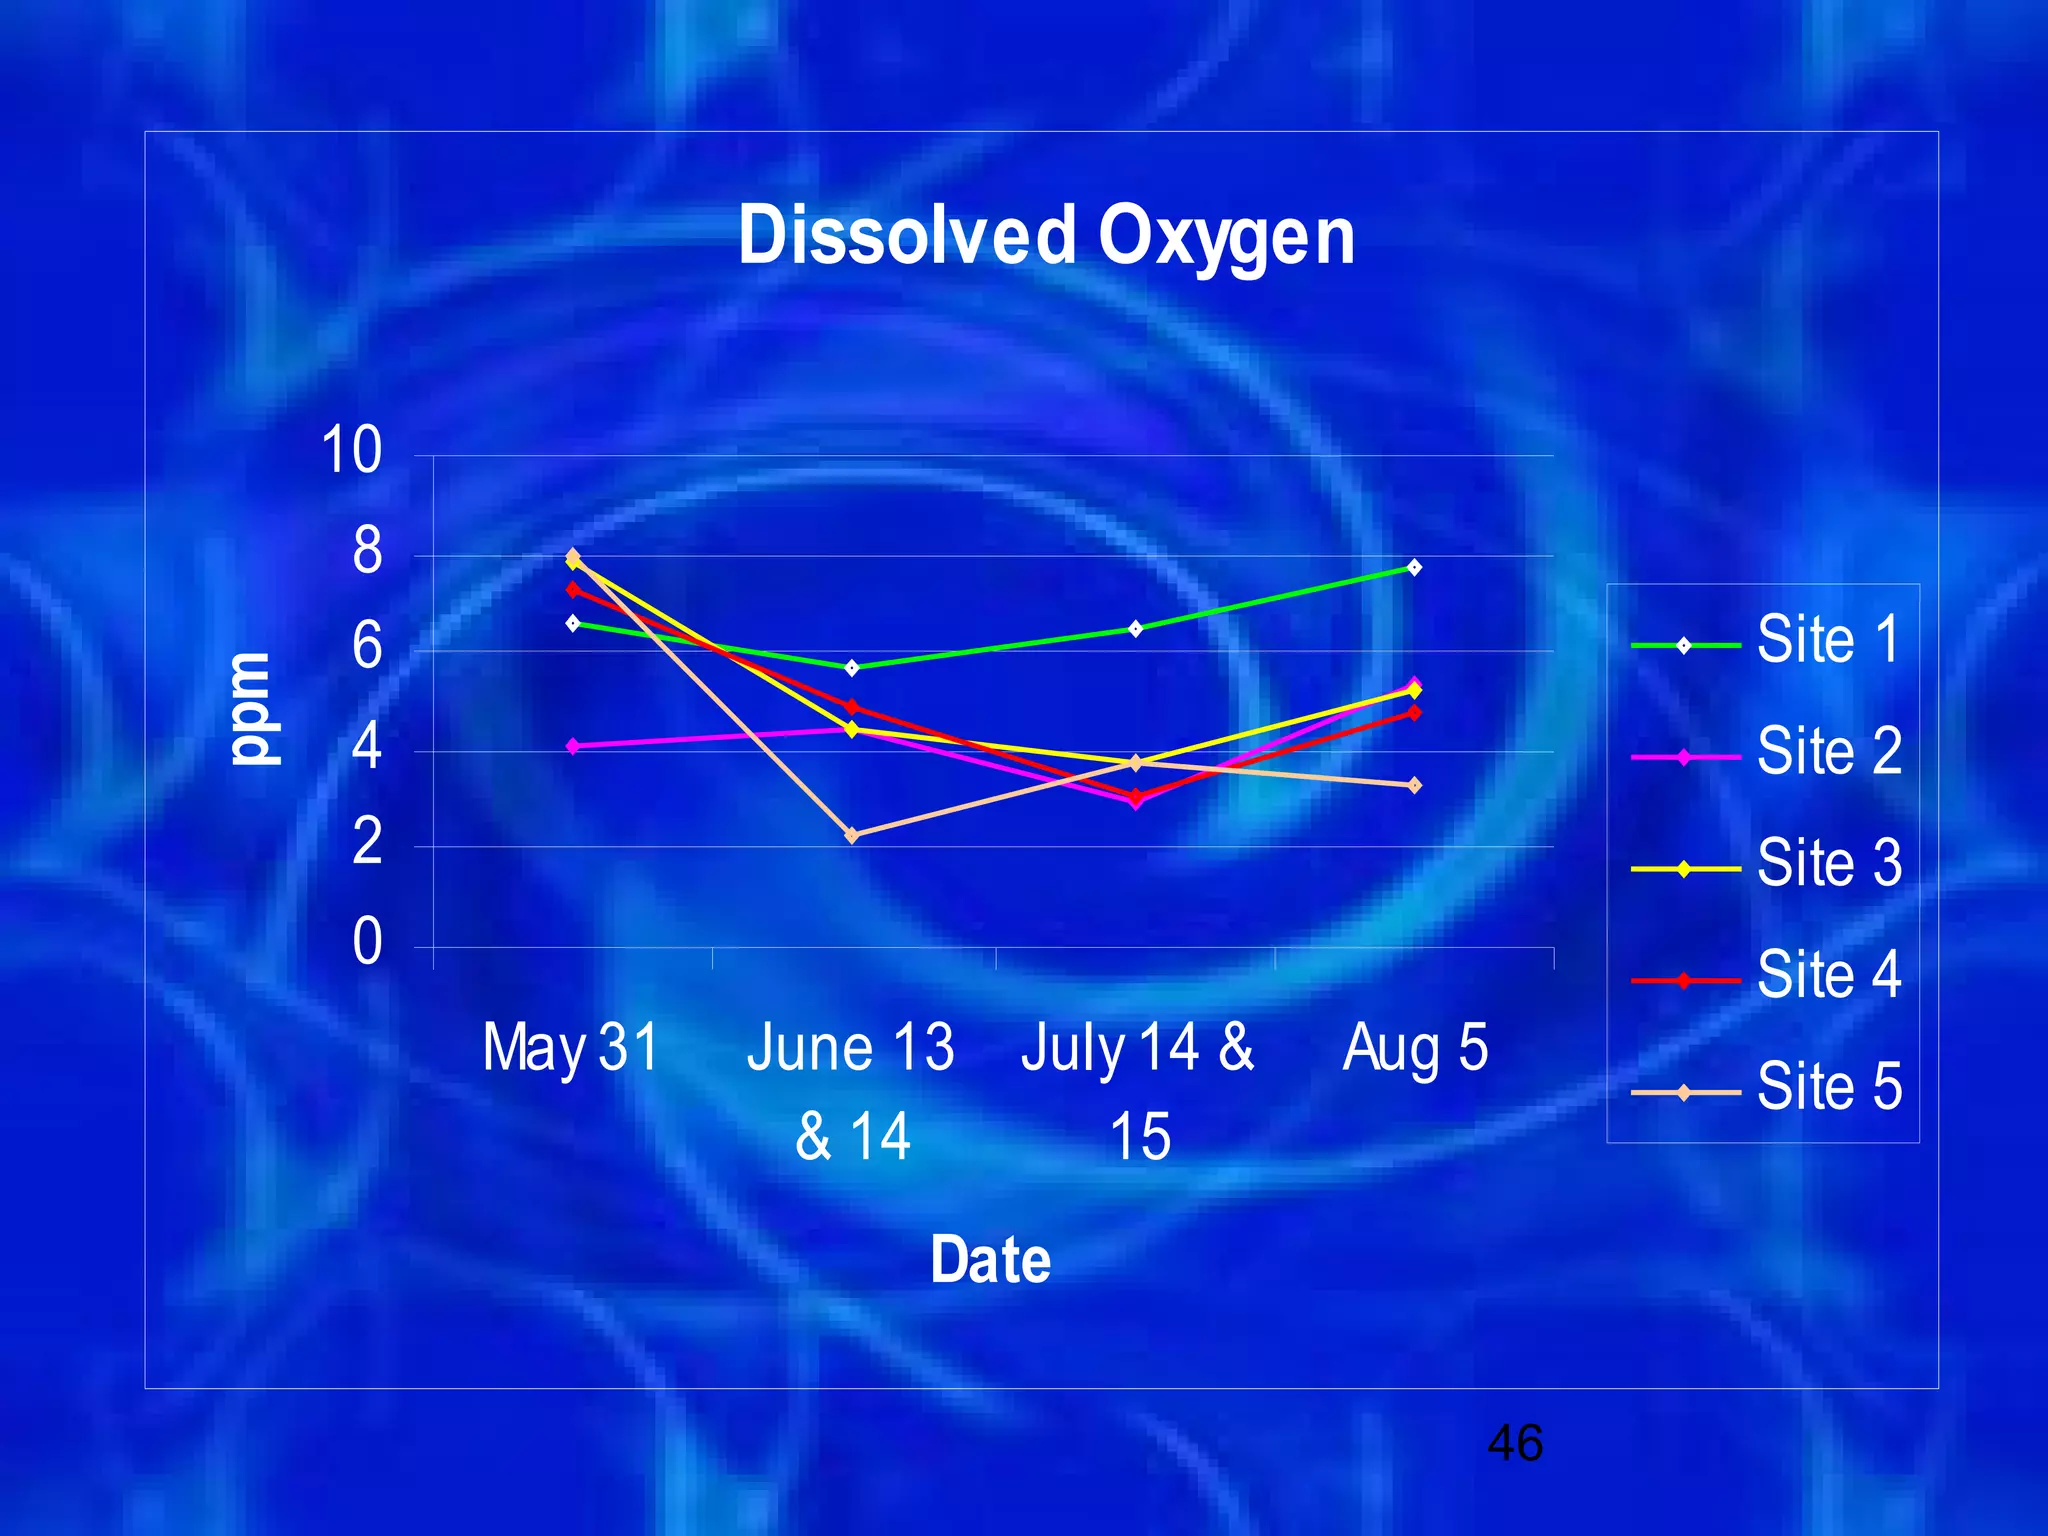
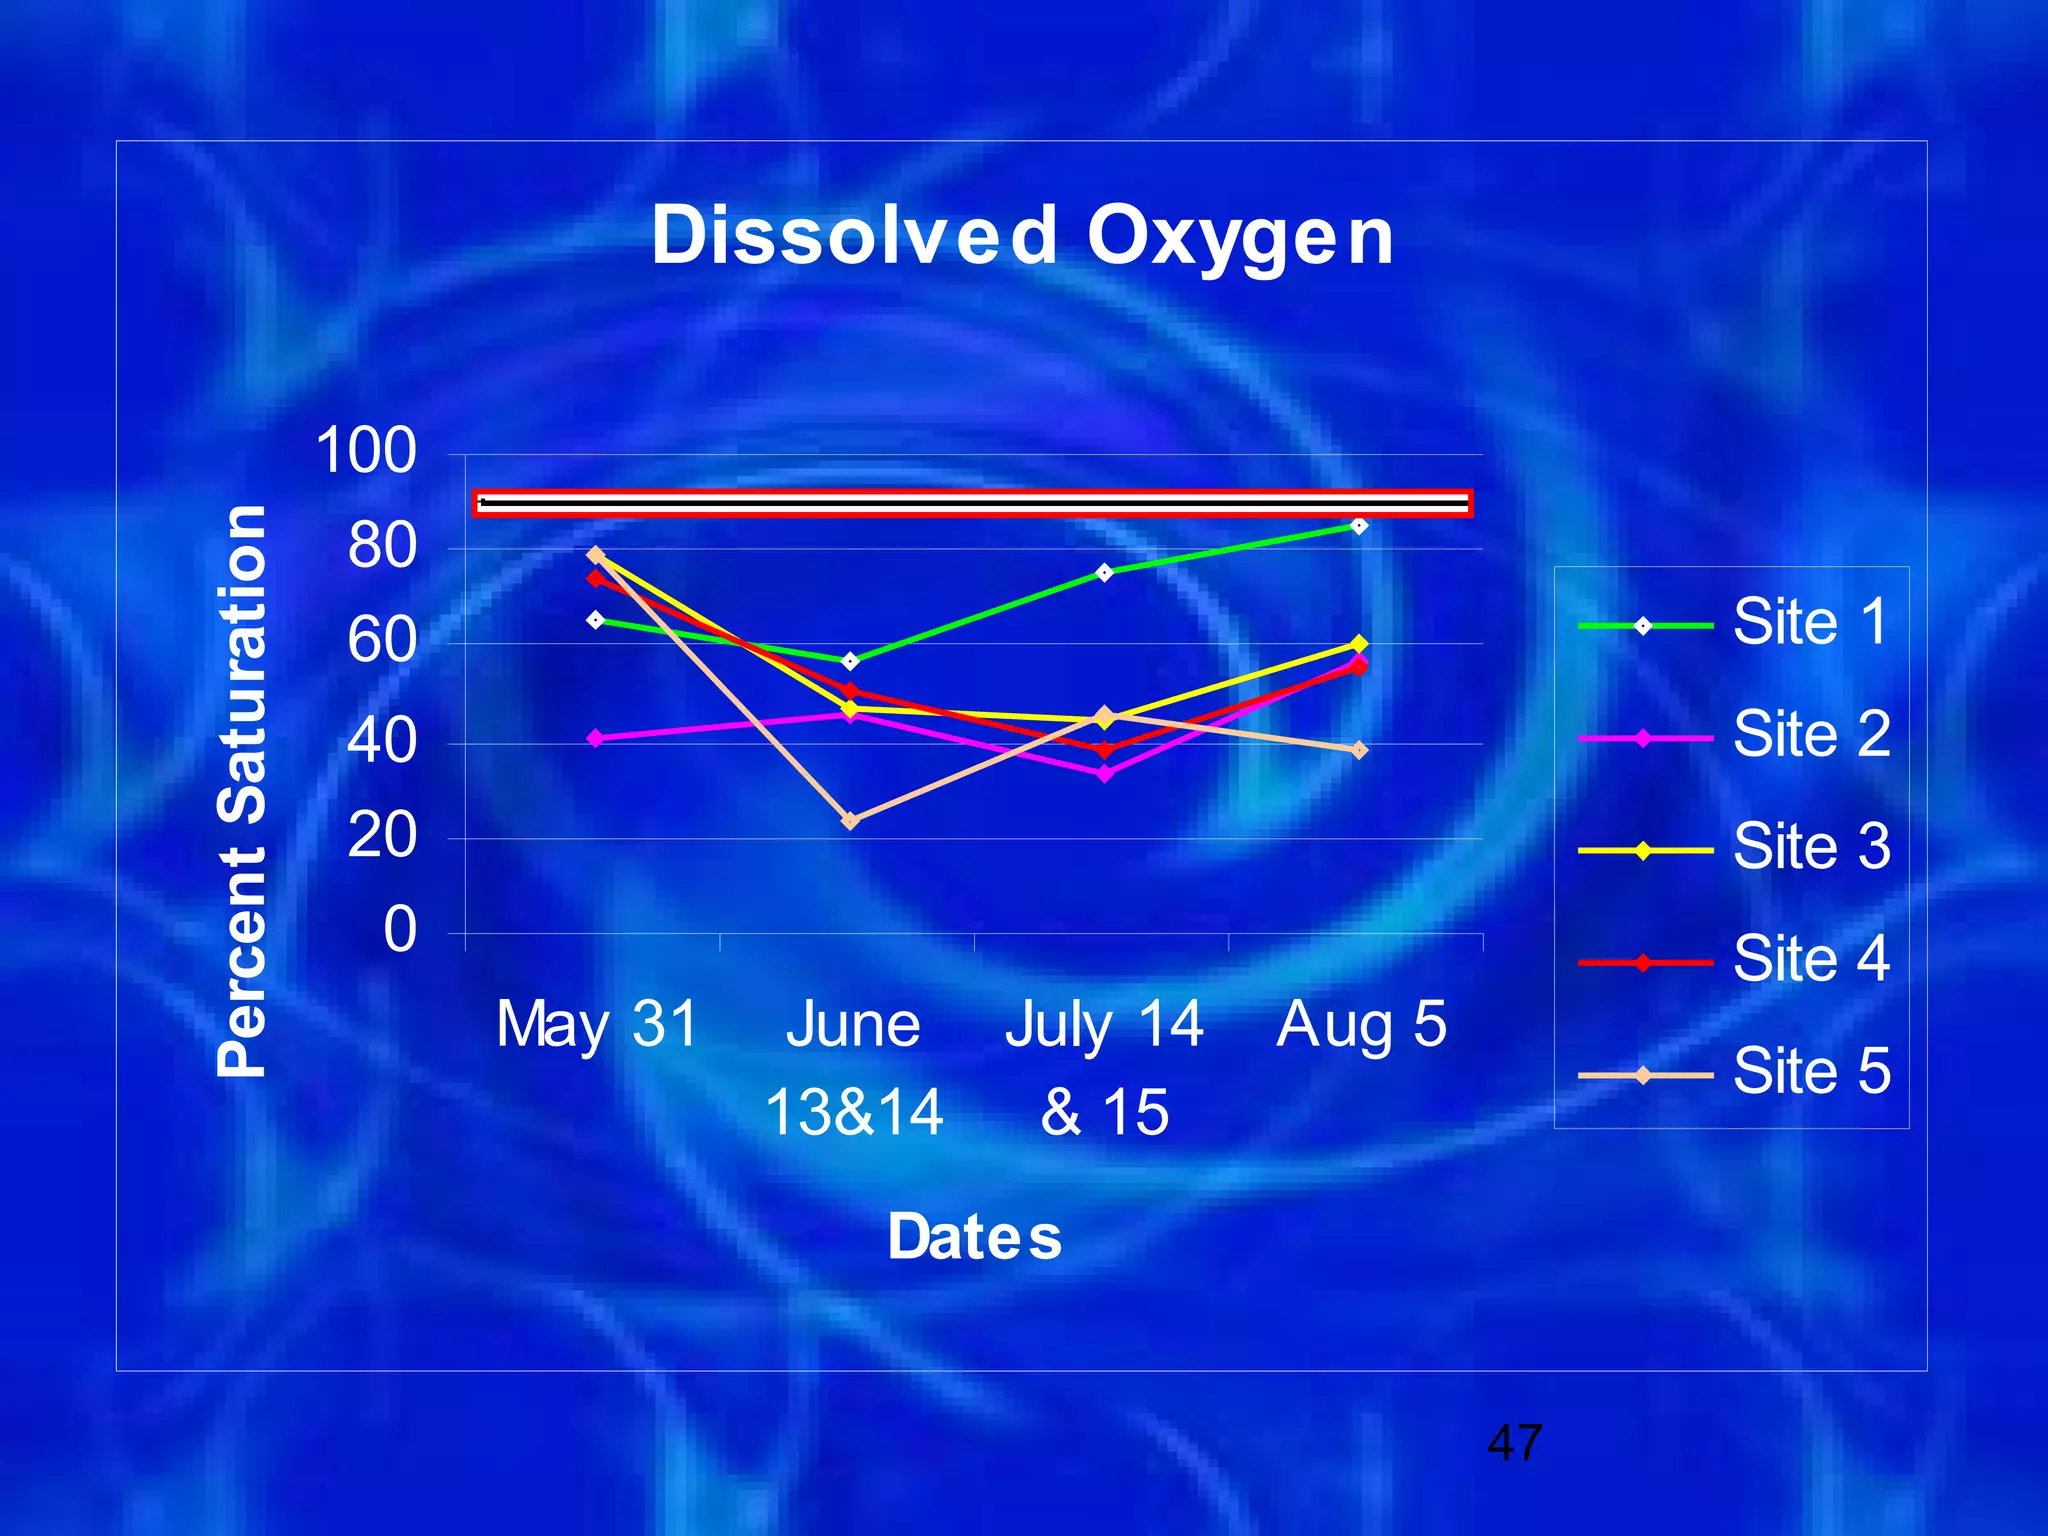
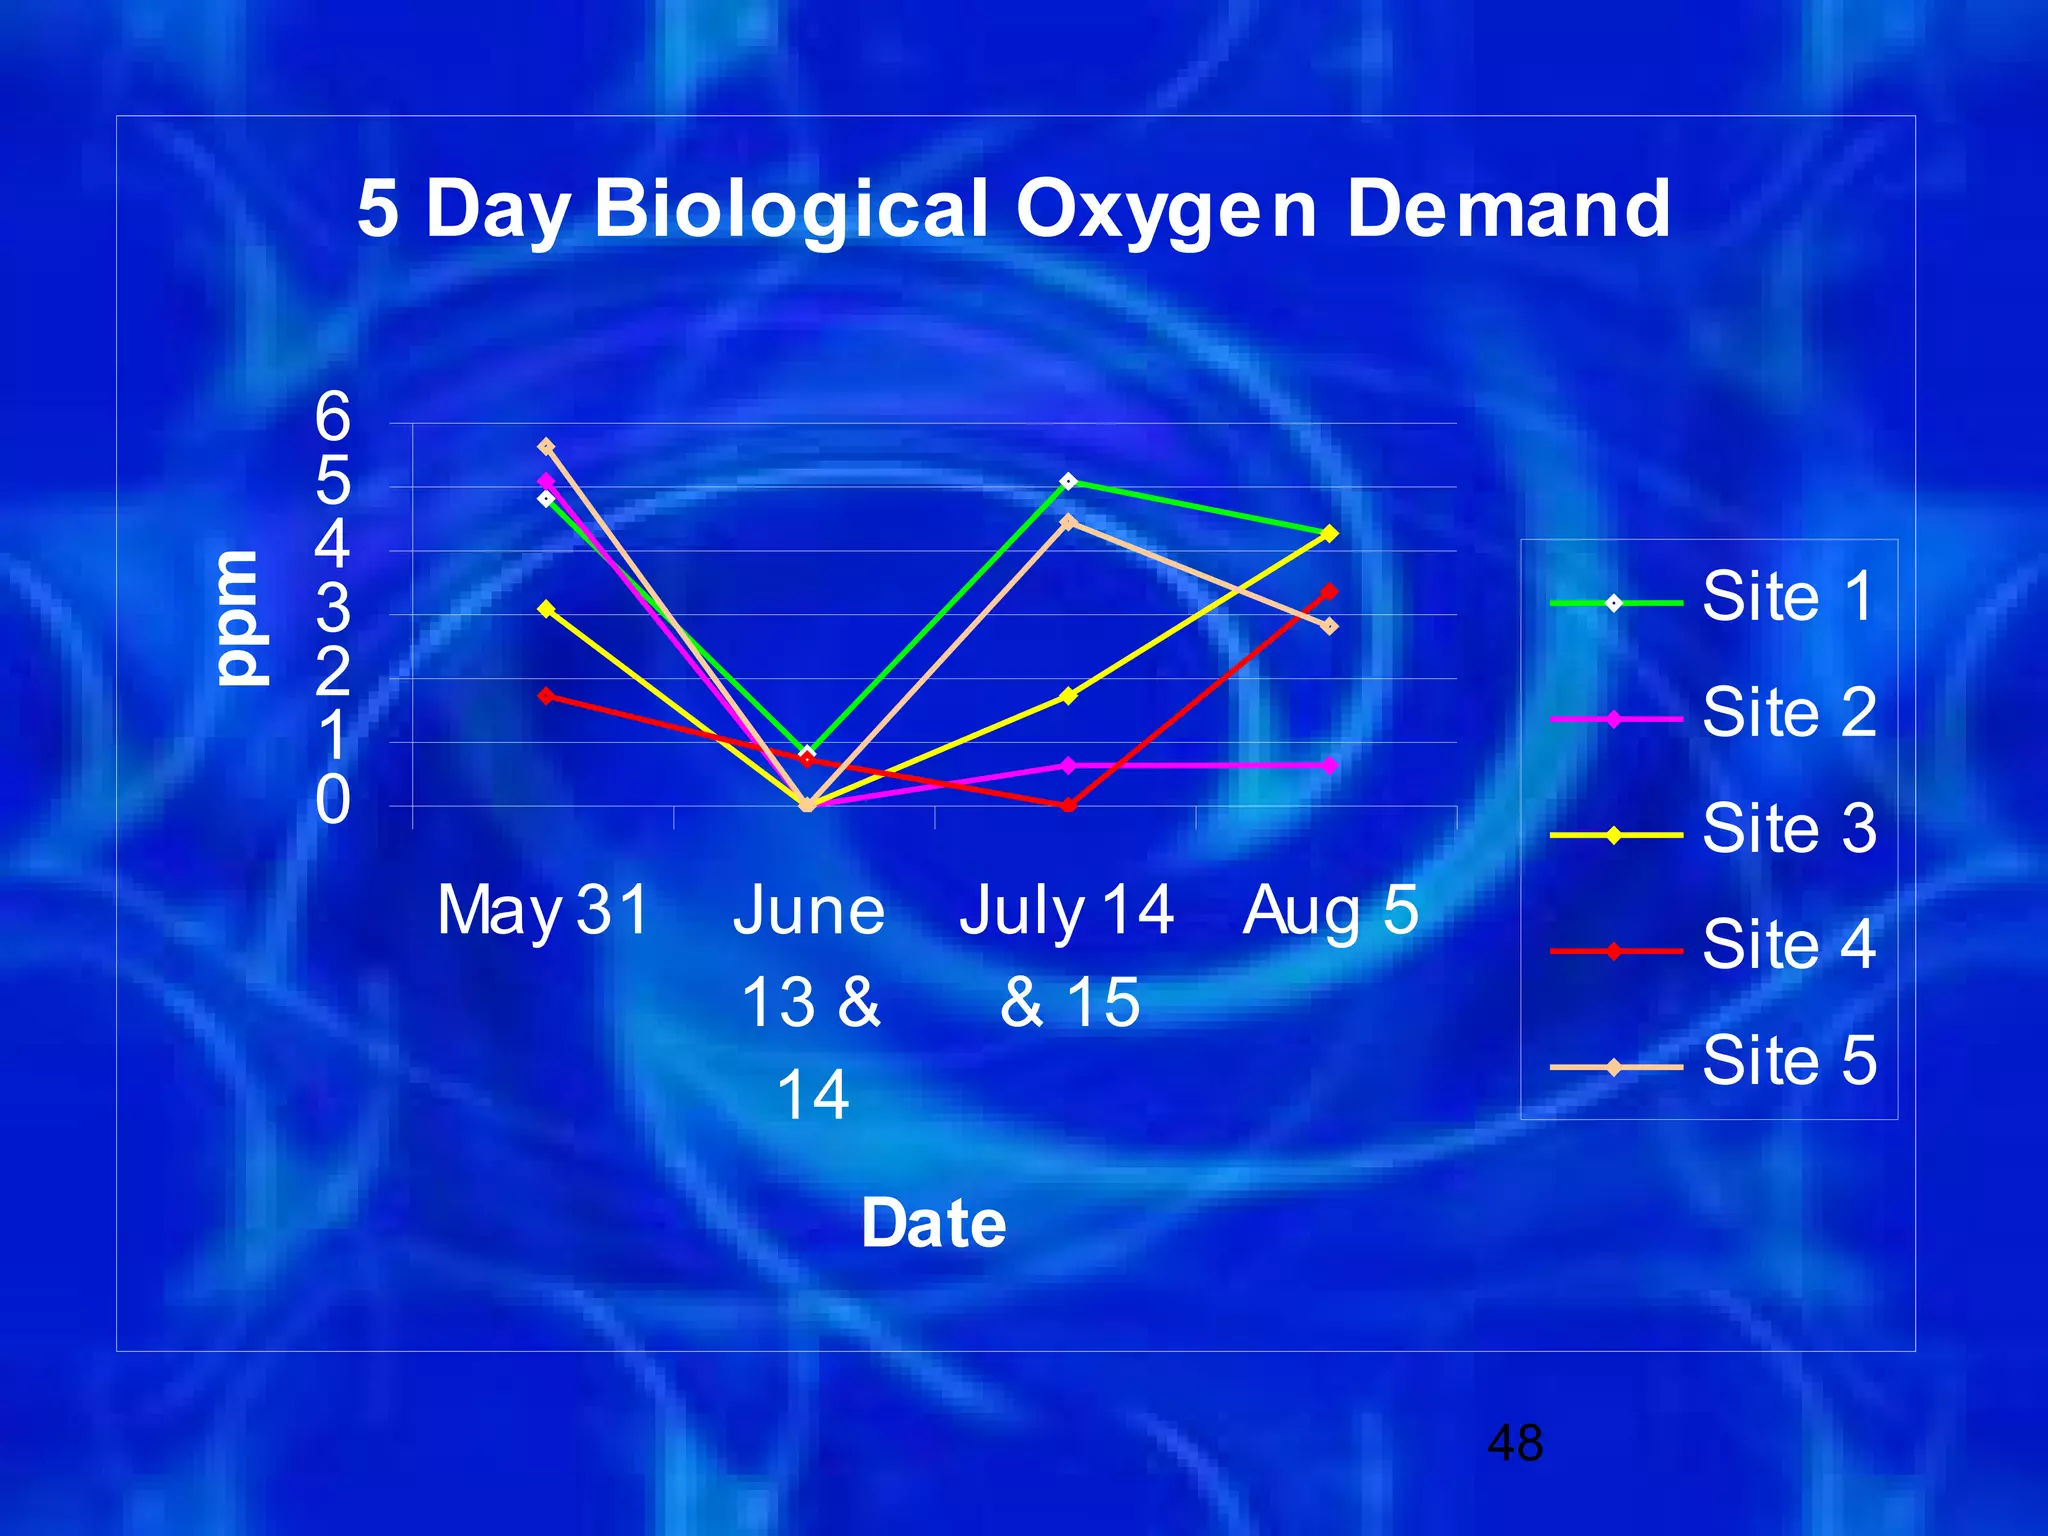
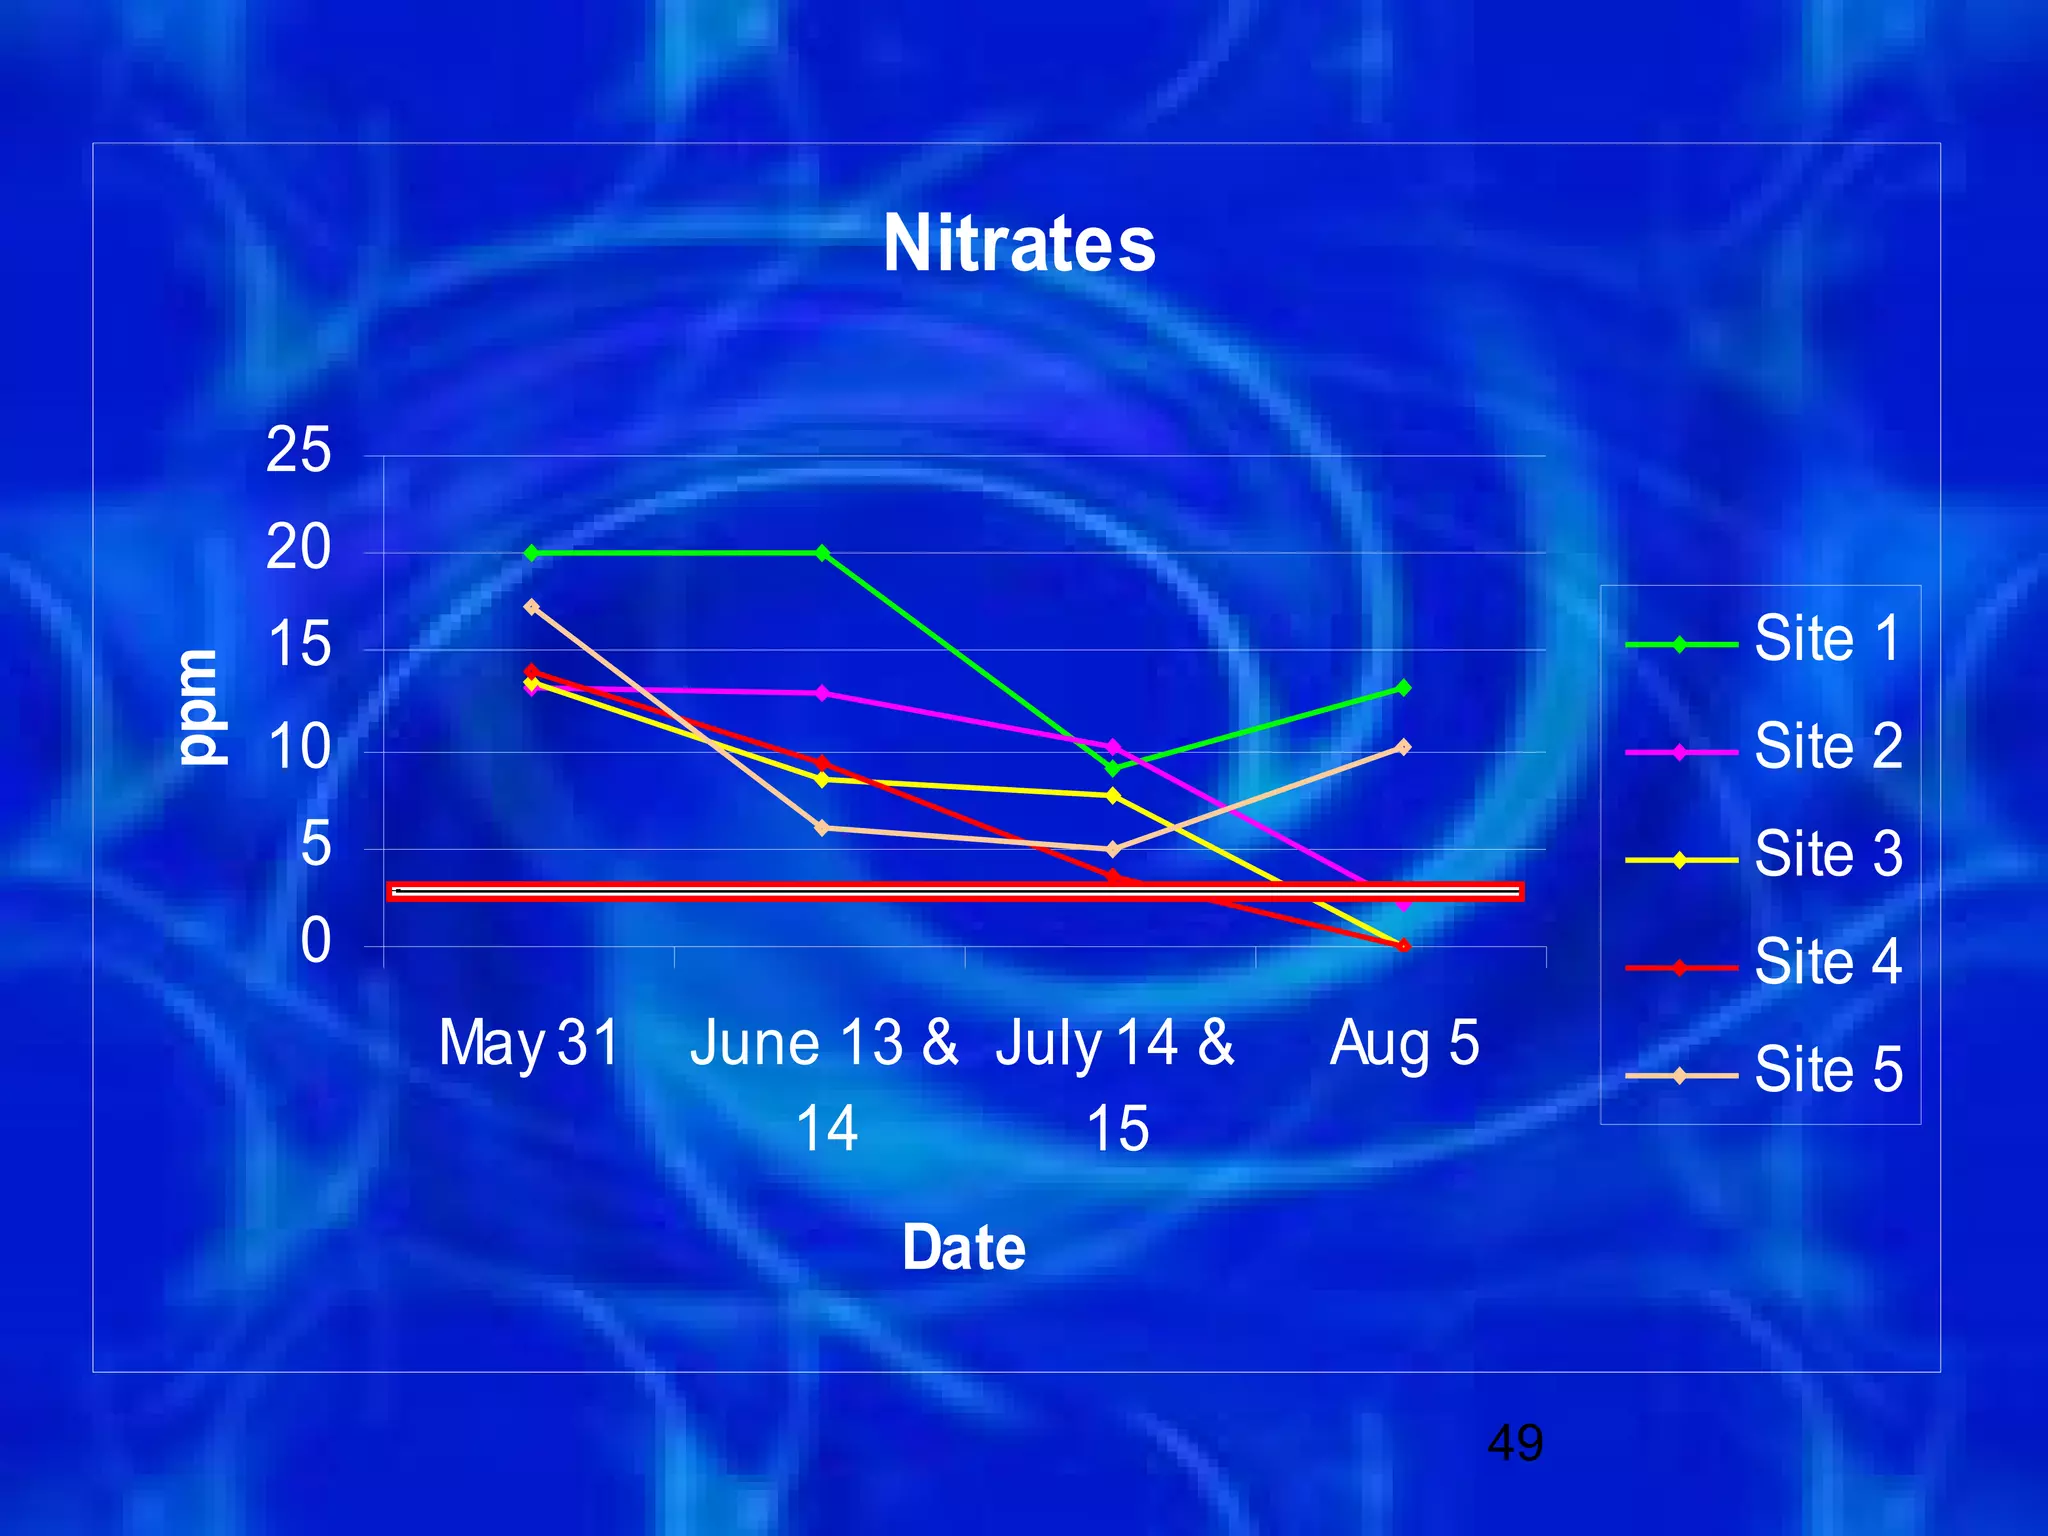
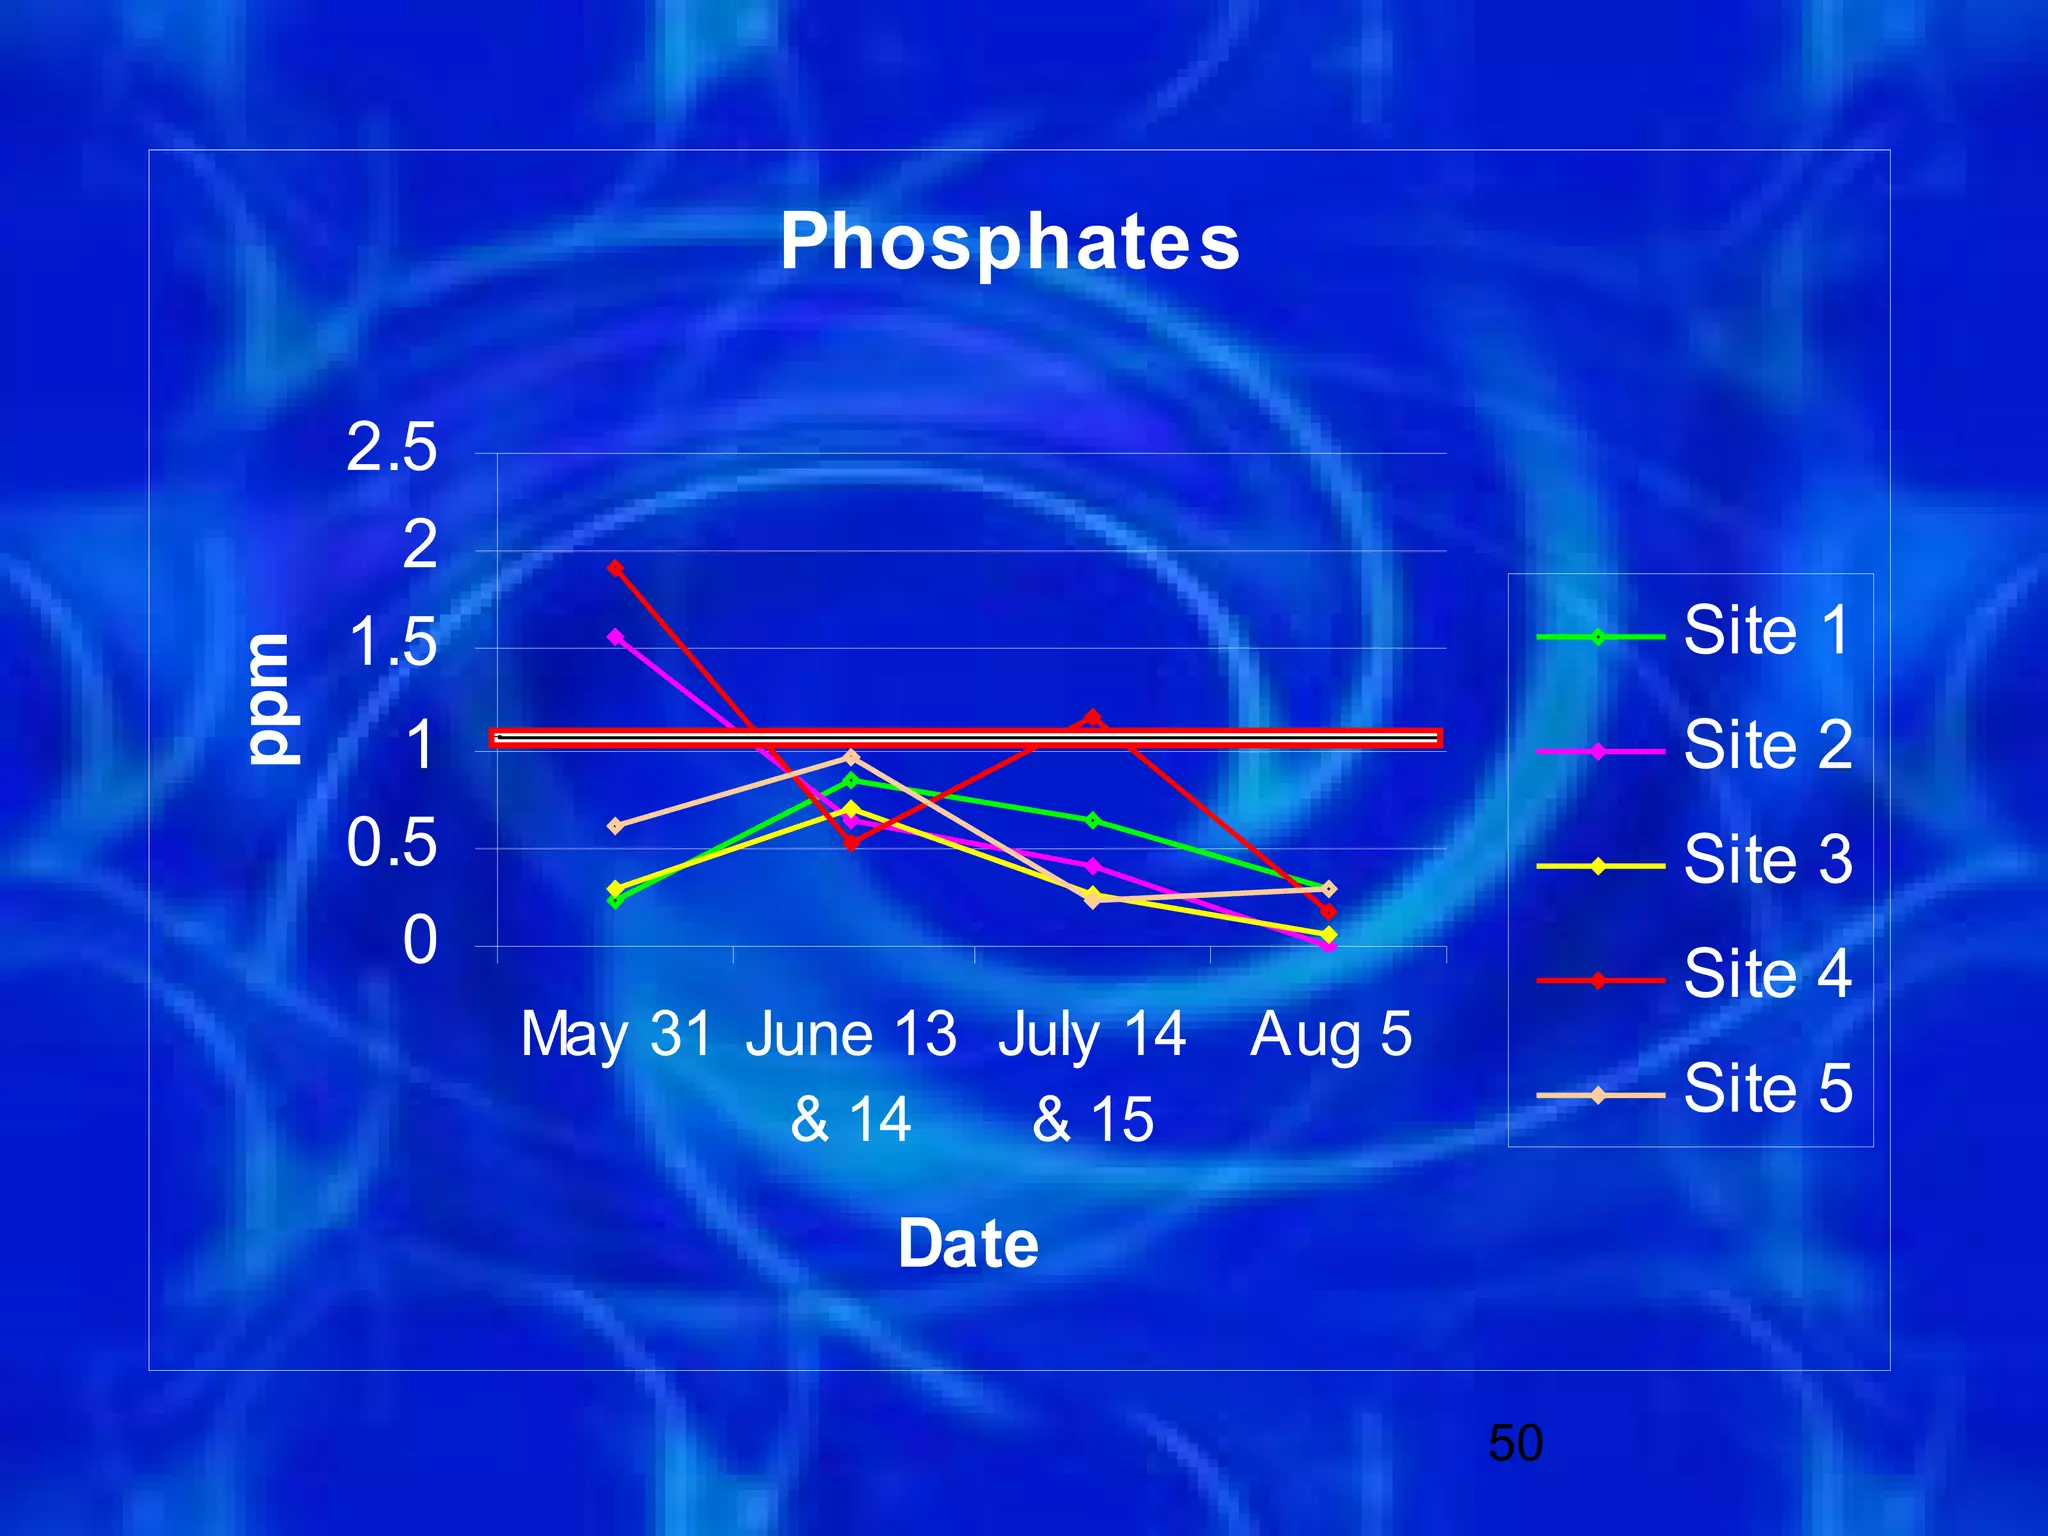
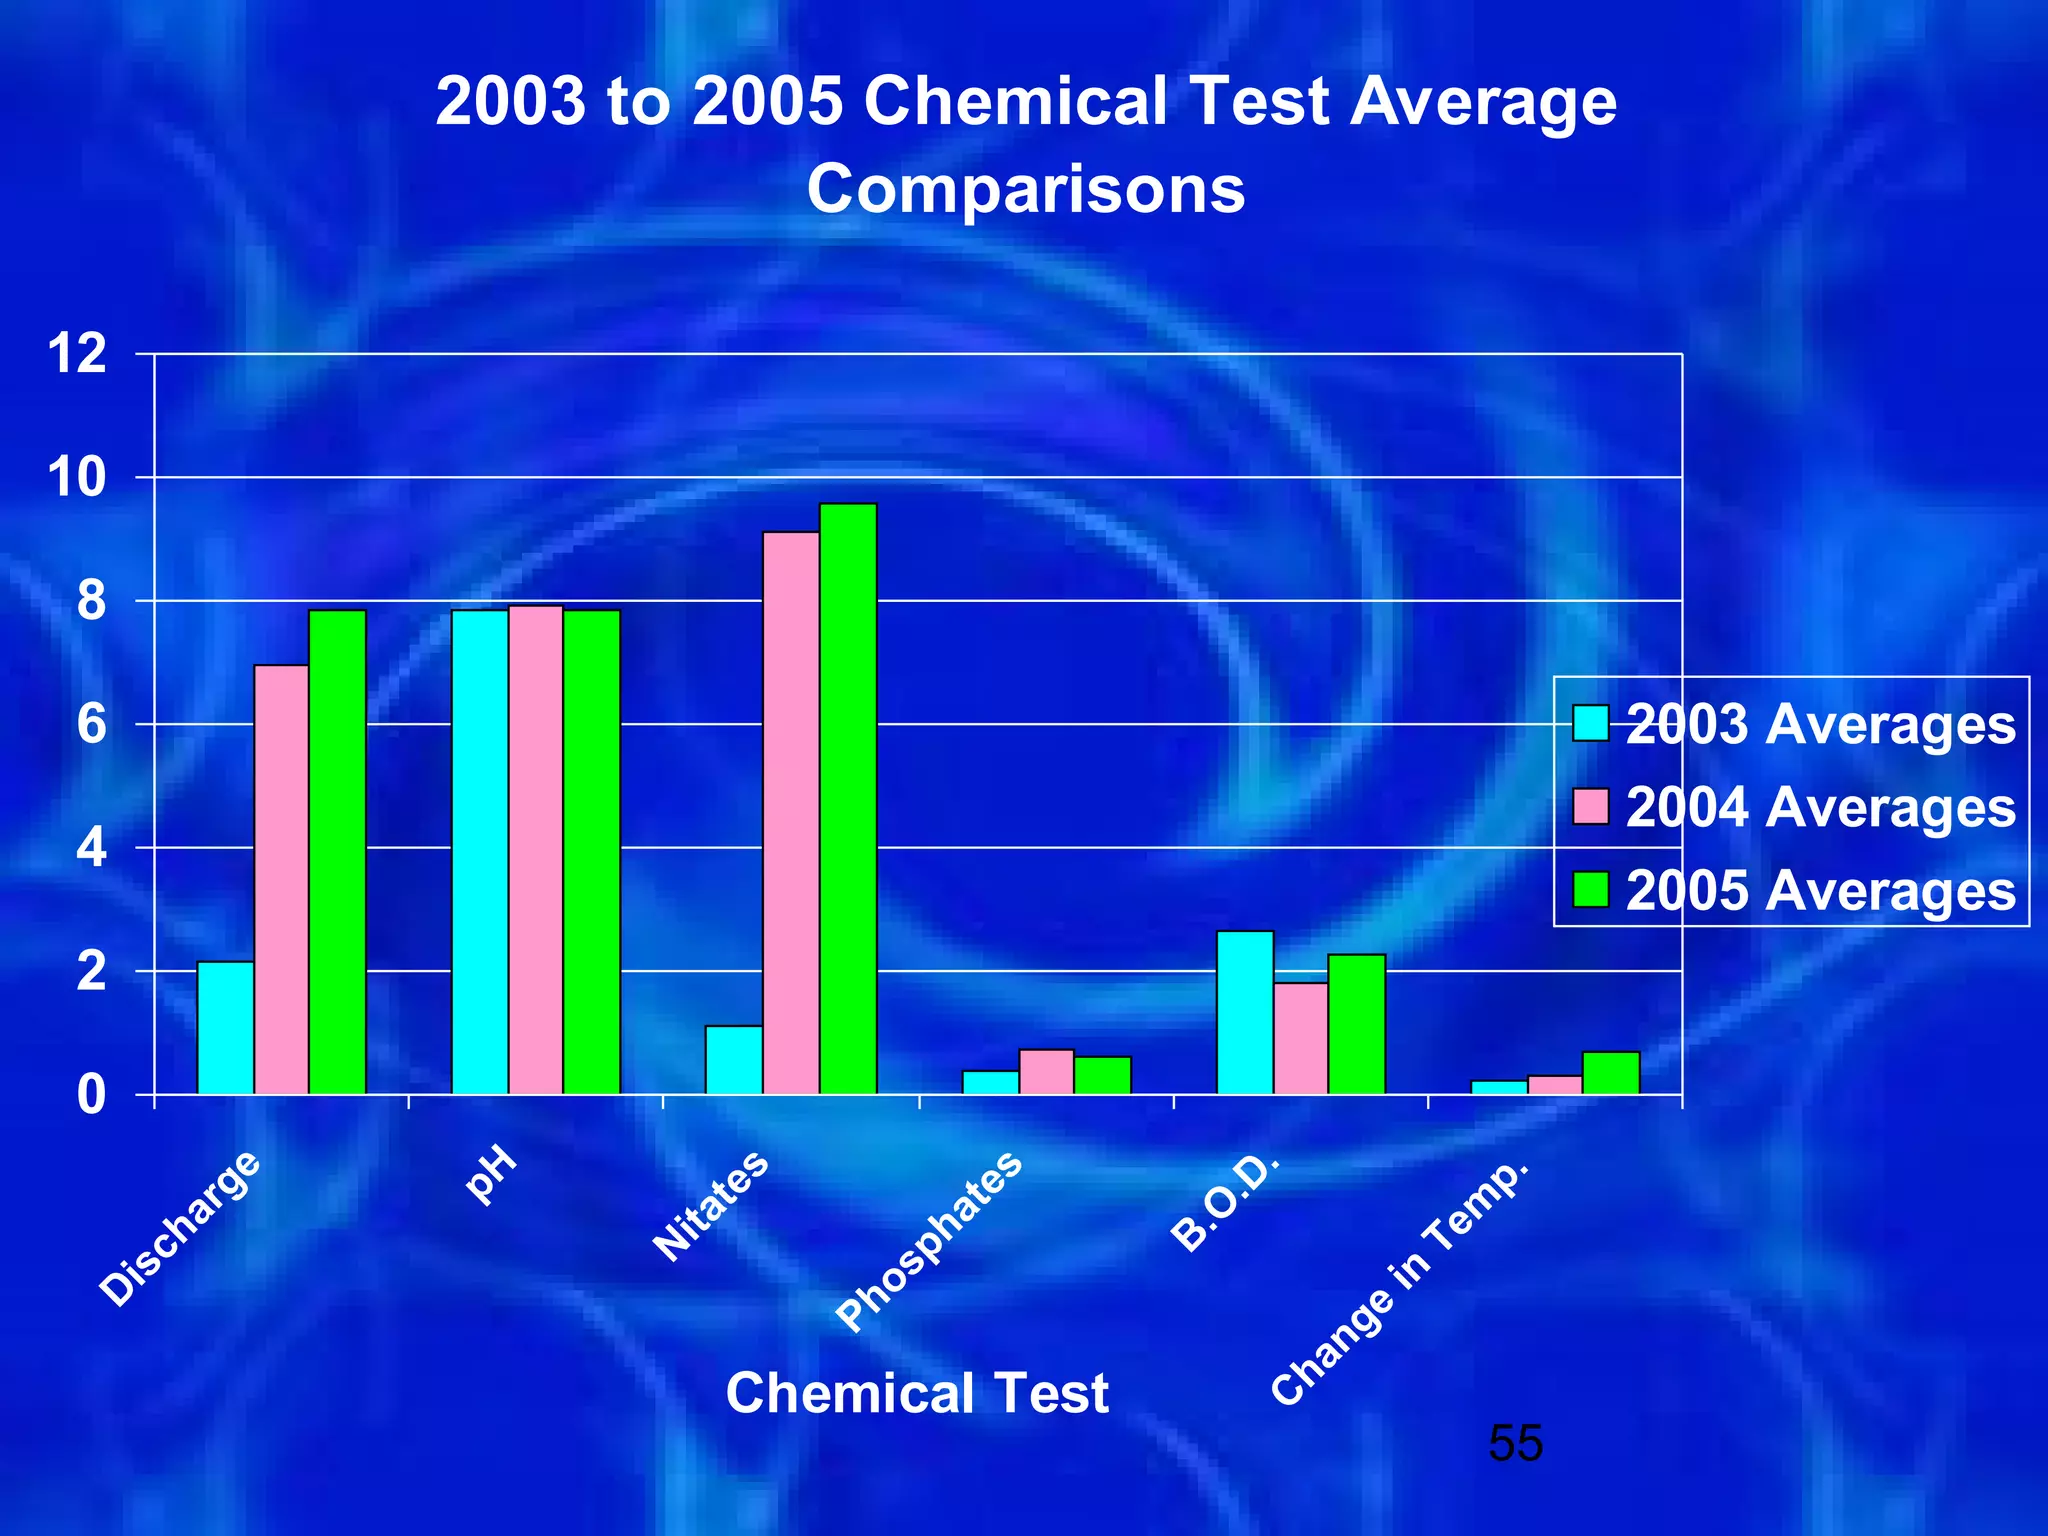
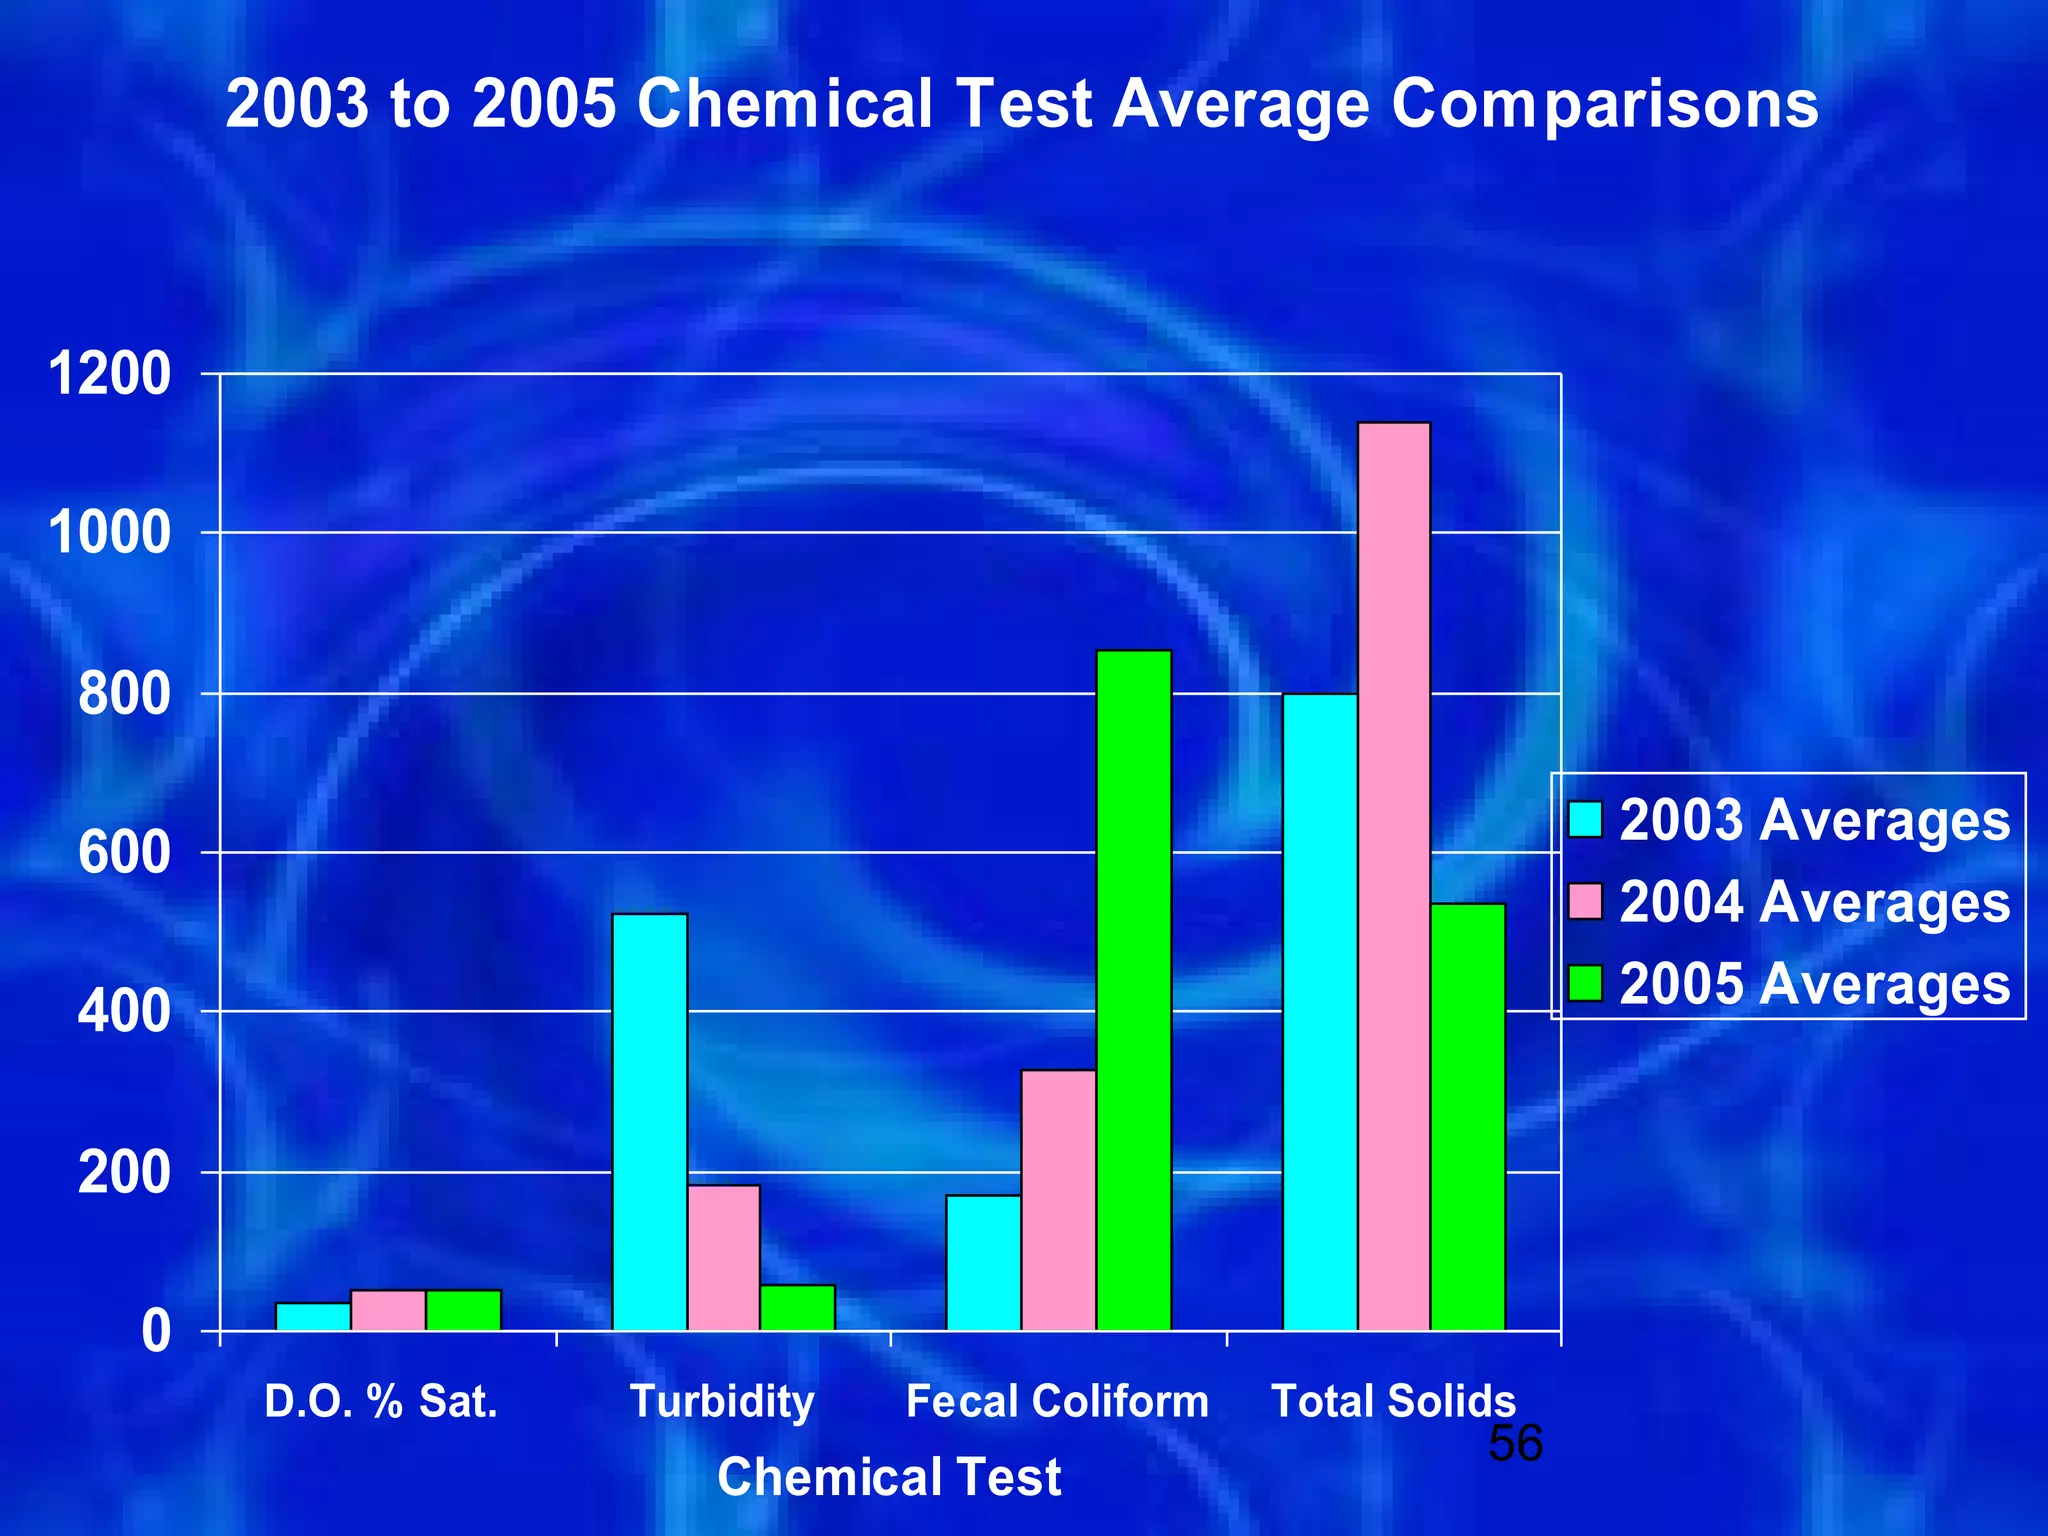
- Tests included dissolved oxygen, pH, E. coli, turbidity, nutrients and more.
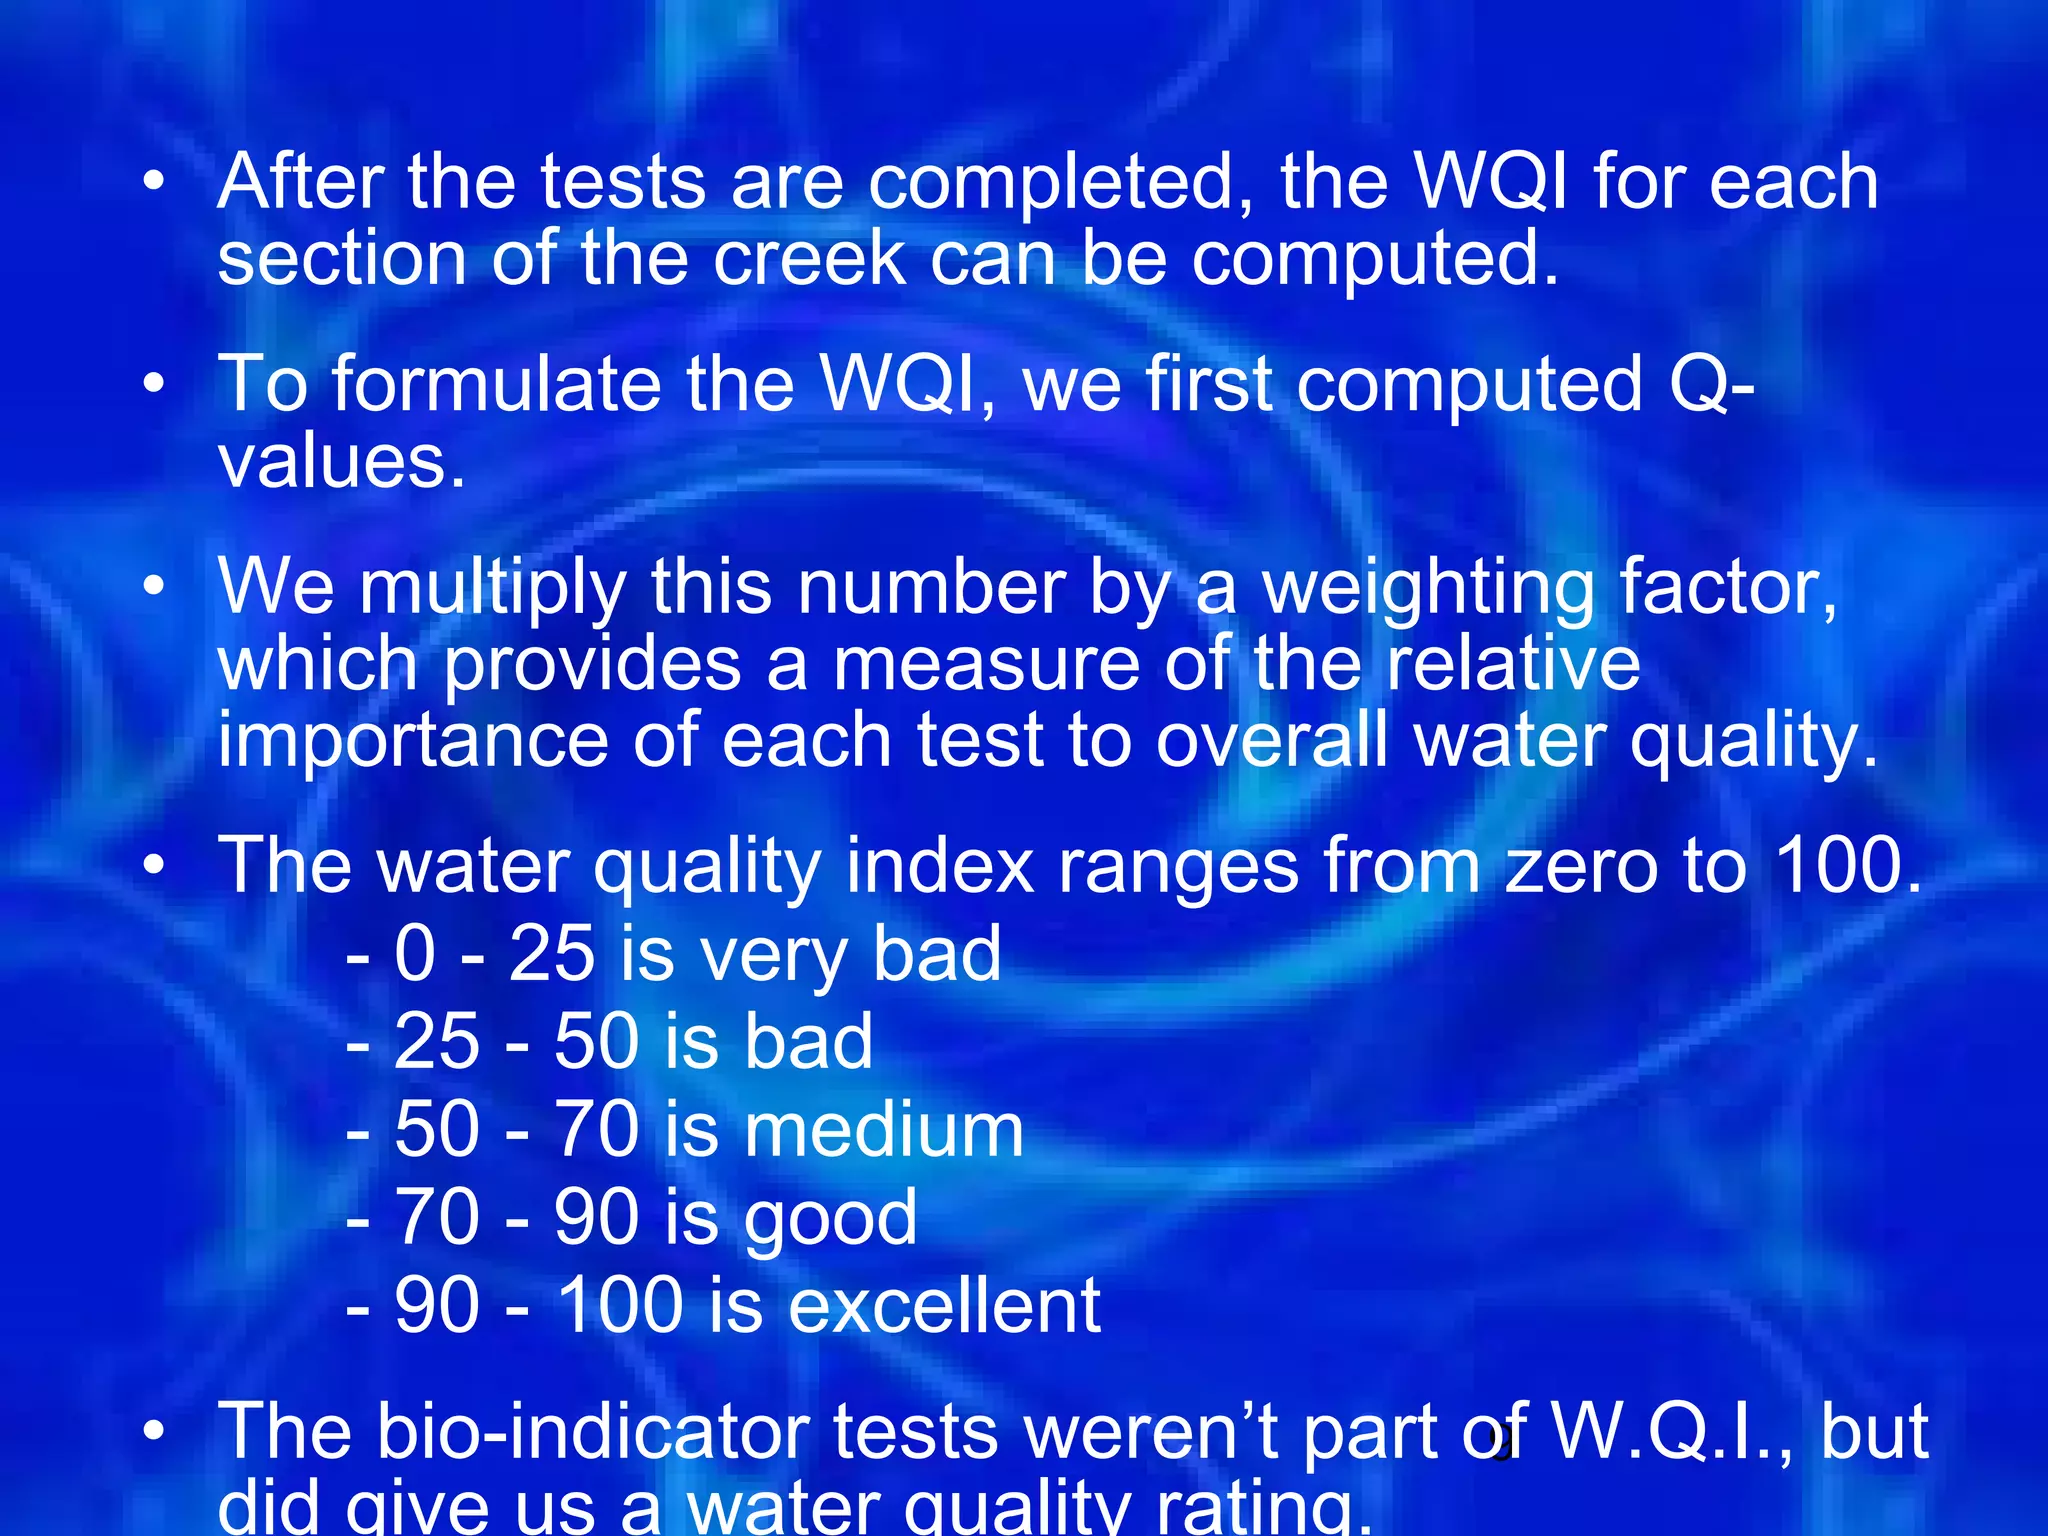
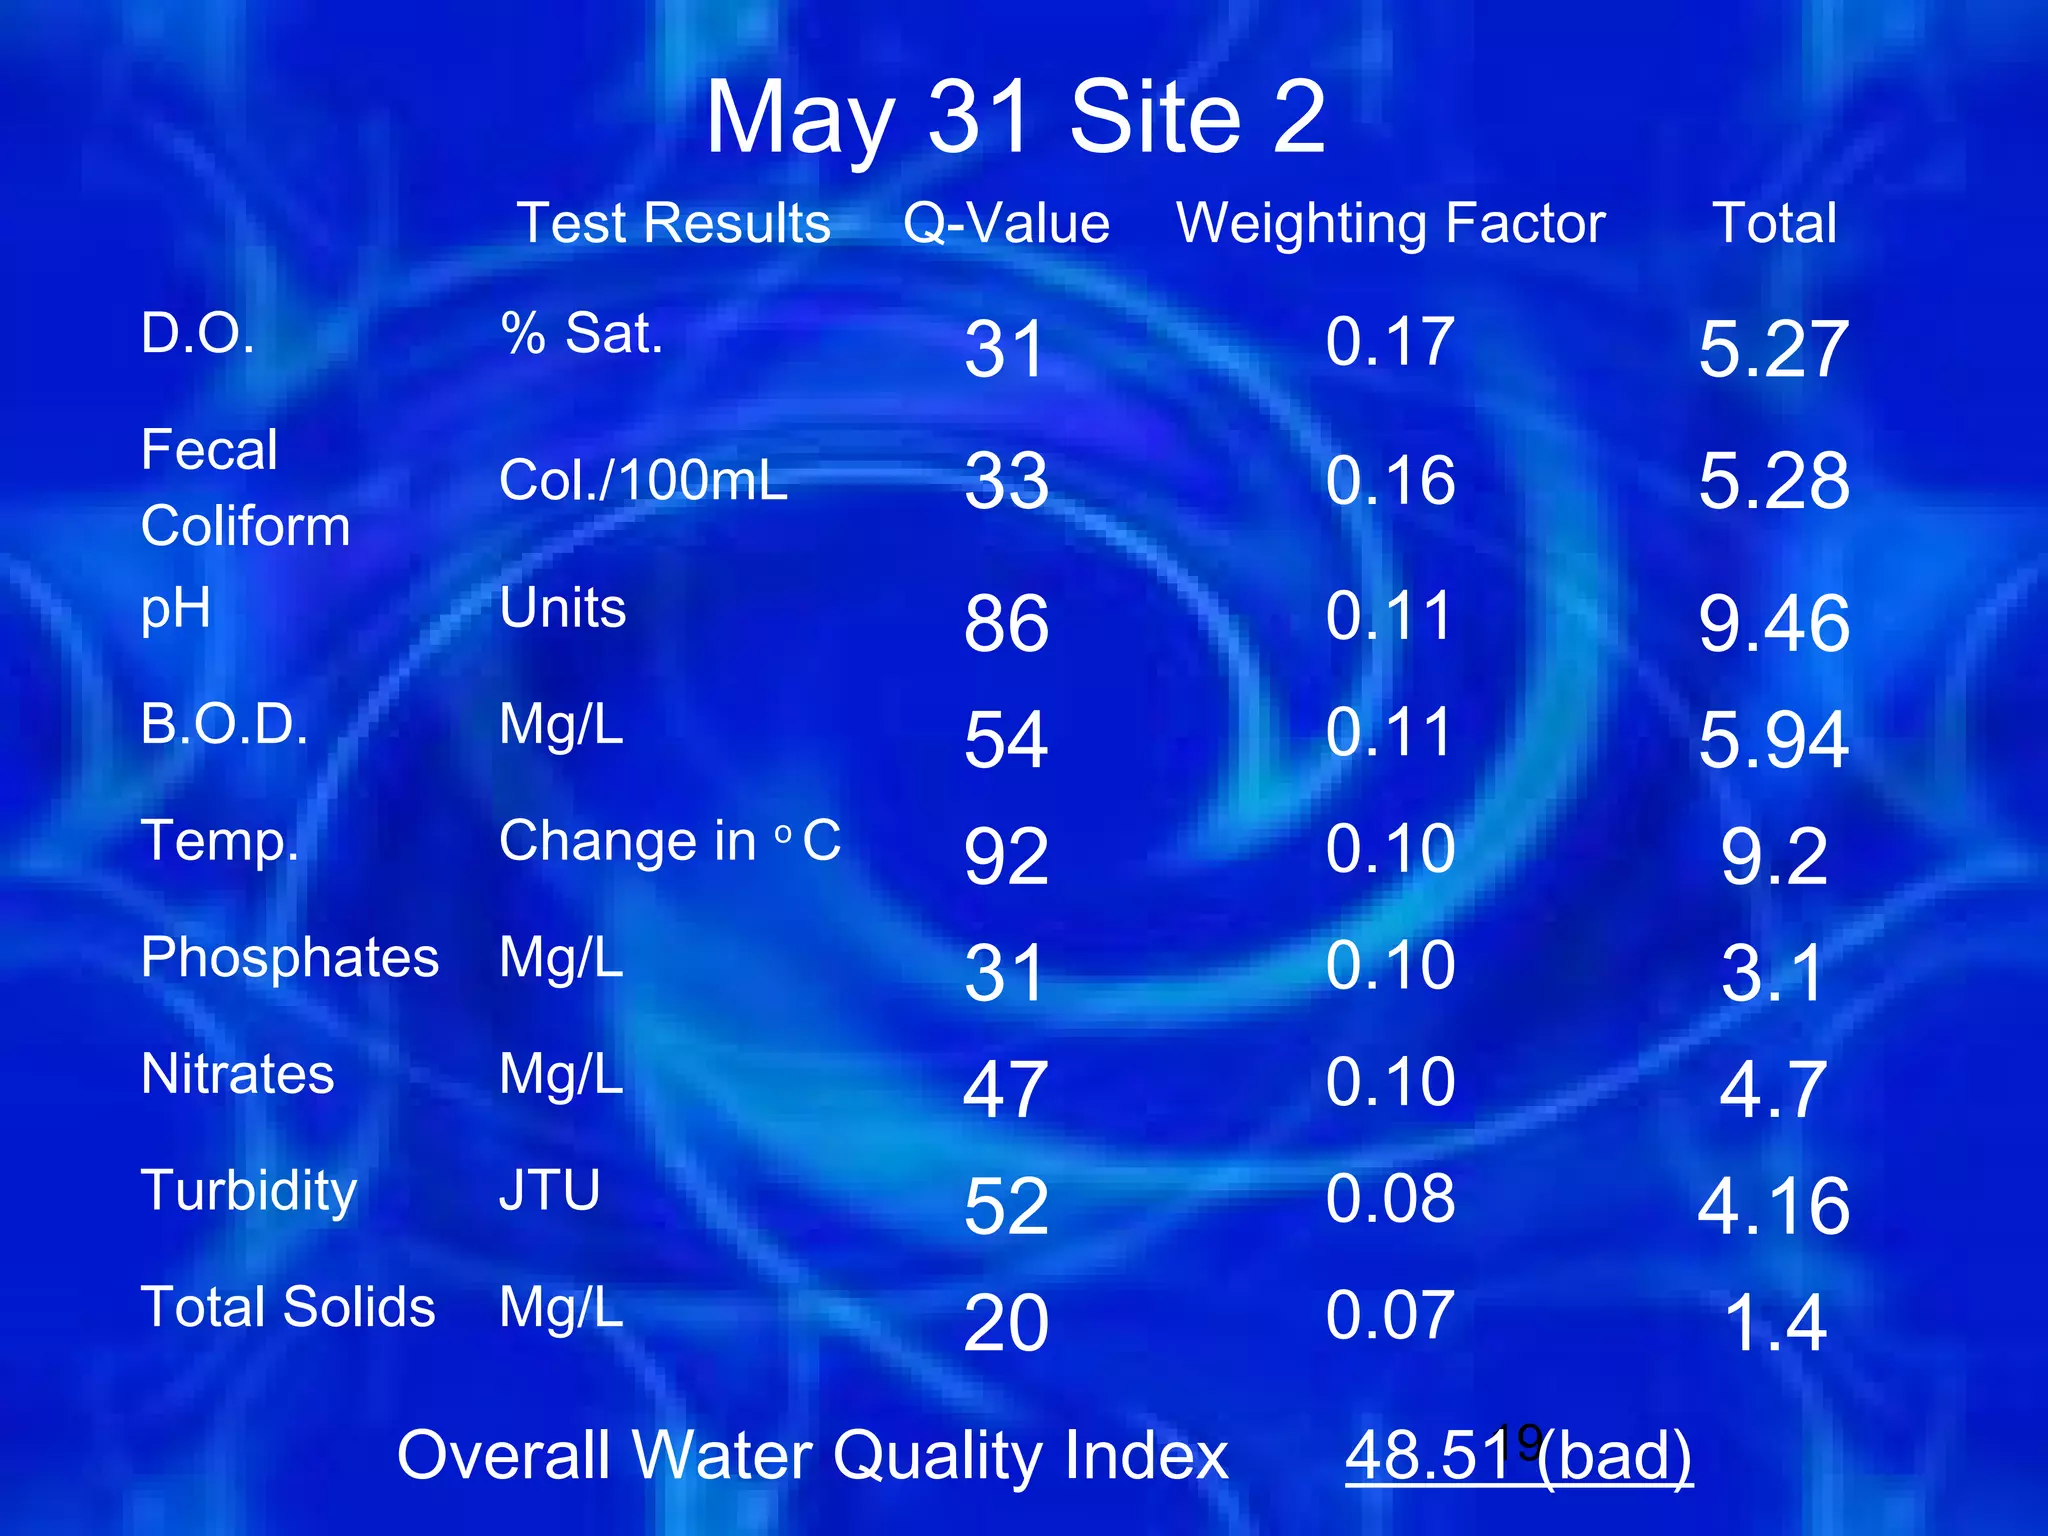
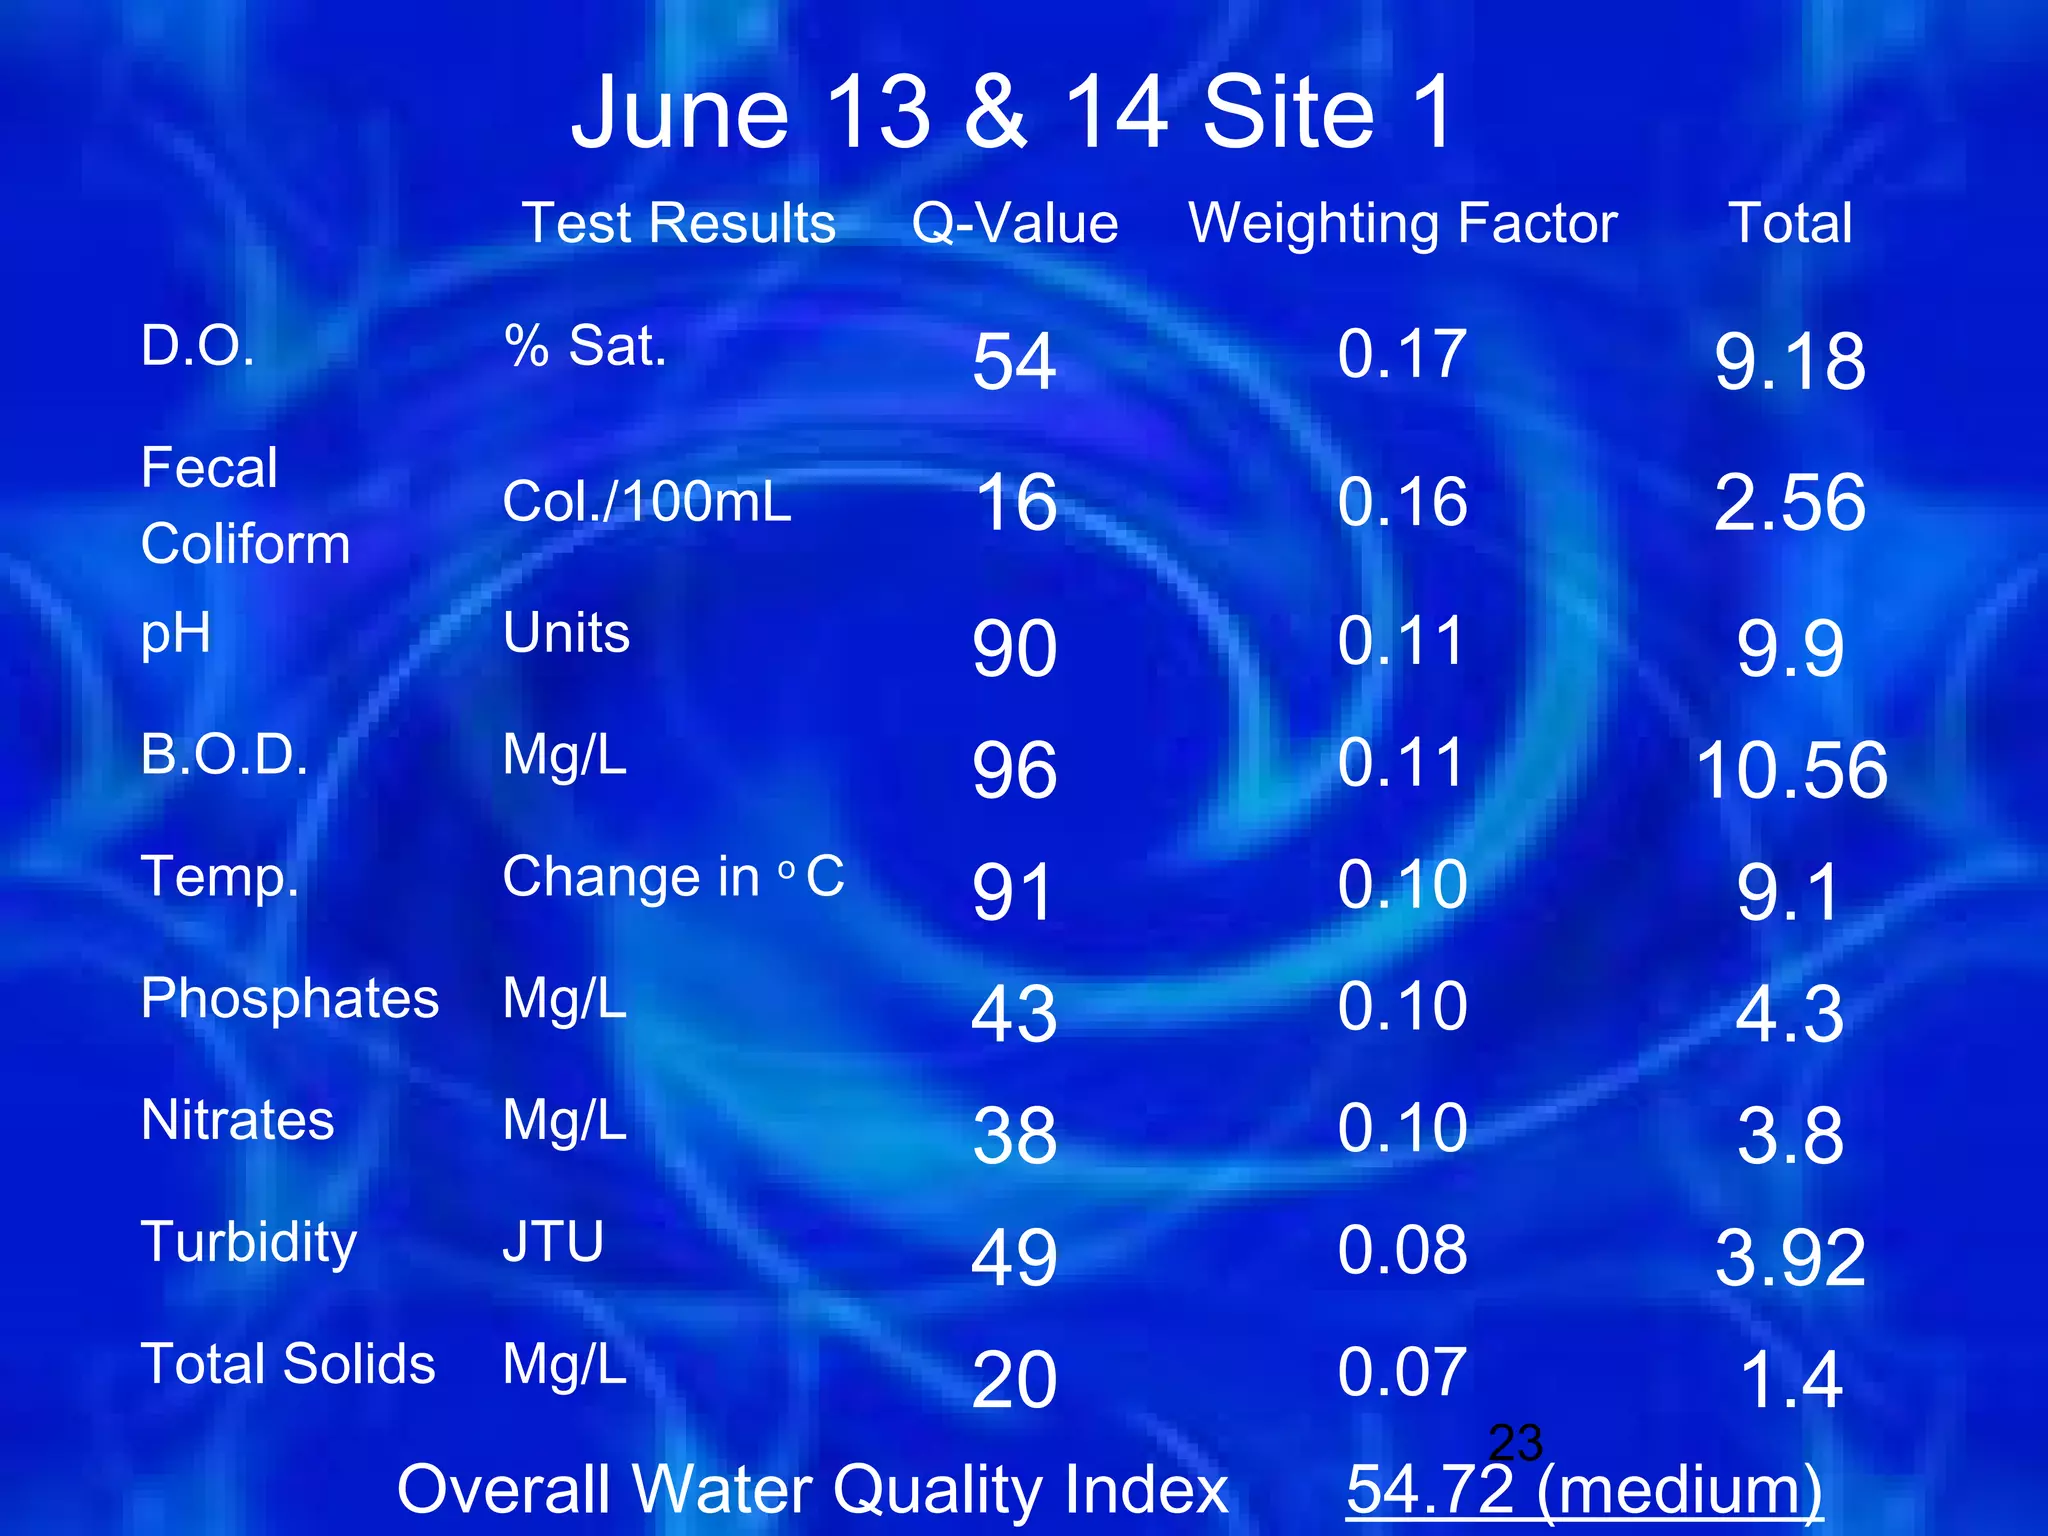
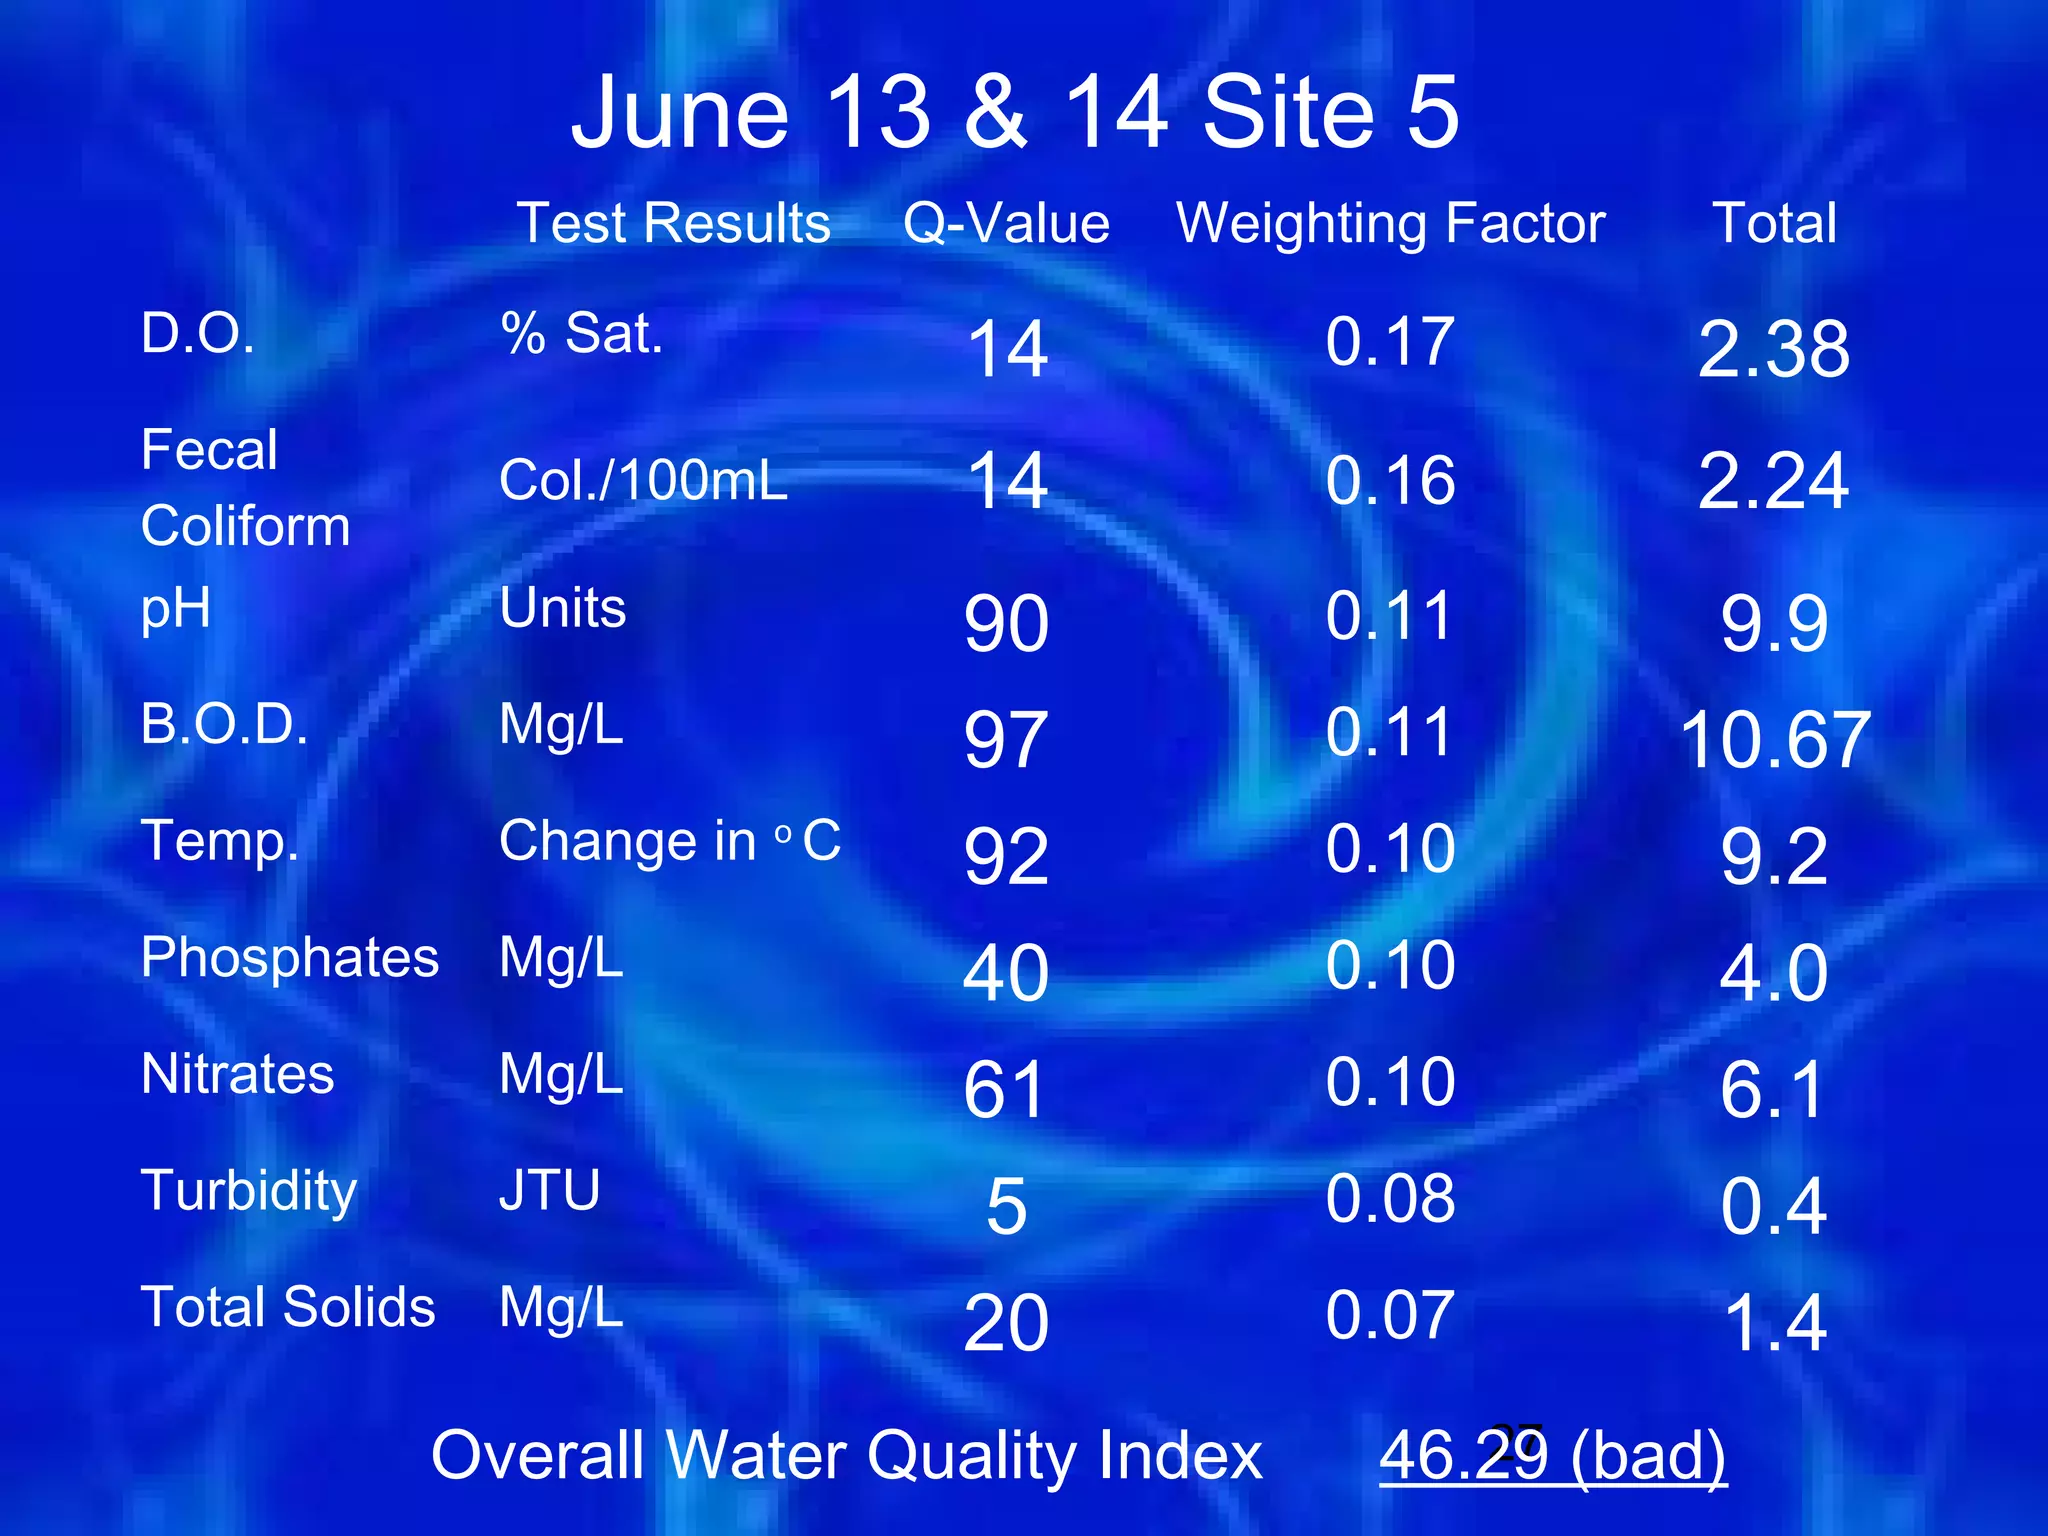
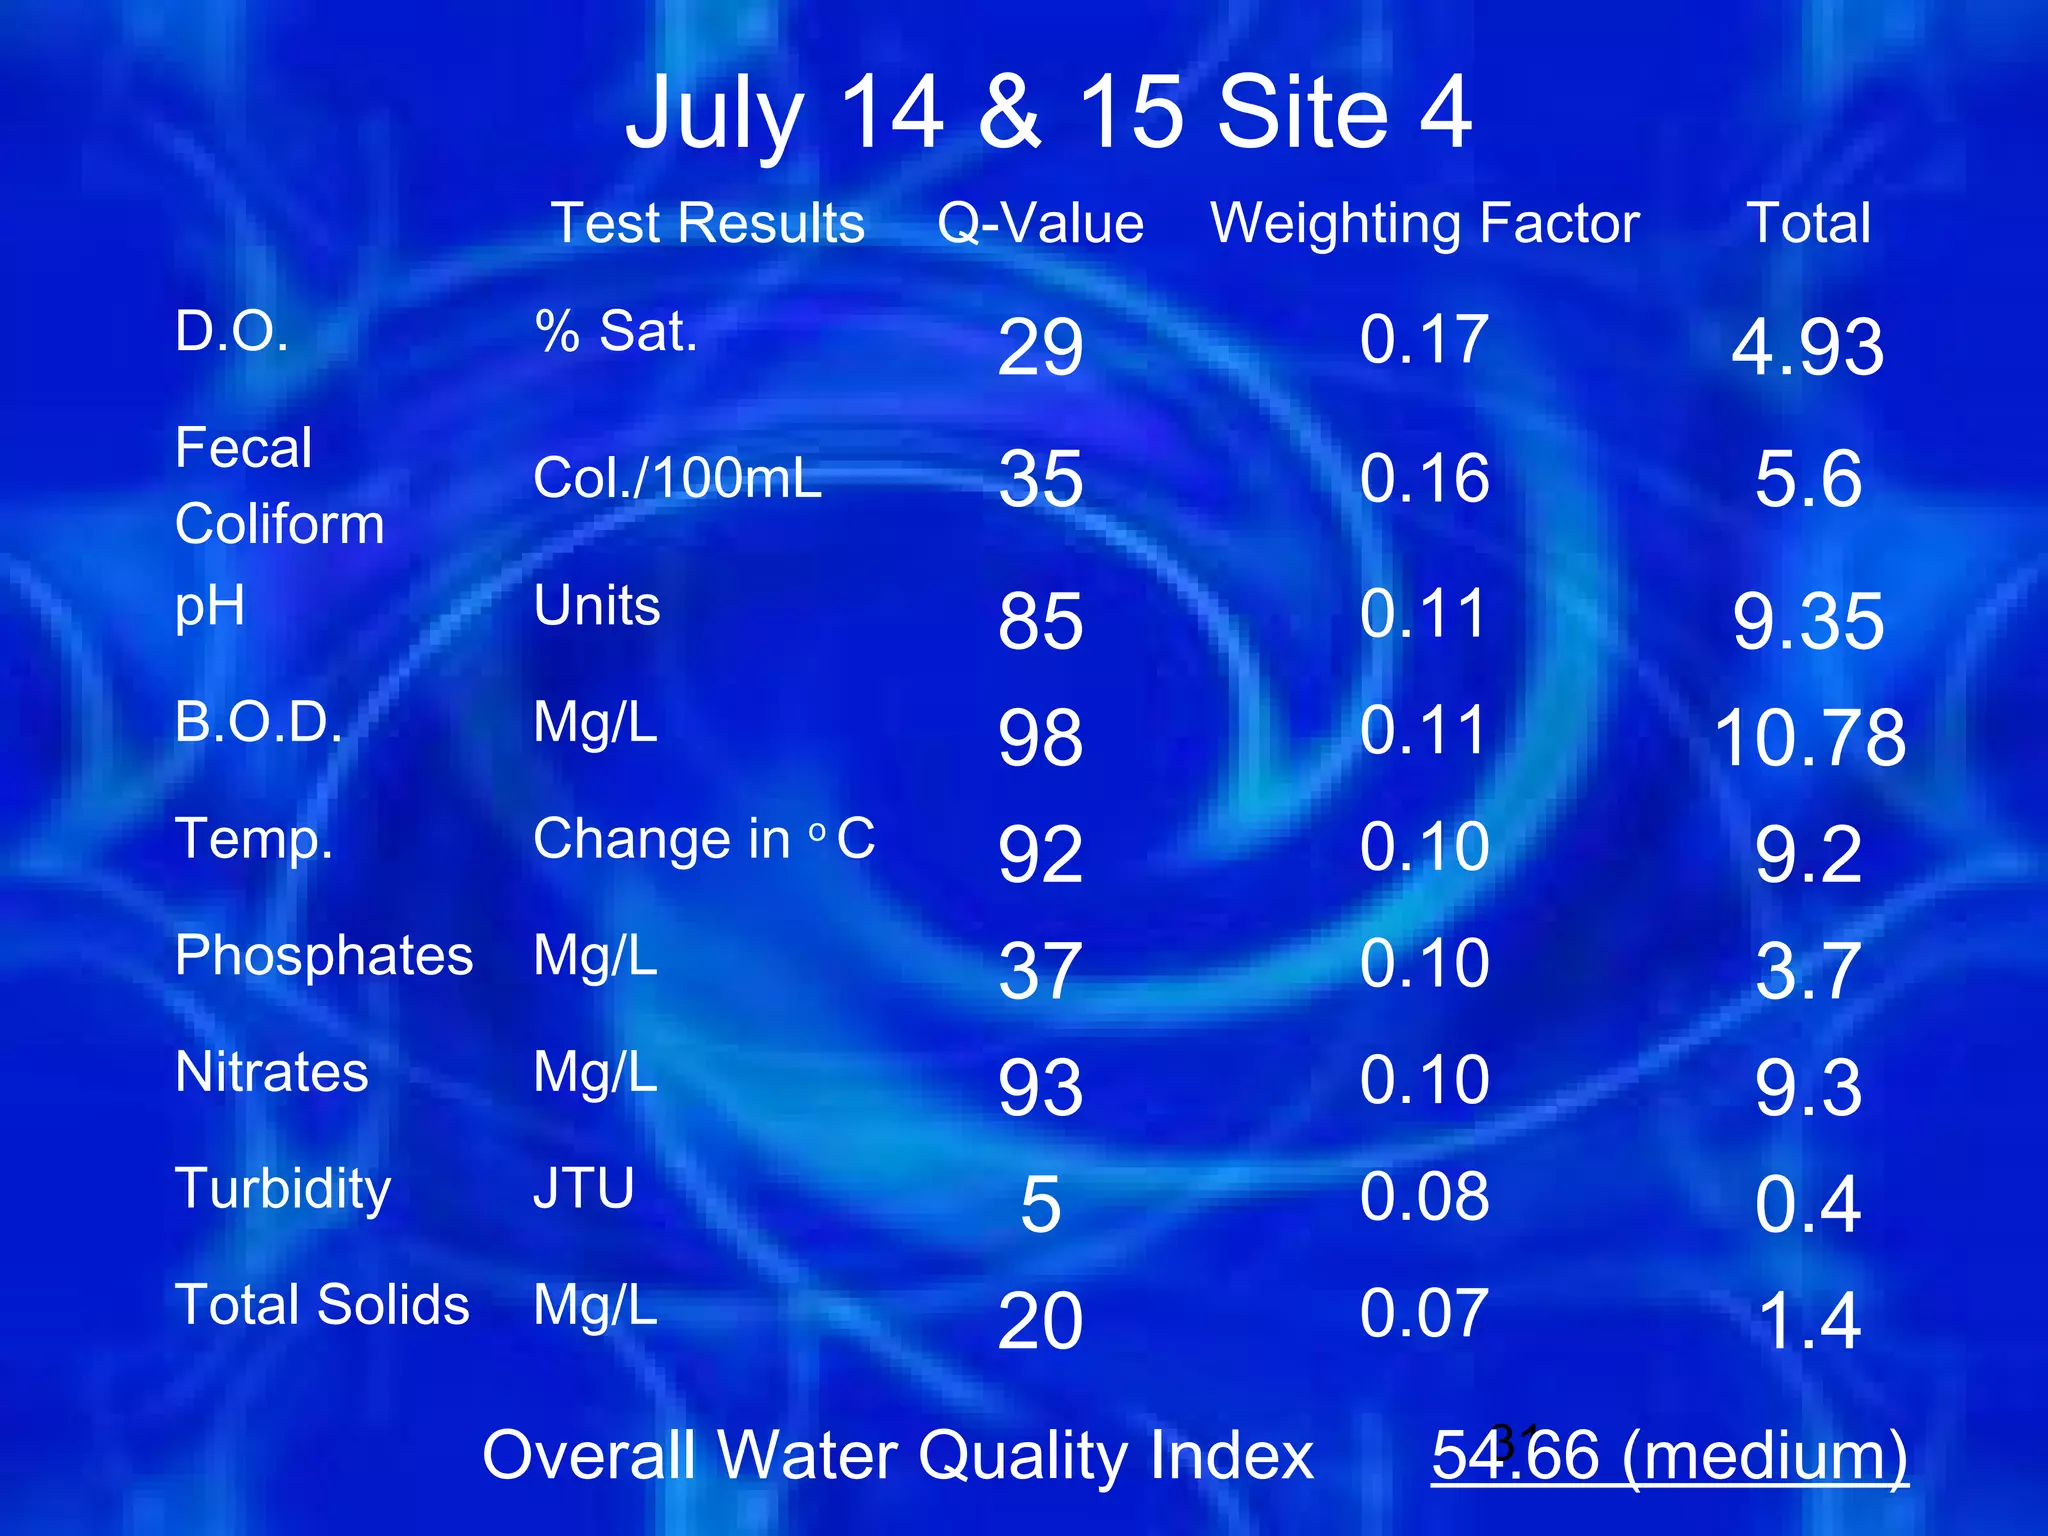
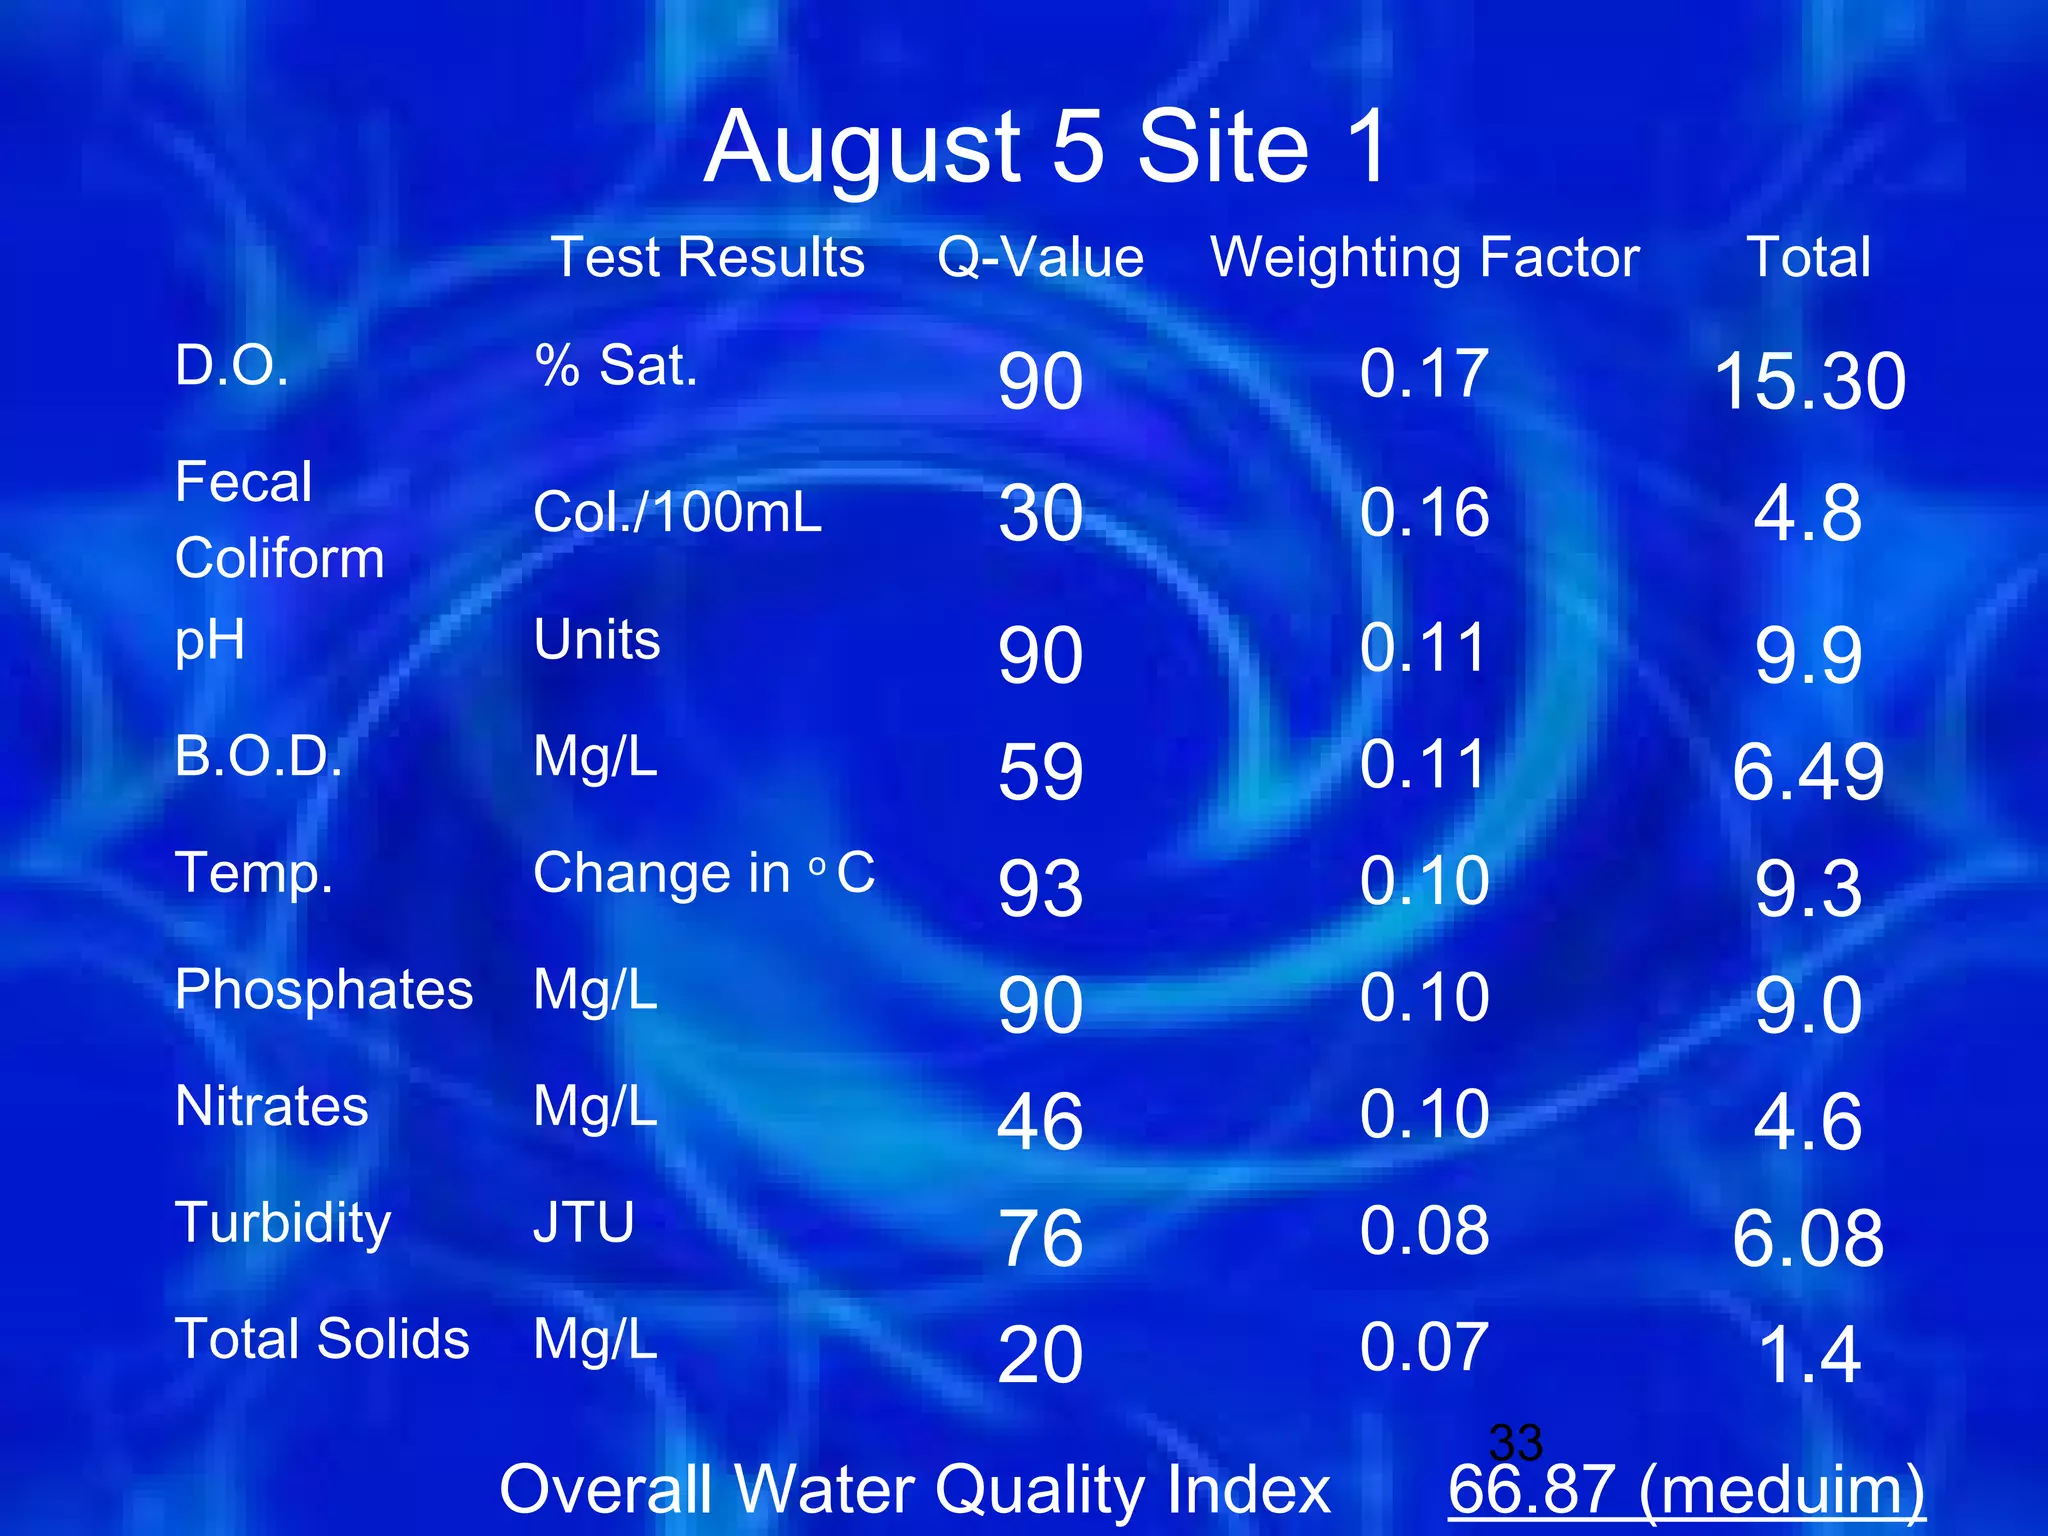
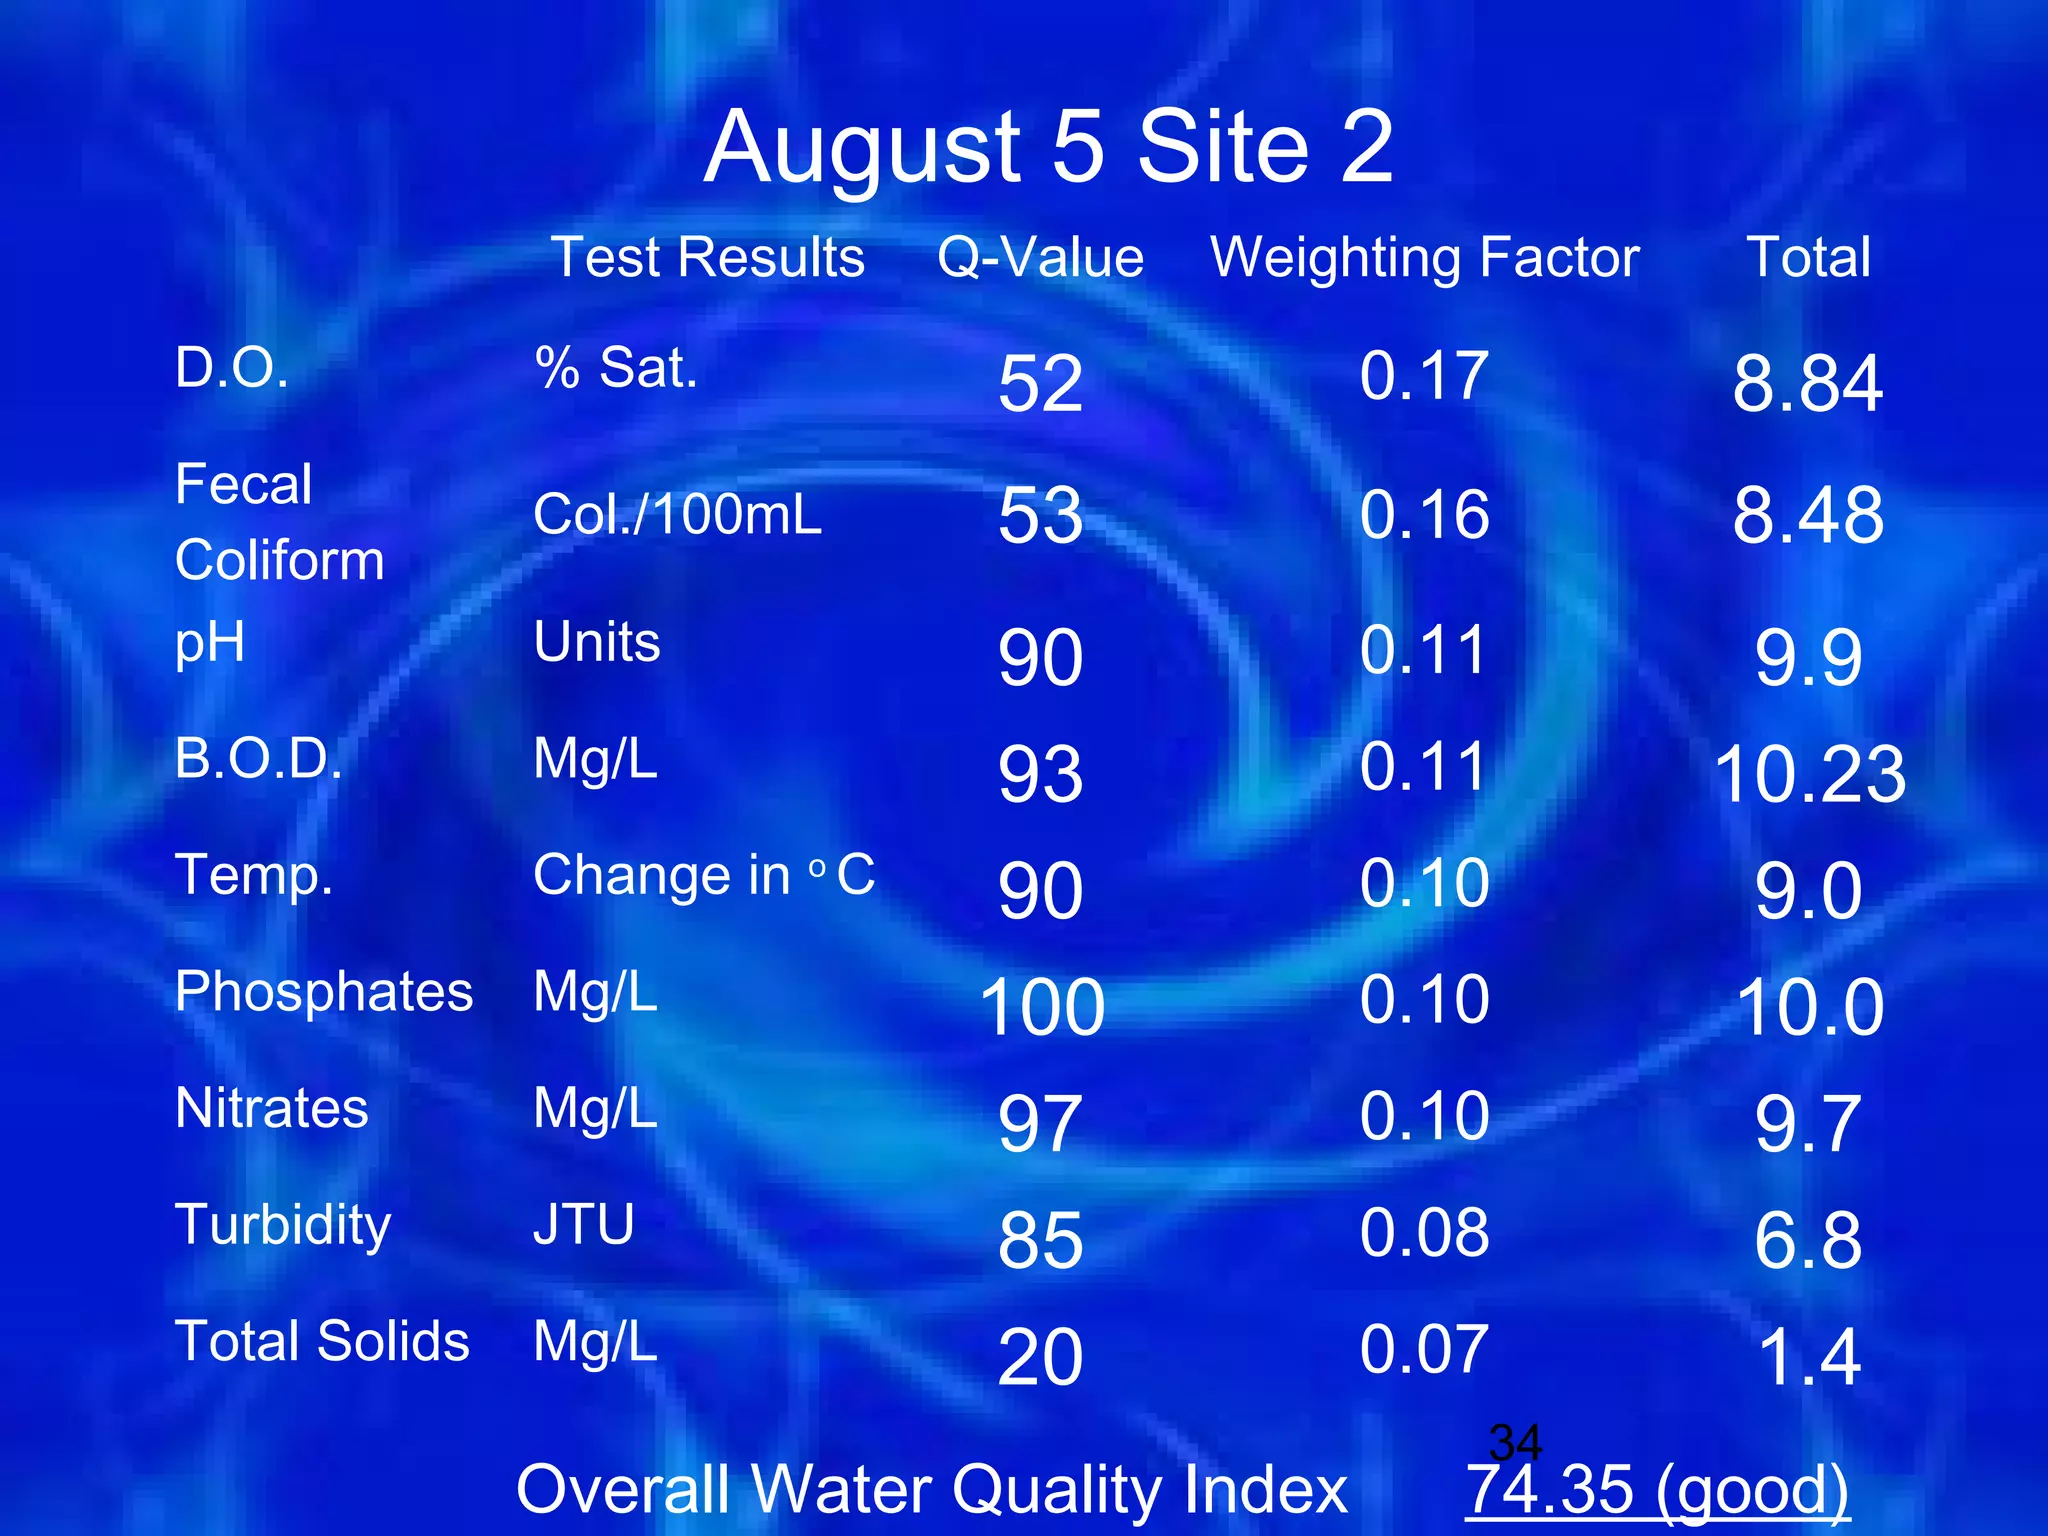
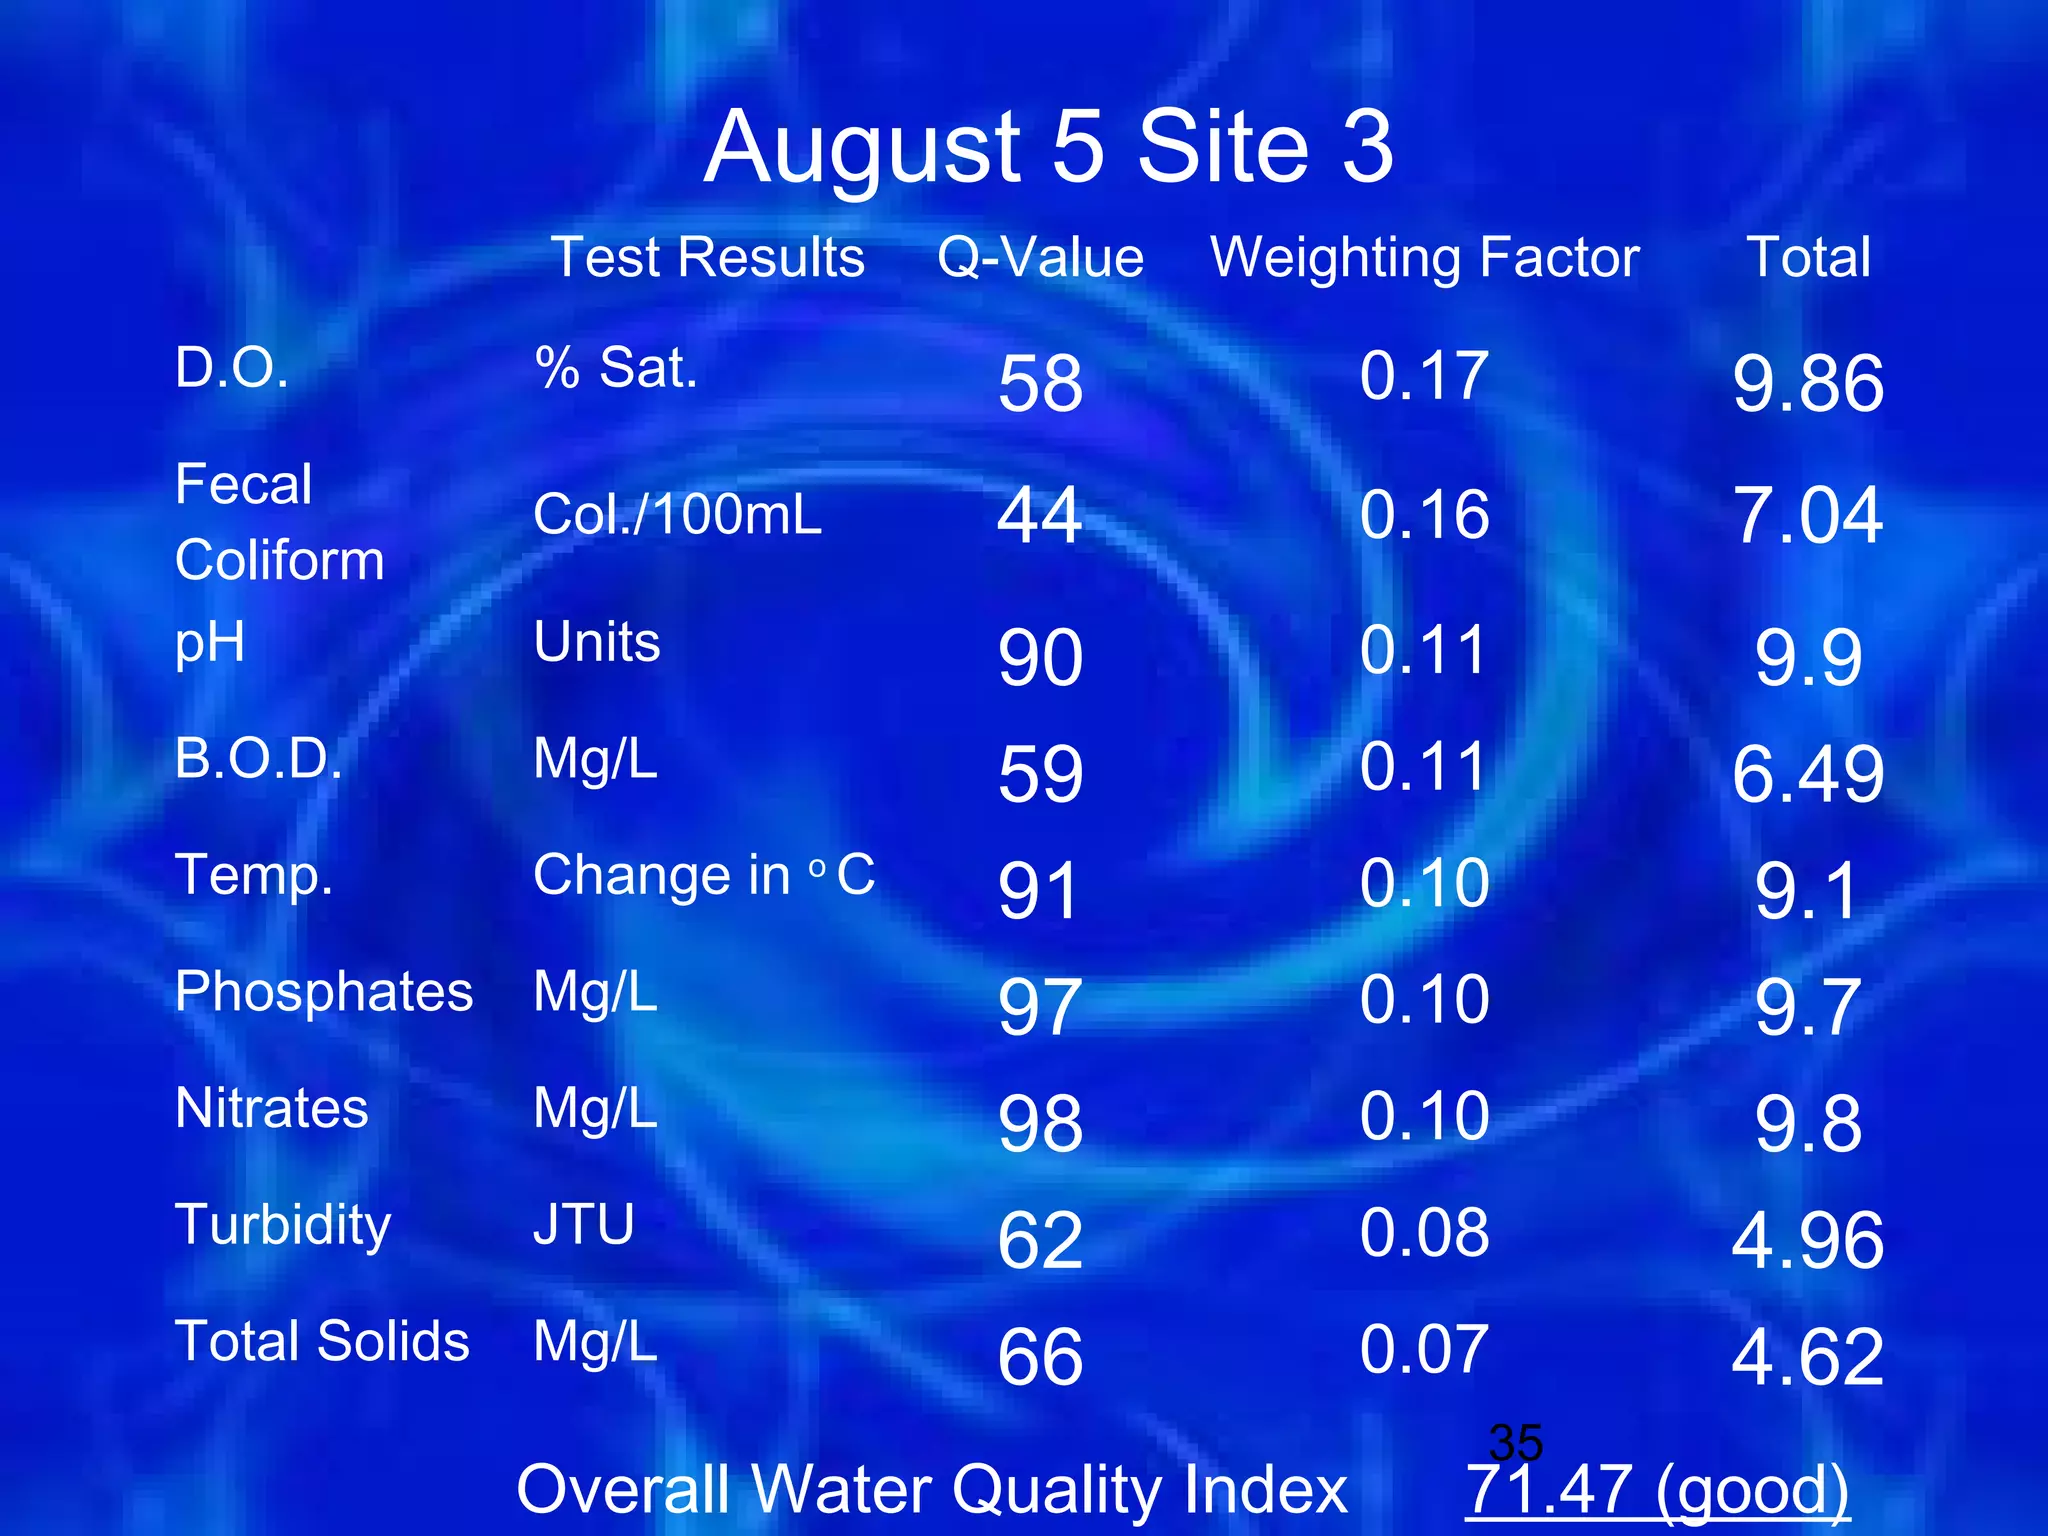
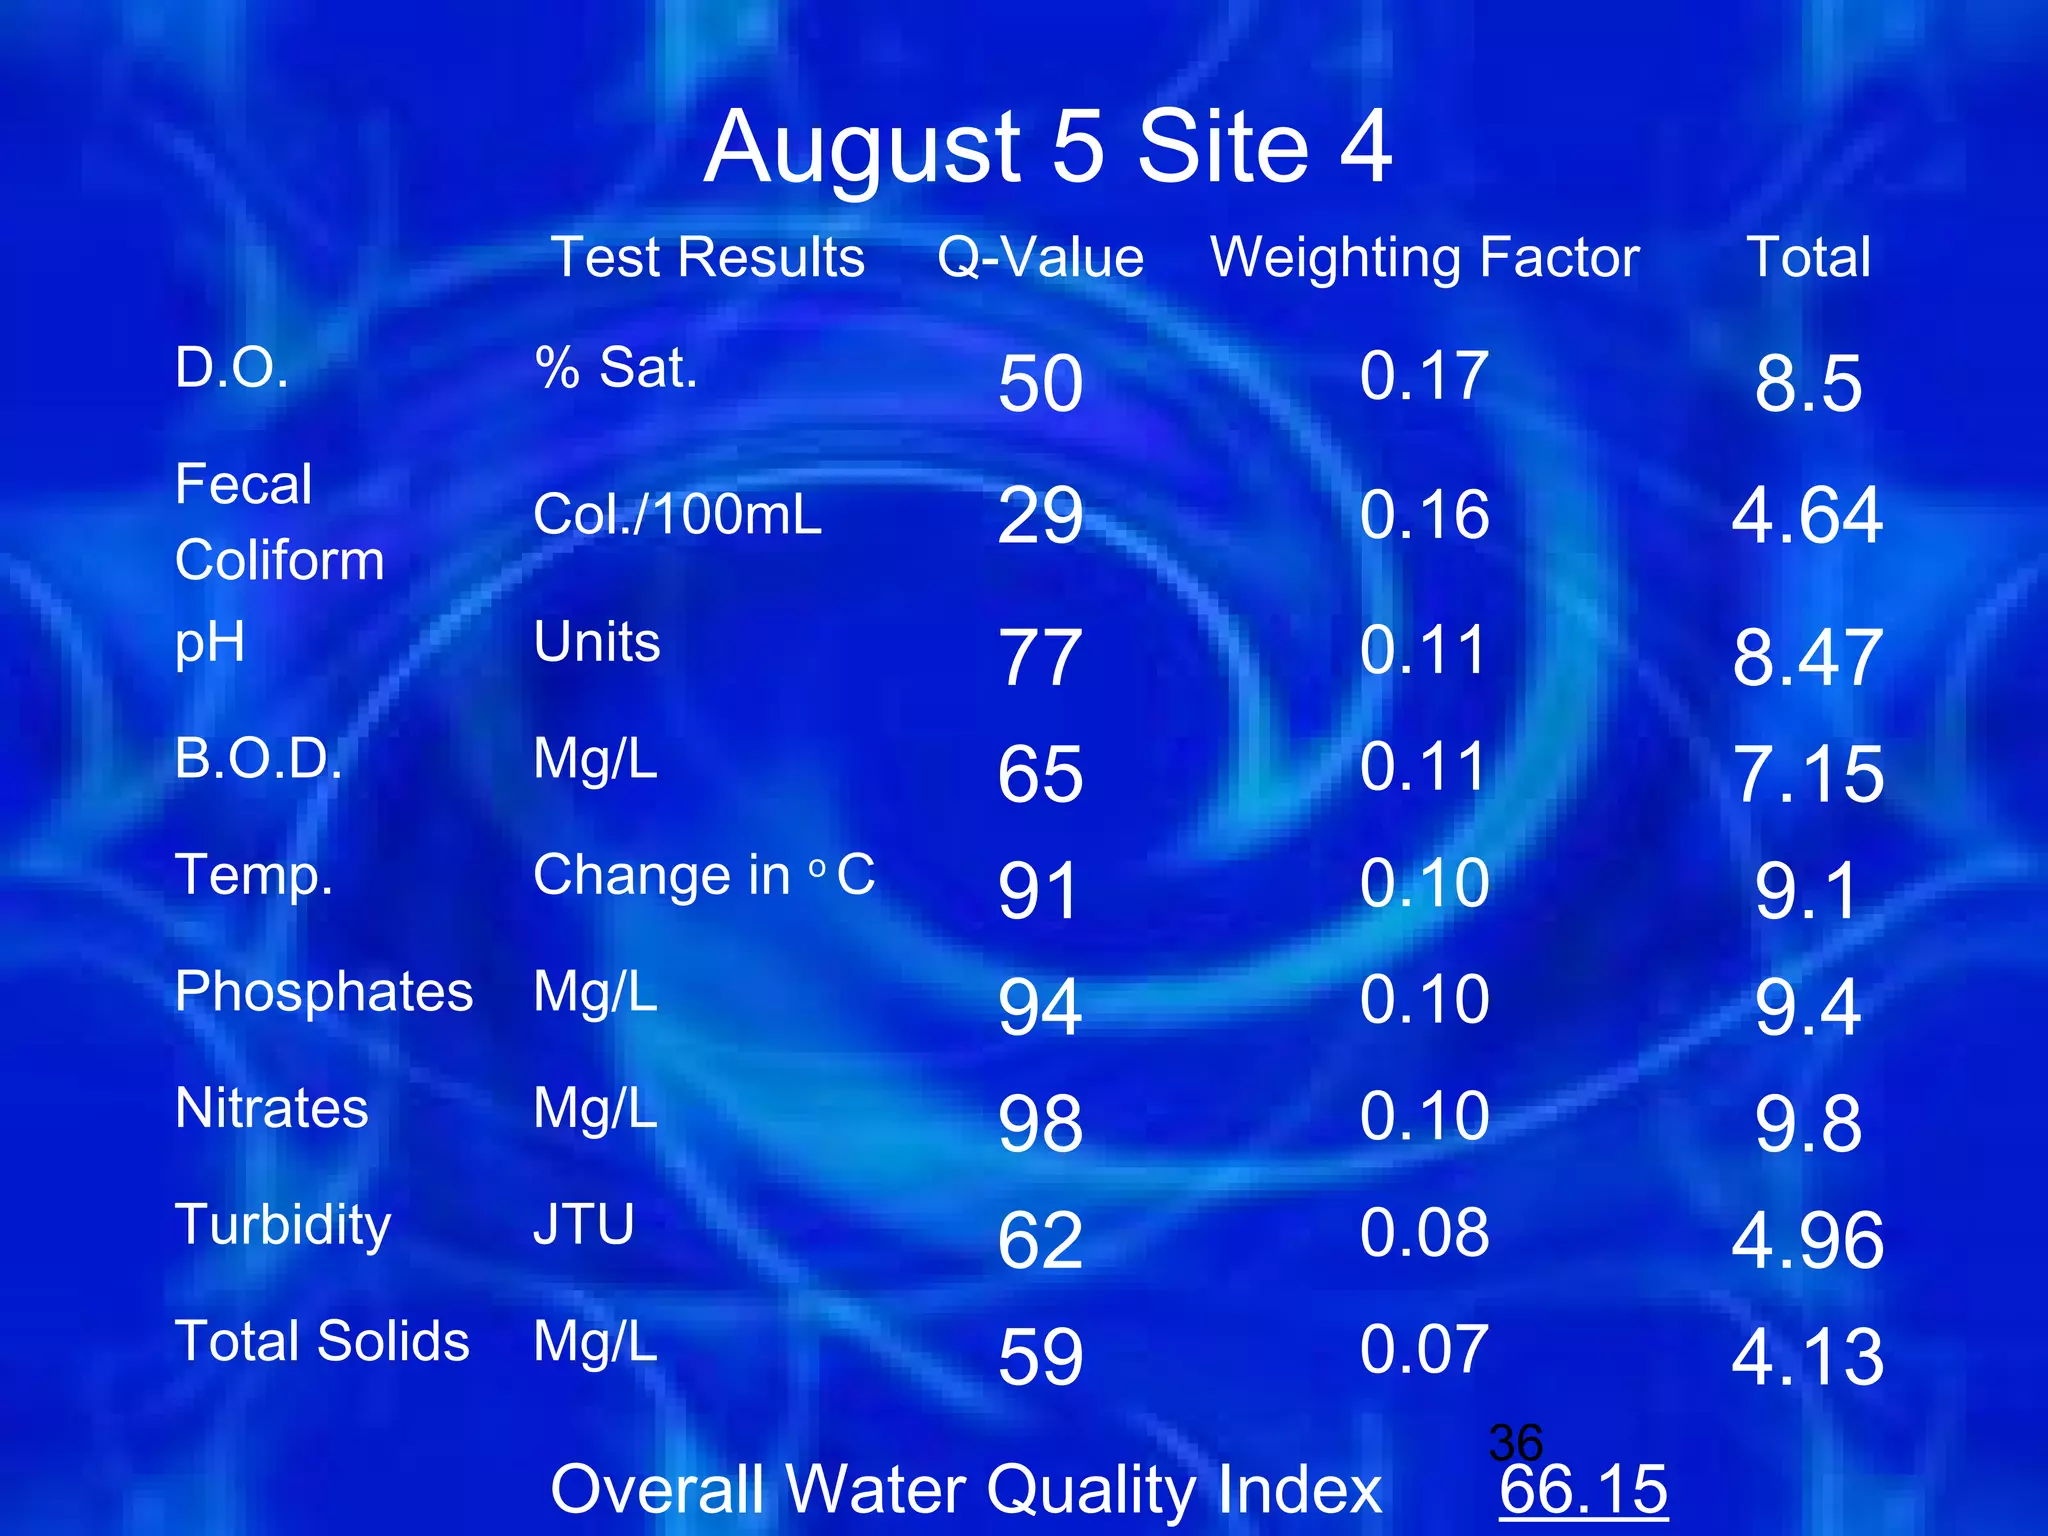
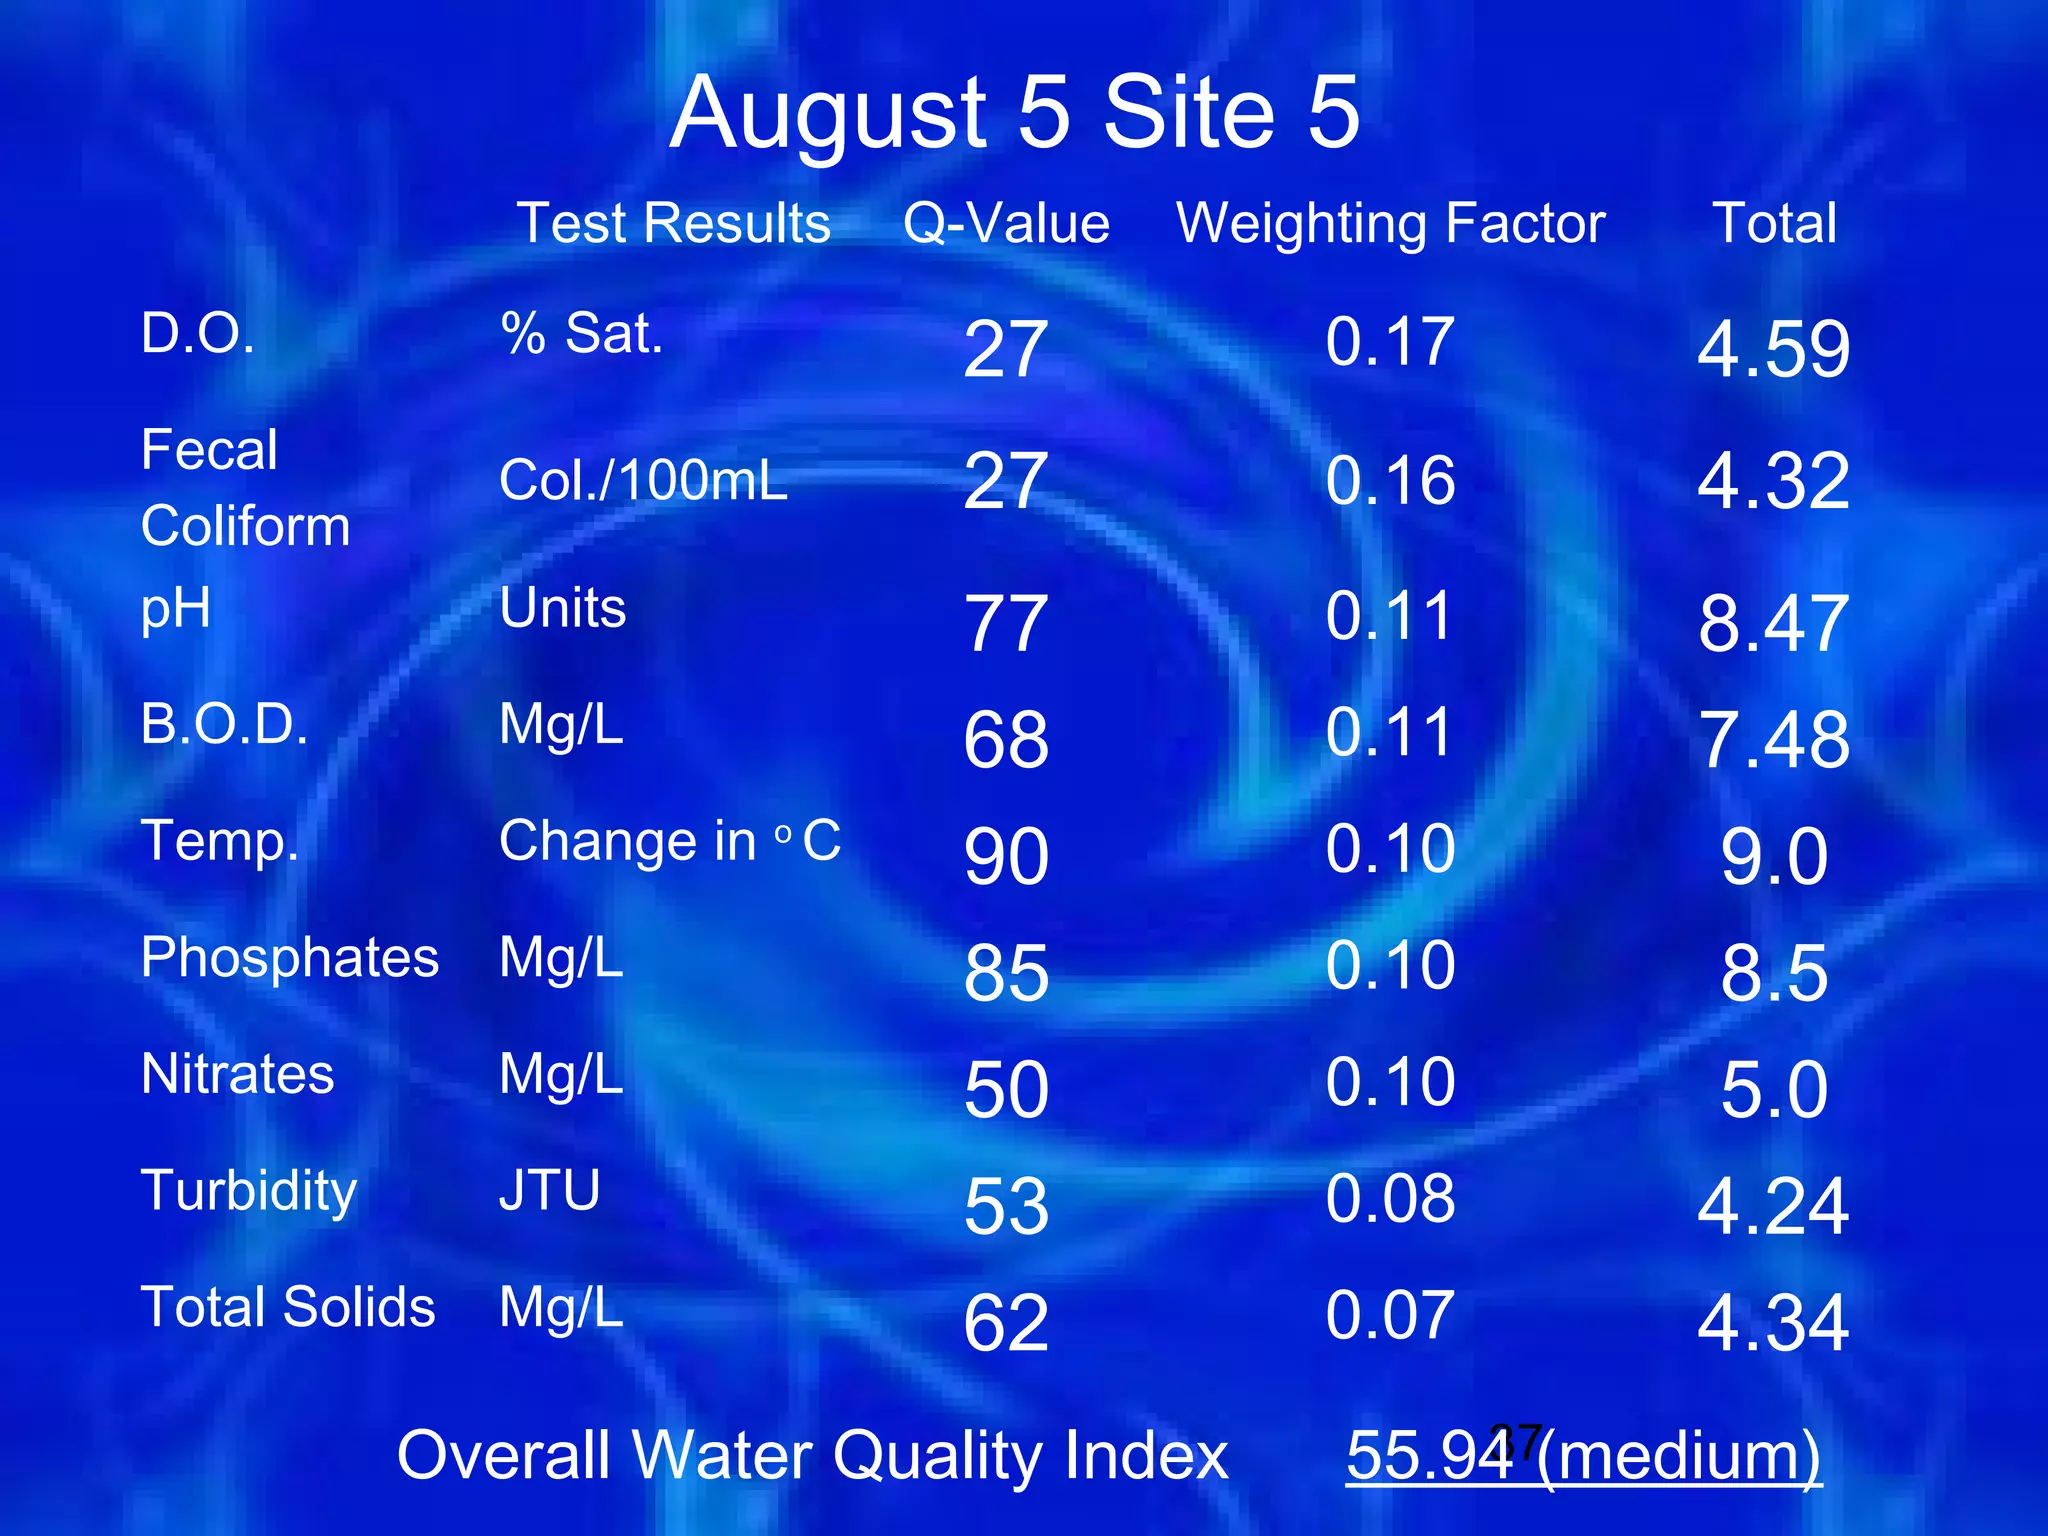
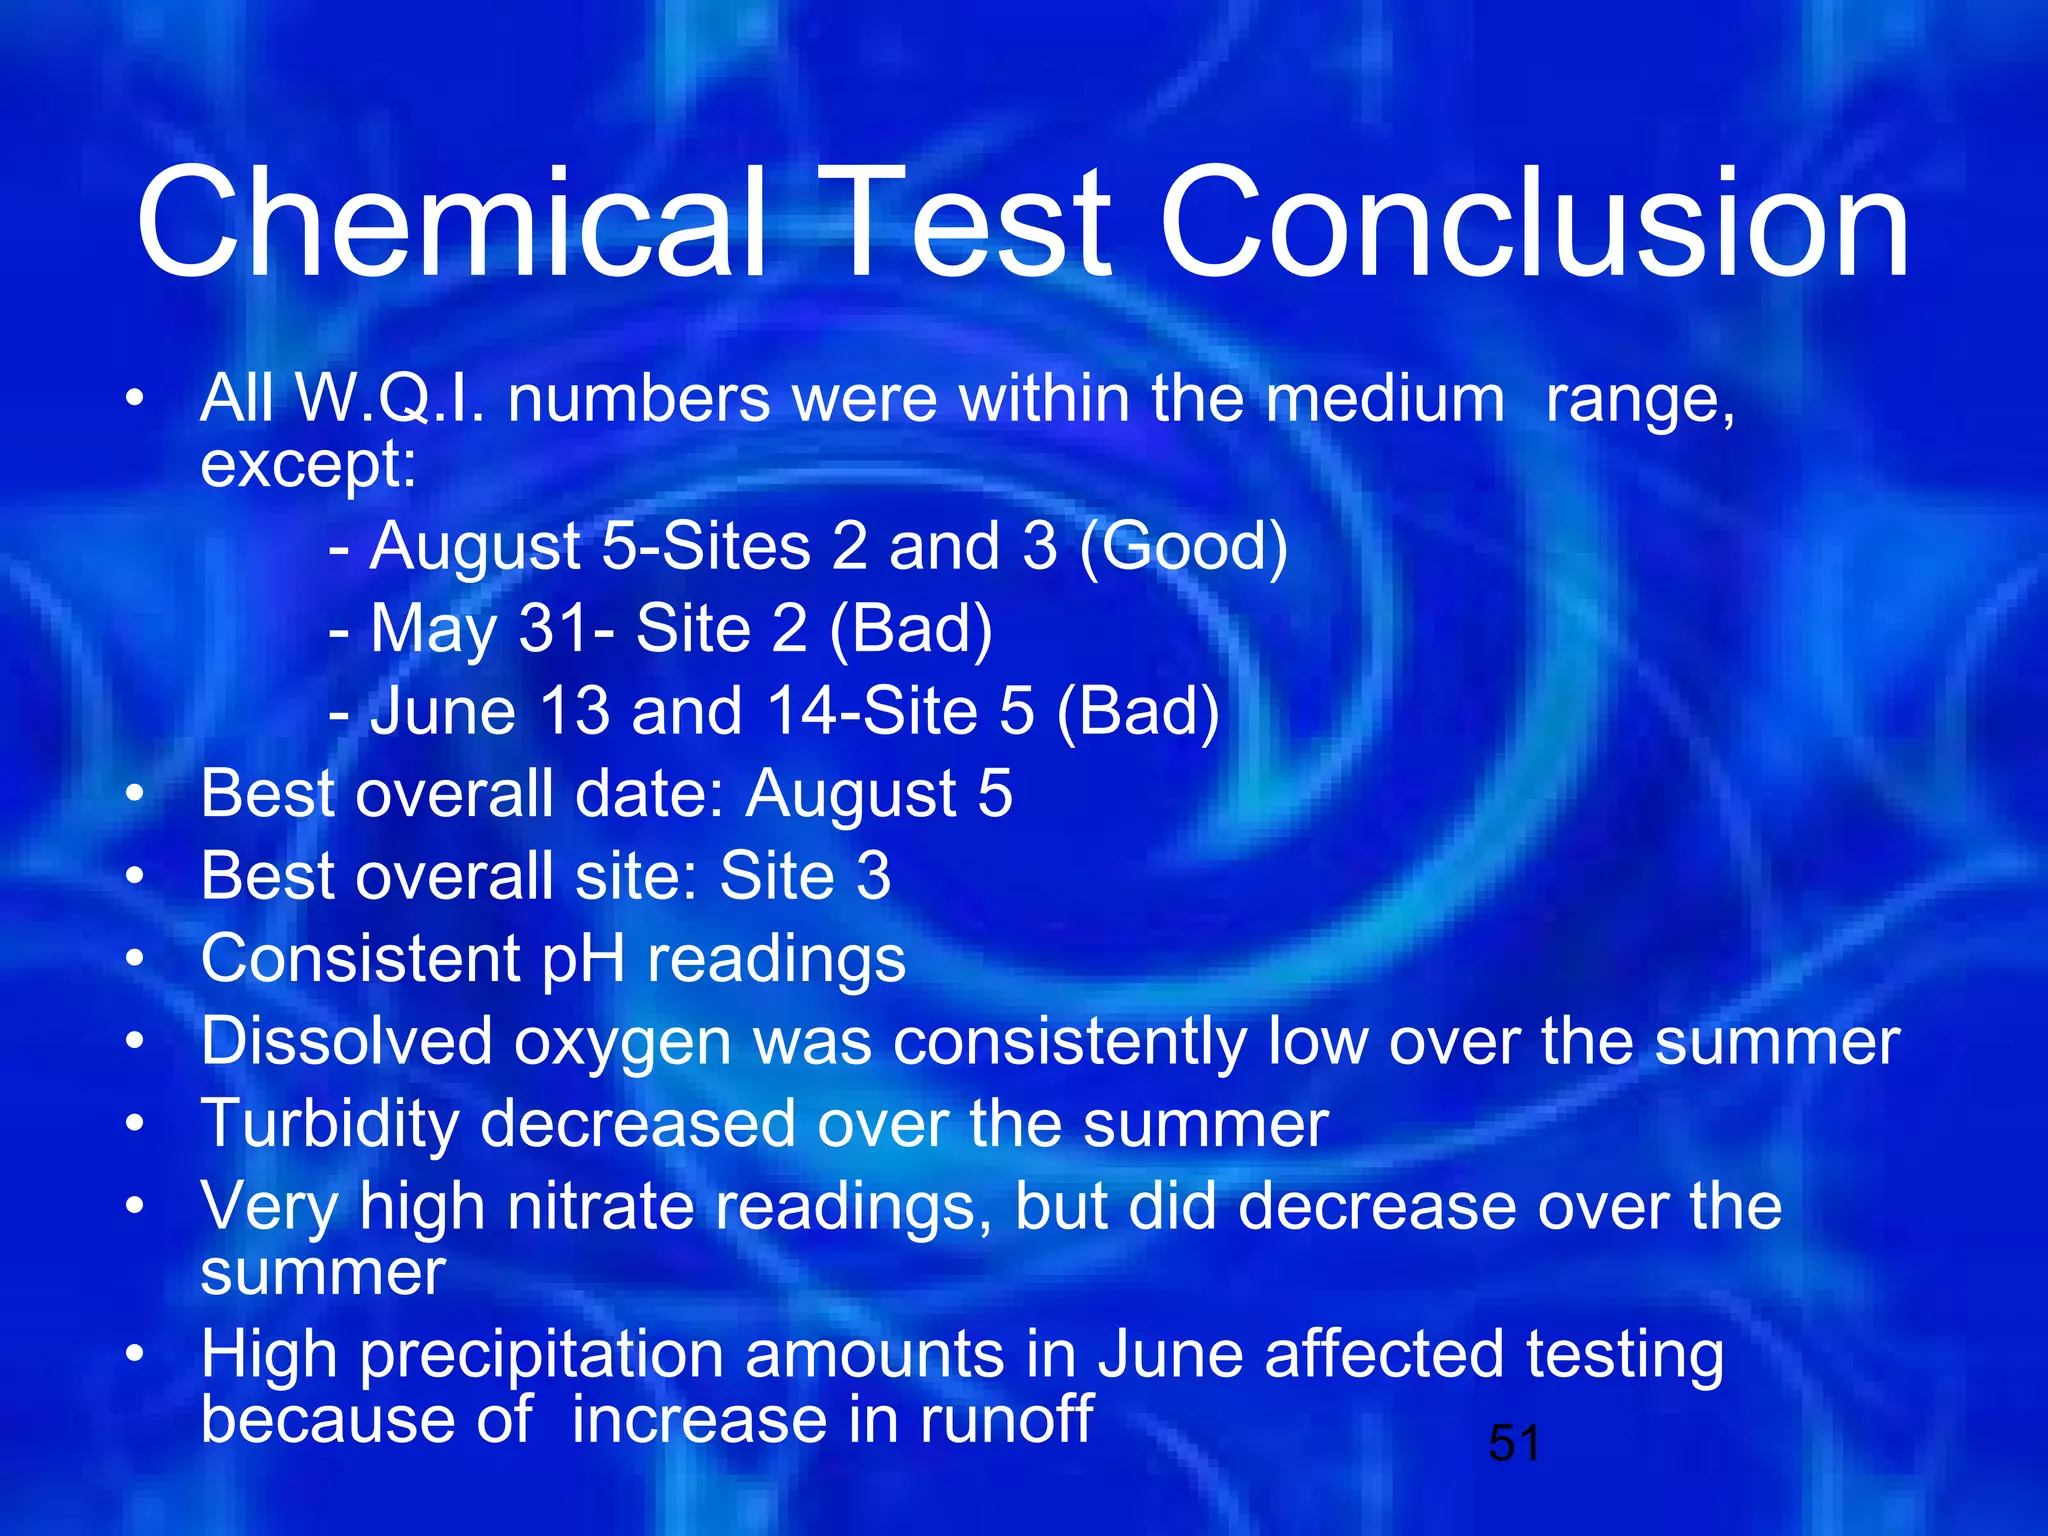
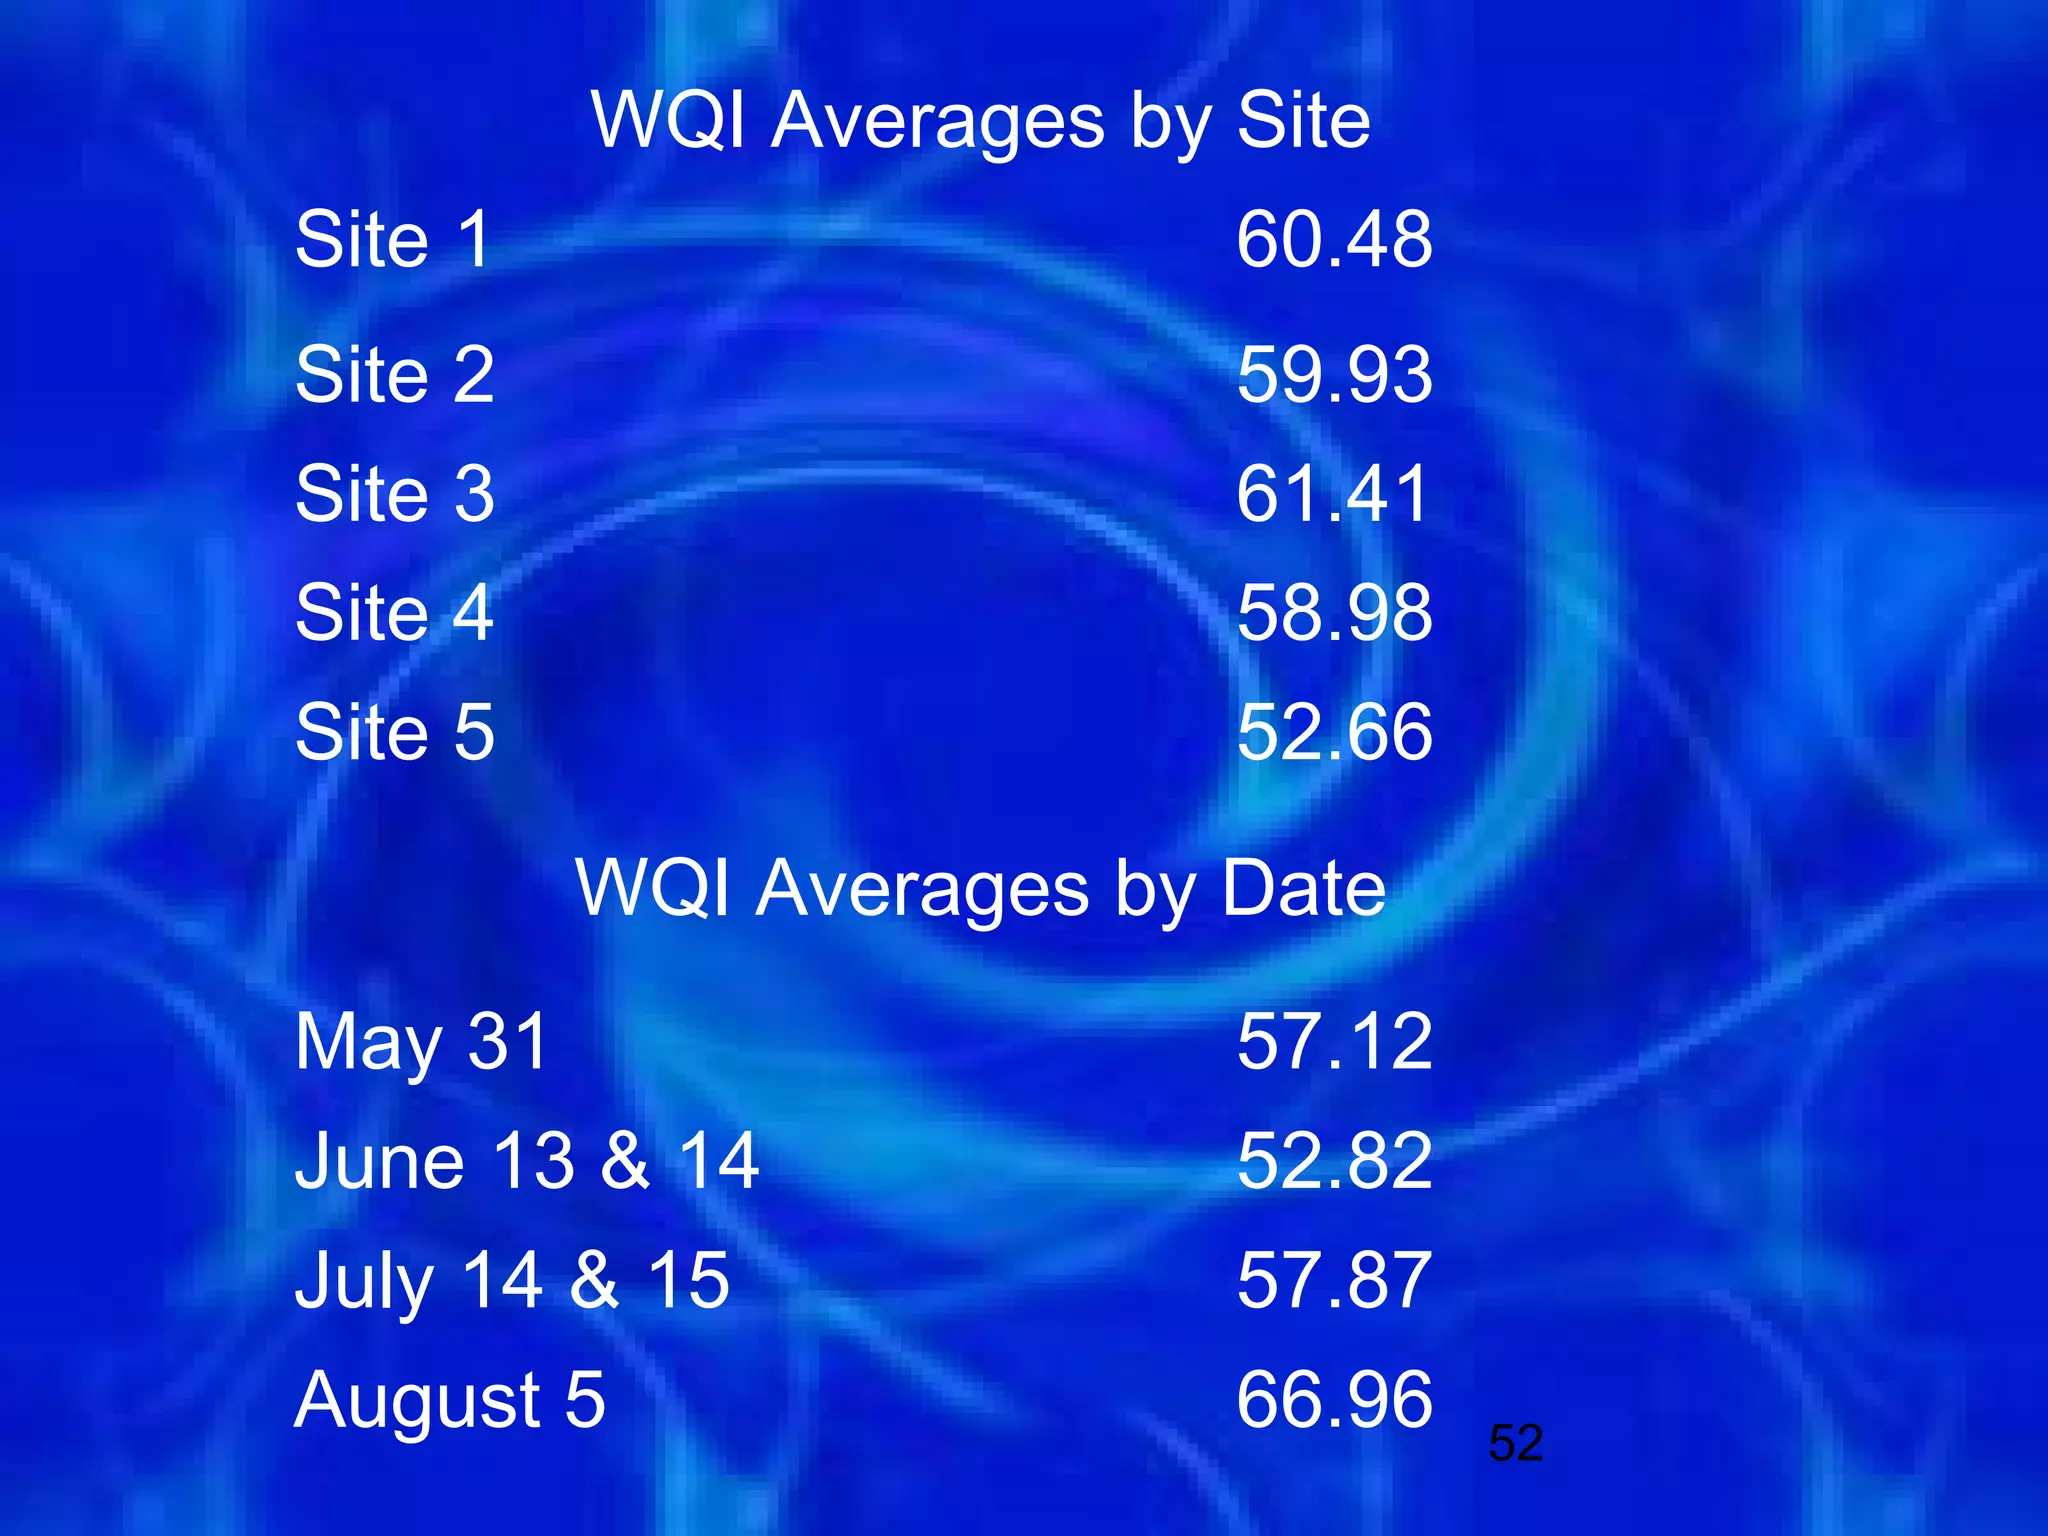
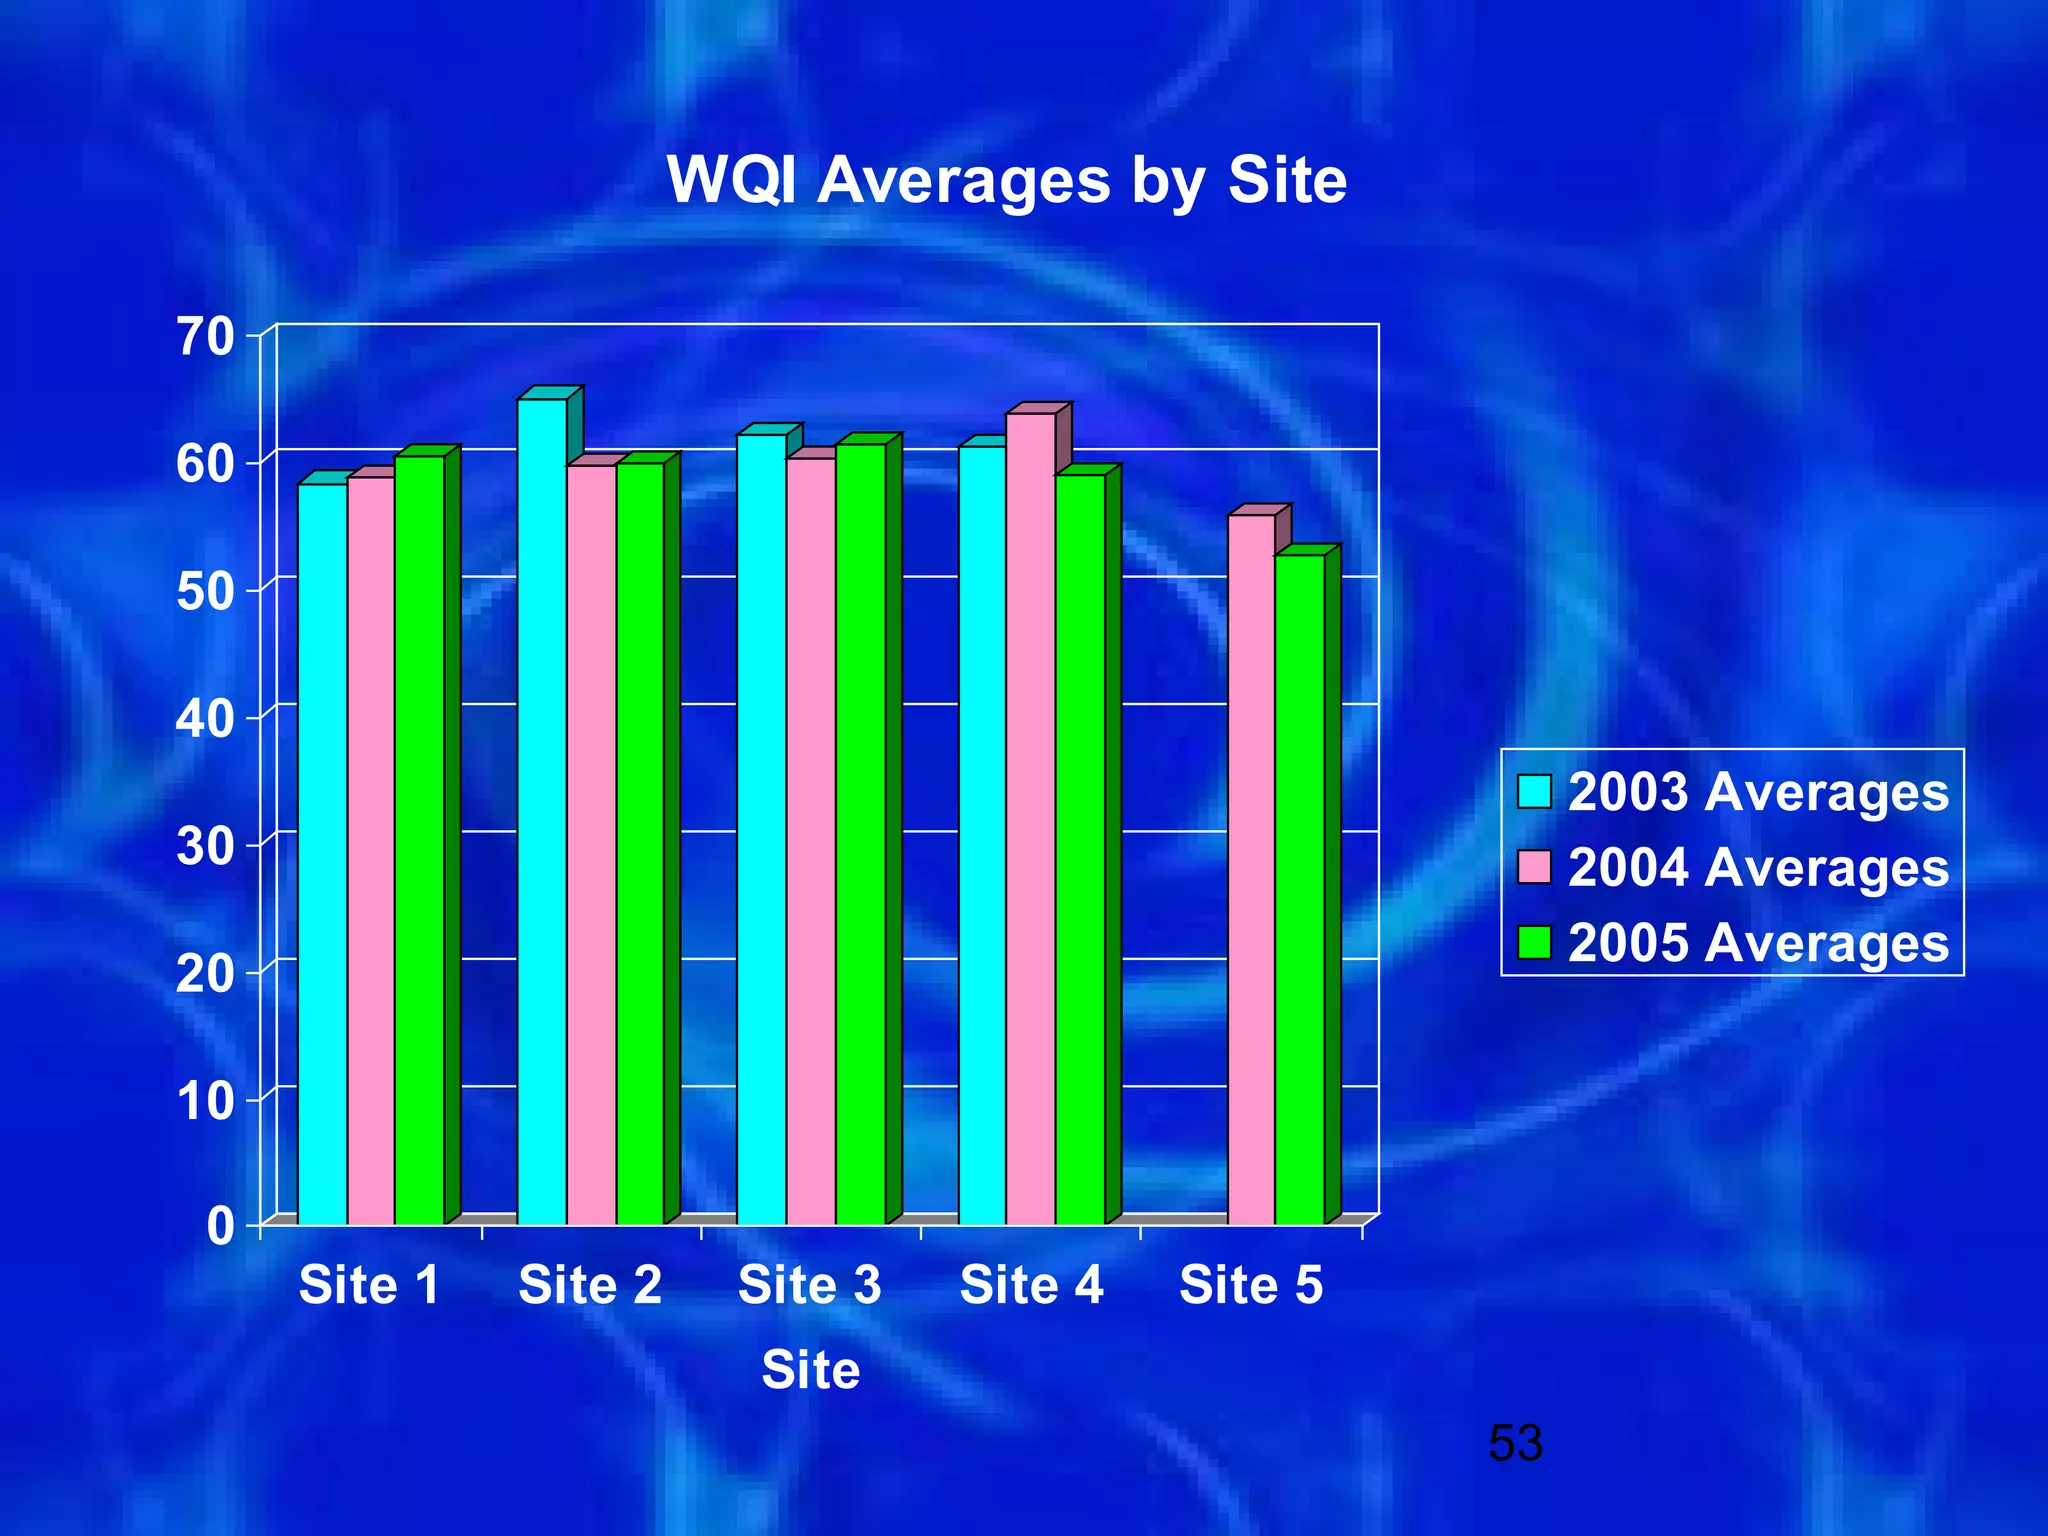
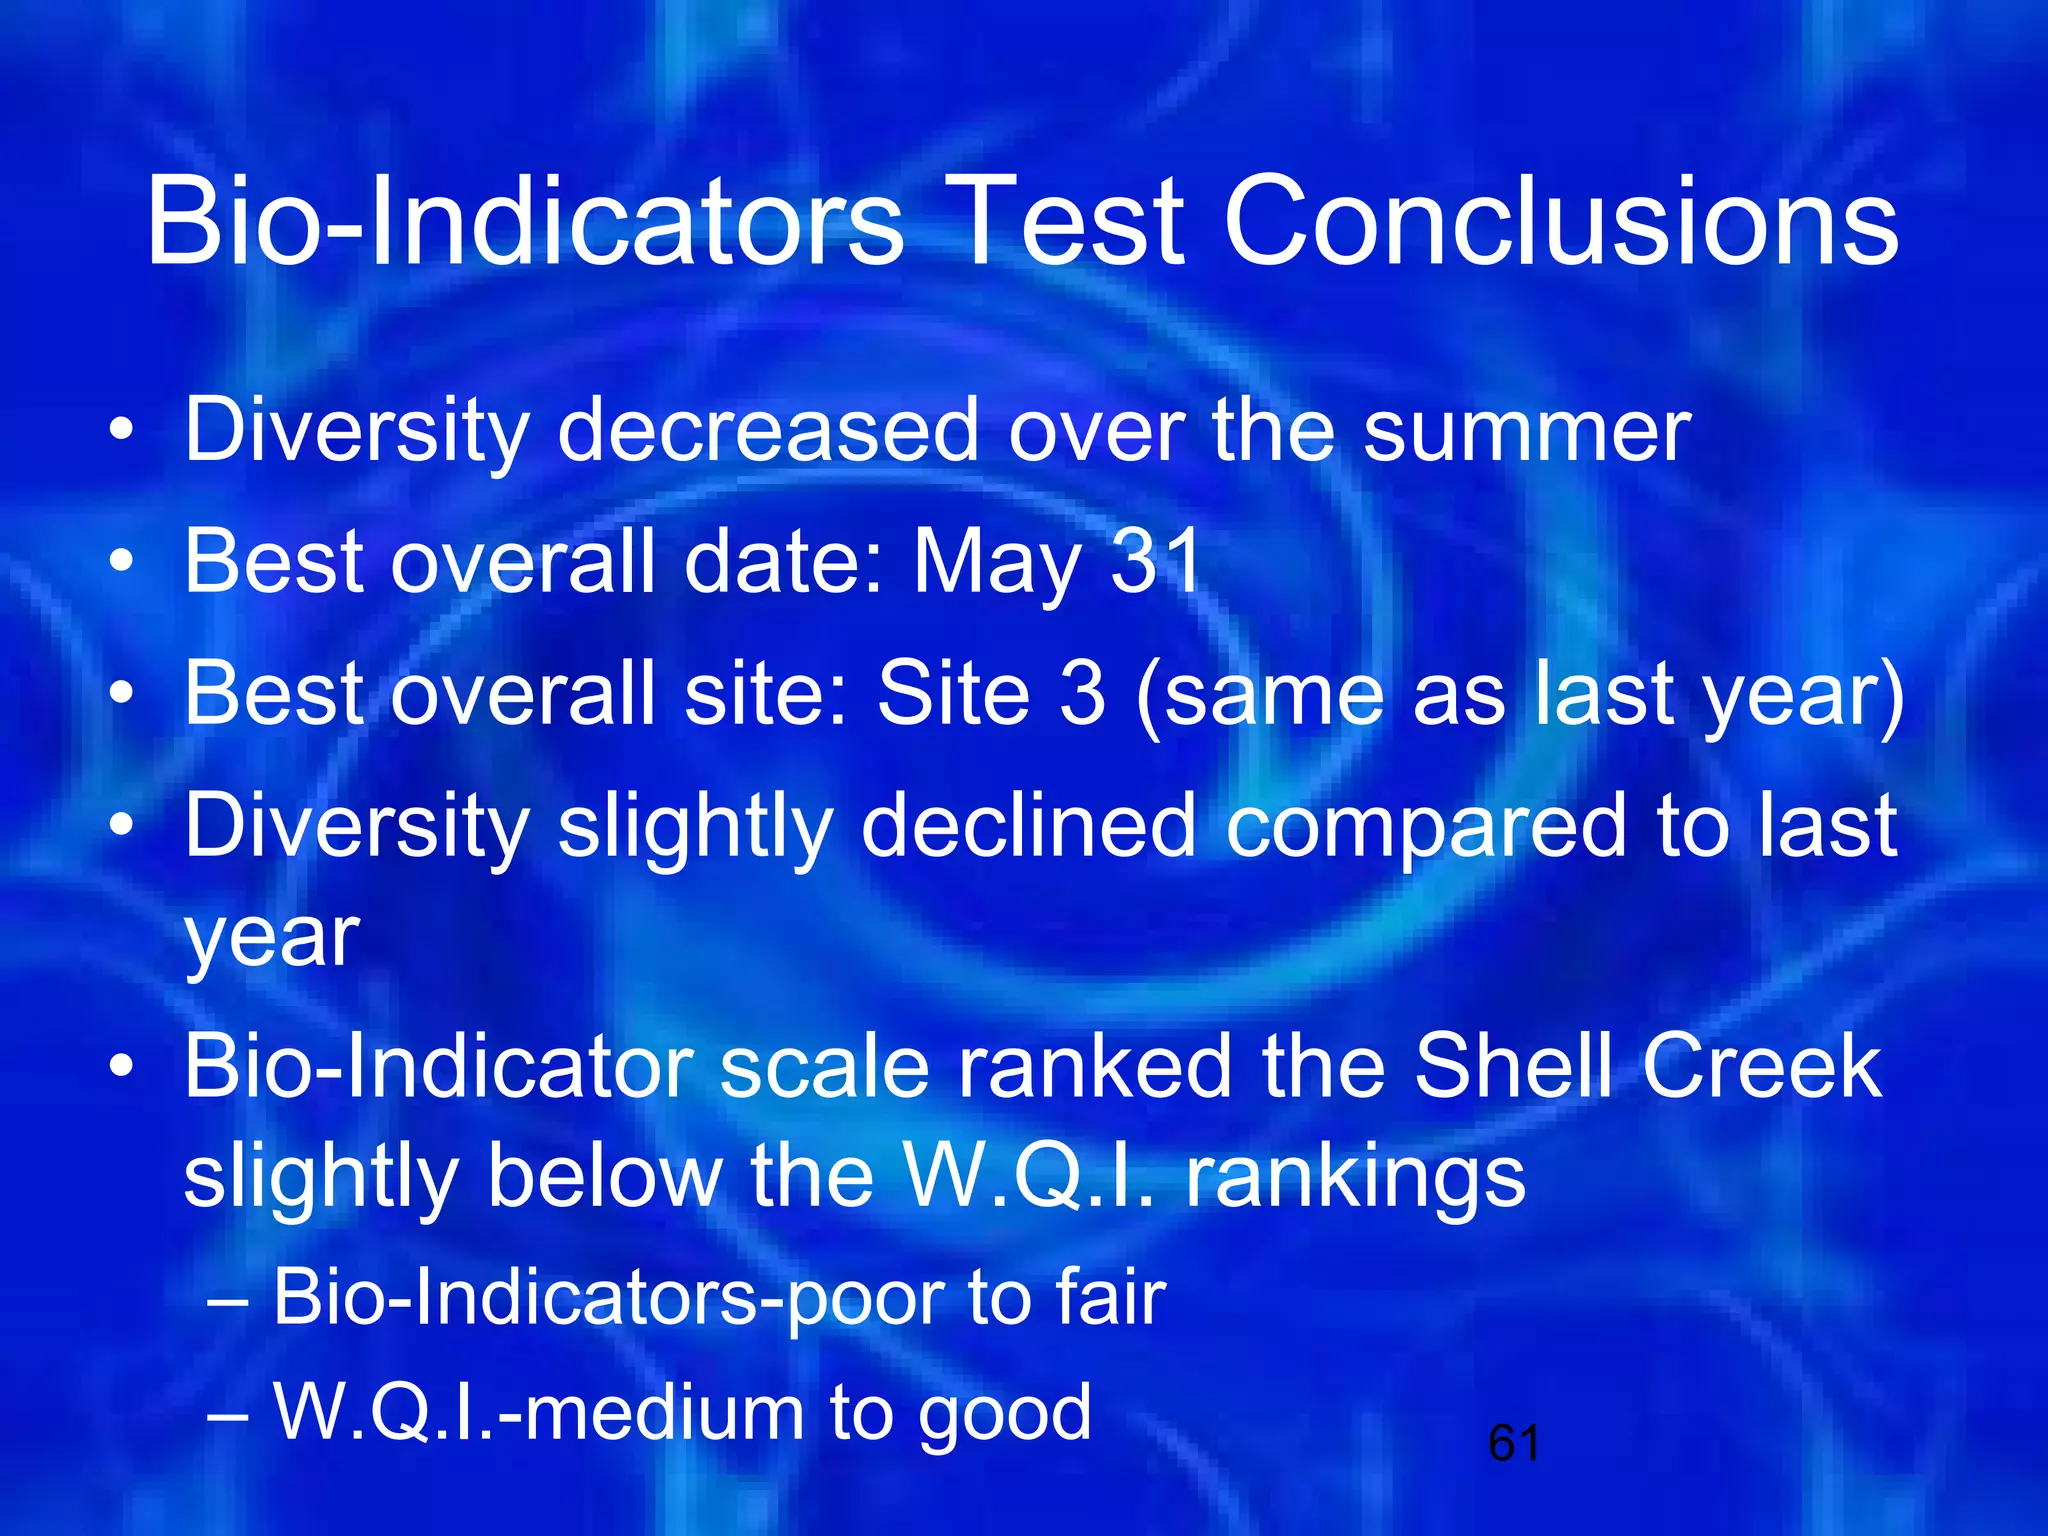
- Used the results to calculate a Water Quality Index on a scale of 0-100 for each site and date, with lower numbers indicating worse water quality.
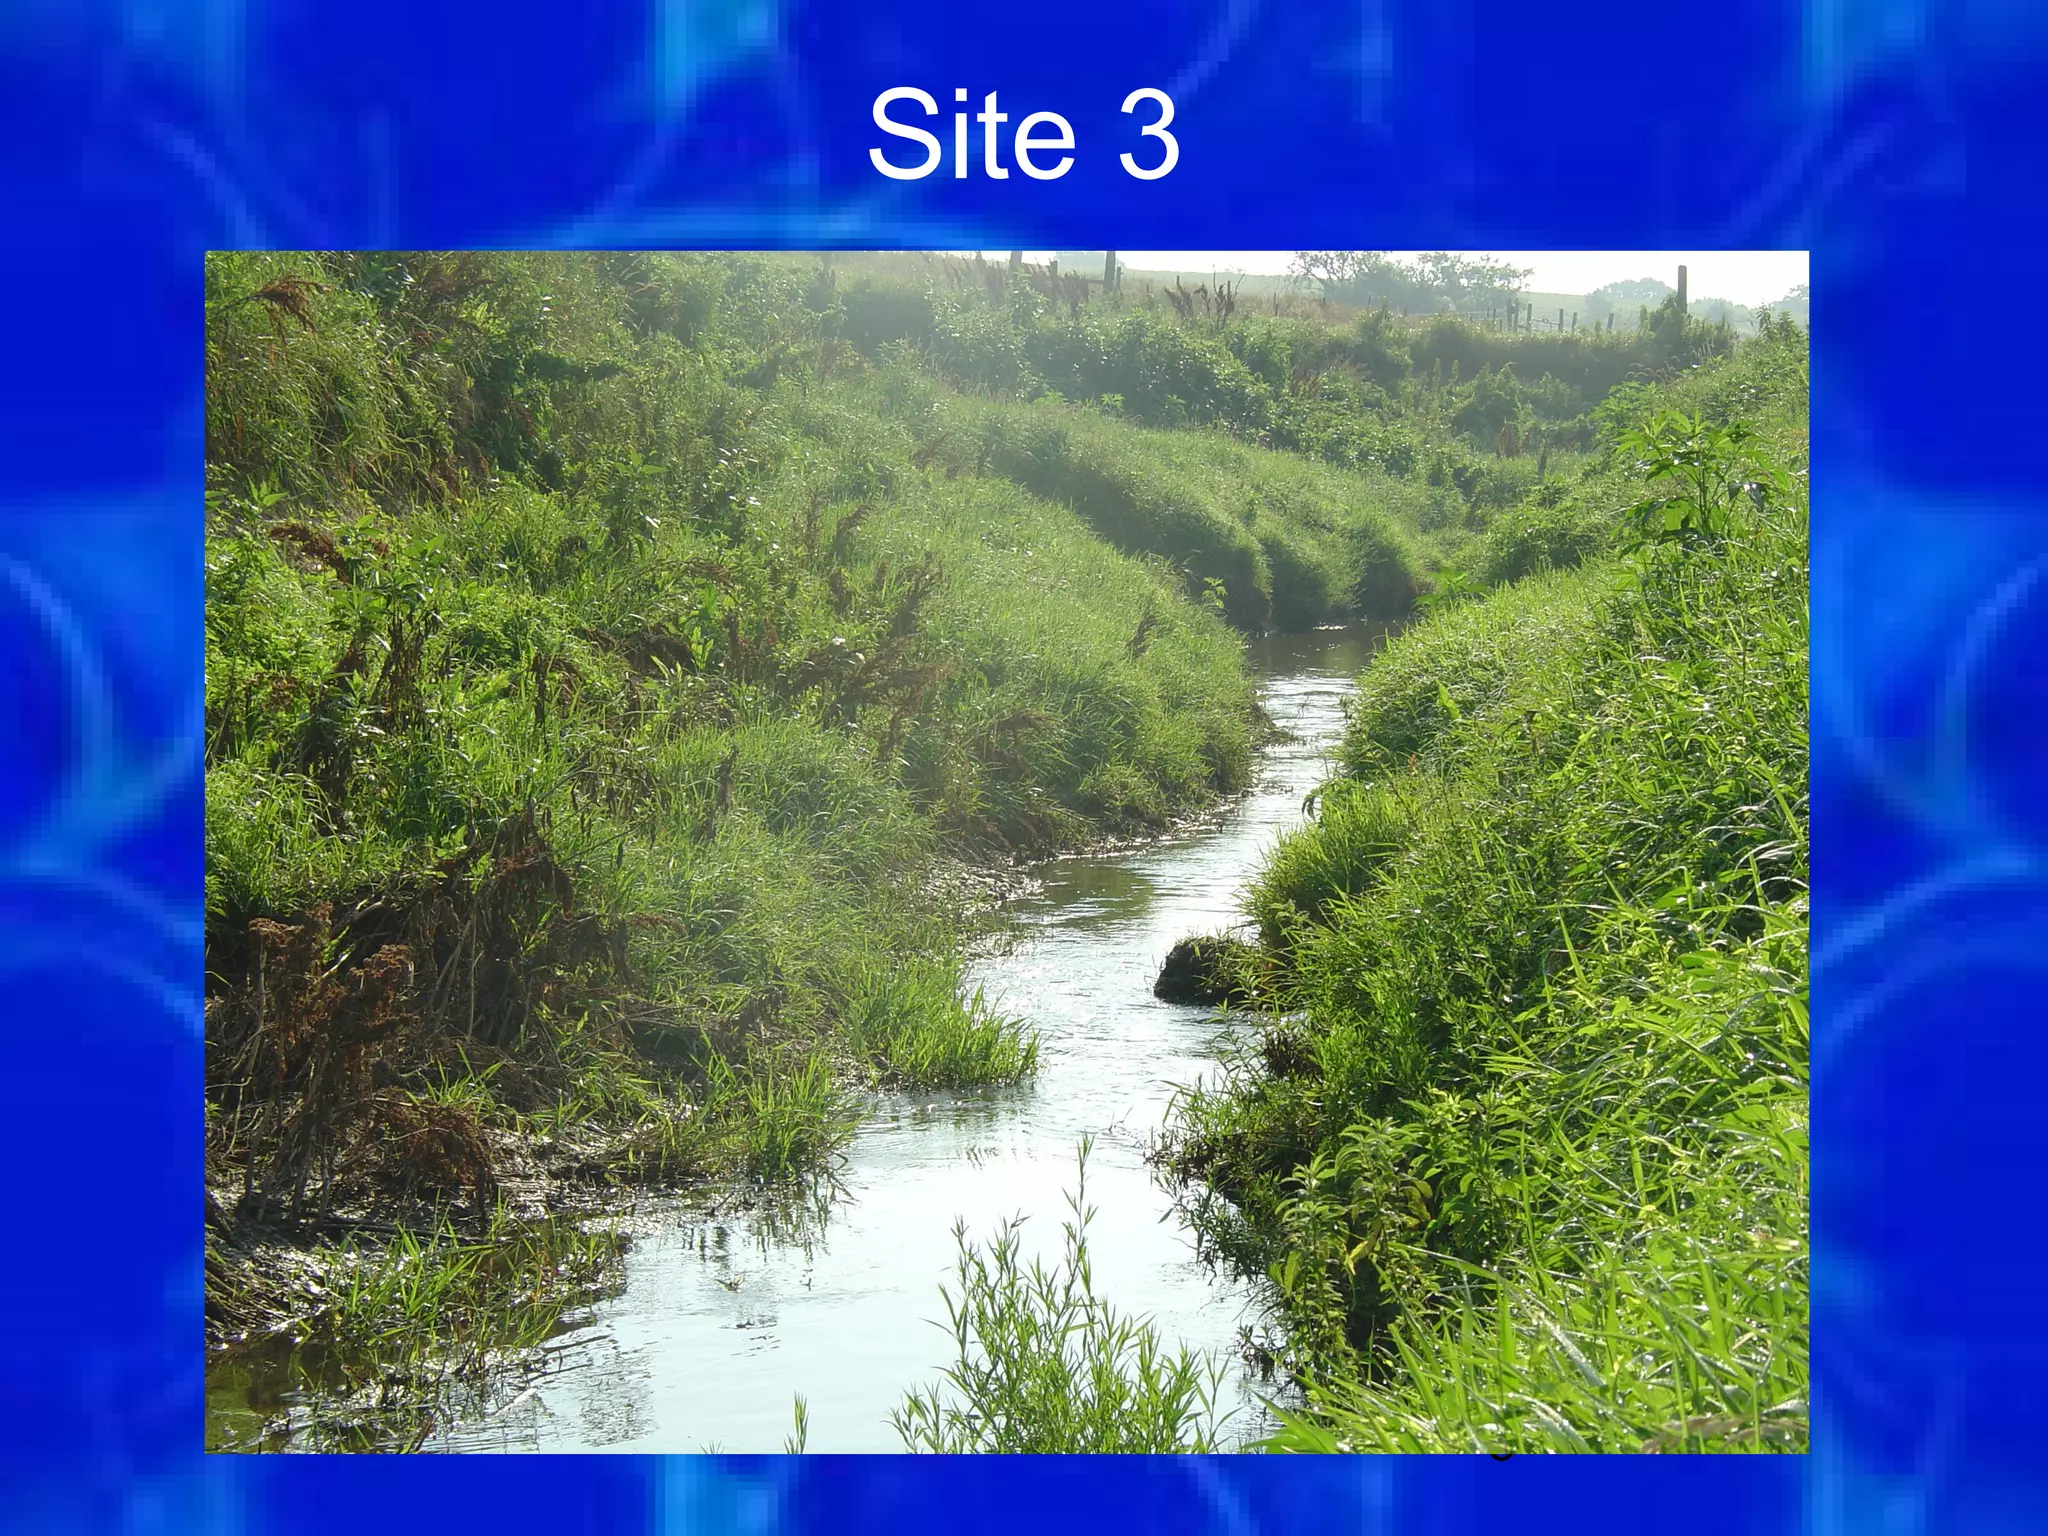
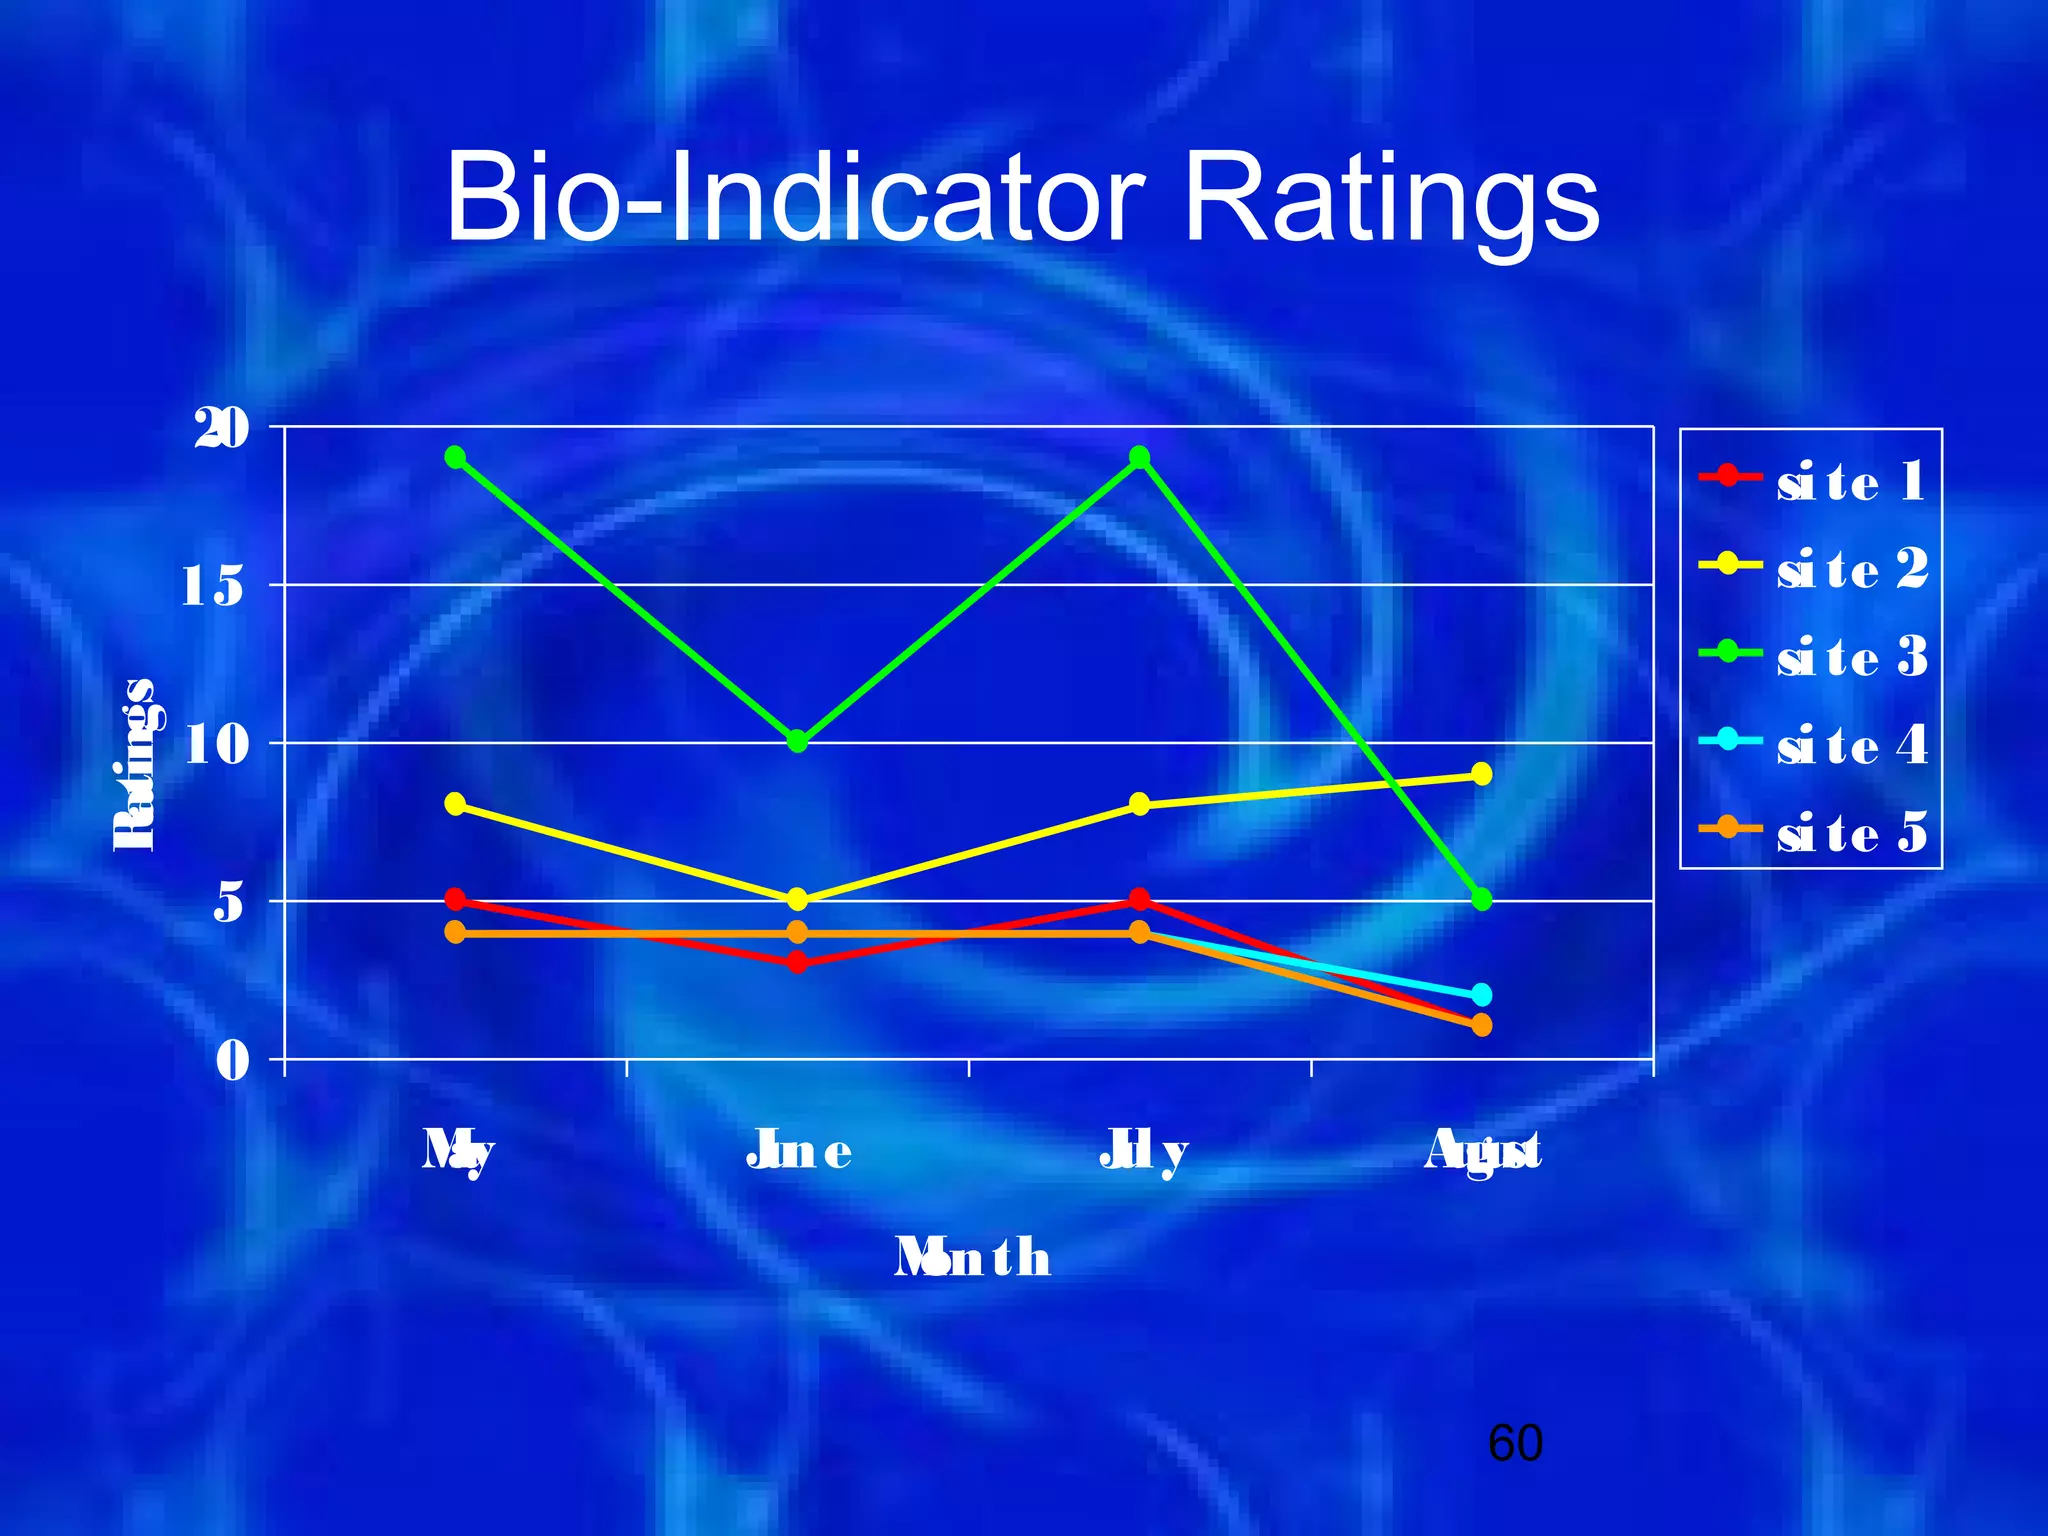
- In May, sites ranged from 48-65 on the index, indicating medium to bad water quality. The best site was #3 and the worst was #2.
- Water quality seemed to decline from May to June based on the index scores reported for two sites.