Downloaded 12 times


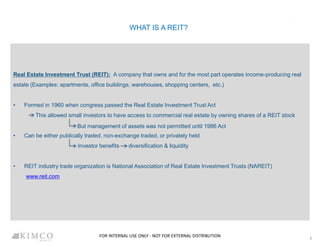

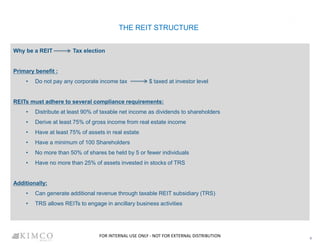
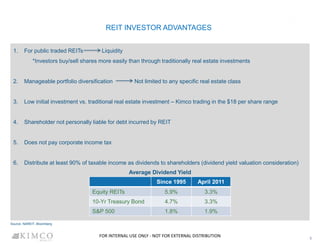
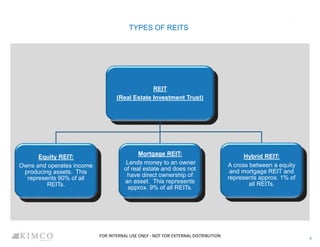

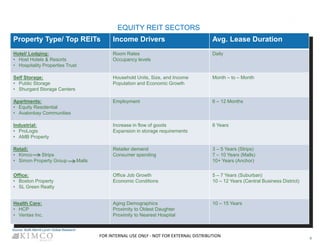
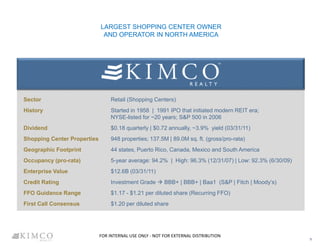

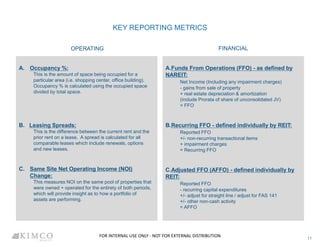
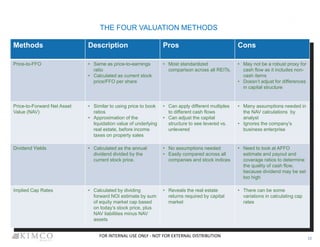


REITs own and operate income-producing real estate. They are required to distribute at least 90% of taxable income to shareholders. There are three main types of REITs: equity REITs, mortgage REITs, and hybrid REITs. Key REIT sectors include retail, healthcare, apartments, and office buildings. REITs provide investors with liquidity, diversification, and steady dividend income. Valuation methods include price-to-FFO ratios, dividend yields, and net asset value calculations.


