Download as PDF, PPTX


![IIS 7.0 Performance
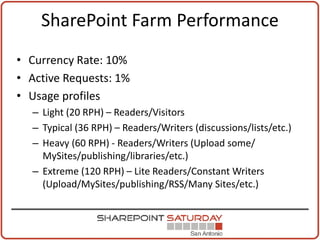
• Increase static compression level to 9 and dynamic to 5
Appcmd.exe set config -section:httpCompression -
[name='gzip'].staticCompressionLevel:9 -
[name='gzip'].dynamicCompressionLevel:9
• Change dynamic compression CPU utilization threshold
range from 20-75%
• APPCMD.EXE set config –section:httpCompression
/dynamicCompressionDisableCpuUsage:75
APPCMD.EXE set config –section:httpCompression
/dynamicCompressionEnableCpuUsage:20
• Enable caching before insertion into page output cache
APPCMD.EXE set config –section:urlCompression
/dynamicCompressionBeforeCache:true](https://image.slidesharecdn.com/spssa-sp2010performance-110701160758-phpapp02/85/SharePoint-Saturday-San-Antonio-SharePoint-2010-Performance-36-320.jpg)


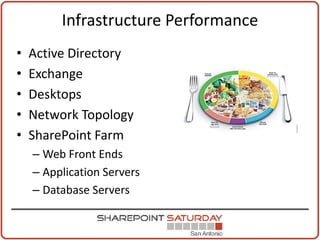
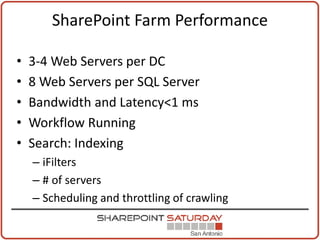
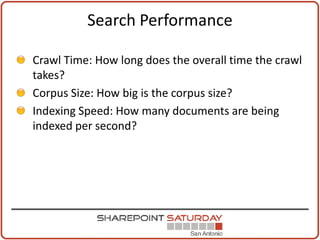
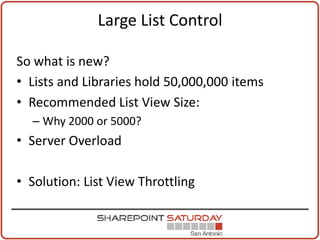
The document discusses optimizing SharePoint performance by focusing on various performance dimensions such as infrastructure, testing, and specific performance metrics like requests per second. It highlights the importance of proper hardware configurations, caching strategies, and performance throttling to enhance both end-user experience and overall system efficiency. Additionally, the document provides practical examples and recommended practices for managing SharePoint workloads effectively.