Download to read offline


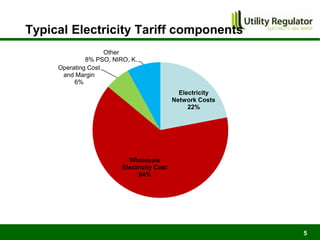

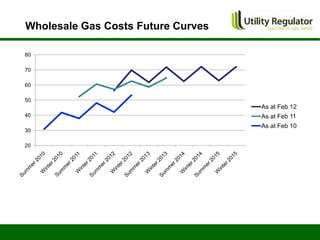
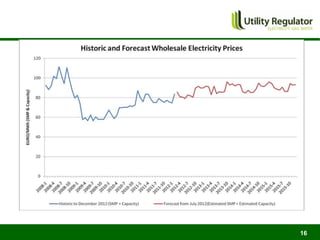
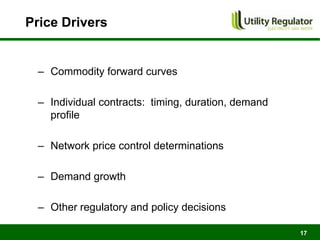

The CBI Energy Conference on February 29, 2012, discusses the factors contributing to electricity and gas bills in Northern Ireland, including wholesale prices and network costs. It outlines the regulation of price components, price control timelines, and expectations for 2012 and beyond. The conference emphasizes the impact of network price controls and future projections for wholesale gas costs.


