Download to read offline
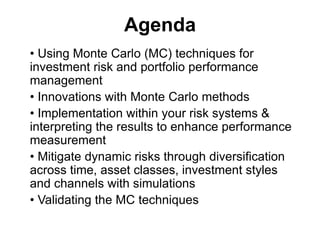
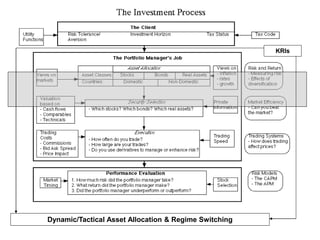
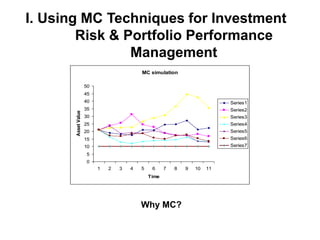
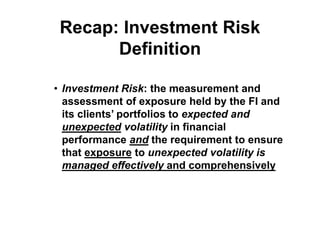
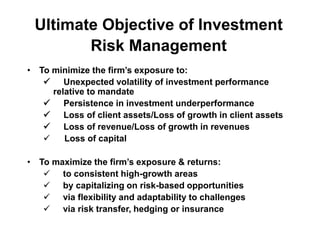
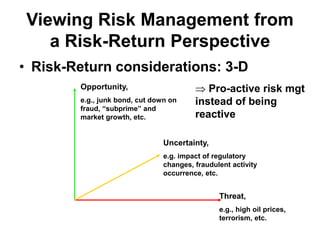
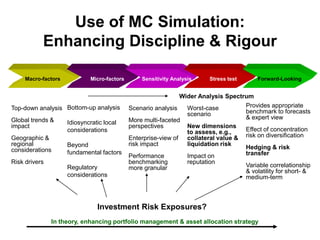
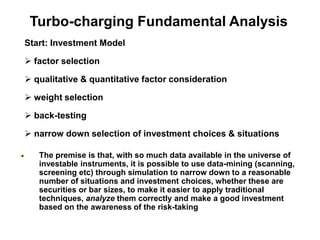


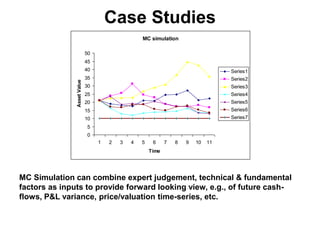
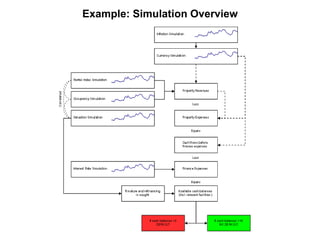

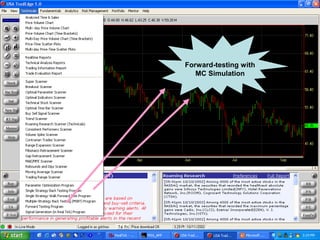

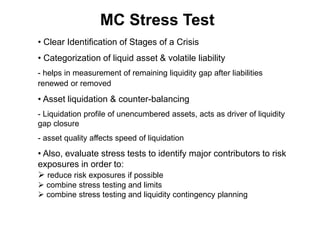
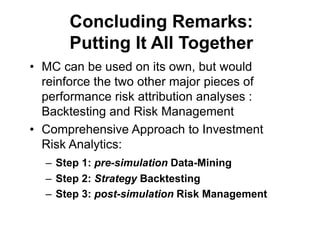

Khoo Guan Seng is the head of group risk models validation at Standard Chartered Bank. He gave a presentation on using Monte Carlo simulation techniques for investment risk and portfolio performance management. The presentation covered innovations with Monte Carlo methods, implementing the techniques in risk systems to enhance performance measurement, using simulations to mitigate risks through diversification, and validating Monte Carlo techniques. The overall objective is to minimize unexpected investment volatility and losses while maximizing consistent returns through flexible risk management.