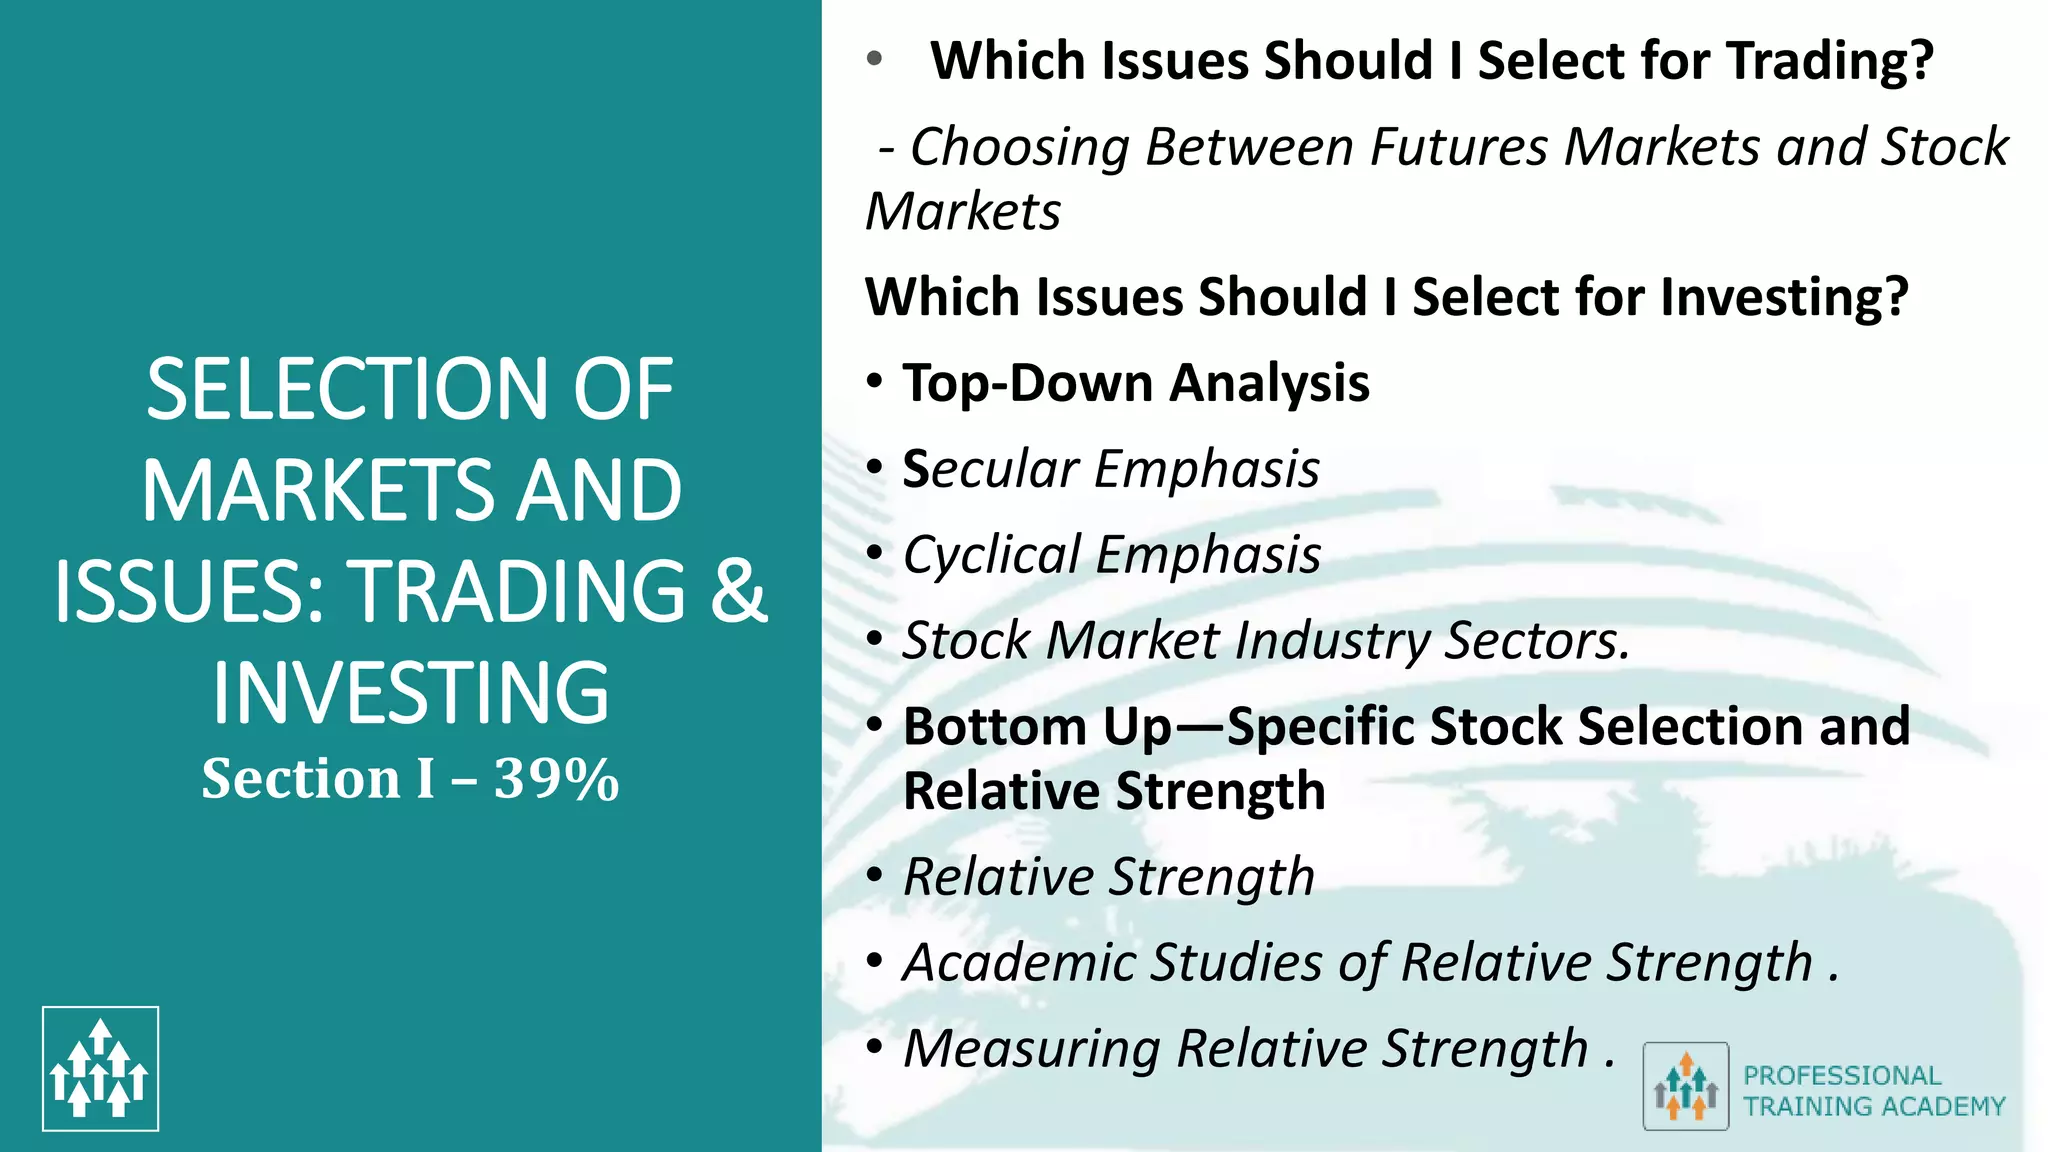
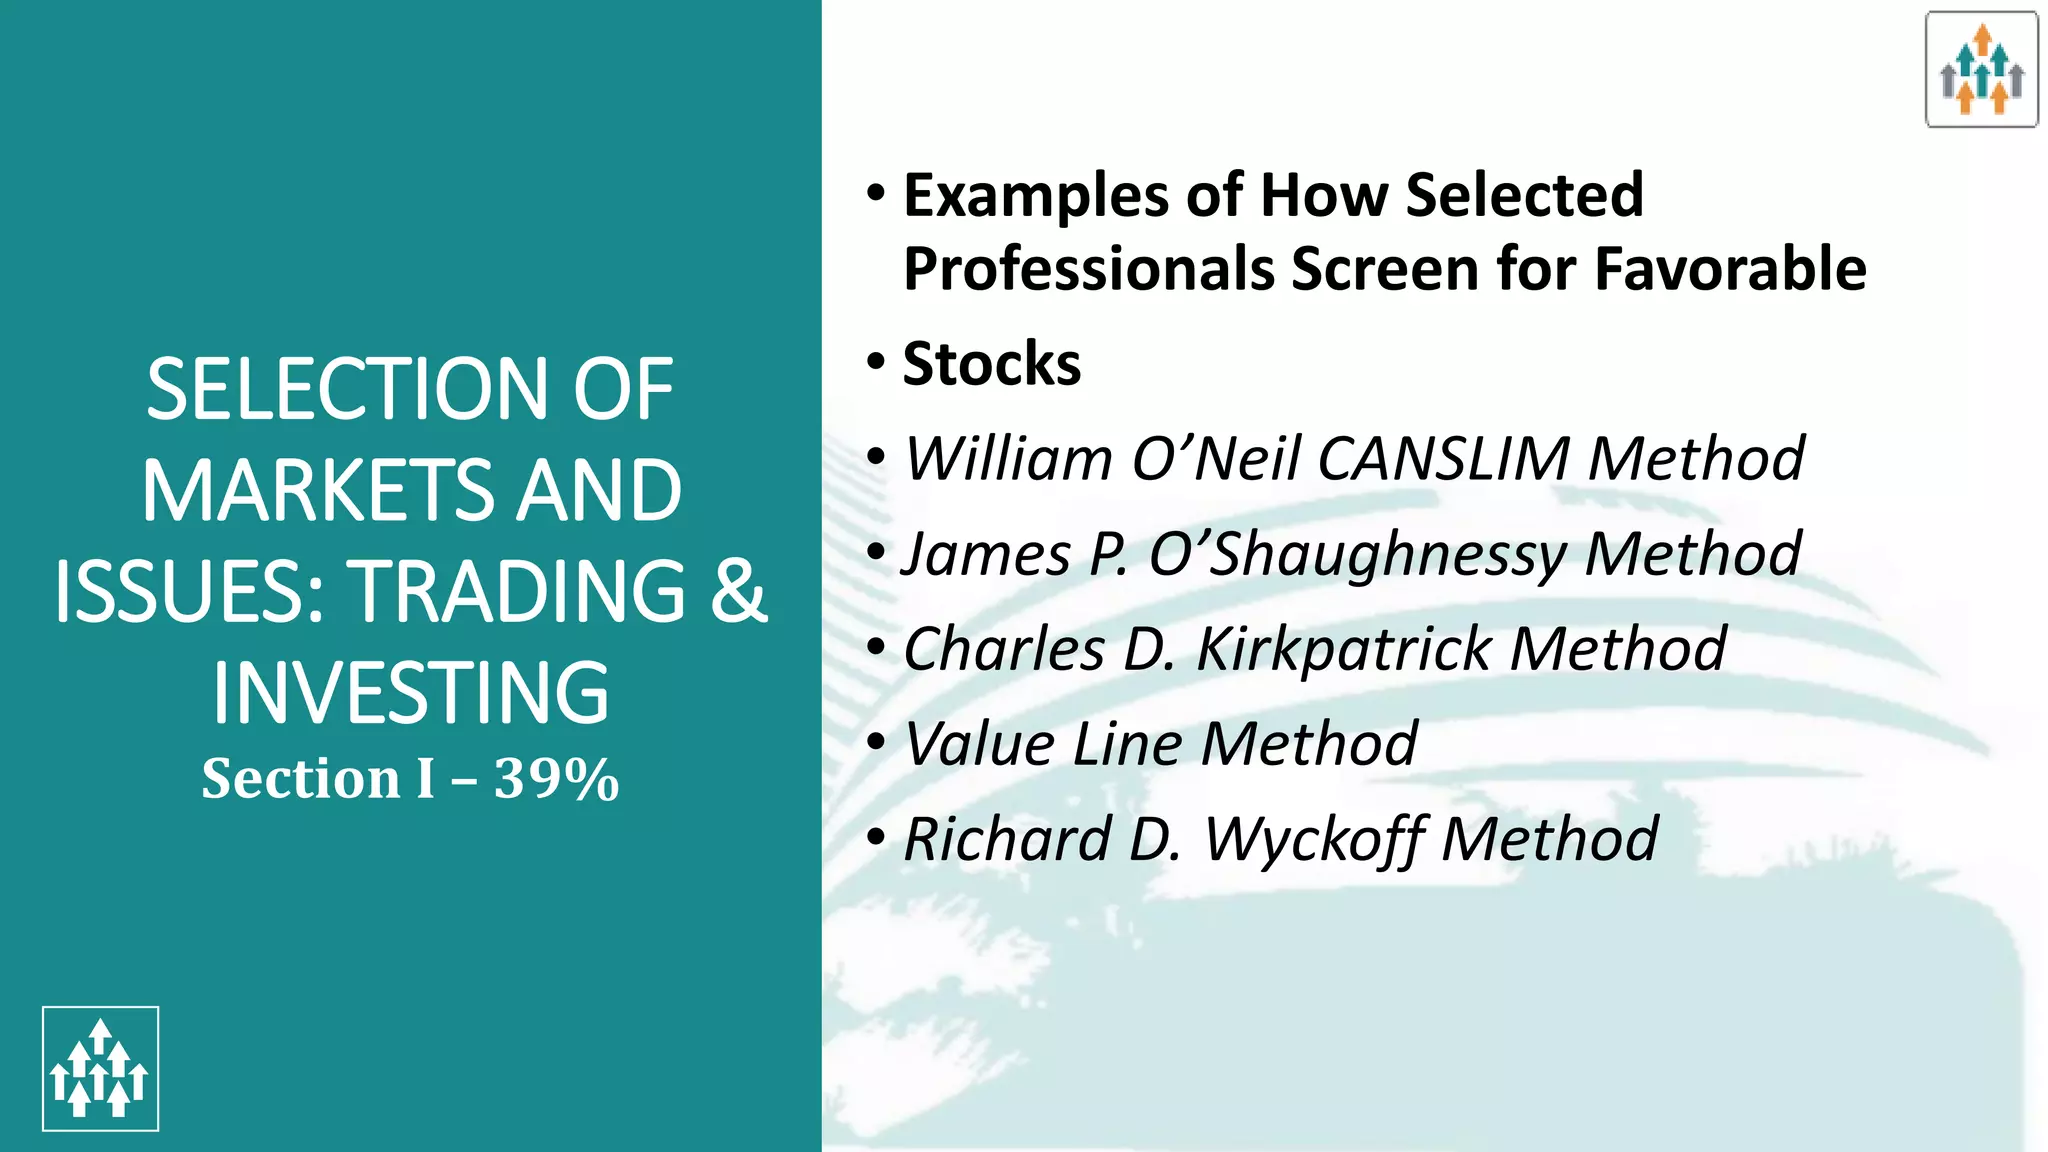
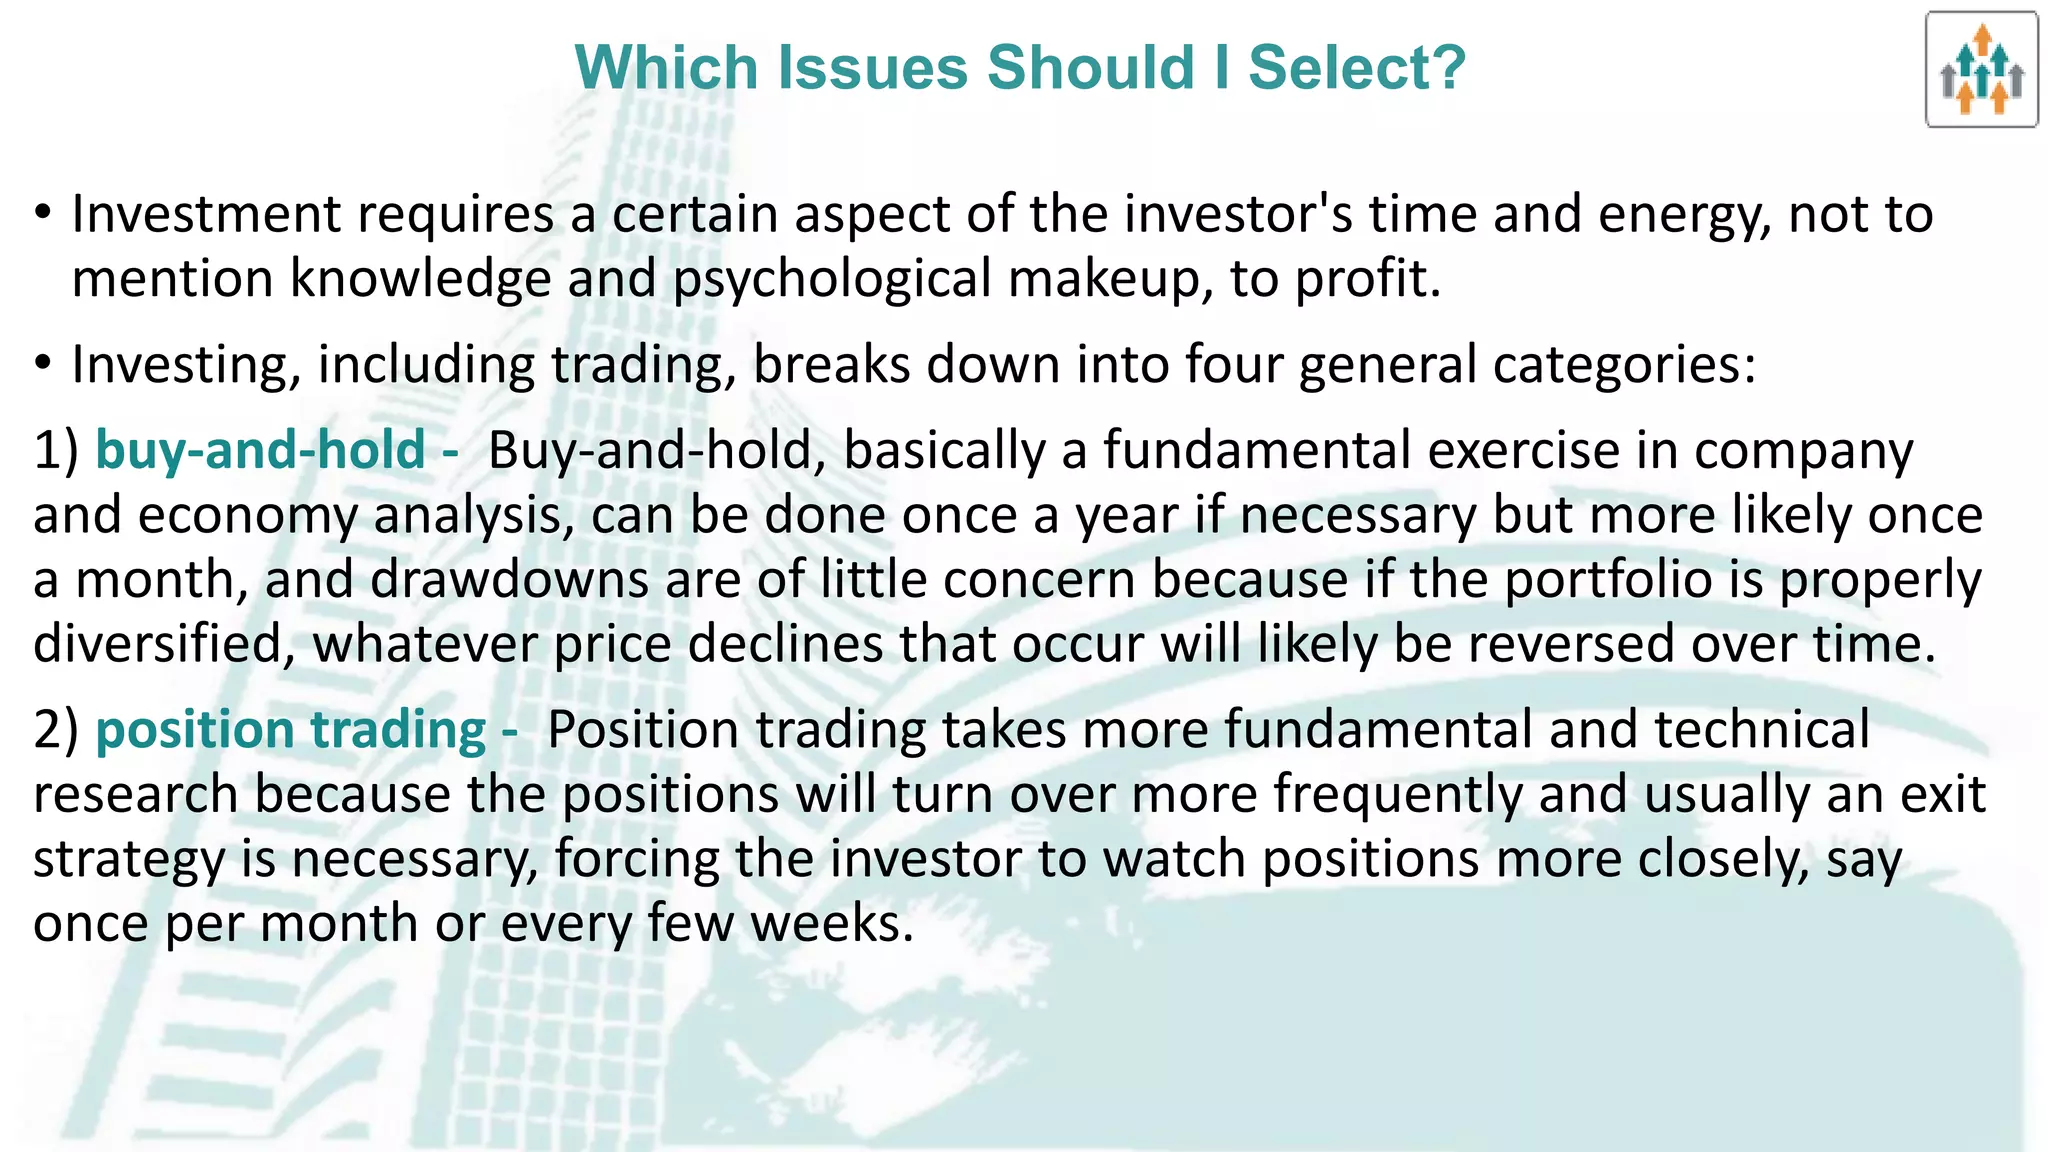
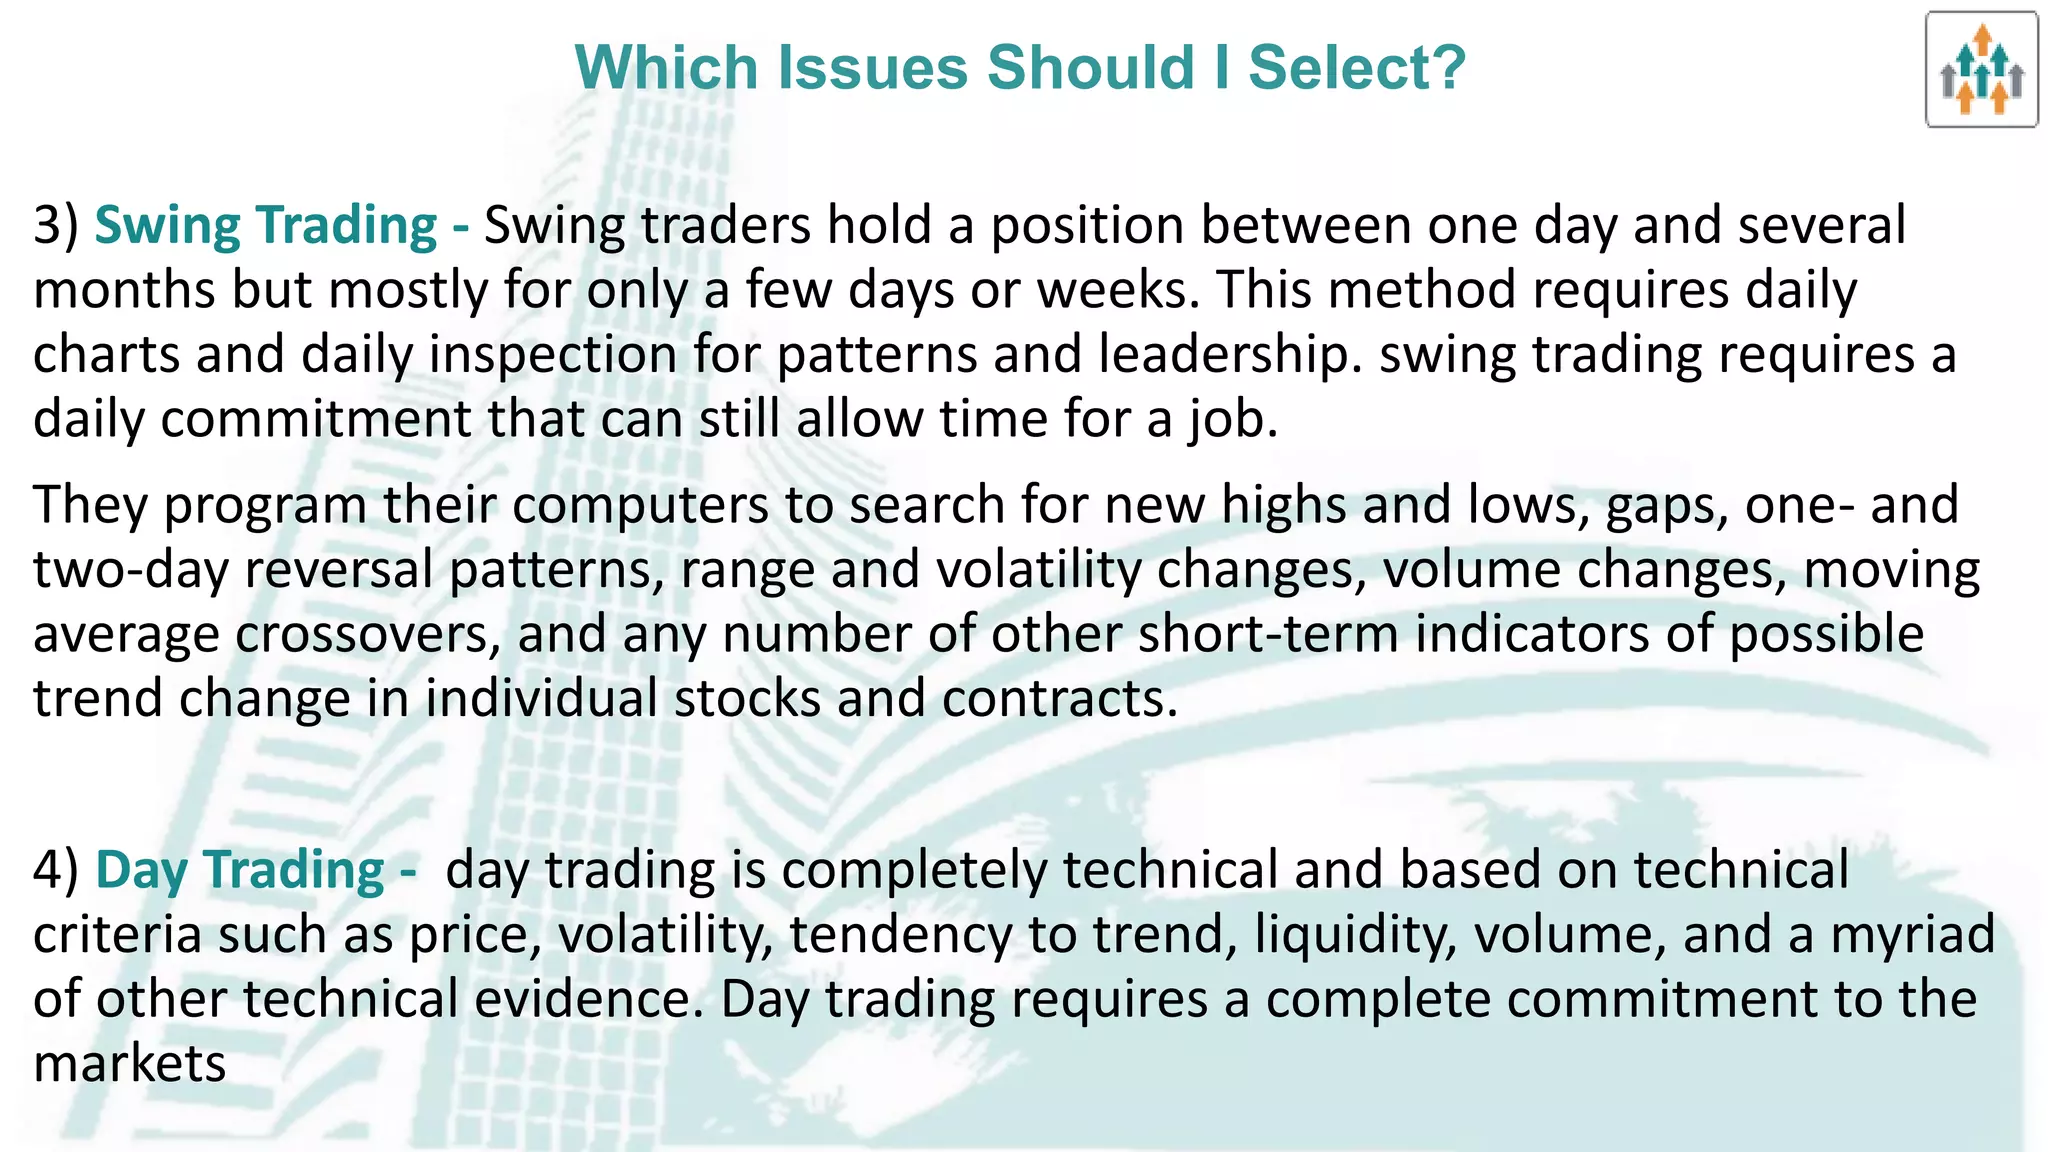
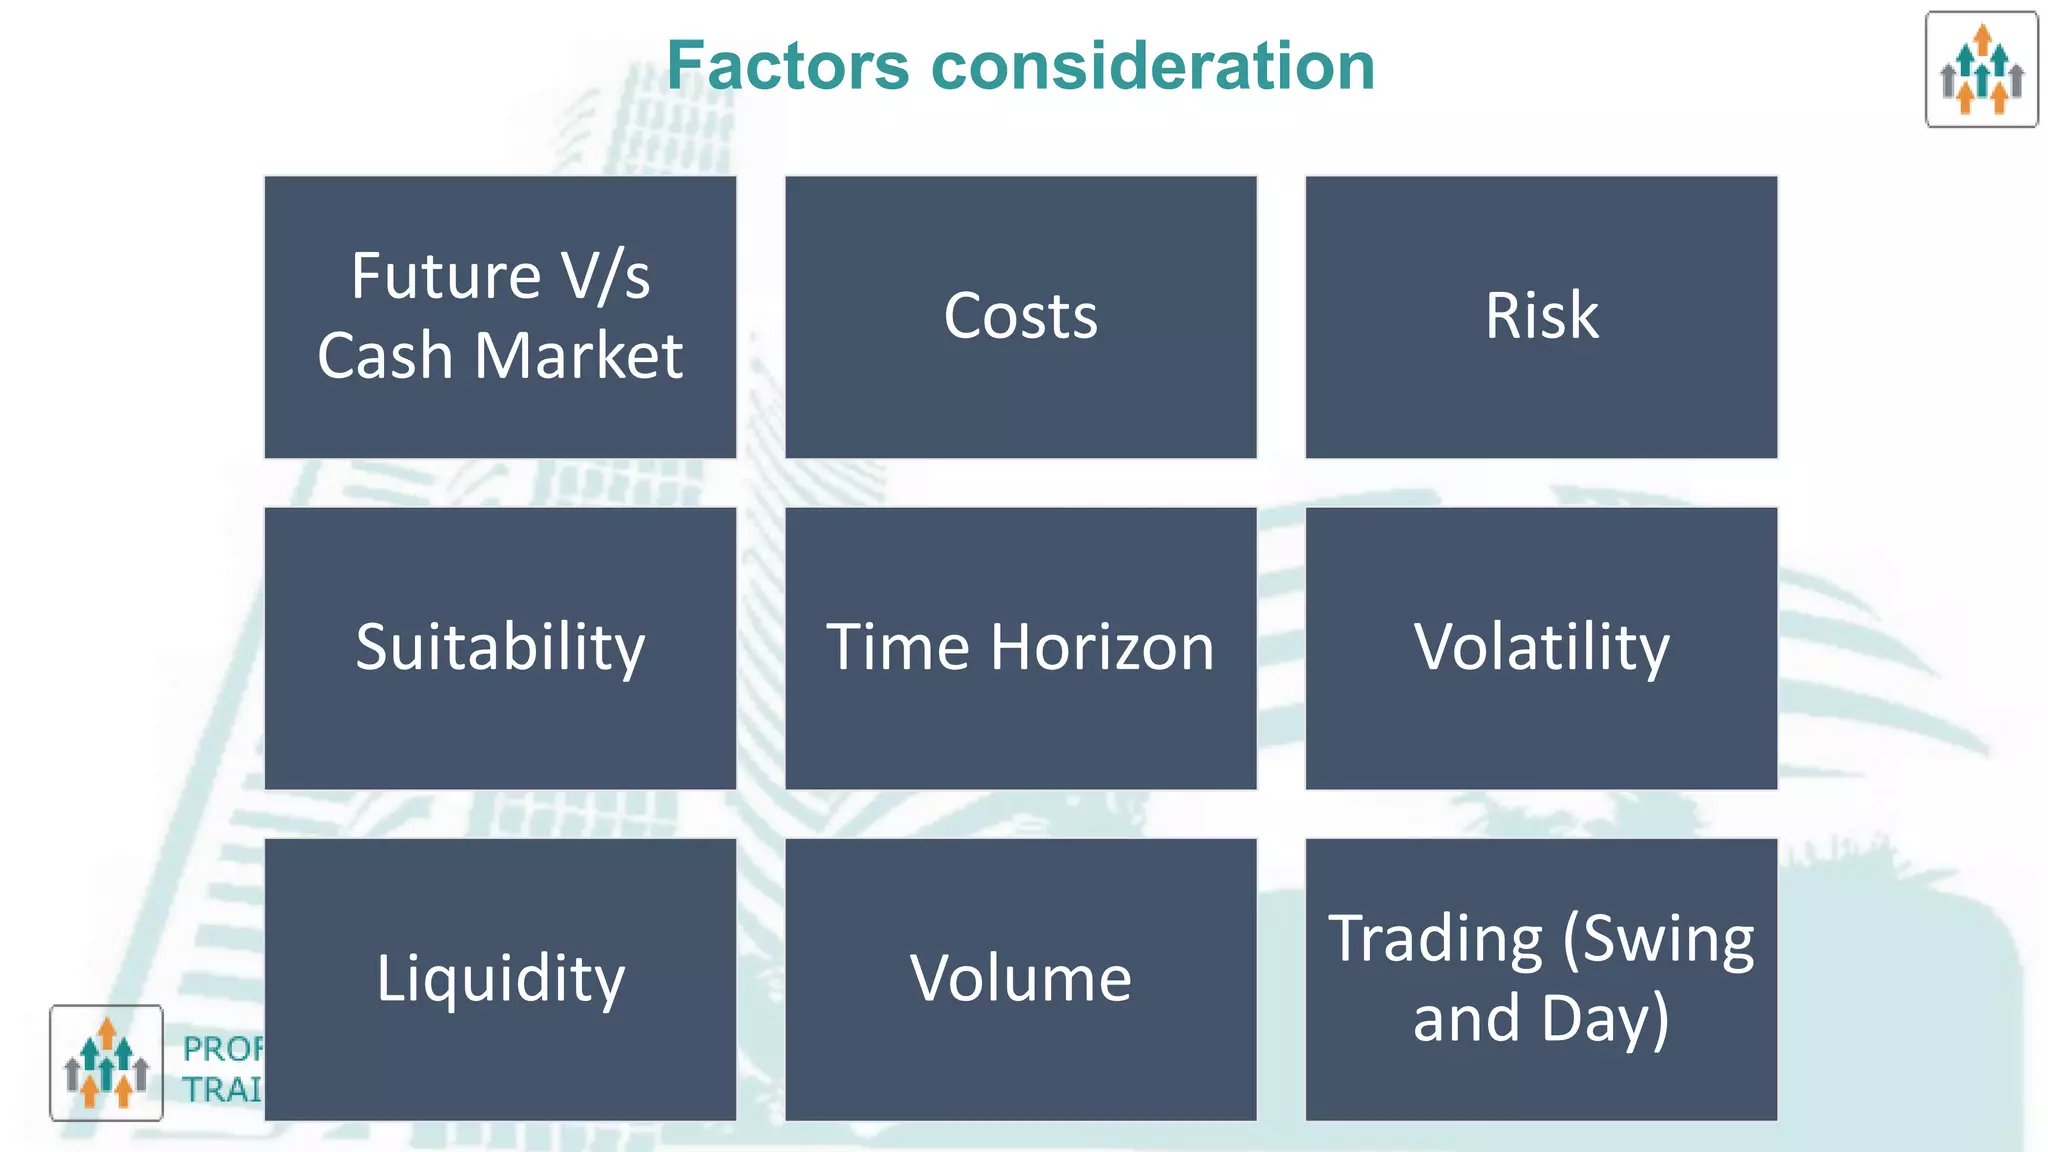
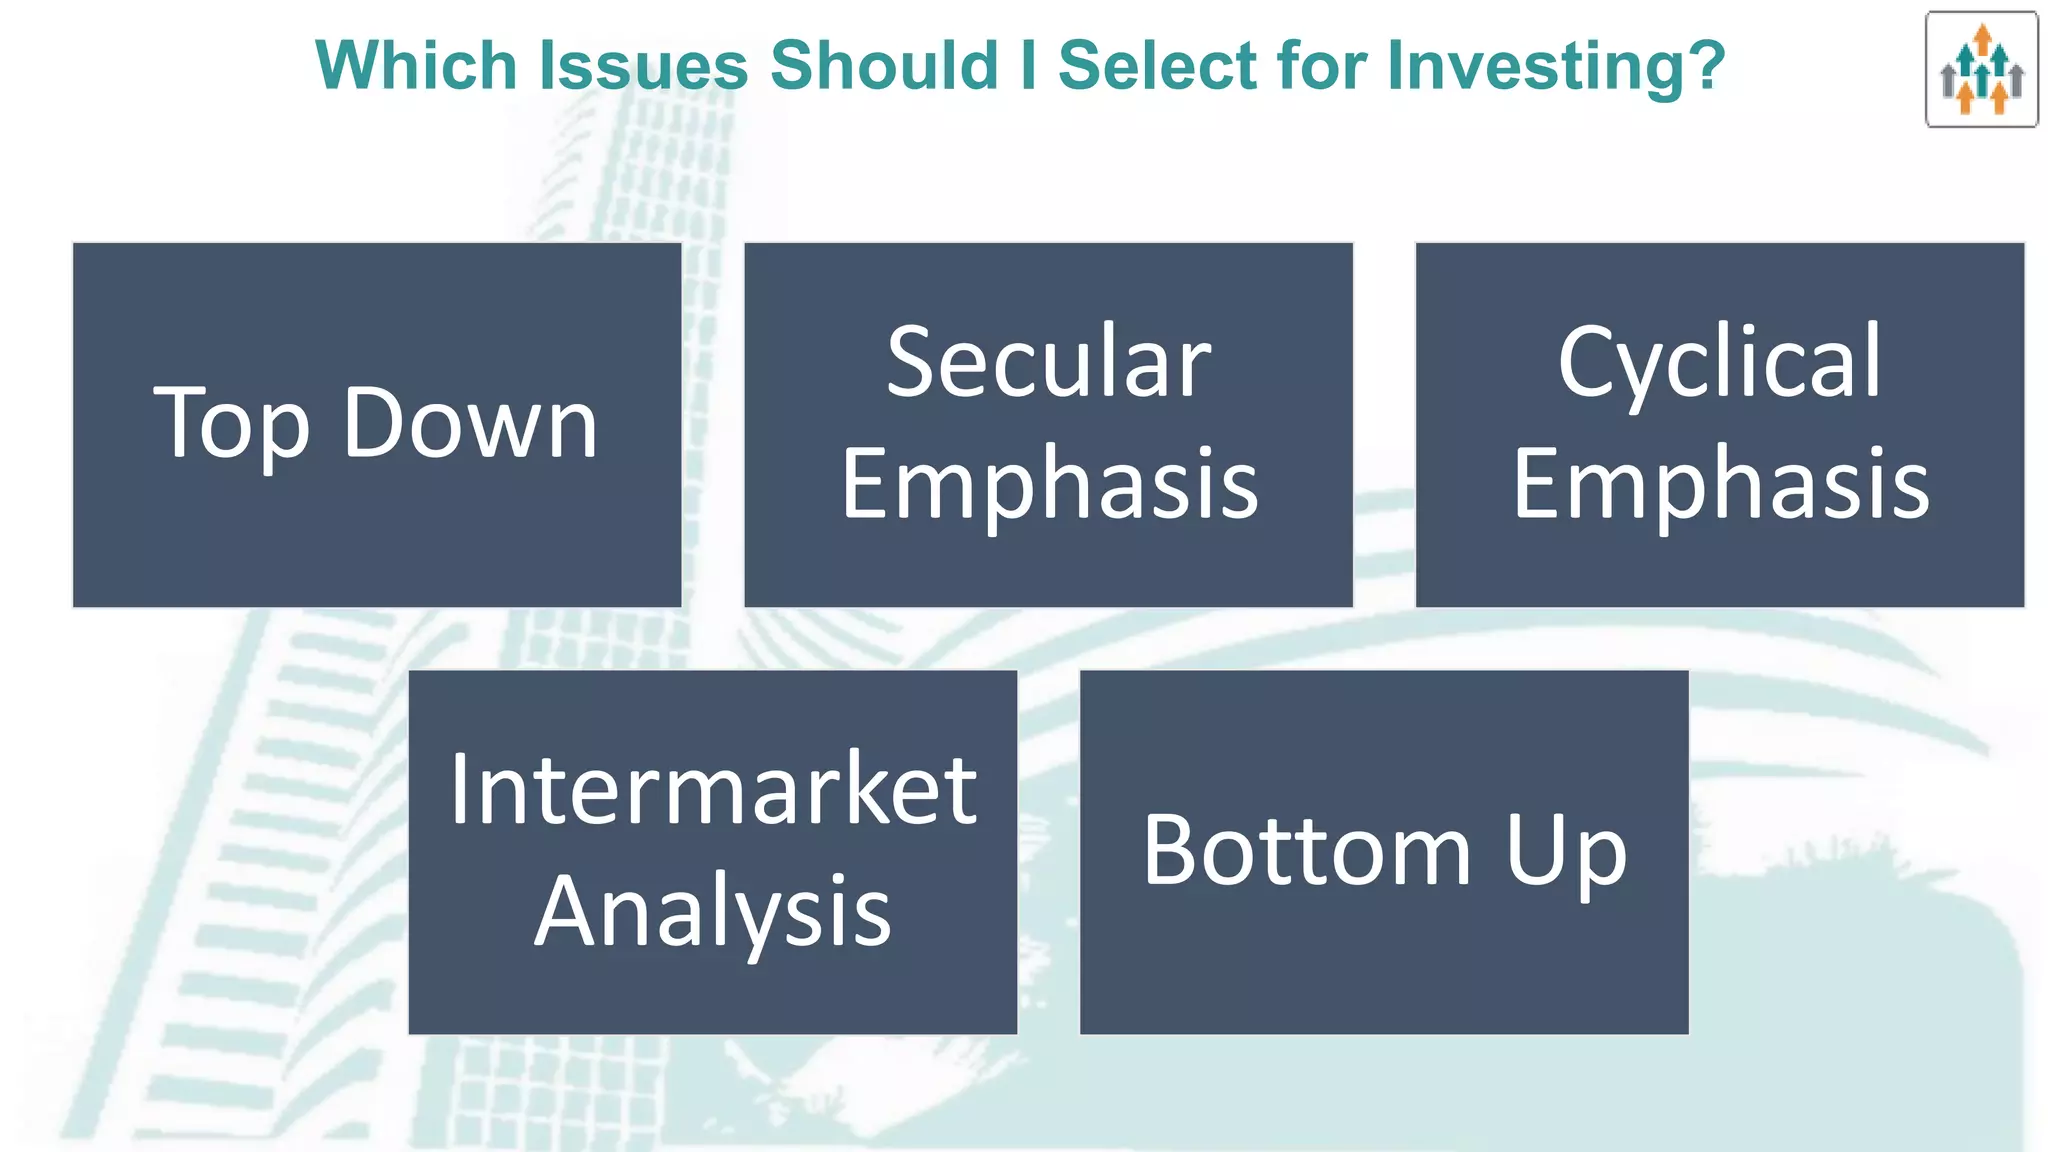
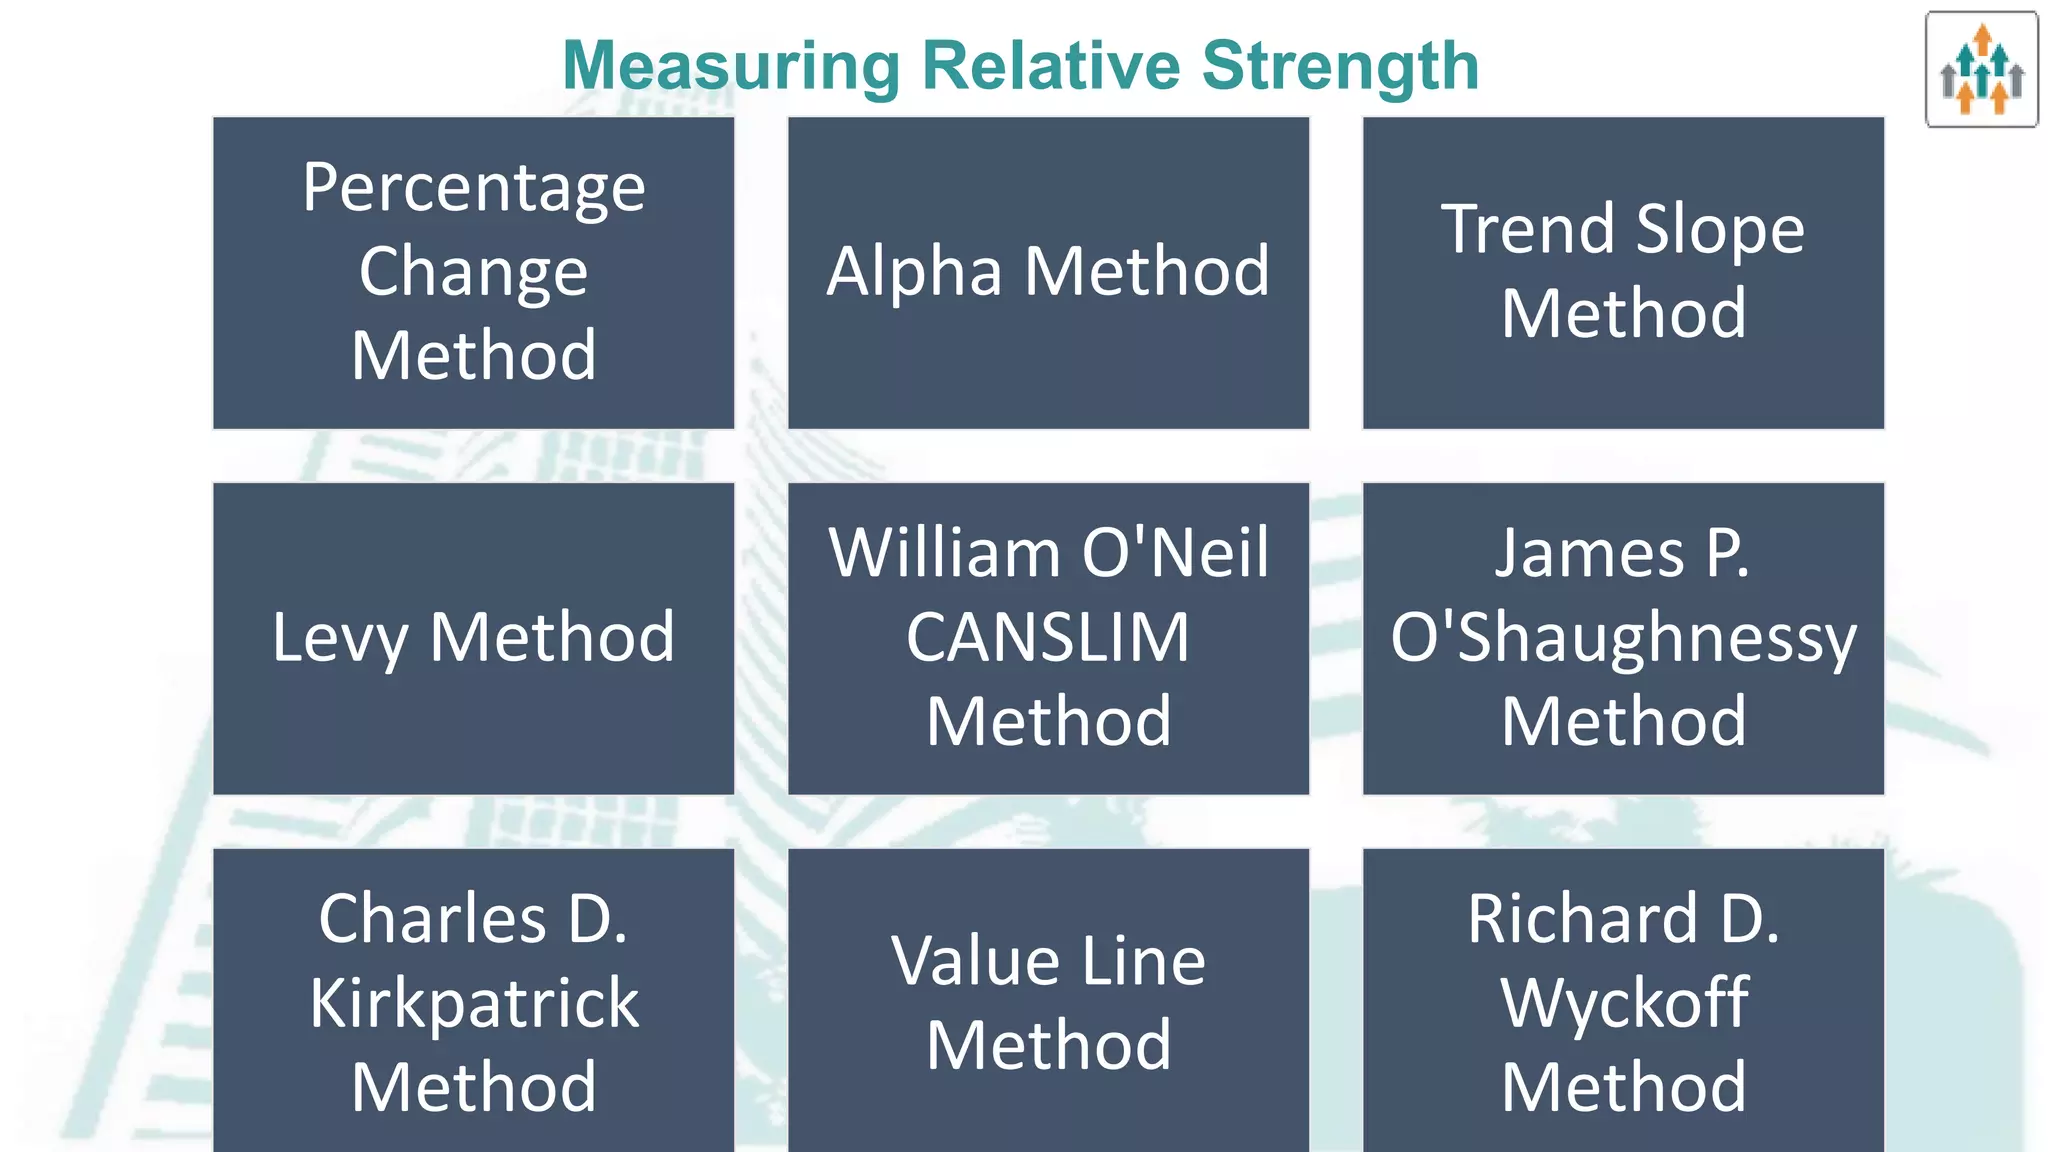
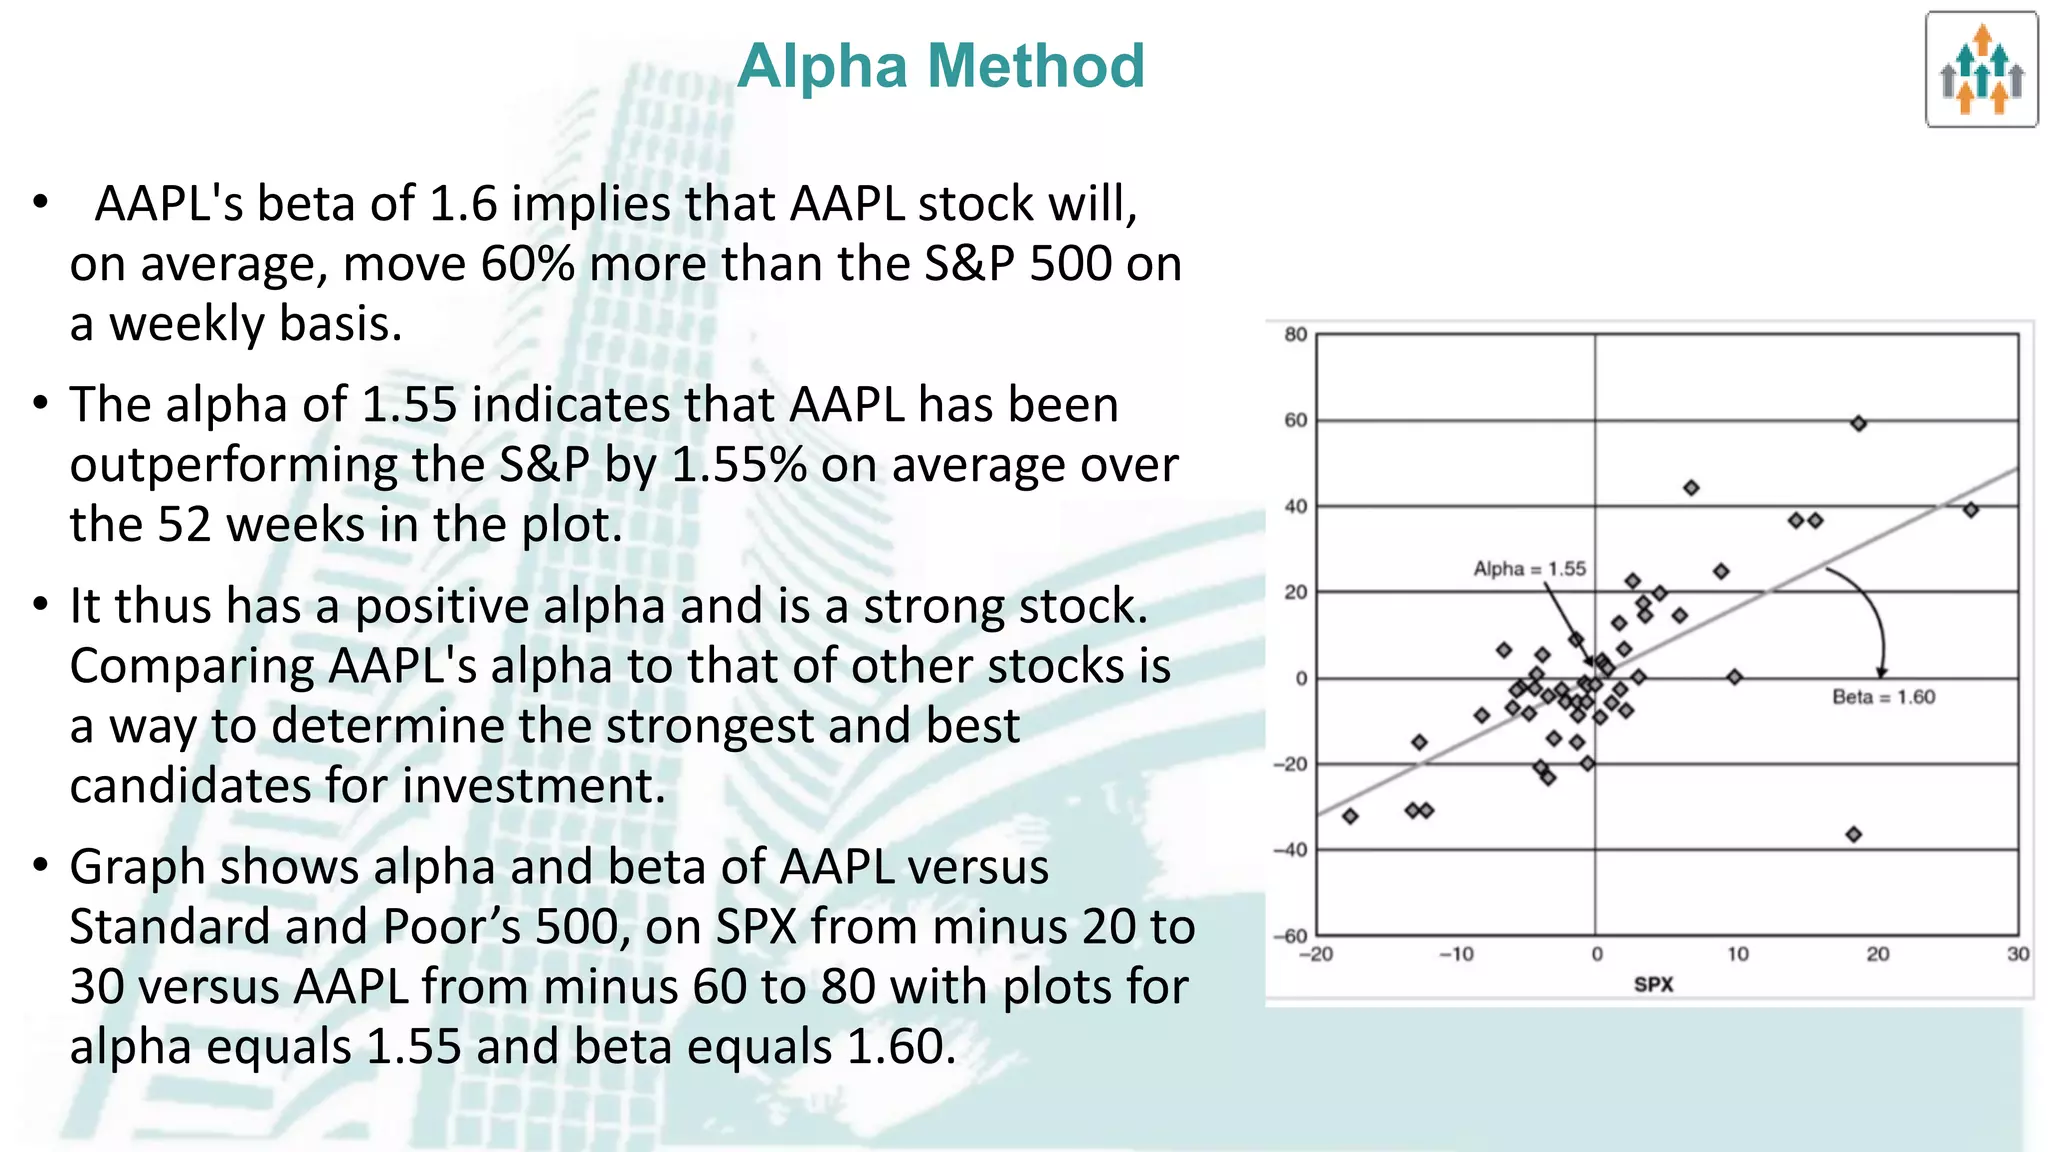
SlideShare a Scribd company logo
1 of 38
Download to read offline
SELECTION OF MARKETS
AND ISSUES: TRADING AND
INVESTING
SELECTION OF
MARKETS AND
ISSUES: TRADING &
INVESTING
Section I – 39%
• Which Issues Should I Select for Trading?
- Choosing Between Futures Markets and Stock
Markets
Which Issues Should I Select for Investing?
• Top-Down Analysis
• Secular Emphasis
• Cyclical Emphasis
• Stock Market Industry Sectors.
• Bottom Up—Specific Stock Selection and
Relative Strength
• Relative Strength
• Academic Studies of Relative Strength .
• Measuring Relative Strength .
SELECTION OF
MARKETS AND
ISSUES: TRADING &
INVESTING
Section I – 39%
• Examples of How Selected
Professionals Screen for Favorable
• Stocks
• William O’Neil CANSLIM Method
• James P. O’Shaughnessy Method
• Charles D. Kirkpatrick Method
• Value Line Method
• Richard D. Wyckoff Method
Which Issues Should I Select?
• Investment requires a certain aspect of the investor's time and energy, not to
mention knowledge and psychological makeup, to profit.
• Investing, including trading, breaks down into four general categories:
1) buy-and-hold - Buy-and-hold, basically a fundamental exercise in company
and economy analysis, can be done once a year if necessary but more likely once
a month, and drawdowns are of little concern because if the portfolio is properly
diversified, whatever price declines that occur will likely be reversed over time.
2) position trading - Position trading takes more fundamental and technical
research because the positions will turn over more frequently and usually an exit
strategy is necessary, forcing the investor to watch positions more closely, say
once per month or every few weeks.
Which Issues Should I Select?
3) Swing Trading - Swing traders hold a position between one day and several
months but mostly for only a few days or weeks. This method requires daily
charts and daily inspection for patterns and leadership. swing trading requires a
daily commitment that can still allow time for a job.
They program their computers to search for new highs and lows, gaps, one- and
two-day reversal patterns, range and volatility changes, volume changes, moving
average crossovers, and any number of other short-term indicators of possible
trend change in individual stocks and contracts.
4) Day Trading - day trading is completely technical and based on technical
criteria such as price, volatility, tendency to trend, liquidity, volume, and a myriad
of other technical evidence. Day trading requires a complete commitment to the
markets
Factors consideration
Future V/s
Cash Market
Costs Risk
Suitability Time Horizon Volatility
Liquidity Volume
Trading (Swing
and Day)
Which Issues Should I Select for Investing?
Top Down
Secular
Emphasis
Cyclical
Emphasis
Intermarket
Analysis
Bottom Up
Top Down Approach
• Top-down analysis begins with a study of the major markets such as
interest rates, currencies, commodities, and stock market to determine
which market has the highest possibility of profit in the future.
• Top-down investing is an investment approach that involves looking at the
overall picture of the economy and then breaking down the various
components into finer details.
• After looking at the big-picture conditions around the world, analysts
examine different industrial sectors to select those that are forecast to
outperform the market
Top Down Approach
• By first analyzing the overall picture, such as a macroeconomic trend, an
investor can start narrowing potential companies to analyze. A trader that
uses technical analysis may use top-down analysis as part of their trading
system.
• A day trader may first analyze daily or weekly charts to determine the
asset's longer term trend, and strong support and resistance levels; and
then move to a smaller time frame of charts, to determine a good entry
point.
Bottom Up Approach
• Bottom-up investing is an investment approach that focuses on the
analysis of individual stocks and deemphasizes the significance of
economic cycles and market cycles.
• The investor focuses his attention on a specific company, rather than on
the industry in which that company operates or on the economy as a
whole.
• This approach assumes individual companies can do well even in an
industry that is not performing.
Bottom Up Approach
• This approach assumes individual companies can do well even in an
industry that is not performing.
• Bottom-up investing forces investors to first consider microeconomic
factors.
• These factors include a company's overall financial health, financial
statements, products and services, supply and demand, and other
individual indicators of performance over time.
• For example, a company's unique marketing strategy or
organizational structure may be a leading indicator that causes a
bottom-up investor to invest.
Secular Emphasis
• the concept of alternating emphasis in the markets on hard assets
and soft assets over long secular periods.
• Secular is a term used for any period longer than the business cycle.
• Hard assets are solid commodities such as gold and silver; these
assets traditionally are considered an inflation hedge.
• Soft assets are financial assets, called paper assets, which primarily
include stocks and bonds.
•
Secular Emphasis
• The reason for the inverse relationship between the value of hard
assets and of soft assets is that a close correlation exists between
material prices and interest rates.
• Inflation, or higher material prices, is generally associated with higher
interest rates.
• When inflation becomes a threat, paper assets, which decrease in
value as interest rates rise, are undesirable as investments.
• when hard asset prices decline, interest rates usually decline, and soft
assets increase in value.
• The theory that one or the other of these kinds of assets becomes
popular for substantial periods is not a new one.
Secular Emphasis
Cyclical Emphasis
• The longer secular economic trend are a number of business cycles.
• These business cycles are of varying length but usually average around
four to five years.
• These business cycles are the normal horizon for most economists,
business managers, and investors.
• It is well recognized that leadership in the trading markets often switches
within the business cycle.
• Investment markets into three categories: commodities, bonds, and
stocks. The business cycle affects each of these markets but in different
ways.
Cyclical Emphasis (U.S. Dollar and Gold )
• Murphy maintains that currency rates
influence industrial prices but
sometimes with a considerable lead.
• The dollar is important in that it is the
pricing currency for many of the world's
raw materials such as oil, gold, and
other precious metals.
• When the dollar declines, it makes these
commodities cheap in foreign currencies
but expensive in dollar terms.
• Thus, there is a leading inverse
relationship between the U.S. dollar and
raw materials prices in the United States
Cyclical Emphasis (Gold and Bonds (Long-Term Interest Rates))
• By taking a ratio of the gold price to the U.S.
Treasury bond futures, we see that at certain
times, a signal is given by the ratio as to when
to enter or exit the long-term bond market.
• The reason is that the upward crossover in the
ratio is not confirmed yet by an upward
crossover in the favored gold price.
• On the other hand, the bond market is edging
slightly below its upward trend line and is in a
position to be sold.
• The bottom line is that the gold futures need
to progress higher to confirm their relative
strength, but bond futures can likely be sold
right now.
Cyclical Emphasis (Bond Market and Stock Market )
• Normal business cycle sequence, the next
switch in markets is from the bond market to
the stock market.
• Actual deflation has become a threat and has
upset the previous balance between interest
rates and the stock market.
• Nevertheless, a plot of the ratio of bonds to
stocks, as shown in Figure 16.6, shows definite
times when one or the other has the
advantage.
Cyclical Emphasis (U. S. Dollar and the Stock Market )
• The final analysis is to return to the
beginning and see how the dollar and
the stock market have interacted.
• The dollar usually leads the industrial
raw material market, which in turn
generally leads the bond market, which
in turn leads the stock market.
• Dollar now has an excellent timing
relationship with the stock market.
• The dollar to stocks ratio gave a buy
signal for the dollar and a sell signal for
the stock market in December 2007,
right at the peak in the stock market.
Relative Strength
• https://www.investopedia.com/articles/trading/08/relative-strength.asp
Measuring Relative Strength
• Relative strength is a momentum investing technique that compares the
performance of a stock, exchange-traded fund (ETF) or mutual fund to that of the
overall market.
• By using specific calculations, investors can identify the strongest performers
compared to the overall market, creating recommendations for investments.
• When used as part of the aforementioned investment strategy, relative strength
assumes a stock whose price has been rising will continue its upward trajectory.
• Relative strength creates a point of comparison regarding the performance of a
particular security against the performance of a selected benchmark, such as a
market index, as well as to other similar securities.
• Relative strength investing has both an entry and exit strategy; investors using this
technique aim to buy securities exhibiting signs of strength while selling their
holdings as soon as the associated securities begin to appear weak.
• An investing technique in its own right, relative strength can also be applied to more
complex strategies, such as pairs trading.
Measuring Relative Strength
• Relative strength is a measure of the price trend of a stock or other financial
instrument compared to another stock, instrument or industry. It is calculated
by taking the price of one asset and dividing it by another.
• For example, if the price of Ford shares is $7 and the price of GM shares is $25,
the relative strength of Ford to GM is 0.28 ($7/25).
• This number is given context when it is compared to the previous levels of
relative strength.
• If, for example, the relative strength of Ford to GM ranges between 0.5 and 1
historically, the current level of 0.28 suggests that Ford is undervalued or GM is
overvalued, or a mix of both.
• It should also be noted that the ratio can also increase by combining an
upward price move of Ford with a downward price move of GM. For example,
if Ford shares rose to $14 and GM shares fell to $20, the relative strength
would be 0.7, which is near the middle of the historic trading range.
Measuring Relative Strength
Percentage
Change
Method
Alpha Method
Trend Slope
Method
Levy Method
William O'Neil
CANSLIM
Method
James P.
O'Shaughnessy
Method
Charles D.
Kirkpatrick
Method
Value Line
Method
Richard D.
Wyckoff
Method
Percentage Change Method
• Jegadeesh and Titman used a six-month price change as their basic lookback
calculation.
• Lookbackis the period over which relative price strength is calculated.
• The stocks then were sorted based on these rates of change.
• They found that the higher decile stocks continued to be strong for the next
three to ten months.
• Their sample included both large capitalized and thinly capitalized and both
high-priced and low-priced stocks.
• All performed similarly both in the original experiment and in the subsequent
out-of-sample tests.
Alpha Method
• Modern Portfolio Theory (MPT), stock prices are compared with an average,
usually the S&P 500, weekly, over a year (and sometimes with different time
intervals and period).
• The weekly percentage change in the stock price is plotted versus the weekly
percentage change in S&P 500, and a linear regression line is drawn through
these plots on a best-fit basis.
• The line so defined is expressed using the slope of the line, called the beta, and
the intercept with the vertical axis, called the alpha.
• Each stock over a specified period has an alpha and a beta. Traditionally, beta
has been used as a measure of volatility relative to the S&P 500 and considered
a definition of market risk.
• Stocks that have a steep slope in their regression line and have a high beta
demonstrate a proclivity to have higher gains than the S&P 500 when the
market is higher but, also, larger losses than the S&P 500 when the market is
Alpha Method
• Alpha describes the value when the regression line crosses the 0% change in
the S&P and is, thus, a measure of the trend relative to the S&P 500.
• MPT suggested that high beta stocks would be more profitable but would also
be more risky.
• What they missed is that high beta stocks could also have negative alphas,
suggesting that, although more volatile, their trends relative to the S&P could
be downward.
• When alpha is compared among stocks, it provides a relative strength measure,
and stock lists can be ranked by alpha to show which issues are the strongest.
• Alpha will change more frequently and more widely than beta, but beta is
somewhat irrelevant to the relative price strength and has been largely
discarded, even as a measure of volatility.
Alpha Method
• AAPL's beta of 1.6 implies that AAPL stock will,
on average, move 60% more than the S&P 500 on
a weekly basis.
• The alpha of 1.55 indicates that AAPL has been
outperforming the S&P by 1.55% on average over
the 52 weeks in the plot.
• It thus has a positive alpha and is a strong stock.
Comparing AAPL's alpha to that of other stocks is
a way to determine the strongest and best
candidates for investment.
• Graph shows alpha and beta of AAPL versus
Standard and Poor’s 500, on SPX from minus 20 to
30 versus AAPL from minus 60 to 80 with plots for
alpha equals 1.55 and beta equals 1.60.
Trend Slope Method
• The screening for relative price strength is to calculate the slope of the
price curve in percentage terms over a specified period through a linear
regression formula for each stock.
• The stocks can then be ranked by the slopes of their price curves.
• This method is similar to the alpha method and to the Jegadeesh and
Titman method.
• It is easier to calculate than the alpha method and does not suffer from
the drop-off effect of a rate-of-change calculation beginning at an arbitrary
price.
Levy Method
• Levy first calculated the ratio of the stock's current price to its 131 trading-
day moving average.
• He then ranked this ratio against the same ratio for all other stocks.
• Levy also found that when the overall stock market headed downward
into a lengthy bear market, relative strength continued to be reliable but
gradually lost its ability to pick winning stocks,
• When the final decline, the washout, occurred, those stocks having been
relatively the strongest usually declined the most.
• In his estimation, relative strength was, thus, a bull market selection
process and should not be used when the stock market declines.
William O'Neil CANSLIM Method
• CANSLIM is an acronym for a method of picking stocks to buy, devised by
William O'Neil (2002), publisher of Investor's Business Daily.
• The breakdown of CANSLIM is as follows:
C—Current quarterly earnings per share versus a year earlier
A—Annual earnings increases
N—New products, management, and stock price highs
S—Supply and demand of stock
L—Leader or laggard
I—Institutional sponsorship
M—Market direction
William O'Neil CANSLIM Method
• Technical analysts, are only concerned with L and M.
• To determine L, leader or laggard, O'Neil calculates the 12-month
percentage price change of every stock, weighted more heavily over the
most recent 3 months, and ranks each stock in percentiles from 99 to 0,
with 99 being the strongest.
• The weighting over the past 3 months reduces the overall time for
comparison and, therefore, improves the prospects of price strength
continuing.
• O'Neil found that the average relative strength percentile, by his
calculation, was 87 before large upward moves.
William O'Neil CANSLIM Method
• For M, market direction, O'Neil refuses to listen to newsletters and “gurus”
and refuses to use economic data because it lags behind the market.
• He has a number of specific indicators and patterns he watches for signs
that a market is bottoming.
• He believes that the buy-and-hold method is faulty because the widely
held belief that all stocks will recover after a bear market is a myth.
James P. O'Shaughnessy Method
• He studied market capitalization, price-to-earnings ratios, price-to-book ratios, price-
to-cash flow ratios, price-to-sales ratios, dividend yields, earnings changes, profit
margins, and return on equity.
• He found that relative price strength, out of all the possible variables, fundamental
and technical, was the only “growth variable that consistently beats the market”
• It takes a ratio of the yearend price to the price one year prior. It is, thus, a 12-month
relative price strength measure, a slightly longer-term calculation considering the
history of relatively strong stocks remaining strong.
• A multifactor investment strategy model called the Cornerstone Growth Strategy. It
includes a primary screen for stocks with a price-to-sales ratio below 1.5, earnings
greater than the previous year, and of those selected so far, the top 50 stocks in
relative price strength.
Charles D. Kirkpatrick Method
• in using the stock price, he calculates the ratio of the
closing price to the stock's moving average and then
ranks all stocks by their ratio.
• Second, Kirkpatrick uses the Levy calculation of relative
price strength over six months in line with Levy's original
work and that of later studies showing the importance of
that period for post calculation continuation of price
strength
• Current relative price strength percentile from 2 to 97
versus relative price strength percentile three months
ahead with plots for best fit percentiles, actual
percentiles, and market average performance (50
percent).
• It is positive, which suggests the higher the current
relative price strength percentile, the higher will be the
relative price strength percentile three months later. The
best three-month performance comes from the highest
level of current relative price strength percentile.
Value Line Method
• The Value Line Ranking System (www.valueline.com) has an extraordinary
history of outperforming the stock market.
• Value Line claims that its Timeliness Ranking system has outperformed
the Standard & Poor's 500 by 16 to 1 since 1965.
•
• the company will not divulge its method of calculation, it does admit that
a significant portion of it includes a calculation of relative price strength.
• Factors include earnings trends, recent earnings, and earnings surprises.
Value Line charges a fee for its stock services.
Richard D. Wyckoff Method
• A method of profiting from the stock market using technical analysis and
relative price strength that has stood the test of more than 80 years is the
method that has been taught by Richard DeMille Wyckoff
• Wyckoff believed most strongly that stock prices were determined solely
by “supply and demand.” He had little use for “tips, rumors, news items,
earnings analyses, financial reports, dividend rates, and the myriad of
other sources of information” or the “half-baked trading theories
expounded in boardrooms and popular books on the stock market
Richard D. Wyckoff Method
• 1. To determine the direction of the entire market, Wyckoff devised an index called
the Wyckoff Wave that was a composite of the most widely held and active stocks.
• Preferably, the stocks in the index were the ones that the investor or trader was
interested in trading.
• His concept of trend was to watch trend lines drawn on the Wave chart and on charts
of the composite market.
• 2.To select the stocks in harmony with the market, Wyckoff selected stocks that were
strong in upward trends and weak in downward trends. He believed it was futile to
act against the trend.
• His calculation of relative price strength used the percentage changes from wave
highs to lows and lows to highs of each stock versus those of the Wyckoff Waves.
• Those stocks that consistently outperformed in each wave in the direction of the
longer wave trend were the ones to analyze further.
Richard D. Wyckoff Method
• 3.To determine the potential of those selected so far, Wyckoff used the point and
figure horizontal count.
• At the same time, a stop level was established, and for the stock to be considered
further, a three-to-one ratio of potential gain to potential stop loss was necessary.
• 4.To determine if the stock is ready to move, shorter-term considerations were
needed to analyze the nature of its price action.
• To do this, Wyckoff relied on volume, range, and to some extent, short-term
momentum. This portion of his method relied heavily on experience and judgment.
• 5.To time the entry, Wyckoff based his decision on the turning in the overall market.
• His basis for this principle was that most stocks move with the market direction, and
timing with the market change reduces the risk of error.

More Related Content

What's hot

Cmt learning objective 1 c trends , trendlines & channels
Cmt learning objective  1 c   trends , trendlines & channelsCmt learning objective  1 c   trends , trendlines & channels
Cmt learning objective 1 c trends , trendlines & channelsProfessional Training Academy
 
Cmt learning objective 6 momentum and oscillators Part-4
Cmt learning objective 6   momentum and oscillators Part-4Cmt learning objective 6   momentum and oscillators Part-4
Cmt learning objective 6 momentum and oscillators Part-4Professional Training Academy
 
Risk Management - CH 5 -Risk Control | CMT Level 3 | Chartered Market Technic...
Risk Management - CH 5 -Risk Control | CMT Level 3 | Chartered Market Technic...Risk Management - CH 5 -Risk Control | CMT Level 3 | Chartered Market Technic...
Risk Management - CH 5 -Risk Control | CMT Level 3 | Chartered Market Technic...Professional Training Academy
 
Classical Methods - Chapter 29 - Conclusion | CMT Level 3 | Chartered Market ...
Classical Methods - Chapter 29 - Conclusion | CMT Level 3 | Chartered Market ...Classical Methods - Chapter 29 - Conclusion | CMT Level 3 | Chartered Market ...
Classical Methods - Chapter 29 - Conclusion | CMT Level 3 | Chartered Market ...Professional Training Academy
 
Learn A Simple Range Trading Strategy
Learn A Simple Range Trading StrategyLearn A Simple Range Trading Strategy
Learn A Simple Range Trading StrategyNetpicksTrading
 
Classical Methods - Chapter 28 - Bring All Together Real World Charts | CMT ...
Classical Methods - Chapter 28 - Bring All Together  Real World Charts | CMT ...Classical Methods - Chapter 28 - Bring All Together  Real World Charts | CMT ...
Classical Methods - Chapter 28 - Bring All Together Real World Charts | CMT ...Professional Training Academy
 
Section I - CH 2 - Money and Portfolio Risk Management.pdf
Section I - CH 2 - Money and Portfolio Risk Management.pdfSection I - CH 2 - Money and Portfolio Risk Management.pdf
Section I - CH 2 - Money and Portfolio Risk Management.pdfProfessional Training Academy
 
What are Key Chart Levels and How to Trade Them
What are Key Chart Levels and How to Trade ThemWhat are Key Chart Levels and How to Trade Them
What are Key Chart Levels and How to Trade Them My Trading Skills
 
Stop Trading Support And Resistance The Wrong Way
Stop Trading Support And Resistance The Wrong WayStop Trading Support And Resistance The Wrong Way
Stop Trading Support And Resistance The Wrong WayNetpicksTrading
 
Psychology of Trading
Psychology of TradingPsychology of Trading
Psychology of Tradingsumeetsj
 
Classical Methods - Chapter 26 - Part II - Candlestick Main Patterns | CMT ...
Classical Methods - Chapter 26 - Part II -  Candlestick  Main Patterns | CMT ...Classical Methods - Chapter 26 - Part II -  Candlestick  Main Patterns | CMT ...
Classical Methods - Chapter 26 - Part II - Candlestick Main Patterns | CMT ...Professional Training Academy
 
Classical Methods - CH 24 - Pattern Recognition | CMT Level 3 | Chartered Mar...
Classical Methods - CH 24 - Pattern Recognition | CMT Level 3 | Chartered Mar...Classical Methods - CH 24 - Pattern Recognition | CMT Level 3 | Chartered Mar...
Classical Methods - CH 24 - Pattern Recognition | CMT Level 3 | Chartered Mar...Professional Training Academy
 
Risk Management- CH 1 - System Design and Testing | CMT Level 3 | Chartered M...
Risk Management- CH 1 - System Design and Testing | CMT Level 3 | Chartered M...Risk Management- CH 1 - System Design and Testing | CMT Level 3 | Chartered M...
Risk Management- CH 1 - System Design and Testing | CMT Level 3 | Chartered M...Professional Training Academy
 
Classical Methods - CH 25 - Multi Time Frames | CMT Level 3 | Chartered Mark...
Classical Methods - CH 25 -  Multi Time Frames | CMT Level 3 | Chartered Mark...Classical Methods - CH 25 -  Multi Time Frames | CMT Level 3 | Chartered Mark...
Classical Methods - CH 25 - Multi Time Frames | CMT Level 3 | Chartered Mark...Professional Training Academy
 

What's hot (20)

Section I - CH 4 - Practical Considerations.pdf
Section I - CH 4 - Practical Considerations.pdfSection I - CH 4 - Practical Considerations.pdf
Section I - CH 4 - Practical Considerations.pdf
 
Cmt learning objective 14 applied cycle analysis
Cmt learning objective 14   applied cycle analysisCmt learning objective 14   applied cycle analysis
Cmt learning objective 14 applied cycle analysis
 
Cmt learning objective 1 c trends , trendlines & channels
Cmt learning objective  1 c   trends , trendlines & channelsCmt learning objective  1 c   trends , trendlines & channels
Cmt learning objective 1 c trends , trendlines & channels
 
Cmt learning objective 6 momentum and oscillators Part-4
Cmt learning objective 6   momentum and oscillators Part-4Cmt learning objective 6   momentum and oscillators Part-4
Cmt learning objective 6 momentum and oscillators Part-4
 
Stock market model
Stock market modelStock market model
Stock market model
 
Risk Management - CH 5 -Risk Control | CMT Level 3 | Chartered Market Technic...
Risk Management - CH 5 -Risk Control | CMT Level 3 | Chartered Market Technic...Risk Management - CH 5 -Risk Control | CMT Level 3 | Chartered Market Technic...
Risk Management - CH 5 -Risk Control | CMT Level 3 | Chartered Market Technic...
 
Classical Methods - Chapter 29 - Conclusion | CMT Level 3 | Chartered Market ...
Classical Methods - Chapter 29 - Conclusion | CMT Level 3 | Chartered Market ...Classical Methods - Chapter 29 - Conclusion | CMT Level 3 | Chartered Market ...
Classical Methods - Chapter 29 - Conclusion | CMT Level 3 | Chartered Market ...
 
Learn A Simple Range Trading Strategy
Learn A Simple Range Trading StrategyLearn A Simple Range Trading Strategy
Learn A Simple Range Trading Strategy
 
Classical Methods - Chapter 28 - Bring All Together Real World Charts | CMT ...
Classical Methods - Chapter 28 - Bring All Together  Real World Charts | CMT ...Classical Methods - Chapter 28 - Bring All Together  Real World Charts | CMT ...
Classical Methods - Chapter 28 - Bring All Together Real World Charts | CMT ...
 
Section I - CH 2 - Money and Portfolio Risk Management.pdf
Section I - CH 2 - Money and Portfolio Risk Management.pdfSection I - CH 2 - Money and Portfolio Risk Management.pdf
Section I - CH 2 - Money and Portfolio Risk Management.pdf
 
System Design & testing
System Design  & testing System Design  & testing
System Design & testing
 
Relative strength strategies for investing
Relative strength strategies for investingRelative strength strategies for investing
Relative strength strategies for investing
 
What are Key Chart Levels and How to Trade Them
What are Key Chart Levels and How to Trade ThemWhat are Key Chart Levels and How to Trade Them
What are Key Chart Levels and How to Trade Them
 
Stop Trading Support And Resistance The Wrong Way
Stop Trading Support And Resistance The Wrong WayStop Trading Support And Resistance The Wrong Way
Stop Trading Support And Resistance The Wrong Way
 
Psychology of Trading
Psychology of TradingPsychology of Trading
Psychology of Trading
 
RSI Strategy
RSI StrategyRSI Strategy
RSI Strategy
 
Classical Methods - Chapter 26 - Part II - Candlestick Main Patterns | CMT ...
Classical Methods - Chapter 26 - Part II -  Candlestick  Main Patterns | CMT ...Classical Methods - Chapter 26 - Part II -  Candlestick  Main Patterns | CMT ...
Classical Methods - Chapter 26 - Part II - Candlestick Main Patterns | CMT ...
 
Classical Methods - CH 24 - Pattern Recognition | CMT Level 3 | Chartered Mar...
Classical Methods - CH 24 - Pattern Recognition | CMT Level 3 | Chartered Mar...Classical Methods - CH 24 - Pattern Recognition | CMT Level 3 | Chartered Mar...
Classical Methods - CH 24 - Pattern Recognition | CMT Level 3 | Chartered Mar...
 
Risk Management- CH 1 - System Design and Testing | CMT Level 3 | Chartered M...
Risk Management- CH 1 - System Design and Testing | CMT Level 3 | Chartered M...Risk Management- CH 1 - System Design and Testing | CMT Level 3 | Chartered M...
Risk Management- CH 1 - System Design and Testing | CMT Level 3 | Chartered M...
 
Classical Methods - CH 25 - Multi Time Frames | CMT Level 3 | Chartered Mark...
Classical Methods - CH 25 -  Multi Time Frames | CMT Level 3 | Chartered Mark...Classical Methods - CH 25 -  Multi Time Frames | CMT Level 3 | Chartered Mark...
Classical Methods - CH 25 - Multi Time Frames | CMT Level 3 | Chartered Mark...
 

Similar to Selection of Markets & Issues

Dr. Ibha Value vs Growth Investing.pptx
Dr. Ibha Value vs Growth Investing.pptxDr. Ibha Value vs Growth Investing.pptx
Dr. Ibha Value vs Growth Investing.pptxIbhaRani
 
Determinants of exchange rates - International Business - Manu Melwin Joy
Determinants of exchange rates - International Business - Manu Melwin JoyDeterminants of exchange rates - International Business - Manu Melwin Joy
Determinants of exchange rates - International Business - Manu Melwin Joymanumelwin
 
KDGF Investor letter Feb14
KDGF Investor letter Feb14KDGF Investor letter Feb14
KDGF Investor letter Feb14Kevin Dougherty
 
Does trend following work on stocks?
Does trend following work on stocks?Does trend following work on stocks?
Does trend following work on stocks?LongboardAM
 
Fundamental analysis
Fundamental analysisFundamental analysis
Fundamental analysisJohn Pradeep
 
Technical analysis of investment portflio.ppt
Technical analysis of investment portflio.pptTechnical analysis of investment portflio.ppt
Technical analysis of investment portflio.pptAbdulRehman469213
 
Lecture 7 - Stock Market and EMF
Lecture 7 - Stock Market and EMFLecture 7 - Stock Market and EMF
Lecture 7 - Stock Market and EMFRyan Herzog
 
Ib0010 international financial management
Ib0010  international financial managementIb0010  international financial management
Ib0010 international financial managementsmumbahelp
 
Market Fundamentals.pptx
Market Fundamentals.pptxMarket Fundamentals.pptx
Market Fundamentals.pptxJavedMir4
 
Fundamental of technical analysis
Fundamental of technical analysisFundamental of technical analysis
Fundamental of technical analysisparshuram2455
 
FINANCE FOR BUSINESS
FINANCE FOR BUSINESSFINANCE FOR BUSINESS
FINANCE FOR BUSINESSlisa ray
 
Technical analysis - By Sohan Khatri
Technical analysis - By Sohan KhatriTechnical analysis - By Sohan Khatri
Technical analysis - By Sohan KhatriSohan Khatri
 
Security analysis (technical) and portfolio management
Security analysis (technical) and portfolio managementSecurity analysis (technical) and portfolio management
Security analysis (technical) and portfolio managementHarish Khan
 
Portfolio Appraising: Effective Portfolio Appraising Techniques
Portfolio Appraising: Effective Portfolio Appraising TechniquesPortfolio Appraising: Effective Portfolio Appraising Techniques
Portfolio Appraising: Effective Portfolio Appraising TechniquesNicro Realty
 
Chapter 4 - Risk Management - 2nd Semester - M.Com - Bangalore University
Chapter 4 - Risk Management - 2nd Semester - M.Com - Bangalore UniversityChapter 4 - Risk Management - 2nd Semester - M.Com - Bangalore University
Chapter 4 - Risk Management - 2nd Semester - M.Com - Bangalore UniversitySwaminath Sam
 

Similar to Selection of Markets & Issues (20)

SECTION VII - CHAPTER 43 - Model Building Process
SECTION VII - CHAPTER 43 - Model Building ProcessSECTION VII - CHAPTER 43 - Model Building Process
SECTION VII - CHAPTER 43 - Model Building Process
 
Dr. Ibha Value vs Growth Investing.pptx
Dr. Ibha Value vs Growth Investing.pptxDr. Ibha Value vs Growth Investing.pptx
Dr. Ibha Value vs Growth Investing.pptx
 
Determinants of exchange rates - International Business - Manu Melwin Joy
Determinants of exchange rates - International Business - Manu Melwin JoyDeterminants of exchange rates - International Business - Manu Melwin Joy
Determinants of exchange rates - International Business - Manu Melwin Joy
 
KDGF Investor letter Feb14
KDGF Investor letter Feb14KDGF Investor letter Feb14
KDGF Investor letter Feb14
 
Does trend following work on stocks?
Does trend following work on stocks?Does trend following work on stocks?
Does trend following work on stocks?
 
Technical analysis
Technical analysisTechnical analysis
Technical analysis
 
Flow of Funds
Flow of FundsFlow of Funds
Flow of Funds
 
Fundamental analysis
Fundamental analysisFundamental analysis
Fundamental analysis
 
Technical analysis of investment portflio.ppt
Technical analysis of investment portflio.pptTechnical analysis of investment portflio.ppt
Technical analysis of investment portflio.ppt
 
Lecture 7 - Stock Market and EMF
Lecture 7 - Stock Market and EMFLecture 7 - Stock Market and EMF
Lecture 7 - Stock Market and EMF
 
Global financial markets
Global financial marketsGlobal financial markets
Global financial markets
 
Ib0010 international financial management
Ib0010  international financial managementIb0010  international financial management
Ib0010 international financial management
 
Market Fundamentals.pptx
Market Fundamentals.pptxMarket Fundamentals.pptx
Market Fundamentals.pptx
 
Fundamental of technical analysis
Fundamental of technical analysisFundamental of technical analysis
Fundamental of technical analysis
 
FINANCE FOR BUSINESS
FINANCE FOR BUSINESSFINANCE FOR BUSINESS
FINANCE FOR BUSINESS
 
Technical analysis - By Sohan Khatri
Technical analysis - By Sohan KhatriTechnical analysis - By Sohan Khatri
Technical analysis - By Sohan Khatri
 
Security analysis (technical) and portfolio management
Security analysis (technical) and portfolio managementSecurity analysis (technical) and portfolio management
Security analysis (technical) and portfolio management
 
Portfolio Appraising: Effective Portfolio Appraising Techniques
Portfolio Appraising: Effective Portfolio Appraising TechniquesPortfolio Appraising: Effective Portfolio Appraising Techniques
Portfolio Appraising: Effective Portfolio Appraising Techniques
 
Chapter 4 - Risk Management - 2nd Semester - M.Com - Bangalore University
Chapter 4 - Risk Management - 2nd Semester - M.Com - Bangalore UniversityChapter 4 - Risk Management - 2nd Semester - M.Com - Bangalore University
Chapter 4 - Risk Management - 2nd Semester - M.Com - Bangalore University
 
Stock market
Stock marketStock market
Stock market
 

More from Professional Training Academy

Lecture E - Standard V Investment Analysis, Recommendations, and Actions
Lecture E - Standard V Investment Analysis, Recommendations, and ActionsLecture E - Standard V Investment Analysis, Recommendations, and Actions
Lecture E - Standard V Investment Analysis, Recommendations, and ActionsProfessional Training Academy
 
SECTION VII - CHAPTER 42 - Being Right or making money
SECTION VII - CHAPTER 42 - Being Right or making moneySECTION VII - CHAPTER 42 - Being Right or making money
SECTION VII - CHAPTER 42 - Being Right or making moneyProfessional Training Academy
 
SECTION VII - CHAPTER 41 - Objective Rules & Evaluation
SECTION VII - CHAPTER 41 - Objective Rules & EvaluationSECTION VII - CHAPTER 41 - Objective Rules & Evaluation
SECTION VII - CHAPTER 41 - Objective Rules & EvaluationProfessional Training Academy
 
SECTION VI - CHAPTER 39 - Descriptive Statistics basics
SECTION VI - CHAPTER 39 - Descriptive Statistics basicsSECTION VI - CHAPTER 39 - Descriptive Statistics basics
SECTION VI - CHAPTER 39 - Descriptive Statistics basicsProfessional Training Academy
 
SECTION V- CHAPTER 38 - Sentiment Measures from External Data
SECTION V- CHAPTER 38  - Sentiment Measures from External  DataSECTION V- CHAPTER 38  - Sentiment Measures from External  Data
SECTION V- CHAPTER 38 - Sentiment Measures from External DataProfessional Training Academy
 
SECTION V - CHAPTER 37 - Sentiment Measures from Market Data
SECTION V - CHAPTER 37 - Sentiment Measures from Market DataSECTION V - CHAPTER 37 - Sentiment Measures from Market Data
SECTION V - CHAPTER 37 - Sentiment Measures from Market DataProfessional Training Academy
 
SECTION V - CHAPTER 36 - Market Sentiment & Technical Analysis
SECTION V - CHAPTER 36 - Market Sentiment & Technical AnalysisSECTION V - CHAPTER 36 - Market Sentiment & Technical Analysis
SECTION V - CHAPTER 36 - Market Sentiment & Technical AnalysisProfessional Training Academy
 
SECTION V - CHAPTER 35 - Academic Approaches to Technical Analysis
SECTION V - CHAPTER 35 - Academic Approaches to Technical AnalysisSECTION V - CHAPTER 35 - Academic Approaches to Technical Analysis
SECTION V - CHAPTER 35 - Academic Approaches to Technical AnalysisProfessional Training Academy
 
SECTION V - CHAPTER 34 - Noise Traders as technical Traders.pdf
SECTION V - CHAPTER 34 - Noise Traders as technical Traders.pdfSECTION V - CHAPTER 34 - Noise Traders as technical Traders.pdf
SECTION V - CHAPTER 34 - Noise Traders as technical Traders.pdfProfessional Training Academy
 
SECTION V - CHAPTER 33 - Noise Traders & Law of One Price
SECTION V - CHAPTER 33 - Noise Traders & Law of One PriceSECTION V - CHAPTER 33 - Noise Traders & Law of One Price
SECTION V - CHAPTER 33 - Noise Traders & Law of One PriceProfessional Training Academy
 
SECTION V - CHAPTER 32 - Forerunners to Behavioural Finance.pdf
SECTION V - CHAPTER 32 - Forerunners to Behavioural Finance.pdfSECTION V - CHAPTER 32 - Forerunners to Behavioural Finance.pdf
SECTION V - CHAPTER 32 - Forerunners to Behavioural Finance.pdfProfessional Training Academy
 

More from Professional Training Academy (20)

Chapter D - Knowledge Domains and Weightings
Chapter D - Knowledge Domains and WeightingsChapter D - Knowledge Domains and Weightings
Chapter D - Knowledge Domains and Weightings
 
Lecture F - Standard VI Conflicts of Interest
Lecture F - Standard VI Conflicts of InterestLecture F - Standard VI Conflicts of Interest
Lecture F - Standard VI Conflicts of Interest
 
Lecture E - Standard V Investment Analysis, Recommendations, and Actions
Lecture E - Standard V Investment Analysis, Recommendations, and ActionsLecture E - Standard V Investment Analysis, Recommendations, and Actions
Lecture E - Standard V Investment Analysis, Recommendations, and Actions
 
Lecture D - Standard IV Duties to Employers
Lecture D - Standard IV Duties to EmployersLecture D - Standard IV Duties to Employers
Lecture D - Standard IV Duties to Employers
 
Lecture C - Standard III Duties to Clients
Lecture C - Standard III Duties to ClientsLecture C - Standard III Duties to Clients
Lecture C - Standard III Duties to Clients
 
Lecture B - Standard II Integrity of Capital Markets
Lecture B - Standard II Integrity of Capital MarketsLecture B - Standard II Integrity of Capital Markets
Lecture B - Standard II Integrity of Capital Markets
 
Lecture A - Standard I Professionalism
Lecture A - Standard I ProfessionalismLecture A - Standard I Professionalism
Lecture A - Standard I Professionalism
 
SECTION VII - CHAPTER 44 - Relative Strength Concept
SECTION VII - CHAPTER 44 -  Relative Strength ConceptSECTION VII - CHAPTER 44 -  Relative Strength Concept
SECTION VII - CHAPTER 44 - Relative Strength Concept
 
SECTION VII - CHAPTER 42 - Being Right or making money
SECTION VII - CHAPTER 42 - Being Right or making moneySECTION VII - CHAPTER 42 - Being Right or making money
SECTION VII - CHAPTER 42 - Being Right or making money
 
SECTION VII - CHAPTER 41 - Objective Rules & Evaluation
SECTION VII - CHAPTER 41 - Objective Rules & EvaluationSECTION VII - CHAPTER 41 - Objective Rules & Evaluation
SECTION VII - CHAPTER 41 - Objective Rules & Evaluation
 
SECTION VI - CHAPTER 40 - Concept of Probablity
SECTION VI - CHAPTER 40 - Concept of ProbablitySECTION VI - CHAPTER 40 - Concept of Probablity
SECTION VI - CHAPTER 40 - Concept of Probablity
 
SECTION VI - CHAPTER 39 - Descriptive Statistics basics
SECTION VI - CHAPTER 39 - Descriptive Statistics basicsSECTION VI - CHAPTER 39 - Descriptive Statistics basics
SECTION VI - CHAPTER 39 - Descriptive Statistics basics
 
SECTION V- CHAPTER 38 - Sentiment Measures from External Data
SECTION V- CHAPTER 38  - Sentiment Measures from External  DataSECTION V- CHAPTER 38  - Sentiment Measures from External  Data
SECTION V- CHAPTER 38 - Sentiment Measures from External Data
 
SECTION V - CHAPTER 37 - Sentiment Measures from Market Data
SECTION V - CHAPTER 37 - Sentiment Measures from Market DataSECTION V - CHAPTER 37 - Sentiment Measures from Market Data
SECTION V - CHAPTER 37 - Sentiment Measures from Market Data
 
SECTION V - CHAPTER 36 - Market Sentiment & Technical Analysis
SECTION V - CHAPTER 36 - Market Sentiment & Technical AnalysisSECTION V - CHAPTER 36 - Market Sentiment & Technical Analysis
SECTION V - CHAPTER 36 - Market Sentiment & Technical Analysis
 
SECTION V - CHAPTER 35 - Academic Approaches to Technical Analysis
SECTION V - CHAPTER 35 - Academic Approaches to Technical AnalysisSECTION V - CHAPTER 35 - Academic Approaches to Technical Analysis
SECTION V - CHAPTER 35 - Academic Approaches to Technical Analysis
 
SECTION V - CHAPTER 34 - Noise Traders as technical Traders.pdf
SECTION V - CHAPTER 34 - Noise Traders as technical Traders.pdfSECTION V - CHAPTER 34 - Noise Traders as technical Traders.pdf
SECTION V - CHAPTER 34 - Noise Traders as technical Traders.pdf
 
SECTION V - CHAPTER 33 - Noise Traders & Law of One Price
SECTION V - CHAPTER 33 - Noise Traders & Law of One PriceSECTION V - CHAPTER 33 - Noise Traders & Law of One Price
SECTION V - CHAPTER 33 - Noise Traders & Law of One Price
 
SECTION V - CHAPTER 32 - Forerunners to Behavioural Finance.pdf
SECTION V - CHAPTER 32 - Forerunners to Behavioural Finance.pdfSECTION V - CHAPTER 32 - Forerunners to Behavioural Finance.pdf
SECTION V - CHAPTER 32 - Forerunners to Behavioural Finance.pdf
 
SECTION V - CHAPTER 31 - EMH Basics
SECTION V - CHAPTER 31 - EMH BasicsSECTION V - CHAPTER 31 - EMH Basics
SECTION V - CHAPTER 31 - EMH Basics
 

Recently uploaded

Earth Day Presentation wow hello nice great
Earth Day Presentation wow hello nice greatEarth Day Presentation wow hello nice great
Earth Day Presentation wow hello nice greatYousafMalik24
 
Roles & Responsibilities in Pharmacovigilance
Roles & Responsibilities in PharmacovigilanceRoles & Responsibilities in Pharmacovigilance
Roles & Responsibilities in PharmacovigilanceSamikshaHamane
 
KSHARA STURA .pptx---KSHARA KARMA THERAPY (CAUSTIC THERAPY)————IMP.OF KSHARA ...
KSHARA STURA .pptx---KSHARA KARMA THERAPY (CAUSTIC THERAPY)————IMP.OF KSHARA ...KSHARA STURA .pptx---KSHARA KARMA THERAPY (CAUSTIC THERAPY)————IMP.OF KSHARA ...
KSHARA STURA .pptx---KSHARA KARMA THERAPY (CAUSTIC THERAPY)————IMP.OF KSHARA ...M56BOOKSTORE PRODUCT/SERVICE
 
Meghan Sutherland In Media Res Media Component
Meghan Sutherland In Media Res Media ComponentMeghan Sutherland In Media Res Media Component
Meghan Sutherland In Media Res Media ComponentInMediaRes1
 
Painted Grey Ware.pptx, PGW Culture of India
Painted Grey Ware.pptx, PGW Culture of IndiaPainted Grey Ware.pptx, PGW Culture of India
Painted Grey Ware.pptx, PGW Culture of IndiaVirag Sontakke
 
Historical philosophical, theoretical, and legal foundations of special and i...
Historical philosophical, theoretical, and legal foundations of special and i...Historical philosophical, theoretical, and legal foundations of special and i...
Historical philosophical, theoretical, and legal foundations of special and i...jaredbarbolino94
 
call girls in Kamla Market (DELHI) 🔝 >༒9953330565🔝 genuine Escort Service 🔝✔️✔️
call girls in Kamla Market (DELHI) 🔝 >༒9953330565🔝 genuine Escort Service 🔝✔️✔️call girls in Kamla Market (DELHI) 🔝 >༒9953330565🔝 genuine Escort Service 🔝✔️✔️
call girls in Kamla Market (DELHI) 🔝 >༒9953330565🔝 genuine Escort Service 🔝✔️✔️9953056974 Low Rate Call Girls In Saket, Delhi NCR
 
Final demo Grade 9 for demo Plan dessert.pptx
Final demo Grade 9 for demo Plan dessert.pptxFinal demo Grade 9 for demo Plan dessert.pptx
Final demo Grade 9 for demo Plan dessert.pptxAvyJaneVismanos
 
Pharmacognosy Flower 3. Compositae 2023.pdf
Pharmacognosy Flower 3. Compositae 2023.pdfPharmacognosy Flower 3. Compositae 2023.pdf
Pharmacognosy Flower 3. Compositae 2023.pdfMahmoud M. Sallam
 
“Oh GOSH! Reflecting on Hackteria's Collaborative Practices in a Global Do-It...
“Oh GOSH! Reflecting on Hackteria's Collaborative Practices in a Global Do-It...“Oh GOSH! Reflecting on Hackteria's Collaborative Practices in a Global Do-It...
“Oh GOSH! Reflecting on Hackteria's Collaborative Practices in a Global Do-It...Marc Dusseiller Dusjagr
 
Enzyme, Pharmaceutical Aids, Miscellaneous Last Part of Chapter no 5th.pdf
Enzyme, Pharmaceutical Aids, Miscellaneous Last Part of Chapter no 5th.pdfEnzyme, Pharmaceutical Aids, Miscellaneous Last Part of Chapter no 5th.pdf
Enzyme, Pharmaceutical Aids, Miscellaneous Last Part of Chapter no 5th.pdfSumit Tiwari
 
Solving Puzzles Benefits Everyone (English).pptx
Solving Puzzles Benefits Everyone (English).pptxSolving Puzzles Benefits Everyone (English).pptx
Solving Puzzles Benefits Everyone (English).pptxOH TEIK BIN
 
Software Engineering Methodologies (overview)
Software Engineering Methodologies (overview)Software Engineering Methodologies (overview)
Software Engineering Methodologies (overview)eniolaolutunde
 
Incoming and Outgoing Shipments in 1 STEP Using Odoo 17
Incoming and Outgoing Shipments in 1 STEP Using Odoo 17Incoming and Outgoing Shipments in 1 STEP Using Odoo 17
Incoming and Outgoing Shipments in 1 STEP Using Odoo 17Celine George
 
MARGINALIZATION (Different learners in Marginalized Group
MARGINALIZATION (Different learners in Marginalized GroupMARGINALIZATION (Different learners in Marginalized Group
MARGINALIZATION (Different learners in Marginalized GroupJonathanParaisoCruz
 

Recently uploaded (20)

Earth Day Presentation wow hello nice great
Earth Day Presentation wow hello nice greatEarth Day Presentation wow hello nice great
Earth Day Presentation wow hello nice great
 
Roles & Responsibilities in Pharmacovigilance
Roles & Responsibilities in PharmacovigilanceRoles & Responsibilities in Pharmacovigilance
Roles & Responsibilities in Pharmacovigilance
 
KSHARA STURA .pptx---KSHARA KARMA THERAPY (CAUSTIC THERAPY)————IMP.OF KSHARA ...
KSHARA STURA .pptx---KSHARA KARMA THERAPY (CAUSTIC THERAPY)————IMP.OF KSHARA ...KSHARA STURA .pptx---KSHARA KARMA THERAPY (CAUSTIC THERAPY)————IMP.OF KSHARA ...
KSHARA STURA .pptx---KSHARA KARMA THERAPY (CAUSTIC THERAPY)————IMP.OF KSHARA ...
 
Meghan Sutherland In Media Res Media Component
Meghan Sutherland In Media Res Media ComponentMeghan Sutherland In Media Res Media Component
Meghan Sutherland In Media Res Media Component
 
ESSENTIAL of (CS/IT/IS) class 06 (database)
ESSENTIAL of (CS/IT/IS) class 06 (database)ESSENTIAL of (CS/IT/IS) class 06 (database)
ESSENTIAL of (CS/IT/IS) class 06 (database)
 
Painted Grey Ware.pptx, PGW Culture of India
Painted Grey Ware.pptx, PGW Culture of IndiaPainted Grey Ware.pptx, PGW Culture of India
Painted Grey Ware.pptx, PGW Culture of India
 
Historical philosophical, theoretical, and legal foundations of special and i...
Historical philosophical, theoretical, and legal foundations of special and i...Historical philosophical, theoretical, and legal foundations of special and i...
Historical philosophical, theoretical, and legal foundations of special and i...
 
call girls in Kamla Market (DELHI) 🔝 >༒9953330565🔝 genuine Escort Service 🔝✔️✔️
call girls in Kamla Market (DELHI) 🔝 >༒9953330565🔝 genuine Escort Service 🔝✔️✔️call girls in Kamla Market (DELHI) 🔝 >༒9953330565🔝 genuine Escort Service 🔝✔️✔️
call girls in Kamla Market (DELHI) 🔝 >༒9953330565🔝 genuine Escort Service 🔝✔️✔️
 
Final demo Grade 9 for demo Plan dessert.pptx
Final demo Grade 9 for demo Plan dessert.pptxFinal demo Grade 9 for demo Plan dessert.pptx
Final demo Grade 9 for demo Plan dessert.pptx
 
9953330565 Low Rate Call Girls In Rohini Delhi NCR
9953330565 Low Rate Call Girls In Rohini  Delhi NCR9953330565 Low Rate Call Girls In Rohini  Delhi NCR
9953330565 Low Rate Call Girls In Rohini Delhi NCR
 
Pharmacognosy Flower 3. Compositae 2023.pdf
Pharmacognosy Flower 3. Compositae 2023.pdfPharmacognosy Flower 3. Compositae 2023.pdf
Pharmacognosy Flower 3. Compositae 2023.pdf
 
“Oh GOSH! Reflecting on Hackteria's Collaborative Practices in a Global Do-It...
“Oh GOSH! Reflecting on Hackteria's Collaborative Practices in a Global Do-It...“Oh GOSH! Reflecting on Hackteria's Collaborative Practices in a Global Do-It...
“Oh GOSH! Reflecting on Hackteria's Collaborative Practices in a Global Do-It...
 
Enzyme, Pharmaceutical Aids, Miscellaneous Last Part of Chapter no 5th.pdf
Enzyme, Pharmaceutical Aids, Miscellaneous Last Part of Chapter no 5th.pdfEnzyme, Pharmaceutical Aids, Miscellaneous Last Part of Chapter no 5th.pdf
Enzyme, Pharmaceutical Aids, Miscellaneous Last Part of Chapter no 5th.pdf
 
Solving Puzzles Benefits Everyone (English).pptx
Solving Puzzles Benefits Everyone (English).pptxSolving Puzzles Benefits Everyone (English).pptx
Solving Puzzles Benefits Everyone (English).pptx
 
Model Call Girl in Tilak Nagar Delhi reach out to us at 🔝9953056974🔝
Model Call Girl in Tilak Nagar Delhi reach out to us at 🔝9953056974🔝Model Call Girl in Tilak Nagar Delhi reach out to us at 🔝9953056974🔝
Model Call Girl in Tilak Nagar Delhi reach out to us at 🔝9953056974🔝
 
Software Engineering Methodologies (overview)
Software Engineering Methodologies (overview)Software Engineering Methodologies (overview)
Software Engineering Methodologies (overview)
 
Incoming and Outgoing Shipments in 1 STEP Using Odoo 17
Incoming and Outgoing Shipments in 1 STEP Using Odoo 17Incoming and Outgoing Shipments in 1 STEP Using Odoo 17
Incoming and Outgoing Shipments in 1 STEP Using Odoo 17
 
Model Call Girl in Bikash Puri Delhi reach out to us at 🔝9953056974🔝
Model Call Girl in Bikash Puri  Delhi reach out to us at 🔝9953056974🔝Model Call Girl in Bikash Puri  Delhi reach out to us at 🔝9953056974🔝
Model Call Girl in Bikash Puri Delhi reach out to us at 🔝9953056974🔝
 
TataKelola dan KamSiber Kecerdasan Buatan v022.pdf
TataKelola dan KamSiber Kecerdasan Buatan v022.pdfTataKelola dan KamSiber Kecerdasan Buatan v022.pdf
TataKelola dan KamSiber Kecerdasan Buatan v022.pdf
 
MARGINALIZATION (Different learners in Marginalized Group
MARGINALIZATION (Different learners in Marginalized GroupMARGINALIZATION (Different learners in Marginalized Group
MARGINALIZATION (Different learners in Marginalized Group
 

Selection of Markets & Issues

  • 1. SELECTION OF MARKETS AND ISSUES: TRADING AND INVESTING
  • 2. SELECTION OF MARKETS AND ISSUES: TRADING & INVESTING Section I – 39% • Which Issues Should I Select for Trading? - Choosing Between Futures Markets and Stock Markets Which Issues Should I Select for Investing? • Top-Down Analysis • Secular Emphasis • Cyclical Emphasis • Stock Market Industry Sectors. • Bottom Up—Specific Stock Selection and Relative Strength • Relative Strength • Academic Studies of Relative Strength . • Measuring Relative Strength .
  • 3. SELECTION OF MARKETS AND ISSUES: TRADING & INVESTING Section I – 39% • Examples of How Selected Professionals Screen for Favorable • Stocks • William O’Neil CANSLIM Method • James P. O’Shaughnessy Method • Charles D. Kirkpatrick Method • Value Line Method • Richard D. Wyckoff Method
  • 4. Which Issues Should I Select? • Investment requires a certain aspect of the investor's time and energy, not to mention knowledge and psychological makeup, to profit. • Investing, including trading, breaks down into four general categories: 1) buy-and-hold - Buy-and-hold, basically a fundamental exercise in company and economy analysis, can be done once a year if necessary but more likely once a month, and drawdowns are of little concern because if the portfolio is properly diversified, whatever price declines that occur will likely be reversed over time. 2) position trading - Position trading takes more fundamental and technical research because the positions will turn over more frequently and usually an exit strategy is necessary, forcing the investor to watch positions more closely, say once per month or every few weeks.
  • 5. Which Issues Should I Select? 3) Swing Trading - Swing traders hold a position between one day and several months but mostly for only a few days or weeks. This method requires daily charts and daily inspection for patterns and leadership. swing trading requires a daily commitment that can still allow time for a job. They program their computers to search for new highs and lows, gaps, one- and two-day reversal patterns, range and volatility changes, volume changes, moving average crossovers, and any number of other short-term indicators of possible trend change in individual stocks and contracts. 4) Day Trading - day trading is completely technical and based on technical criteria such as price, volatility, tendency to trend, liquidity, volume, and a myriad of other technical evidence. Day trading requires a complete commitment to the markets
  • 6. Factors consideration Future V/s Cash Market Costs Risk Suitability Time Horizon Volatility Liquidity Volume Trading (Swing and Day)
  • 7. Which Issues Should I Select for Investing? Top Down Secular Emphasis Cyclical Emphasis Intermarket Analysis Bottom Up
  • 8. Top Down Approach • Top-down analysis begins with a study of the major markets such as interest rates, currencies, commodities, and stock market to determine which market has the highest possibility of profit in the future. • Top-down investing is an investment approach that involves looking at the overall picture of the economy and then breaking down the various components into finer details. • After looking at the big-picture conditions around the world, analysts examine different industrial sectors to select those that are forecast to outperform the market
  • 9. Top Down Approach • By first analyzing the overall picture, such as a macroeconomic trend, an investor can start narrowing potential companies to analyze. A trader that uses technical analysis may use top-down analysis as part of their trading system. • A day trader may first analyze daily or weekly charts to determine the asset's longer term trend, and strong support and resistance levels; and then move to a smaller time frame of charts, to determine a good entry point.
  • 10. Bottom Up Approach • Bottom-up investing is an investment approach that focuses on the analysis of individual stocks and deemphasizes the significance of economic cycles and market cycles. • The investor focuses his attention on a specific company, rather than on the industry in which that company operates or on the economy as a whole. • This approach assumes individual companies can do well even in an industry that is not performing.
  • 11. Bottom Up Approach • This approach assumes individual companies can do well even in an industry that is not performing. • Bottom-up investing forces investors to first consider microeconomic factors. • These factors include a company's overall financial health, financial statements, products and services, supply and demand, and other individual indicators of performance over time. • For example, a company's unique marketing strategy or organizational structure may be a leading indicator that causes a bottom-up investor to invest.
  • 12. Secular Emphasis • the concept of alternating emphasis in the markets on hard assets and soft assets over long secular periods. • Secular is a term used for any period longer than the business cycle. • Hard assets are solid commodities such as gold and silver; these assets traditionally are considered an inflation hedge. • Soft assets are financial assets, called paper assets, which primarily include stocks and bonds. •
  • 13. Secular Emphasis • The reason for the inverse relationship between the value of hard assets and of soft assets is that a close correlation exists between material prices and interest rates. • Inflation, or higher material prices, is generally associated with higher interest rates. • When inflation becomes a threat, paper assets, which decrease in value as interest rates rise, are undesirable as investments. • when hard asset prices decline, interest rates usually decline, and soft assets increase in value. • The theory that one or the other of these kinds of assets becomes popular for substantial periods is not a new one.
  • 15. Cyclical Emphasis • The longer secular economic trend are a number of business cycles. • These business cycles are of varying length but usually average around four to five years. • These business cycles are the normal horizon for most economists, business managers, and investors. • It is well recognized that leadership in the trading markets often switches within the business cycle. • Investment markets into three categories: commodities, bonds, and stocks. The business cycle affects each of these markets but in different ways.
  • 16. Cyclical Emphasis (U.S. Dollar and Gold ) • Murphy maintains that currency rates influence industrial prices but sometimes with a considerable lead. • The dollar is important in that it is the pricing currency for many of the world's raw materials such as oil, gold, and other precious metals. • When the dollar declines, it makes these commodities cheap in foreign currencies but expensive in dollar terms. • Thus, there is a leading inverse relationship between the U.S. dollar and raw materials prices in the United States
  • 17. Cyclical Emphasis (Gold and Bonds (Long-Term Interest Rates)) • By taking a ratio of the gold price to the U.S. Treasury bond futures, we see that at certain times, a signal is given by the ratio as to when to enter or exit the long-term bond market. • The reason is that the upward crossover in the ratio is not confirmed yet by an upward crossover in the favored gold price. • On the other hand, the bond market is edging slightly below its upward trend line and is in a position to be sold. • The bottom line is that the gold futures need to progress higher to confirm their relative strength, but bond futures can likely be sold right now.
  • 18. Cyclical Emphasis (Bond Market and Stock Market ) • Normal business cycle sequence, the next switch in markets is from the bond market to the stock market. • Actual deflation has become a threat and has upset the previous balance between interest rates and the stock market. • Nevertheless, a plot of the ratio of bonds to stocks, as shown in Figure 16.6, shows definite times when one or the other has the advantage.
  • 19. Cyclical Emphasis (U. S. Dollar and the Stock Market ) • The final analysis is to return to the beginning and see how the dollar and the stock market have interacted. • The dollar usually leads the industrial raw material market, which in turn generally leads the bond market, which in turn leads the stock market. • Dollar now has an excellent timing relationship with the stock market. • The dollar to stocks ratio gave a buy signal for the dollar and a sell signal for the stock market in December 2007, right at the peak in the stock market.
  • 21. Measuring Relative Strength • Relative strength is a momentum investing technique that compares the performance of a stock, exchange-traded fund (ETF) or mutual fund to that of the overall market. • By using specific calculations, investors can identify the strongest performers compared to the overall market, creating recommendations for investments. • When used as part of the aforementioned investment strategy, relative strength assumes a stock whose price has been rising will continue its upward trajectory. • Relative strength creates a point of comparison regarding the performance of a particular security against the performance of a selected benchmark, such as a market index, as well as to other similar securities. • Relative strength investing has both an entry and exit strategy; investors using this technique aim to buy securities exhibiting signs of strength while selling their holdings as soon as the associated securities begin to appear weak. • An investing technique in its own right, relative strength can also be applied to more complex strategies, such as pairs trading.
  • 22. Measuring Relative Strength • Relative strength is a measure of the price trend of a stock or other financial instrument compared to another stock, instrument or industry. It is calculated by taking the price of one asset and dividing it by another. • For example, if the price of Ford shares is $7 and the price of GM shares is $25, the relative strength of Ford to GM is 0.28 ($7/25). • This number is given context when it is compared to the previous levels of relative strength. • If, for example, the relative strength of Ford to GM ranges between 0.5 and 1 historically, the current level of 0.28 suggests that Ford is undervalued or GM is overvalued, or a mix of both. • It should also be noted that the ratio can also increase by combining an upward price move of Ford with a downward price move of GM. For example, if Ford shares rose to $14 and GM shares fell to $20, the relative strength would be 0.7, which is near the middle of the historic trading range.
  • 23. Measuring Relative Strength Percentage Change Method Alpha Method Trend Slope Method Levy Method William O'Neil CANSLIM Method James P. O'Shaughnessy Method Charles D. Kirkpatrick Method Value Line Method Richard D. Wyckoff Method
  • 24. Percentage Change Method • Jegadeesh and Titman used a six-month price change as their basic lookback calculation. • Lookbackis the period over which relative price strength is calculated. • The stocks then were sorted based on these rates of change. • They found that the higher decile stocks continued to be strong for the next three to ten months. • Their sample included both large capitalized and thinly capitalized and both high-priced and low-priced stocks. • All performed similarly both in the original experiment and in the subsequent out-of-sample tests.
  • 25. Alpha Method • Modern Portfolio Theory (MPT), stock prices are compared with an average, usually the S&P 500, weekly, over a year (and sometimes with different time intervals and period). • The weekly percentage change in the stock price is plotted versus the weekly percentage change in S&P 500, and a linear regression line is drawn through these plots on a best-fit basis. • The line so defined is expressed using the slope of the line, called the beta, and the intercept with the vertical axis, called the alpha. • Each stock over a specified period has an alpha and a beta. Traditionally, beta has been used as a measure of volatility relative to the S&P 500 and considered a definition of market risk. • Stocks that have a steep slope in their regression line and have a high beta demonstrate a proclivity to have higher gains than the S&P 500 when the market is higher but, also, larger losses than the S&P 500 when the market is
  • 26. Alpha Method • Alpha describes the value when the regression line crosses the 0% change in the S&P and is, thus, a measure of the trend relative to the S&P 500. • MPT suggested that high beta stocks would be more profitable but would also be more risky. • What they missed is that high beta stocks could also have negative alphas, suggesting that, although more volatile, their trends relative to the S&P could be downward. • When alpha is compared among stocks, it provides a relative strength measure, and stock lists can be ranked by alpha to show which issues are the strongest. • Alpha will change more frequently and more widely than beta, but beta is somewhat irrelevant to the relative price strength and has been largely discarded, even as a measure of volatility.
  • 27. Alpha Method • AAPL's beta of 1.6 implies that AAPL stock will, on average, move 60% more than the S&P 500 on a weekly basis. • The alpha of 1.55 indicates that AAPL has been outperforming the S&P by 1.55% on average over the 52 weeks in the plot. • It thus has a positive alpha and is a strong stock. Comparing AAPL's alpha to that of other stocks is a way to determine the strongest and best candidates for investment. • Graph shows alpha and beta of AAPL versus Standard and Poor’s 500, on SPX from minus 20 to 30 versus AAPL from minus 60 to 80 with plots for alpha equals 1.55 and beta equals 1.60.
  • 28. Trend Slope Method • The screening for relative price strength is to calculate the slope of the price curve in percentage terms over a specified period through a linear regression formula for each stock. • The stocks can then be ranked by the slopes of their price curves. • This method is similar to the alpha method and to the Jegadeesh and Titman method. • It is easier to calculate than the alpha method and does not suffer from the drop-off effect of a rate-of-change calculation beginning at an arbitrary price.
  • 29. Levy Method • Levy first calculated the ratio of the stock's current price to its 131 trading- day moving average. • He then ranked this ratio against the same ratio for all other stocks. • Levy also found that when the overall stock market headed downward into a lengthy bear market, relative strength continued to be reliable but gradually lost its ability to pick winning stocks, • When the final decline, the washout, occurred, those stocks having been relatively the strongest usually declined the most. • In his estimation, relative strength was, thus, a bull market selection process and should not be used when the stock market declines.
  • 30. William O'Neil CANSLIM Method • CANSLIM is an acronym for a method of picking stocks to buy, devised by William O'Neil (2002), publisher of Investor's Business Daily. • The breakdown of CANSLIM is as follows: C—Current quarterly earnings per share versus a year earlier A—Annual earnings increases N—New products, management, and stock price highs S—Supply and demand of stock L—Leader or laggard I—Institutional sponsorship M—Market direction
  • 31. William O'Neil CANSLIM Method • Technical analysts, are only concerned with L and M. • To determine L, leader or laggard, O'Neil calculates the 12-month percentage price change of every stock, weighted more heavily over the most recent 3 months, and ranks each stock in percentiles from 99 to 0, with 99 being the strongest. • The weighting over the past 3 months reduces the overall time for comparison and, therefore, improves the prospects of price strength continuing. • O'Neil found that the average relative strength percentile, by his calculation, was 87 before large upward moves.
  • 32. William O'Neil CANSLIM Method • For M, market direction, O'Neil refuses to listen to newsletters and “gurus” and refuses to use economic data because it lags behind the market. • He has a number of specific indicators and patterns he watches for signs that a market is bottoming. • He believes that the buy-and-hold method is faulty because the widely held belief that all stocks will recover after a bear market is a myth.
  • 33. James P. O'Shaughnessy Method • He studied market capitalization, price-to-earnings ratios, price-to-book ratios, price- to-cash flow ratios, price-to-sales ratios, dividend yields, earnings changes, profit margins, and return on equity. • He found that relative price strength, out of all the possible variables, fundamental and technical, was the only “growth variable that consistently beats the market” • It takes a ratio of the yearend price to the price one year prior. It is, thus, a 12-month relative price strength measure, a slightly longer-term calculation considering the history of relatively strong stocks remaining strong. • A multifactor investment strategy model called the Cornerstone Growth Strategy. It includes a primary screen for stocks with a price-to-sales ratio below 1.5, earnings greater than the previous year, and of those selected so far, the top 50 stocks in relative price strength.
  • 34. Charles D. Kirkpatrick Method • in using the stock price, he calculates the ratio of the closing price to the stock's moving average and then ranks all stocks by their ratio. • Second, Kirkpatrick uses the Levy calculation of relative price strength over six months in line with Levy's original work and that of later studies showing the importance of that period for post calculation continuation of price strength • Current relative price strength percentile from 2 to 97 versus relative price strength percentile three months ahead with plots for best fit percentiles, actual percentiles, and market average performance (50 percent). • It is positive, which suggests the higher the current relative price strength percentile, the higher will be the relative price strength percentile three months later. The best three-month performance comes from the highest level of current relative price strength percentile.
  • 35. Value Line Method • The Value Line Ranking System (www.valueline.com) has an extraordinary history of outperforming the stock market. • Value Line claims that its Timeliness Ranking system has outperformed the Standard & Poor's 500 by 16 to 1 since 1965. • • the company will not divulge its method of calculation, it does admit that a significant portion of it includes a calculation of relative price strength. • Factors include earnings trends, recent earnings, and earnings surprises. Value Line charges a fee for its stock services.
  • 36. Richard D. Wyckoff Method • A method of profiting from the stock market using technical analysis and relative price strength that has stood the test of more than 80 years is the method that has been taught by Richard DeMille Wyckoff • Wyckoff believed most strongly that stock prices were determined solely by “supply and demand.” He had little use for “tips, rumors, news items, earnings analyses, financial reports, dividend rates, and the myriad of other sources of information” or the “half-baked trading theories expounded in boardrooms and popular books on the stock market
  • 37. Richard D. Wyckoff Method • 1. To determine the direction of the entire market, Wyckoff devised an index called the Wyckoff Wave that was a composite of the most widely held and active stocks. • Preferably, the stocks in the index were the ones that the investor or trader was interested in trading. • His concept of trend was to watch trend lines drawn on the Wave chart and on charts of the composite market. • 2.To select the stocks in harmony with the market, Wyckoff selected stocks that were strong in upward trends and weak in downward trends. He believed it was futile to act against the trend. • His calculation of relative price strength used the percentage changes from wave highs to lows and lows to highs of each stock versus those of the Wyckoff Waves. • Those stocks that consistently outperformed in each wave in the direction of the longer wave trend were the ones to analyze further.
  • 38. Richard D. Wyckoff Method • 3.To determine the potential of those selected so far, Wyckoff used the point and figure horizontal count. • At the same time, a stop level was established, and for the stock to be considered further, a three-to-one ratio of potential gain to potential stop loss was necessary. • 4.To determine if the stock is ready to move, shorter-term considerations were needed to analyze the nature of its price action. • To do this, Wyckoff relied on volume, range, and to some extent, short-term momentum. This portion of his method relied heavily on experience and judgment. • 5.To time the entry, Wyckoff based his decision on the turning in the overall market. • His basis for this principle was that most stocks move with the market direction, and timing with the market change reduces the risk of error.