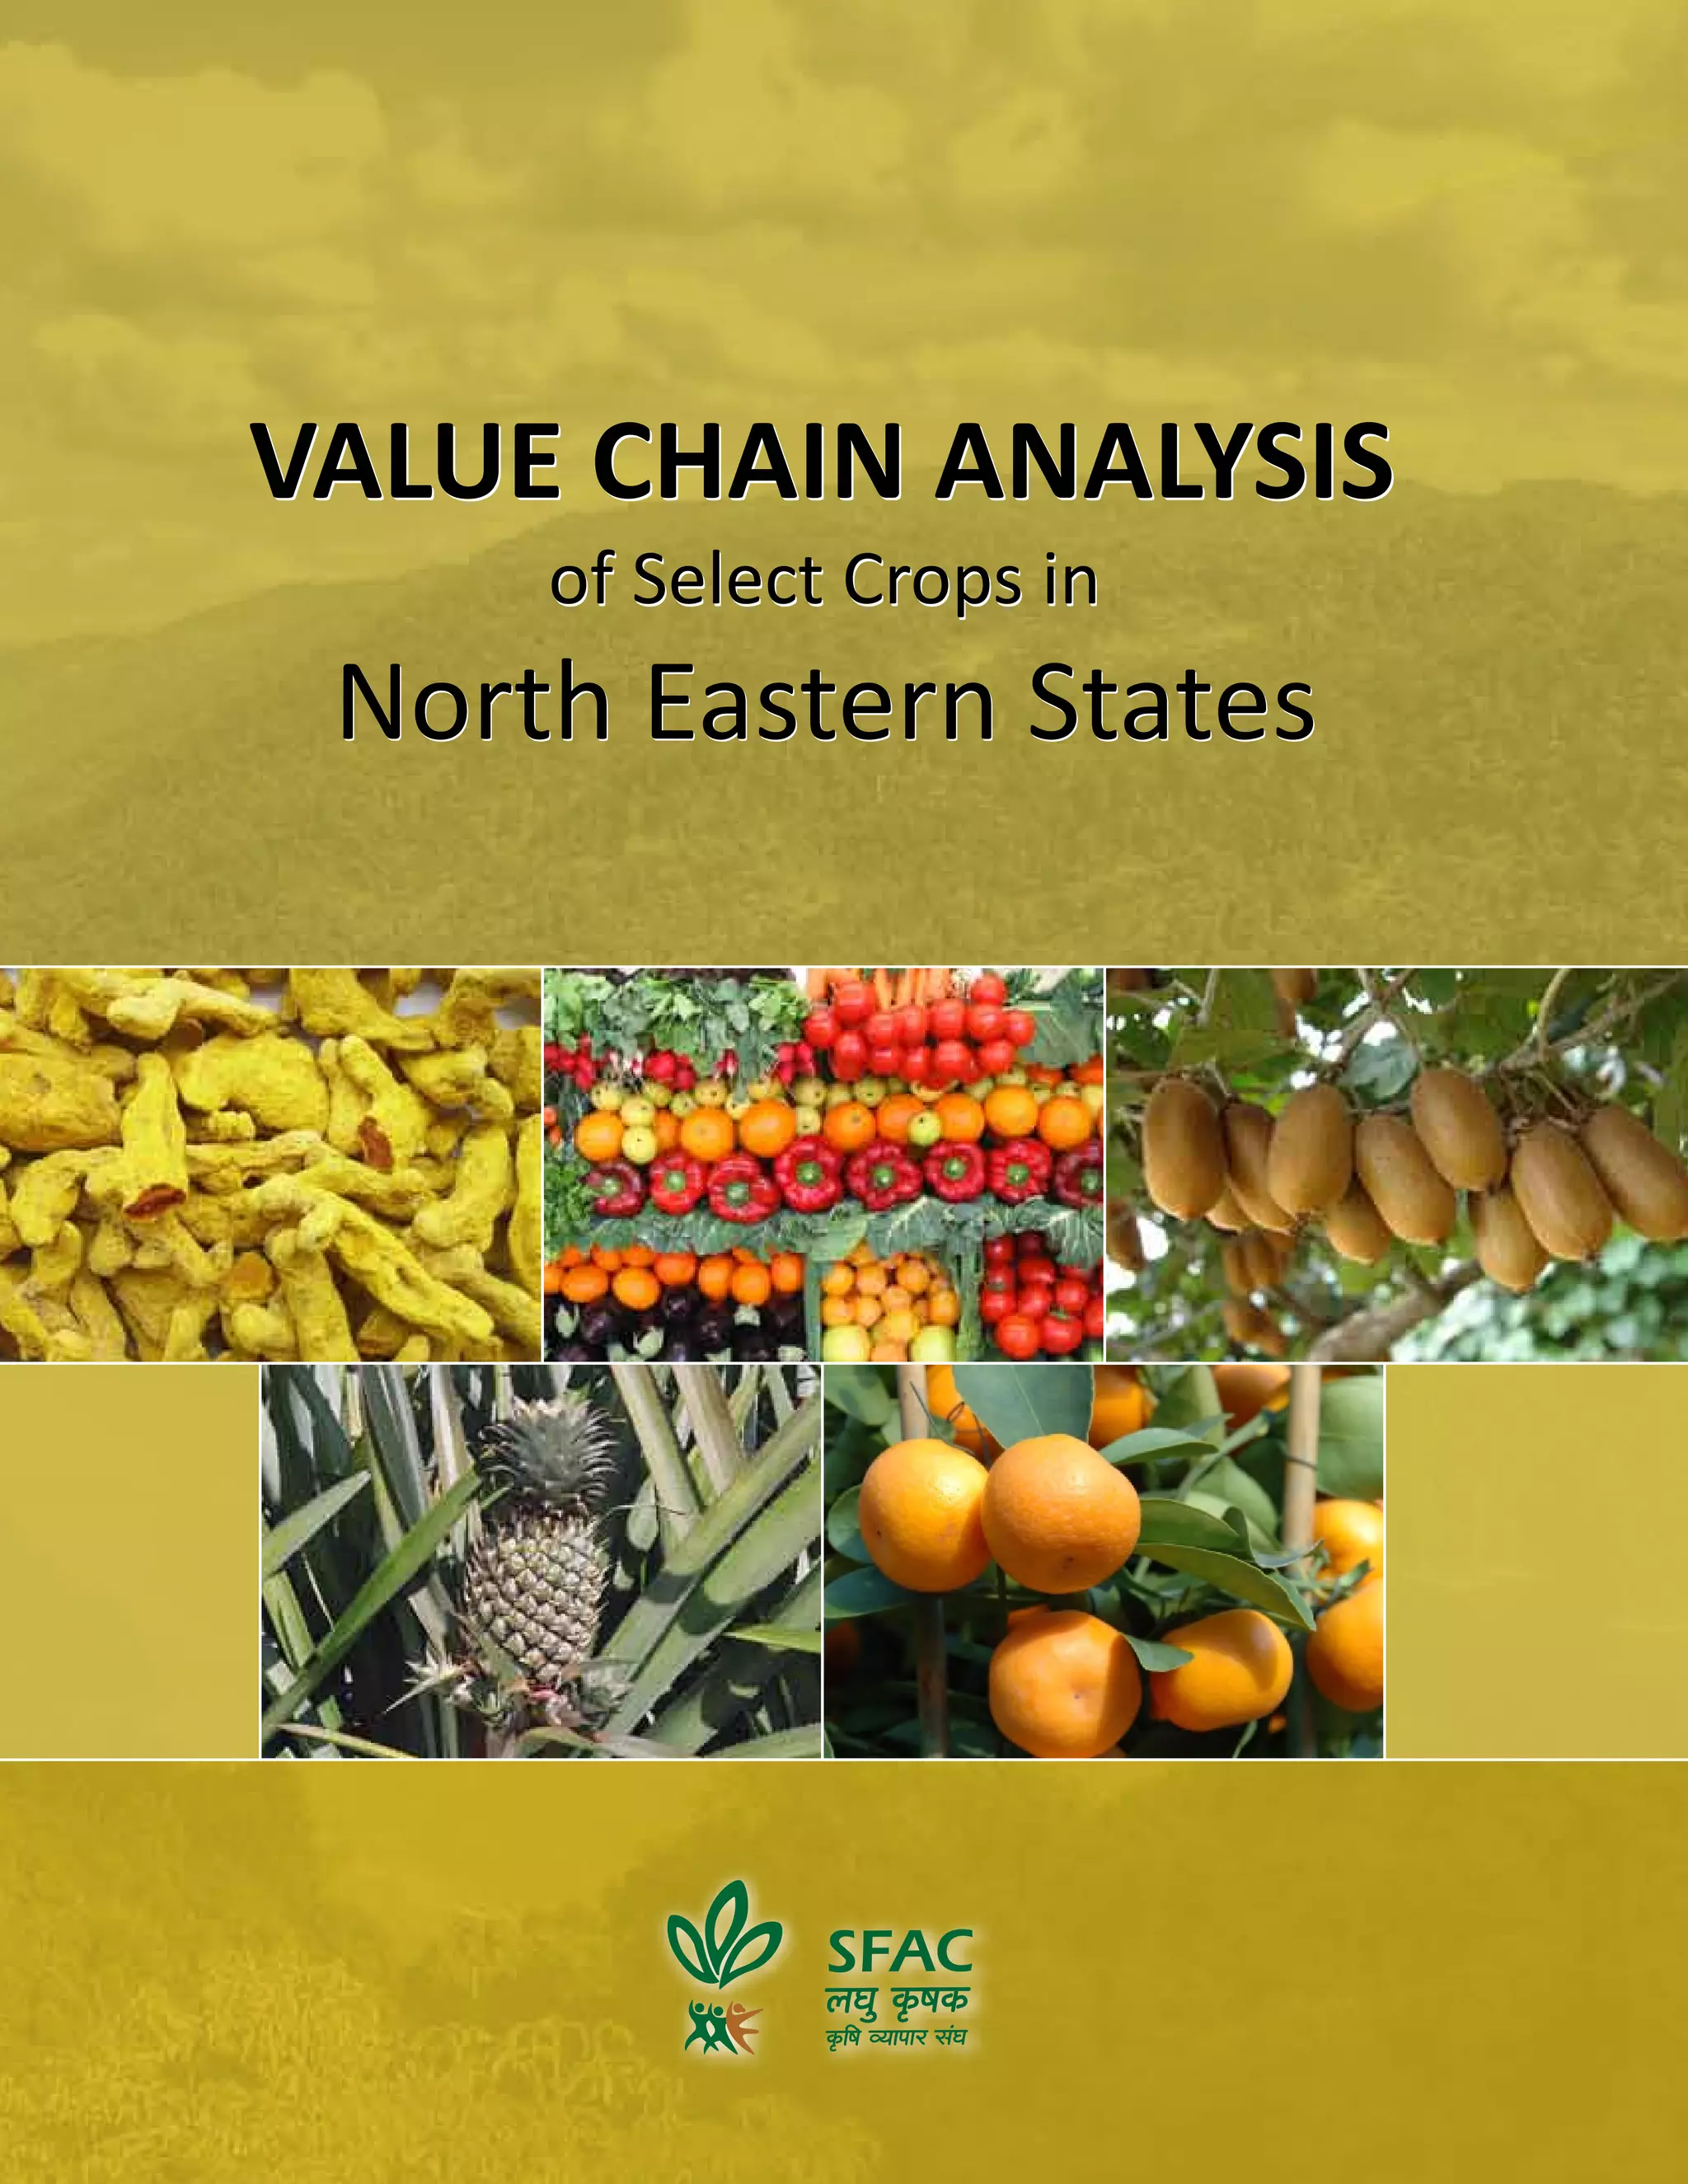
Contents
Chapter 1:	 Introduction 1
Project Background 2
Objectives 2
Scope of Work 2
Approach and Methodology 3
Significance of Value Chain Analysis Study 5
Chapter 2: The North East Region: An Overview 7
Strategic Location 7
Topography and Agro-Climatic Characteristics 7
Connectivity/Logistics 7
Demographic and Socioeconomic Characteristics 8
Agriculture 10
Swot Analysis of Agribusiness Scenario in North East Region 11
Chapter 3:	 Horticulture Scenario in North East Region 13
State-wise Profile 15
Arunachal Pradesh 15
Assam 19
Manipur 23
Meghalaya 26
Mizoram 30
Nagaland 33
Sikkim 37
Tripura 41
Chapter 4:	 Identification of Focus Crop Groups 45
Product-wise Contribution of States in Ner Production Basket (2010-11) 46
Product-wise Contribution of States in Ner Production Value (2010-11) 47
Identified Focus Crop Groups Based on the Parameters Identified for
Selection Criteria 49
Identified Production Clusters of FCGs 50
Seasonality of Selected FCGs 51
Chapter 5:	 Value Chain Analysis 53
Pineapple 53
Assam 54
Tripura 56
Meghalaya 59
Nagaland 60
Citrus 64
Assam 64
Manipur 69
Meghalaya 71
Sikkim 73
iv Value Chain Analysis of Select Crops in North Eastern States
Ginger 75
Assam 75
Meghalaya 77
Sikkim 79
Turmeric 81
Assam 81
Meghalaya 82
Mizoram 84
Naga Chilli 86
Nagaland 86
Passion Fruit 87
Nagaland 88
Kiwi Fruit 89
Arunachal Pradesh 90
Large Cardamom 92
Sikkim 92
Vegetables 93
Assam 94
Meghalaya 103
Conclusion 107
Chapter 6:	 Benchmarking with Existing Best Practices 109
Pineapple 109
Mandarin 110
Ginger 111
Turmeric 111
Chapter 7:	 Conclusion  Recommendations 113
Land Tenure and Ownership System 113
Poor Cultivation Practices and Low Productivity 113
Poor and Weak Extension System 114
Poor Logistics and Connectivity 114
Poor Marketing and Post-Harvest Infrastructure  115
Lack of Processing Industries 115
Recommendations 116
Pineapple 116
Citrus 118
Ginger 120
Turmeric 122
Vegetables 123
Naga Chilli 124
Passion Fruit 124
Kiwi Fruit 125
Large Cardamom 125
Annexure 1 126
Annexure 2 133
Literature Reviewed 163
LIST OF ABBREVIATIONS
AGMARKNET 	 Agricultural Marketing Information Network
APMC 	 Agricultural Produce Marketing Committee
FCGs	 Focus Crop Groups
FGDs 	 Focussed Group Discussions
GDP 	 Gross Domestic Product
ha	 Hectares
ISAP 	 Indian Society of Agribusiness Professionals
KVK 	 Krishi Vigyan Kendra
MAPs	 Medicinal  Aromatic Plants
MoDoNER 	 Ministry of Development of North Eastern Region
MSL 	 Mean Sea Level
MT 	 Metric Tonnes
NE 	North East
NEC 	North Eastern Council
NEDFi 	 North Eastern Development Finance Corporation Ltd.
NER	North Eastern Region
NERAMAC 	North Eastern Regional Agricultural Marketing Corporation Limited
NHB 	National Horticulture Board
SFAC 	 Small Farmers’ Agribusiness Consortium
VCA 	 Value Chain Analysis
Preface
The North East region of India, comprising of the state Assam, Arunachal Pradesh, Manipur,
Meghalaya, Mizoram, Nagaland, Tripura and Sikkim, is a reservoir of rich natural resources.
All the North-Eastern States have distinct advantages, and provide immense economic and
trade opportunities to domestic and international players. The NE region shares borders
with China in the north, Bangladesh in the South-West, Bhutan in the North-West and
Myanmar in the East. This makes the North-East a prospective hub of international trade
and commerce.
Unlike the rest of India, North East India has an added demographic advantage, in the
sense that it occupies 7.8 percent of the country’s total land space but has a population of
only 44 million, which makes it approximately 3.80 percent of the country’s population.
Blessed with rich biodiversity, conducive agro climatic conditions, forest wealth, fruits and
vegetables, flowers, herbs and aromatic plants, rare and rich flora and fauna, NE India has
all the potential to transform into a commercial horticulture hub.
The area is a vibrant source of varied horticultural crops, which can be linked to distant
markets within the country as well as for export. Horticultural crops in the NE region cover
857 thousand ha, constituting 2.34% of the total horticulture area in the country. From
the production point of view, NE region produces about 7815 thousand MT of horticulture
produce and contributes 6.79% to the total production basket of the country.
Major horticultural crops grown in the NE region include citrus, pineapple, kiwi, mango,
guava, litchi, banana among fruits, potato, onion, tomato, cauliflower, cabbage, brinjal,
beans among vegetables, chrysanthemum, rose, orchids etc. in flowers, ginger, turmeric
large cardamom, coriander, cumin among spices and cashew nut, arecanut and tea among
plantationcrops.TheproductivityofmanyofthehorticulturalcropsinentireNEregionismuch
below the National level. This weakness of the region can be converted into an opportunity,
and productivity and production levels can be increased significantly to enhance the total
production at national level, to meet the ever-growing demand for horticulture produce.
Since horticulture provides higher return per unit of land and generates higher employment,
development of horticulture also helps in alleviating the economic condition of people below
the poverty line.
However, despite these distinct advantages, North-East horticulture has not grown at par
with the rest of the country, and the region’s horticulture potential has not been tapped,
mainly due to lack of market led production practices, poor commercial understanding of
farmers, insufficient infrastructure at the farm level, poor transportation system, inadequate
road network, lack of post harvest infrastructure like dedicated markets, pack houses, cold
storages, sorting grading lines, processing industries etc. Due to the lack of adequate post
harvest infrastructure in the region, not only are post harvest losses high, but dependency
of farmers on intermediaries for marketing is very high.
viii Value Chain Analysis of Select Crops in North Eastern States
With significant initiatives taken by the Government of India to promote horticulture
development in the North-East region, appropriate strategies like adoption of market-
driven production system, enhancement of productivity, appropriate post-harvest handling
through proper packaging, loading/unloading of commodities and promotion of pack house
concept including collection centre in the production clusters, cold storage, processing and
value addition, creation of adequate transportation infrastructure and organised marketing
system are necessary additions to current interventions to provide remunerative prices to
farmers.
With necessary infrastructure development within the region, and the building of connecting
links between North-East and the rest of India, and North-East and South-East Asia, the
horticulture potential of the region can be suitably exploited. Time-bound implementation of
projects, monitoring of fund–flows and necessary marketing and branding of the region can
truly transform this goldmine region into a vibrant hub of horticulture business and trade.
ThisvaluechainstudybySmallFarmers’AgribusinessConsortiumisaninitiativetounderstand
the working of the production and supply chain of major high value works in the NE region
and recommend or strategy to achieve the goal of making the North-Eastern region a true
horticulture hub, not only of India but of the entire South-East Asian region.
C hap t e r
Introduction
1
The North Eastern Region (NER) of India includes the states of Arunachal Pradesh, Assam,
Manipur, Meghalaya, Mizoram, Nagaland, Sikkim and Tripura. The eight states share
a number of attributes such as frontier locations, rich natural resources, variety in agro-
climatic conditions and inherited potential of growing various types of crops. Out of a total
geographical area of the region, 65% is under undulating tracks and hills and remaining 35%
is plain.
The North Eastern Region falls under the high rainfall zone and the climate ranges from
tropical to alpine. The region is physiographically characterised by difficult terrain, wide
variations in slopes and altitudes and traditionally indigenous cultivation practices.
Agriculture constitutes of 26% of the total GDP of NER and is one of the major contributors
to the economy of North Eastern States, engaging one-third of the total work force in the
region. The eight contiguous states of undulating terrains cover a total geographical area of
2.62 lakh Sq Km, out of which the gross cultivable area is 65,500 Sq Km. Paddy and maize
dominate the rain-fed hill ecosystem, however, in selected areas, horticulture is emerging
as a primary source of income for the farmers due to conducive physiographic conditions
of the region. Assam and Tripura are the major states producing fruits and vegetables,
with Assam leading with a contribution of 60 percent to the total horticulture produce
of NER.
State-wise share of horticulture in NER is as follows:
Assam 60%
Arunachal Pradesh 4%
Manipur 7%
Meghalaya 9%
Mizoram 1%
Nagaland 2%
Tripura 15%
Sikkim 2%
Figure 1: State-wise Contribution to Horticulture in NER
Source: ISAP Analysis  NHB Data, 2011
2 Value Chain Analysis of Select Crops in North Eastern States
Project Background
North East Region is endowed with diverse agro-climatic conditions which are conducive for
cultivation/production of varied horticultural crops. Though NER has the potential to achieve
maximum productivity, but it has not been capitalised so far because of various factors In
order to evolve a strategic module for the wholesome development of horticulture, there is
a need to identify gaps, efficiency levels, inherited advantages across value chain of potential
horticultural crops of the North Eastern region.
With this background, Small Farmers’ Agribusiness Consortium (SFAC) has decided to conduct
a detailed value chain study of Focussed Crop Groups (FCGs) of North Eastern Region and
has engaged the Indian Society of Agribusiness Professionals (ISAP) for this purpose. The
study comprises of mapping of main and supporting activities of production, post-harvest
operations, logistics, marketing and services etc.
Objectives
The specific objectives of the Value Chain Analysis were as follows:
To map the movement of price and journey of the raw materials from farmers to™™
commission agent, traders, processors, wholesalers, retail chains and ultimately to
the end consumer;
To track the food miles;™™
To identify the location of the proposed collection centres in terms of the sustainable™™
supply and profitability;
To locate and pin point possible collection centres for the above mentioned crop™™
groups;
To develop the proposed crop calendar: Activity calendar from sowing to harvesting™™
across various months;
To calculate the number of man-days utilised for various crop groups in the district;™™
To separate peak and off season of focus crop groups;™™
To study particular crops from the view point of various stakeholders such as farmers,™™
traders, consumers etc.
Scope of Work
The following six focus crop groups have been identified for detailed value chain mapping
and analysis:
Root spices – Ginger/turmeric1.	
Citrus – Mandarin/oranges and lemon2.	
Pineapple3.	
Naga Chilli4.	
Vegetables – Legumes, solanaceous, cruciferous, cucurbitaceous and others5.	
Others – location-specific crop groups6.	
The project entailed studying the primary and supporting value chain activities for each of
the six focus crop groups. The following activities were mapped under the project:
3Chapter 1 | Introduction
Primary Value Chain Activities
Inbound logistics™™
Operations™™
Outbound logistics™™
Marketing and sales™™
Service™™
Supporting Value Chain Activities
Procurement™™
HRM™™
Technology development™™
Infrastructure™™
Approach and Methodology
Approach
As the scope of study required in-depth understanding of the product flow, its treatment
at each level, price markup, roles being played by each value chain player as well as
factors affecting the value chain, ISAP has adopted a combination of research tools
including secondary and primary research followed by quantitative and qualitative
assessment for comprehensive analysis to achieve the desired results and objective of
the study.
Methodology
Secondary Research
This step served as a prefix of study, providing basic understanding of regions and helped
in developing the approach for the next stage of the study. Secondary information helped in
understanding the crop profile of catchment areas, existing levels of production, marketing
infrastructure available for focus crops groups as well as infrastructure facilities for logistics,
storage and marketing.
The following data sources were targeted for collecting various data and information:
Data gathering from NHB, AGMARKNET, NEDFi, NERAMAC, State Horticulture Deptt.™™
and other database to ascertain:
Current production, surplus, domestic  international tradeƒƒ
Information on current status of the infrastructure  basic facilitiesƒƒ
Literature study on current supply  value chains™™
Primary Research and Qualitative Assessment
An interaction was held with all the stakeholders in the identified belts and region and focus
group discussions helped to gather information on the situation of horticulture across
the value chain. This has lead to finding out the gaps and suggestions provided by all the
stakeholders.
4 Value Chain Analysis of Select Crops in North Eastern States
The following stakeholders across the value chain of horticulture produce were targeted in
the identified clusters:
Farmers™™
Intermediaries™™
Commission agents, wholesalers and retailers™™
Service providers (logistics, storage, pack houses)™™
Govt. officials including horticulture department, KVKs, APMCs, research stations,™™
academic institutes etc.
The stakeholders were selected on the basis of secondary information on area and
production, as well as by interacting with the state government officials. Interactions were
either facilitated by the government officials at the local level or were introduced for getting
desired information and inputs. In addition to the line department of the state governments,
meetings were held with other concerned agencies/organisations/institutions involved
directly or indirectly in the production and marketing of selected crops.
Focus Group Discussions (FGDs)
Two to three FGDs in each identified cluster of focus crop groups was conducted in each
state. A focus group comprised of 8-10 people, in some cases it was a homogenous group
comprising of crop producers, while in some cases, it was a heterogenous group and
comprised of prominent stakeholders. In each focus group there were 4-5 focus crop growers,
1-2 grower/s willing to grow in future and 2-3 extension worker/marketing service providers.
FGDs were conducted to understand the value chain – production practices, technology
adoption, cultivation costs, movement of product and price markup from farm gate to the
local and distant markets.
• Identification
of area/
region of
study for
each focus
crop groups
• Literature
Study on
current
supply 
value chains
• Focussed
Group
Discussions
(FGDs) with
farmers
• Focussed
Group
Discussions
(FGDs) with
Traders
• Validation of
data by
means of
in-depth
interviews
with all value
chain actors
• Analysis of
Secondary 
Primary Data
• Draft Report
Submission
• Feedback
incorporation
• Finalisation
of report
Compilation 
Final Report
Submission
Analysis 
Report Writing
Validation of
Data
Primary
Research
Secondary
Research
Week 0-6 Week 6-8 Week 8-10
Week 6-14
Week 14-16
Figure 2: Approach  Methodology
5Chapter 1 | Introduction
In-depth Interviews
Discussion and in-depth interviews were held with state government officials, experts and
policy makers.
Analysis, Compilation and Report Writing
The following steps were followed for report writing:
Secondary data analysis™™
Analysis of in-depth interviews and FGDs™™
Compilation of data and analysis™™
Draft report writing™™
Significance of Value Chain Analysis Study
Value Chain Analysis Study helps to map the value chain of a specific product involving various
value chain actors, which may use qualitative or quantitative approach. While the produce
moves from one chain actor to another chain actor, it gains value in the form of price markup.
The chain actors who actually transact a particular product as it moves through the value
chain, include input dealers (e.g., seed suppliers), farmers, traders, processors, transporters,
wholesalers, retailers and final consumer.
The value chain framework has been used as a powerful analysis tool for strategic
planning and is useful in identifying and understanding crucial aspects to achieve
competitive strengths and core competencies in the marketplace. The model also
reveals how the value chain activities are tied together to ultimately create value for the
consumer.
In order to conduct the value chain analysis, the activities are split into primary and
support activities (Figure VCA Framework). Primary activities are those that are related
with production, while support activities are those that provide the background necessary
for the effectiveness and efficiency, such as human resource management.
The primary and secondary activities are discussed in detail below:
Primary activities
The primary activities include the following:
Inbound logistics:™™ The activities concerned with receiving the material and handling
them.
Operations:™™ The activities related to quality checks, processing, packaging, labelling
of products etc.
Outbound logistics:™™ All the activities concerned with distributing the final product to
the consumers.
Marketing and sales:™™ This functional area essentially analyses the needs and wants
of consumers and is responsible for creating awareness among the consumers about
the products and attract consumers to their products.
6 Value Chain Analysis of Select Crops in North Eastern States
Support activities
The support activities include the following:
Procurement:™™ This function is responsible for purchasing the materials that are
necessary for the operations. An efficient procurement department should be able to
obtain the highest quality goods at the lowest prices.
Human Resource Management:™™ This is a function concerned with recruiting, training,
motivating and rewarding the workforce. Human resources are increasingly becoming
an important way of attaining sustainable competitive advantage.
Technology Development:™™ This is an area that is concerned with technological
innovation, training and knowledge that is crucial today in order to survive.
Infrastructure:™™ Thisincludesplanningandcontrolsystems,suchasfinance,accounting
and corporate strategy etc.
It is important to analyse the value chain with the core competence at its very heart. The
nature of value chain activities differs greatly in accordance with the types of industries.
The five primary activities and four support activities form an interdependent system that is
connected by linkages. The first step in conducting the value chain analysis is to break down
the key activities according to the activities entailed in the framework. The next step is to
assess the potential for adding value, through the means of cost advantage or differentiation.
Finally, it is imperative for the analyst to determine strategies that focus on activities that
would enable to attain sustainable competitive advantage.
Value chain analysis, specifically in case of studying various horticultural products of North
Eastern region has specific relevance. The markets for most of the crops being produced or
targeted for production are distant domestic markets and export markets. For a product of
NER to be competitive, it is necessary to achieve price parity in these markets. Value chain,
in this regard helps in defining the benchmarks for selected crops to compete in the market
and therefore in the identification of key strengths, weaknesses, comparative advantages or
disadvantages and analysing the efficacy and efficiency of the entire value chain as well as in
finding solutions, interventions and identified challenges.
With this background and adopting this approach and methodology to achieve the objective
of the study, we need to study in detail the horticulture scenario of the entire NER.
• Inbound
Logistics
• Operations
• Outbound
Logistics
• Marketing
and Sales
• Procurement
• Technology
Development
• Human Resource
Management
• Infrastructure
The difference
between the total
value and the
cost of
performing the
value activities
Added
Value or
Prices
Support
Activities
Primary
Activities
Figure 3: VCA Framework
C hap t e r
The North East Region: An Overview
2
The region falls in the foothills of the Himalayas in the eastern range and is surrounded by
Bangladesh, Bhutan, China, Nepal and Myanmar. It includes the seven states - Arunachal
Pradesh, Assam, Manipur, Meghalaya, Mizoram, Nagaland and Tripura, along with a smaller
state in the Himalayan fringes, namely, Sikkim.
Strategic Location
The location of the region is geo-politically important as it shares international boundaries
with China and Bhutan in the north, Myanmar in the east, Nepal in the west and Bangladesh
in the south and west. This strategic location of NER makes it the potential hub for export
of horticultural produce to neighbouring countries in order to cater to their growing need.
It also aids the supply of produce to distant markets in India.
Topography and Agro-Climatic Characteristics
The entire NE Region is located between 22°1’ and 29°31’ North latitude and 89°47’ and
98°55’ East longitude. The region is traversed by the Brahmaputra-Barak river systems and
their tributaries.
The topography of the area varies from mountainous to plateaus, foothills to riverine plains
with altitudes ranging between 100 m to 8400 m from MSL. Being predominantly hilly terrain,
altitudinal variation within limited geographical area is the characteristic feature of this
region. The region is endowed with all types of climatic conditions ranging from tropical to
alpine and it receives rainfall ranging from 150-250 cm.
Connectivity/Logistics
Air Connectivity
All the states in the region are connected by air, expect Arunachal Pradesh and Meghalaya.
NE Region has 10 airports, however 3 state capitals lack airport facility (Itanagar, Gangtok 
Shillong).
Looking at the development in the region and potential for international trade with South
East Asia, upgradation and improvement of air connectivity is vital.
8 Value Chain Analysis of Select Crops in North Eastern States
Rail and Road Connectivity
Poor infrastructure development in terms of roads, railways, waterways, power and water is
the main constraint in the development of NE Region. From the trade point of view, existing
rail infrastructure is mainly limited to Assam (broad gauge track). However, improvement
of road infrastructure work is under progress in some states of the NE Region. The entire
NE Region shares three important border roads i.e. Stilwell road or the Ledo road (connects
Assam to China), the Numaligarh-Mreh road (connects Assam, Nagaland  Manipur to
Myanmar) and the Aizawl-Champhai-Zowkathar road (connects Mizoram to Myanmar). These
border roads are crucial for the development of the NE Region. Of the three border roads,
two are operational at present from the point of border trade. Proper infrastructure needs
to be developed at these border points to boost trade between the countries. This in turn will
benefit the entire NE Region. Discussions are in progress with the Bangladesh government
to give road access for transportation of goods of Indian origin from West Bengal to Tripura
through transit corridors. If such a proposal goes through, the transit time to the NE Region
from other parts of the country will reduce substantially.
Inland Waterways
Opening of inland water route and access to the Chittagong port is important as it serves
as a trade gateway for India to East Asian countries. This could provide a business basket to
entire NE Region.
Demographic and Socioeconomic Characteristics
The eight states constitute 7.9 percent of the country’s total geographical area, but have only
approximately 4% of the total population of the country. Over 68 percent of the population
of the region lives in the state of Assam alone. The density of population varies from 16 per
sq km in Arunachal Pradesh to 396 per sq km in Assam.
State Airports
Assam Guwahati, Dibrugarh, Tejpur, Jorhat, Silchar
Nagaland Dimapur
Manipur Imphal
Tripura Agartala
Mizoram Aizawl
W. Bengal Bagdogra
Table 1: Existing Airport Facilities in NER
9Chapter 2 | The North East Region: An Overview
StateArunachal
Pradesh
AssamManipurMeghalayaMizoramNagalandSikkimTripura
Geographical
Location
27.06°Nand
93.37°E.
Sharesits
national
borderwith
Nagaland
andAssam
towards
southand
international
borderwith
Chinatowards
north,Bhutan
towardswest
andBurma
towardseast
26.14°Nand
91.77°E,the
northeastern
stateofAssam
liesinthe
rivervalleys
ofBarakand
Brahmaputra.
Assamis
borderedby
WestBengaland
theotherstates
oftheSeven
Sistersalong
withcountries
likeBhutanand
Bangladesh
24.817°N
and93.95°E,
Manipurhas
gotthestateof
Nagalandtoits
north,Assam
toitswest
andMizoram
toitssouth.
Thestate
hasevengot
international
bordersby
Burmatoits
east
25.57°Nand
91.88°E,
Meghalayais
surrounded
bythestate
ofAssamin
northandthe
countryof
Bangladeshin
south
23.36°Nand
92.0°E.This
northeastern
statesharesits
nationalborder
withAssam,
Manipurand
Tripuraand
international
borderwith
Burmaand
Bangladesh
25.67°Nand
94.12°E,
thestateis
encircledby
Assamand
Arunachal
Pradeshinthe
north,Manipur
inthesouth
andBurmain
theeast
27.33°Nand
88.62°E,this
landlocked
stateofIndia
liesinthe
Himalayan
range.Sikkim
sharesits
borderwith
Tibettowards
northandeast,
Nepaltowards
west,Bhutan
towardssouth-
eastandWest
Bengaltowards
south
23.84°Nand
91.28°E.This
thirdsmallest
Indianstate
isbordered
byMizoram
andAssam
towardseast.
Itsposition
makesitshare
mostofits
boundarywith
Bangladeshon
alltheother
threesides
No.ofDistricts16279781144
Geographical
Area(sqkm)
83,74378,55022,34722,72021,08116,5797,09610,491,369
Population1,382,61131,169,2722,721,7562,964,0071,091,0141,980,6026,07,6883,671,032
Densityof
Population
(persqkm)
16.5396.8121.8130.551.811985.6349.9
LiteracyRate66.95%76.30%79.85%72.10%89.90%63.70%76.60%87.75%
NetAreaSown
perthousand
ha
211275323628495316107280
TotalCropped
Areaper
thousandha
276398423633795402118295
Source:StateDepartments’websites,NEDFiData
Table2:ComparativeSocioeconomicProfileofNEStates
10 Value Chain Analysis of Select Crops in North Eastern States
Agriculture
As per the available data (NEDFI-2008-09), NE Region has 19% of net sown area. Jhum
cultivation is widely prevalent in the entire NE Region (around 1.6 million hectare area is
under shifting cultivation).
Agriculture is predominantly characterised by low cropping intensity, subsistence
farming and monocropping. Farming is mixed type and predominantly rice-based.
With the present production level, foodgrain deficiency in the region is around 1.6 million
tonnes.
Subsistence nature of agriculture, low intensity of farming and minimal use of inorganic
fertilisers has resulted in retaining the characteristics of soil. In a majority of the
region, irrigation facilities are inadequate. Absence of post-harvest, value addition
infrastructure and marketing facilities gives the region a unique advantage. Overall the
agriculture sector in the entire NE Region has remained unexploited and therefore offers
vast opportunities.
Forests 58%Not Available for Cultivation 16%
Other Uncultivated Land
Excluding Fallow Land 3%
Fallow Land 4%
Net Area Sown 19%
Figure 4: Land Utilisation Statistics of NE Region (2008-09)
Source: MoDoNER  NEC
11Chapter 2 | The North East Region: An Overview
SWOT Analysis of Agribusiness Scenario in North East Region
The chapter above has covered an overview and a brief glimpse of the NE Region, however,
in the following chapters, a detailed description of the horticultural scenario and its potential
has been included.
Strengths
− Agro climatic diversity ranging from
tropical to alpine making it possible to
grow a wide variety of crops
− Rich biodiversity
− Rich surface water resources through
perennial rivers and its tributaries
− Proximity to export destinations such
as Bangladesh and Myanmar
− Soil is rich in organic matter
− Potential to commercialise products such
as kiwi and passionfruit
Opportunities
− Organic farming
− Infrastructural facilities can be
created with the participation of
private sector
− The number of government policies
available for the NER can serve as
a boosting factor for agricultural
development
− International markets can be
targeted due to geographical
location and availability of produce
− Huge scope for value addition of
surplus produce
Weaknesses
− Lack of infrastructural facilities along
the food value chain
− Lack of market access - domestic 
international
− Limited flow of men and material due
to hilly terrain
− Jhum cultivation and subsistence
farming is leading to deterioration of
available resources
− Non-availability of skilled manpower
− Lack of business acumen
Threats
− Slow growth of infrastrucutre links
− Uncertainty in external trade scenario
SWOT
Figure 5: SWOT Analysis of Agribusiness Scenario in NE Region
C hap t e r
Horticulture Scenario in North East Region
3
Different sources have been analysed to compile the data of area and production of different
horticultural crops in the North Eastern Region, such as National Horticulture Board, NEDFi
and State Horticulture Department. However, the data of area and production of crops in
NER available with different sources vary widely. Availability of systematic and accurate
estimate of area and production of different horticultural crops is limited.
According to the data available (2010-11), horticultural crops cover 857 thousand ha,
constituting 2.34% of the total horticulture area in the country. From the production point of
view, NE Region produces about 7815 thousand MT of horticulture produce and contributes
6.79% to the production basket of the country.
Within the horticulture sector in the NE Region, fruit crops occupy 40.14%, vegetables
51.83% and spices 8.03% area. From the production point of view, fruit crops contributed
37.75%, vegetables 57.60% and spices 4.65% to the horticulture production basket of the
Source: NHB and State Departments, 2010-11
Crops NER India
Area (ha) Production
(MT)
Productivity
(MT/ha)
Area (ha) Production
(MT)
Productivity
(MT/ha)
Fruits 344,379 2,950,328 8.57 6,382,559 74,877,530 11.73
Vegetables 444,603 4,502,091 10.13 8,494,545 146,554,465 17.25
Spices 68,858 363,527 5.28 2,940,389 5,350,468 1.82
Grand Total 857,840 7,815,946 9.11 17,817,493 226,782,463 12.73
Table 3: Crop-wise Area, Production and Productivity of Horticultural Crops in NE
Region (2010-11)
Fruits
40.14%
37.75%
51.83%
57.60%
8.03%
4.65%
Vegetables Spices
Area Production
Figure 6: Share in Area  Production of Horticulture Crops (2010-11)
Source: ISAP analysis, NHB  State Department Data
14 Value Chain Analysis of Select Crops in North Eastern States
NE Region. Considering the excellent climatic conditions, abundant rainfall and fertile soil
(high organic content) of the region, the productivity of different horticultural crops is quite
low as compared to national productivity.
Among fruits, citrus has the largest area under cultivation (34%), followed by banana (24%),
pineapple (17%), apple (4%), papaya, mango, litchi, passion fruit (3% each), guava (2%) and
kiwi (1%). Other fruits have 6% of the total horticulture area under cultivation.
In terms of production, banana has the largest share (34%), followed by pineapple (24%),
citrus (21%), papaya (6%), mango, guava, passion fruit (3% each), litchi (2%), grapes and
apple (1% each).
*Productivity is greater than national average productivity
Source: NHB and State Departments (2010-11)
Table 4: Crop-wise Area, Production and Productivity of Horticultural Crops in NE
Region (2010-11)
Sl.
No.
Crop NE Region India Leading
Area (ha) Production
(MT)
Productivity
(MT/ha)
Productivity
(MT/ha)
State Productivity
(MT/ha)
A Fruits
1 Apple 13,566 28,433 2.10 10.00 JK 13.07
2 Banana 81,454 1,015,075 12.46 35.86 TN 65.83
3 Grapes 1,755 20,500 11.68* 11.08 PUN 28.32
4 Guava 6,952 103,048 14.82* 12.02 MP 28.99
5 Litchi 8,930 58,845 6.59* 6.41 PUN 14.67
6 Mango 11,133 74,611 6.70* 6.61 PUN 15.83
7 Papaya 11,211 176,128 15.71 39.75 TN 164
8 Citrus 115,482 611,521 5.30 8.82 KAR 20.73
9 Kiwi 2,670 4,079 1.53
10 Passion Fruit 9,866 78,491 7.96
11 Pineapple 59,276 706,877 11.93 15.95 KAR 62.0
12 Other Fruits 22,084 72,720 3.29
Total Fruits 344,379 2,950,328 8.57 11.73 TN 30.96
B Vegetables
1 Brinjal 22,567 316,398 14.02 17.49 UP 30.72
2 Cabbage 43,978 812,472 18.47 21.55 TN 56.13
3 Cauliflower 27,272 428,598 15.72 18.29 MEG 35.27
4 Okra 17,574 193,204 10.99 11.61 JK 16.66
5 Onion 8,695 27,398 3.15 14.21 GUJ 24.42
6 Peas 30,329 79,949 2.64 9.51 JK 31.28
7 Potato 121,740 1,067,775 8.77 22.72 WB 32.96
8 Tomato 24,367 483,299 19.83* 19.45 HP 39.06
9 Chilly 16,910 109,511 6.48
10 Other Veg. 131,171 983,487 7.50
Total Veg. 444,603 4,502,091 10.13 17.25 TN 29.86
C Spices
1 Ginger 46,010 299,525 6.51
2 Turmeric 22,848 64,002 2.80
Total Spices 68,858 363,527 5.28 1.82
Grand Total 857,840 7,815,946 9.11 12.73
15Chapter 3 | Horticulture Scenario in North East Region
Among vegetables, potato has the maximum area (27%) under cultivation followed by
cabbage (10%), peas (7%), cauliflower (6%), tomato and brinjal (5%), okra and chilli (4%),
onion (2%) while other vegetables have 30% of the total area under vegetable cultivation.
In terms of production, potato has the highest production and contributes 22% to vegetable
production in NER followed by other vegetables (22%), cabbage (18%), tomato (11%),
cauliflower (9%), brinjal (7%), okra (4%), peas and chilli (2% each) and onion (1%).
The horticulture sector in NE Region offers a variety of products in huge volumes and each
state in the NE Region has speciality in the production of few horticultural crops as per the
local agro-climatic conditions and have significant benefits for producing that particular
horticulture crop. Identification of potential state-specific crops will help in efficient
marketing, better prices, minimisation of losses and devoting resources to promote their
cultivation.
State-wise Profile
Arunachal Pradesh
Agro-climatic Zones  Potential Crops Grown
The state has three distinct agro-climatic zones. The distribution of horticultural crops among
these zones is as table 5:
Figure 7: Fruit-wise Share
in Area (2010-11)
Figure 9: Vegetable-wise Share
in Area (2010-11)
Figure 8: Fruit-wise Share
in Production (2010-11)
Figure 10: Vegetable-wise Share
in Production (2010-11)
Brinjal 7%
Cabbage 18%
Cauliflower 9%
Okra 4%
Onion 1%
Peas 2%
Potato 24%
Tomato 11%
Chilly 2%
Other Veg. 22%
Apple 4%
Banana 24%
Grapes 0%
Guava 2%
Litchi 3%
Mango 3%
Papaya 3%Citrus 34%
Kiwi 1%
Passion Fruit 3%
Pineapple 17%
Other Fruits 6% Apple 1%
Banana 34%
Grapes 1%
Guava 3%
Litchi 2%
Mango 3%Papaya 6%
Citrus 21%
Kiwi 0%
Passion Fruit 3%
Pineapple 24%
Other Fruits 2%
Brinjal 5%
Cabbage 10%
Cauliflower 6%
Okra 4%
Onion 2%
Peas 7%
Potato 27%
Tomato 5%
Chilly 4%
Other Veg. 30%
Source: ISAP analysis, NHB  State Department Data
16 Value Chain Analysis of Select Crops in North Eastern States
Horticulture Scenario
As per the available data (2010-11), horticulture crops in the state occupy nearly 102 thousand ha,
producing around 418 thousand MT. The overall productivity of horticulture crops in the state
worked out to 4.10 MT/ha, which is far behind as compared to national level and NE Region.
Within the horticulture sector in the state, fruit crops recorded maximum area (81.4%) under
cultivation followed by spices (13.3%), Medicinal  Aromatic Plants (MAPs) (5%) and vegetables
(0.3%). In terms of contribution in the horticulture production basket of the state, fruit crops
contributed maximum (71.2%) followed by MAPs (25.9%), vegetables (1.7%) and spices (1.2%).
Figure 11: Share in Area  Production of Horticulture Crops (2010-11)
Area
81.4%
0.3%
5.0%
13.3%
71.2%
1.7%
25.9%
1.2%
Production
Fruits Vegetables MAPs Spices
Table 6: Area, Production and Productivity of Horticultural Crops in Arunachal Pradesh
(2010-11)
Crops Arunachal Pradesh NER India
Area (ha) Production (MT) Productivity
(MT/ha)
Productivity
(MT/ha)
Productivity
(MT/ha)
Fruits 82,960 297,634 3.59 8.57 11.73
Vegetables 300 7087 23.62 10.13 17.25
MAPs 5148 108108 21.00 - -
Spices 13559 5020 0.37 5.28 1.82
Total 101,967 417,849 4.10 9.11 12.73
Source: Directorate of Horticulture, Itanagar, Arunachal Pradesh
Table 5: Agro-Climatic Zones in Arunachal Pradesh
Agro-Climatic Zones Potential Horticultural Crops Grown Districts/Areas
Subtropical Orange, pineapple, black pepper,
stevia
Plains/foothills of Lohit, Changlang, Tirap,
Upper  Lower Dibang Valley, East Siang, West
Siang, Papum Pare, West and East Kameng,
Anjaw, Upper  Lower Subansiri, K/Kumey,
Subtemperate Stone fruits  off season vegetables Areas in between mid-hills and high-hills
Temperate Apple, Kiwi and Saffron High-hills of West Kameng, Tawang, Ziro, Anini,
Anjaw, Upper Subansiri, Upper Siang
Source: “An In-depth Market Study and Impact Assessment Report”
Source: ISAP analysis and Directorate of Horticulture, Itanagar
17Chapter 3 | Horticulture Scenario in North East Region
In terms of fruit-wise area, citrus is cultivated on 46% of land under fruits. Apple has
16% area under cultivation followed by pineapple (14%), other fruits (8%), banana (7%),
walnut (6%) and kiwi (3%).
Table 7: Crop-wise Area, Production  Productivity of Horticultural Crops in Arunachal Pradesh
(2010-11)
Sl. No. Crops Arunachal Pradesh NE India
Area (ha) Production
(MT)
Productivity
(MT/ha)
Productivity
(MT/ha)
Productivity
(MT/ha)
A Fruits
1 Citrus 38,296 164,673 4.30 5.30 8.82
2 Apple 13,506 28,363 2.10 2.10 10.00
3 Pineapple 11,435 65,180 5.70 11.93 15.95
4 Banana 5,685 21,603 3.80 12.46 35.86
5 Walnut 4,780 609 0.13
6 Kiwi 2,620 3,930 1.50
7 Other Fruits 6,638 13,276 2.00
Total Fruits 82,960 297,634 3.59 8.57 11.73
B Total Veg. 300 7,087 23.62 10.13 17.25
C MAPs 5,148 108,108 21
D Spices
1 Large Cardamom 12,770 680 0.05
2 Ginger 789 4,340 5.50
Total Spices 13,559 5,020 0.37 5.28 1.82
Grand Total 101,967 417,849 4.10 9.11 12.73
Source: Directorate of Horticulture, Itanagar, Arunachal Pradesh
The state produces a wide variety of fruits, vegetable, flowers, spices and medicinal plants
suitable for temperate and tropical climate. High valued crops such as apple, citrus, pineapple,
kiwi, walnut, banana, ginger, large cardamom and black pepper have not only attained status
as a popular enterprise among the new generation of growers on commercial lines, but have
also proved to be a boon for the farmers of the state.
Figure 12: Fruit-wise Share
in Area (2010-11)
Figure 13: Fruit-wise Share
in Production (2010-11)
Source: ISAP analysis and Directorate of Horticulture, Itanagar
Citrus 46%
Apple 16%
Pineapple 14%
Banana 7%
Walnut 6%
Kiwi 3%
Other Fruits 8%
Citrus 55%
Apple 10%
Pineapple 22%
Banana 7%
Walnut 0%
Kiwi 1%
Other Fruits 5%
18 Value Chain Analysis of Select Crops in North Eastern States
Citrus is the leading crop in terms of production also and it contributes 55% of total fruit
production. Pineapple is the second largest produced fruit (22%) followed by apple (10%),
banana (7%), other fruits (5%) and kiwi (1%).
Total area under vegetables is only 300 ha with a production of 7,087 MT of vegetables.
The productivity of crops in the state, is observed to be lagging behind as compared to
other states in the country due to old and senile orchards, use of own cultivars, insect/
pest/disease, rain-fed farming, negligible use of inputs by the farmers to increase the
fertility of soil.
The state has unique distinction of having a vertical profile ranging from subtropicalˆˆ
to temperate.
Though inaccessible but able to produce economically important crops such asˆˆ
apple and kiwi along with off season vegetables.
Area of cultivation is too low to be eligible for the economic scale of activity;ˆˆ
Apart from interstate connectivity, intra state connectivity is also a major issue;ˆˆ
Cultivation practices are traditional and subsistence.ˆˆ
If developed commercially, kiwi has the potential to compete with the imported onesˆˆ
being sold in the metros.
The citrus plantations are as old as 50 years.ˆˆ
Supportive infrastructure for any kind of value addition is almost absent.ˆˆ
Poor understanding of state level agencies/institutions involved in upliftingˆˆ
horticulture and horticultural markets.
Salient Features of Horticulture in Arunachal Pradesh
Crops Jan Feb Mar Apr May Jun Jul Aug Sep Oct Nov Dec
Apple                        
Walnut                        
Kiwi                        
Citrus                        
Pineapple                        
Banana                        
L. Cardamom                        
Black Pepper                        
Ginger                        
Potato                        
Tomato                      
Cabbage                        
Beginning Peak Lean
Figure 14: Seasonality of Crops in Arunachal Pradesh
Source: “An In-depth Market Study and Impact Assessment Report”
19Chapter 3 | Horticulture Scenario in North East Region
The diverse agro-climatic conditions make Arunachal Pradesh suitable for cultivation of
varied varieties of fruits, vegetables, spices, medicinal and aromatic crops. Apple, mandarin,
pineapple, ginger, large cardamom, besides off season vegetables have big opportunity in
the domestic markets. Kiwi, though grown in a small area, has good potential to scale it up
to the commercial level.
Productivity of vegetables in the state of Arunachal is found to be higher (23.62 MT/ha) as
compared to national (17.25 MT/ha) and NE Region (10.13 MT/ha) vegetables productivity.
Due to the favourable climatic conditions, vegetables can be grown round the year and can
be supplied to the plains or distant markets in the off season, when there is little production
of vegetables in the plains or less supply of products in the distant market and can fetch
good returns.
ASSAM
Agro-Climatic Zones  Potential Crops Grown
The state has five distinct agro-climatic zones. The distribution of horticultural crops among
these zones is as follows:
Horticulture Scenario
Assam is the largest producer of fruits and vegetables in the northeast region and
contributes 60% to the total horticulture production in the north east region. It is the
gateway for the marketing of horticulture produce from the northeast to the rest of the
country.
Horticultural crops in the state occupy nearly 15% of the gross cultivated area and the state
produces more than 15.0 lakh MT of fruits, 29.0 lakh MT of vegetables and 1.0 lakh MT
of spices besides nut crops, flowers and medicinal  aromatic plants annually. In spite of
having such inherent potential, commercialisation of horticulture sector in Assam has not
yet happened. From the productivity point of view, productivity of fruits in the state is more
(13.50 MT/ha) as compared to national level (11.73 MT/ha) and NE Region (8.57 MT/ha).
Productivity of vegetables in the state is found to be less (11.25 MT/ha) in comparison to
national level (17.25 MT/ha) but more than NE Region (10.13 MT/ha). This situation leads to
the opportunity of productivity enhancement.
Agro-Climatic Zones Potential Horticultural Crops Grown Districts/Areas
North Bank Plain
Zone
Banana, Potato, Vegetables, Lemon, Orange Darrang, Sonitpur, Dhemaji,
Lakhimpur
Upper
Brahamputra
Banana, Potato, Vegetables, Lemon, Orange,
Areca nut, Jackfruit, Pineapple, Guava, Litchi, Mango
Sibsagar, Tinsukia, Dibrugarh,
Jorhat, Golaghat.
Central
Brahamputra
Banana, Potato, Vegetables, Lemon, Orange,
Areca nut, Jackfruit, Pineapple, Guava, Litchi, Mango
Nogaon, Morigaon, Kamrup
Lower
Brahamputra
Banana, Potato, Vegetables, Lemon, Orange,
Areca nut, Jackfruit, Pineapple, Guava, Litchi, Mango
Nalbari, Barpeta, Bongaigaon,
Kokrajhar, Goalpara, Dhubri,
Barak Valley Banana, Potato, Vegetables, Lemon, Orange,
Areca nut, Jackfruit, Pineapple, Guava, Litchi, Mango
Cachar, Karinganj, Hailakandi
Source: “An In-depth Market Study and Impact Assessment Report”
Table 8: Agro-Climatic Zones of Assam
20 Value Chain Analysis of Select Crops in North Eastern States
In the state, vegetable crops recorded maximum area (64.87%) under cultivation followed
by fruits (27.75%) and spices (7.37%). In terms of contribution in the horticulture production
basket of the state, vegetable crops contribute maximum (64.36%), followed by fruits (33.05%)
and spices (2.59%).
Crops Assam NER India
Area (ha) Production (MT) Productivity
(MT/ha)
Productivity
(MT/ha)
Productivity
(MT/ha)
Fruits 111,300 1,502,200 13.50* 8.57 11.73
Vegetables 260,136 2,925,476 11.25 10.13 17.25
Spices 29,573 117,612 3.98 5.28 1.82
Grand Total 401,009 4,545,288 11.33 9.11 12.73
Table 9: Area, Production and Productivity of Horticultural Crops in Assam (2010-11)
* Fruits productivity in Assam is greater than NER and national average productivity
Source: NHB
Figure 15: Share in Area  Production of Horticulture Crops (2010-11)
Area
27.75%
64.87%
7.37%
33.05%
64.36%
2.59%
Production
Fruits Vegetables Spices
Source: ISAP analysis and NHB
Figure 16: Fruit-wise Share
in Area (2010-11)
Figure 17: Fruit-wise Share
in Production (2010-11)
Source: ISAP analysis and NHB
Banana 43%
Guava 4%
Litchi 5%Mango 4%
Papaya 7%
Citrus 25%
Pineapple 12%
Banana 48%
Guava 6%
Litchi 3%
Papaya 9%
Mango 3%
Citrus 16%
Pineapple 15%
21Chapter 3 | Horticulture Scenario in North East Region
Table 10: Crop-wise Area, Production and Productivity of Horticultural Crops in Assam (2010-11)
Sl.
No.
Crops Assam NER India
Area (ha) Production
(MT)
Productivity
(MT/ha)
Productivity
(MT/ha)
Productivity
(MT/ha)
A Fruits
1 Banana 47,600 723,600 15.20 12.46 35.86
2 Guava 4,900 97,300 19.86* 14.82 12.02
3 Litchi 5,200 40,500 7.79* 6.59 6.41
4 Mango 4,800 47,500 9.90* 6.70 6.61
5 Papaya 7,400 134,400 18.16 15.71 39.75
6 Citrus 27,400 238,200 8.69 5.30 8.82
7 Pineapple 14,000 220,700 15.76 11.93 15.95
Total Fruits 111,300 1,502,200 13.50* 8.57 11.73
B Vegetables
1 Brinjal 16,150 244,188 15.12 14.02 17.49
2 Cabbage 30,666 629,732 20.54 18.47 21.55
3 Cauliflower 20,879 328,844 15.75 15.72 18.29
4 Okra 11,068 147,758 13.35* 10.99 11.61
5 Onion 7,960 22,070 2.77 3.15 14.21
6 Peas 22,401 18,077 0.81 2.64 9.51
7 Potato 86,700 737,590 8.51 8.77 22.72
8 Tomato 16,634 387,239 23.28* 19.83 19.45
9 Other Veg. 47,678 409,978 8.60 7.50
Total Veg. 260,136 2,925,476 11.25 10.13 17.25
C Spices
1 Ginger 15,690 107,893 6.88
2 Turmeric 13,883 9,719 0.70
Total Spices 29,573 117,612 3.98 5.28 1.82
Grand Total 401,009 4,545,288 11.33 9.11 12.73
* Productivity is greater than NER and national average productivity
Source: NHB
In terms of area under fruit crops, banana contributes 43% followed by citrus (25%),
pineapple (12%), papaya (7%), litchi (5%), mango and guava (4% each) while production-wise
banana contributes 48% of total fruit production followed by citrus (16%), pineapple (15%),
papaya (9%), guava (6%), litchi and mango (3% each).
In terms of area under vegetables potato has the largest share and has 33% of total area
under vegetable cultivation. Potato is followed by other vegetables (18%), cabbage (12%),
peas (9%), cauliflower (8%), tomato (7%), brinjal (6%) and okra (4%).
In terms of production, potato shares 25% of total vegetable production followed by cabbage
(22%), other vegetables (14%), cauliflower (11%), brinjal (8%) and okra (5%).
Figure 18: Vegetable-wise Share
in Area (2010-11)
Figure 19: Vegetable-wise Share
in Production (2010-11)
Source: ISAP analysis and NHB
Brinjal 6%
Cabbage 12%
Cauliflower 8%
Okra 4%
Onion 3%
Peas 9%
Potato 33%
Other Veg. 18%
Tomato 7%
Cauliflower 11%
Brinjal 8%
Cabbage 22%
Okra 5%
Onion 1%Peas 1%
Tomato 13%
Potato 25%
Other Veg. 14%
22 Value Chain Analysis of Select Crops in North Eastern States
Assam is traditionally rich in horticultural production due to its diverse and varied agro climatic
condition which is conductive for growing a wide range of horticultural crops such as various
fruits, vegetables, flowers, spices, nuts, tuber crops. Citrus is one of the major fruits and the
productivity level of citrus in the state is found to be almost equal (8.69 MT/ha) to the national
level (8.82 MT/ha) productivity but lagging behind Karnataka where the recorded productivity
is 20.73 MT/ha. Major citrus varieties under cultivation in the state are khasi mandarin, Assam
lemon, Eureka, Kachai lemon and lime. Though the state is one of the major producers of
fruits  vegetables in the country, but the quantity is not sufficient to meet the demand of
the growing population of the state and dependence on neighbouring states to meet the
demand is more during summer months (March to June).
It serves as a gateway for the inbound and outbound horticulture produce of Northˆˆ
East to the rest of the country.
Having distinction of being the largest producer as well as consumption and distributionˆˆ
centre in the NE Region.
Assam lemon is a distinctive crop which is being supplied to most of the states in NE.ˆˆ
Although Assam is the largest producer of horticultural produce in NER but the level ofˆˆ
technological interventions from production to post-harvest is very low as compared
to the leading states.
Old and senile citrus orchards leading to low productivity and prevalence of diseases.ˆˆ
Huge gap between demand and supply during the pre monsoon season and generallyˆˆ
demand is met by supply from Meghalaya and prices tend to be on a higher side.
Supportive infrastructure across the value chain either poor or non-existent leadingˆˆ
to substantial wastages.
Main market is being fed by the primary market which is leading to price rise andˆˆ
inefficient supply chain.
During discussions with stakeholders, it emerged that illegal collection of money isˆˆ
practiced at the check posts.
Salient Features of Horticulture in Assam
Crops Jan Feb Mar Apr May Jun Jul Aug Sep Oct Nov Dec
Banana                        
Jackfruit                        
Pineapple                        
Orange                        
Guava                        
Litchi                        
Mango                        
Potato                        
Chilies                        
Ginger                        
K. Vegetables                        
R. Vegetables                        
                  Beginning Peak Lean
Figure 20: Seasonality of Major Crops in Assam
Source: “An In-depth Market Study and Impact Assessment Report”
23Chapter 3 | Horticulture Scenario in North East Region
Manipur
Agro-Climatic Zones  Potential Crops Grown
The state has three distinct agro-climatic zones. The distribution of horticultural crops among
these zones is as follows:
Horticulture Scenario
Diverse agro-climatic conditions and abundant rainfall provide immense opportunity for
horticulture crops in the state of Manipur. As per the available data (2010-11), the state has
78 thousand ha of area under various horticulture crops, producing nearly 671 thousand MT
with overall productivity level of 8.58 (MT/ha) which is lower in comparison to the national
and NER productivity levels.
Horticulture area in the state constitutes of fruits (58.17%), vegetables (25.76%) and
spices (16.07%). From the production point of view, fruits contribute nearly 55.31% to the
production basket of the state followed by vegetables (28.72%) and spices (15.97%). The
major horticultural crops in the state are passion fruit, banana, citrus, pineapple, ginger,
turmeric, tomato, cabbage, pea and potato. It has good potential to export these crops to
Myanmar (Burma). Cabbage, tomato and pea are the major vegetables which can cater to
neighbouring states.
In terms of area under fruits in Manipur, the largest area is under pineapple (26%),
followed by other fruits (23%), passion fruit (18%), banana (13%), orange and lime/
lemon (10%) while in terms of production, pineapple share 30% of total fruits production
followed by banana (21%), passion fruit (19%), other fruits (15%), lime/lemon (8%) and
orange (7%).
Agro-Climatic Zones Potential Horticultural Crops Grown Districts/Areas
Temperate Subalpine Zone Passion Fruit, Plum, Peach, Pear,
Vegetables, Pineapple, Lime, Orange
Senapati, Ukhrul
Mild Tropical Hill Zone Banana, Papaya, Jackfruit, Orange,
Pineapple
Thoubal, Tamenglong, Chandal,
Churchandpur
Mild Tropical Plain Zone Pineapple, Banana, Papaya, Mango,
Guava, Jackfruit, Vegetables, Lemon
Imphal East, Imphal West,
Bishnupur
Source: “An In-depth Market Study and Impact Assessment Report”
Table 11: Agro-Climatic Zones in Manipur
Crops Manipur NER India
Area (ha) Production (MT) Productivity
(MT/ha)
Productivity
(MT/ha)
Productivity
(MT/ha)
Fruits 45,574 371,601 8.15 8.57 11.73
Vegetables 20,185 192,955 9.56 10.13 17.25
Spices 12,590 107,298 8.52 5.28 1.82
Grand Total 78,349 671,854 8.58 9.11 12.73
Source: Directorate of Horticulture and Soil Conservation, Imphal
Table 12: Area, Production and Productivity of Horticultural Crops in Manipur (2010-11)
24 Value Chain Analysis of Select Crops in North Eastern States
Figure 21: Share in Area  Production of Horticulture Crops (2010-11)
Area
58.17%
25.76%
16.07%
55.31%
28.72%
15.97%
Production
Fruits Vegetables Spices
Source: ISAP Analysis  Directorate of Horticulture and Soil Conservation, Imphal
Table 13: Crop-wise Area, Production and Productivity of Horticultural Crops in Manipur
(2010-11)
Sl. No. Crops Manipur NER India
Area
(ha)
Production
(MT)
Productivity
(MT/ha)
Productivity
(MT/ha)
Productivity
(MT/ha)
A Fruits
1 Pineapple 12120 110598 9.13 11.93 15.95
2 Banana 5899 76422 12.96 12.46 35.86
3 Lime/Lemon 4480 29405 6.56 5.30 8.82
4 Orange 4410 25990 5.89 5.30 8.82
5 Passion Fruit 8344 72581 8.7
6 Other Fruits 10321 56605 5.48
Total Fruits 45574 371601 8.15 8.57 11.73
B Vegetables
1 Cauliflower 2340 22935 9.8 15.72 18.29
2 Cabbage 5720 57624 1.07 18.47 21.55
3 Tomato 2210 20156 9.12 19.83 19.45
4 Pea 4688 45502 9.71* 2.64 9.51
5 Other Veg. 5227 46738 8.94
Total Veg. 20185 192955 9.56 10.13 17.25
C Spices
1 Chillies 8210 61661 7.51
2 Ginger 2200 25443 11.57
3 Turmeric 1440 16323 11.34
4 Other Spices 740 3871 5.23
Total Spices 12590 107298 8.52 5.28 1.82
Grand Total 78349 671854 8.58 9.11 12.73
* Pea productivity is greater than NER and national average productivity
Source: Directorate of Horticulture and Soil Conservation, Imphal
25Chapter 3 | Horticulture Scenario in North East Region
Cabbage has largest share of 28% of total area under vegetable cultivation followed by
other vegetables (26%), peas (23%), cauliflower (12%) and tomato (11%). While in terms of
production, cabbage has 30% share, followed by peas and other vegetables (24% each),
cauliflower (12%) and tomato (10%).
Figure 22: Fruit-wise Share in
Area 2010-11
Figure 23: Fruit-wise Share in
Production 2010-11
Source: ISAP Analysis  Directorate of Horticulture and Soil Conservation, Imphal
Pineapple 26%
Banana 13%
Lime/Lemon 10%Orange 10%
Other Fruits 23%
Passion Fruit 18%
Banana 21%
Pineapple 30%
Lime/Lemon 8%
Passion Fruit 19%
Orange 7%
Other Fruits 15%
Figure 24: Vegetable-wise Share
in Area 2010-11
Figure 25: Vegetable-wise Share
in Production (2010-11)
Source: ISAP Analysis  Directorate of Horticulture and Soil Conservation, Imphal
Cauliflower 12%
Cabbage 28%
Tomato 11%Pea 23%
Other Veg. 26%
Cabbage 30%
Cauliflower 12%
Tomato 10%
Pea 24%
Other Veg. 24%
Crops Jan Feb Mar Apr May Jun Jul Aug Sep Oct Nov Dec
Banana
Jackfruit
Pineapple
Orange
Litchi
Mango
Potato
Turmeric
Ginger
K. Vegetables
R. Vegetables
Beginning Peak Lean
Figure 26: Seasonality of Major Crops in Manipur
Source: “An In-depth Market Study and Impact Assessment Report”
26 Value Chain Analysis of Select Crops in North Eastern States
In the state, pineapple is mostly grown on hill slopes as a rain-fed crop. Giant Kew and Queen
are the two leading varieties being grown. Kew is suitable for processing whereas Queen is
grown for table purposes. In citrus, Khasi mandarin and orange are popular, besides Assam,
Eureka and Kachai lemon. Remarkable area of hatkora (citrus) used as a spice is recorded in
the warm and humid areas of Chandel and Jiribam.
Due to favourable climate, Manipur has a good potential for the production of off
season vegetables. Current off season vegetables grown in the state are cabbage,
tomato, peas and beans. However, large scale production and optimum yield are yet to
be achieved.
The state is characterised by three distinct agro climatic zones, but it isˆˆ
net importer of horticulture produce from the other neighbouring states as well
as Burma.
Khasi mandarin is being grown in Tamenglong district but the orchards are old andˆˆ
senile and easily qualify as wild produce.
Fruits occupy more than 50 percent of total horticulture produce but forced to consumeˆˆ
locally due to exceptionally very high logistic cost.
It has emerged during discussions with the stakeholders that there is a goodˆˆ
potential for exporting some horticultural crops like Pineapple, citrus, subject to
the supportive environment in term of logistics, law and order and infrastructural
support.
Salient Features of Horticulture in Manipur
Meghalaya
Agro-Climatic Zones  Potential Crops Grown
The state has two distinct agro-climatic zones. The distribution of horticultural crops among
these zones is as follows:
Horticulture Scenario
As per the available data during the period (2010-11), horticulture crops occupy nearly
73 thousand ha in the state. Among various horticulture crops, vegetable crops occupied
maximum area (57.20%), followed by fruit crops (27.37%) and spices (15.43%).
Agro-Climatic Zones Potential Horticultural Crops Grown Districts/Areas
Mild Tropical Hill zone Pineapple, Pear, Peach, Plum, Potato,
Vegetables, Passion Fruit, Strawberry,
Mandarin, Black Pepper
Ri-Bhoi, East Khasi Hills, West Khasi Hills,
Jaintia Hills, Part of Garo Hills
Mild Tropical Plain Zone Pineapple, Mandarin, Potato, Vegetables,
Cashewnut, Black Pepper
East Garo Hills, West Garo Hills
Source: “An In-depth Market Study and Impact Assessment Report”
Table 14: Agro-climatic zones in Meghalaya
27Chapter 3 | Horticulture Scenario in North East Region
During the period, the state recorded about 552 thousand MT of horticulture production.
As far as production is concerned, vegetable crops contributed about 64.57% to the
horticulture production basket of the state, followed by fruit crop contributing 23.85% and
spices 11.57%.
The overall productivity of horticultural crops in the state was found to be lower (7.56 MT/ha)
in comparison to national and NER productivity levels.
Crops Meghalaya NER India
Area
(ha)
Production
(MT)
Productivity
(MT/ha)
Productivity
(MT/ha)
Productivity
(MT/ha)
Fruits 20,000 131,700 6.59 8.57 11.73
Vegetables 41,800 356,500 8.53 10.13 17.25
Spices 11,276 63,904 5.67 5.28 1.82
Grand Total 73,076 552,104 7.56 9.11 12.73
Source: NHB
Table 15: Area, Production and Productivity of Horticultural Crops in Meghalaya (2010-11)
Table 16: Crop-wise Area, Production and Productivity of Horticultural Crops in
Meghalaya (2010-11)
Sl. No. Crops Meghalaya NER India
Area
(ha)
Production
(MT)
Productivity
(MT/ha)
Productivity
(MT/ha)
Productivity
(MT/ha)
A Fruits
1 Papaya 800 6,800 8.50 15.71 39.75
2 Citrus 9,500 38,900 4.09 5.30 8.82
3 Pineapple 9,700 86,000 8.87 11.93 15.95
Total Fruits 20,000 131,700 6.59 8.57 11.73
B Vegetables
1 Brinjal 858 11,641 13.57 14.02 17.49
2 Cabbage 1,644 36,022 21.91* 18.47 21.55
3 Cauliflower 1,000 35,271 35.27* 15.72 18.29
4 Okra 717 5,868 8.18 10.99 11.61
5 Onion 363 3,078 8.48 3.15 14.21
6 Peas 740 4,780 6.46 2.64 9.51
7 Potato 17,722 162,445 9.17 8.77 22.72
8 Tomato 1,826 27,522 15.07 19.83 19.45
9 Other Veg. 16,930 69,873 4.13 7.50
Total Veg. 41,800 356,500 8.53 10.13 17.25
C Spices
1 Ginger 9,321 54,009 5.79
2 Turmeric 1,955 9,895 5.06
Total Spices 11,276 63,904 5.67 5.28 1.82
Grand Total 73,076 552,104 7.56 9.11 12.73
* Cabbage and cauliflower productivity is greater than NER and national average productivity
Source: NHB
28 Value Chain Analysis of Select Crops in North Eastern States
Figure 27: Fruit-wise Share
in Production 2010-11
Figure 28: Fruit-wise Share
in Production (2010-11)
Source: ISAP Analysis  NHB
Papaya 4%
Citrus 47%Pineapple 49%
Papaya 5%
Citrus 30%Pineapple 65%
Figure 29: Vegetable-wise Share
in Area 2010-11
Figure 30: Vegetable-wise Share
in Production 2010-11
Source: ISAP Analysis  NHB
Brinjal 2%
Cabbage 4%
Cauliflower 2%
Okra 2%
Onion 1%
Peas 2%
Potato 42%
Tomato 4%
Other Veg. 41%
Brinjal 3%
Cabbage 10%
Cauliflower 10%
Okra 2%
Onion 1%
Peas 1%
Potato 45%
Tomato 8%
Other Veg. 20%
Pineapple has largest area under cultivation i.e., 49% followed by citrus (47%) and papaya
(4%) while production-wise also pineapple has largest share of 65% followed by citrus (30%)
and papaya (5%).
In terms of vegetables, potato contributes 42% of area under vegetable cultivation, followed
by other vegetables (41%), cabbage (4%), peas, brinjal, okra and cauliflower (2% each) and
onion (1%). While production-wise also, potato shares 45% in the total vegetable production
followed by other vegetables (20%), cabbage and cauliflower (10% each), tomato (8%), brinjal
(3%), okra (2%) and peas and onion (1% each).
A wide range of tropical, subtropical and temperate fruits such as mandarin, orange,
pineapple, banana, lemon, guava, pear and plum etc. are grown all over the state. A large
variety of vegetables, both indigenous and exotic are grown across a wide range of agro-
climatic zones.
The productivity status of cabbage and cauliflower in the state is significant and found higher
(21.91  35.27 MT/ha) as compared to the national (18.47  15.72 MT/ha) and NER (21.55 
18.29 MT/ha) productivity levels. In case of cauliflower, Meghalaya is the leading state in the
country, in terms of productivity; however, it is lagging behind Tamil Nadu in case of cabbage
productivity (56.13 MT/ha) in the country.
29Chapter 3 | Horticulture Scenario in North East Region
The higher altitudes provide a conducive ecosystem to grow traditional vegetables such as
potato and cole crops during the rainy season. Tuber and root crops such as sweet potato
and tapioca, spices such as turmeric, ginger, chillies, etc. also grow abundantly. Vegetables
such as tomato, cabbage and chayote are the major off season vegetables which are supplied
to other neighbouring states.
Over a period of time, Meghalaya has postioned itself not only as a major supplier of
vegetables to the neighbouring states but also as an off season vegetable producer and
supplier for the distant market.
Two distinct agro climatic zones which make it conducive to produce a wide range ofˆˆ
vegetable crops and these vegetable crops qualify for off season vegetables.
Production belts happen to be close to the consumption market as well as exit points/ˆˆ
distribution transit points.
More than half of the horticulture produce is contributed by vegetable production,ˆˆ
but the productivity of vegetable crops is half of the national average productivity
and even less than the NER vegetable productivity, however, paradoxically cole crops
recorded the highest productivity.
A substantial quantity of vegetable finds its way to Bangladesh through unofficialˆˆ
channels.
Over a period of time, due to the climate and its strategic location, Meghalaya hasˆˆ
emerged as an off season vegetable production hub, not only for NER, but also for
the neighbouring countries of Bangladesh along with the distant Kolkata market.
However, during discussions with stakeholders, it has emerged that climatic changes
have started making a detrimental impact on the seasonality and productivity which
can lead to its losing the competitive advantage of off season vegetables.
Lack of post-harvest infrastructure, specifically modern vegetable packing housesˆˆ
is a major impediment in maintaining the comparative advantage in the changing
market scenario.
Salient Features of Horticulture in Meghalaya
Figure 31: Seasonality of Major Crops in Meghalaya (2010-11)
Crops Jan Feb Mar Apr May Jun Jul Aug Sep Oct Nov Dec
Banana
Jackfruit
Pineapple
Mandarin
Chillies
Black Pepper
Mango
Potato
Turmeric
Ginger
K. Vegetables
R. Vegetables
Beginning Peak Lean
Source: “An In-depth Market Study and Impact Assessment Report”
30 Value Chain Analysis of Select Crops in North Eastern States
Mizoram
Agro-Climatic Zones  Potential Crops Grown
The state has three distinct agro-climatic zones. The distribution of horticultural crops among
these zones is as follows:
Horticulture Scenario
As per the available statistics (2010-11), horticulture area in the state accounted for more than
69 thousand ha with production of 490 thousand MT of various crops. The overall productivity
of horticulture crops in the state is around 7.03 (MT/ha) which is lower as compared to the
national (9.11 MT/ha) and NER (12.73 MT/ha) productivity levels.
Horticulture area in the state consists of fruits (41.01%), vegetables (30.26%) and spices
(28.73%) area. In terms of share in the production basket of the state, fruits contribute nearly
44.44%, vegetables 34.41% and spices 21.16%.
Agro-Climatic Zones Potential Horticultural Crops Grown Districts/Areas
Temperate Zone Passion Fruit, Plum, Peach, Pear,
Vegetables, Pineapple, Lime, Orange
Eastern and South Mizoram, Major portion
of Champhai, Saitual of Aizawl District. S.
Vanlaiphai areas of Lunglei District and Saiha
Tuipang areas of Chhimtuipui District
Subtropical Zone Mango, Guava, litchi, Jackfruit, Orange,
Pineapple, Vegetables
Central Aizawl, Ngopa areas of Champhai 
Lunglei sub-division of Southern Mizoram
Tropical Zone Pineapple, Citrus, Banana, Papaya,
Mango, Sapota, Vegetables
Kolasib area of North Mizoram, Mamit areas
of Western part of Mizoram bordering Tripura,
Demagiri (Lunglei sub-div) and Chawngte sub-
division of Southern Mizoram
Source: “An In-depth Market Study and Impact Assessment Report”
Table 17: Agro-Climatic Zones in Mizoram
Table 18: Area, Production and Productivity of Horticultural Crops in Mizoram (2010-11)
Crops Mizoram NER India
Area
(ha)
Production
(MT)
Productivity
(MT/ha)
Productivity
(MT/ha)
Productivity
(MT/ha)
Fruits 28,618 218,169 7.62 8.57 11.73
Vegetables 21,120 168,909 8.00 10.13 17.25
Spices 20,048 103,858 5.18 5.28 1.82
Grand Total 69,786 490,936 7.03 9.11 12.73
Source: Directorate of Horticulture, Aizawl
Figure 32: Share in Area and Production of Horticulture Crops (2010-11)
Area
41.01%
30.26%
28.73%
44.44%
34.41%
21.16%
Production
Fruits Vegetables Spices
Source: ISAP Analysis  Directorate of Horticulture Aizawl
31Chapter 3 | Horticulture Scenario in North East Region
Table 19: Crop-wise Area, Production and Productivity of Horticultural Crops in Mizoram
(2010-11)
Sl. No. Crops Mizoram NER India
Area
(ha)
Production
(MT)
Productivity
(MT/ha)
Productivity
(MT/ha)
Productivity
(MT/ha)
A Fruits
1 Mandarin 6515 19700 3.02 5.30 8.82
2 Banana 10040 118600 11.81 12.46 35.86
3 Lime/Lemon 4823 24150 5.00 5.30 8.82
4 Pineapple 1532 13590 8.87 11.93 15.95
5 Grape 1575 20400 12.95* 11.68 11.08
6 Passion Fruit 1522 5910 3.88
7 Papaya 800 6750 8.43 15.71 39.75
8 Mango 645 2850 4.42 6.70 6.61
9 Other Fruits 1166 6219 5.33
Total Fruits 28618 218169 7.62 8.57 11.73
B Vegetables
1 Brinjal 2010 12,108 6.02 14.02 17.49
2 Bitter Gourd 3715 16,889 4.55
3 Cabbage 2600 33,569 12.91 18.47 21.55
4 Chayote 3500 56,849 16.24
5 Bean 2290 4,956 2.16
6 Okra 2800 18,710 6.68 10.99 11.61
7 Cucumber 775 3,651 4.71
8 Tomato 675 6,180 9.16 19.83 19.45
9 Peas 450 1,933 4.30 2.64 9.51
10 Other Veg. 2305 14,064 6.10
Total Veg. 21120 68,909 8.00 10.13 17.25
C Spices
1 Black Pepper 68 88 1.29
2 Ginger 6500 31,950 4.92
3 Turmeric 4780 23,970 5.01
4 Bird’s Eye Chilli 8700 47,850 5.50
Total Spices 20048 103858 5.18 5.28 1.82
Grand Total 69786 90,936 7.03 9.11 12.73
* Grape productivity is greater than NER and national average productivity
Source: Directorate of Horticulture, Aizawl
Figure 33: Fruit-wise Share
in Area (2010-11)
Figure 34: Fruit-wise Share
in Production (2010-11)
Source: ISAP Analysis  Directorate of Horticulture, Aizawl
Other Fruits 4%Mango 2%
Papaya 3%
Passion Fruit 5%
Mandarin 23%
Banana 35%
Grape 6%
Pineapple 5%
Lime/Lemon 17%
Mandarin 9%
Banana 55%
Grape 9%
Pineapple 6%
Lime/Lemon 11%
Other Fruits 3%Mango 1%
Papaya 3%
Passion Fruit 3%
32 Value Chain Analysis of Select Crops in North Eastern States
In terms of area under fruits, banana makes up for 35% of the total area under fruits, followed by mandarin
(23%), lime/lemon (17%), grape (6%), pineapple and passion fruit (5% each), other fruits (4%), papaya (3%)
and mango (2%).
Banana shares 55% in fruit production followed by lime/lemon (11%), grape and mandarin (9%) each,
pineapple (6%), papaya, passion fruit and other fruits (3% each).
Figure 35: Vegetable-wise Share in Area Figure 36: Vegetable-wise Share in Production
Source: ISAP Analysis  Directorate of Horticulture, Aizawl
Bitter Gourd 18%
Other Veg. 11%
Peas 2%
Tomato 3%
Brinjal 9%
Cabbage 12%
Chayote 17%
Okra 13%
Cucumber 4%
Bean 11%
Bitter Gourd 10%
Cabbage 20%
Cucumber 2%
Okra 11%
Bean 3%
Chayote 34%
Brinjal 7%
Other Veg. 8%
Peas 1%
Tomato 4%
In terms of area under vegetables, bitter gourd has 18% of total area under vegetables followed by chayote
(17%), okra (13%) cabbage (12%), bean and other vegetables (11%), brinjal (9%), cucumber (4%) and
tomato (3%).
In terms of production, chayote shares 34% in total vegetable production followed by cabbage (20%), okra
(11%), bitter gourd (10%), other vegetables (8%), brinjal (7%) and tomato (4%).
Figure 37: Seasonality of Major Crops in Mizoram
Crops Jan Feb Mar Apr May Jun Jul Aug Sep Oct Nov Dec
Banana                        
Mandarin                        
Passion Fruit                        
Ginger                        
Turmeric                        
Cabbage                        
Mango                        
                    Beginning Peak Lean
Source: “An In-depth Market Study and Impact Assessment Report”
Use of fertilisers and pesticides in agriculture and horticulture fields in Mizoram is almost non-existing.
As such, all agri horticulture output of Mizoram are organic products of very high-value in national and
international market. Out of the cultivable area, potential area for horticultural activities is found to
be 6.31 lakh hectares, which consist of gentle to moderate slope. Out of this potential area, the area
under horticulture crops during 2010-11 as recorded is more than 69,000 hectares which is only 11.05%
of potential area for horticulture. Therefore, the scope and potential for expanding the activities under
horticulture is enormous.
33Chapter 3 | Horticulture Scenario in North East Region
Mizoram state produces grapes mainly in the off season and productivity of grapes in the state is found
higher (12.95 MT/ha) as compared to national (11.08 MT/ha) and NER (11.68 MT/ha) productivity level.
Productivity of grapes in Maharashtra which is the main production cluster of grapes in the country
is also found lower (9 MT/ha) as compared to Mizoram. Besides grapes, crops like mandarin orange,
passion fruit, pineapple, papaya, tomato, brinjal, bird’s eye chillies, ginger, turmeric are also grown
and have tremendous potential for marketing outside the State. Most of the vegetables produced in
the state are off season vegetables and hence will fetch a higher price if dispatched to the main land
markets.
Mizoram is characterised by mountainous and hilly track, divided into three agro-climaticˆˆ
zones and has the potential to become next major hub for off season vegetables.
Major fruit crops are Khasi mandarin, grapes, passion fruit and lime lemon.ˆˆ
Major consolidation point for Mizo products are Silchar and Karimganj.ˆˆ
Unique system of direct marketing is practiced in Mizoram that farmers sell theirˆˆ
produce directly to the consumers in the weekly market, having dual benefit –
remunerative price to the farmers and low cost of produce to the consumer.
Good quantity of turmeric is produced in the region which is being procured by the stateˆˆ
government as seed for the distribution in the whole state through the government
channel.
Marketing infrastructure is poor and underutilised.ˆˆ
Existing fruits and vegetable processing units are running far below their capacity, noˆˆ
strong tie-ups to market the product even in NER resulting in heavy loss.
Huge opportunity of trade with Bangladesh and Myanmar is still untapped due to lawˆˆ
and order situation.
Salient Features of Horticulture in Mizoram
Nagaland
Agro-Climatic Zones  Potential Crops Grown
The state has two distinct agro-climatic zones. The distribution of horticultural crops among
these zones is as follows:
Agro-Climatic Zones Potential Horticultural Crops Grown Districts/Areas
Subtropical Hill Zone Orange, Pineapple, Passion Fruit,
Vegetables, Potato, Chow Chow
Dimapur, Kohima, Mokok Chong, Mon,
Tuenchang, Phek
Mild Tropical Hill
Zone
Pineapple, Citrus, Banana, Papaya,
Pear, Peach Vegetables (Ginger)
Kohima, Zunheboto
Source: “An In-depth Market Study and Impact Assessment Report”
Table 20: Agro-Climatic Zones in Nagaland
34 Value Chain Analysis of Select Crops in North Eastern States
Horticulture Scenario
The total area covered by horticulture crops has been estimated at 27,473 ha (2010-11) which
represents about 8% of the gross cropped area, with nearly 2.51 lakh MT of horticulture
produce. The state produces 1.41 lakh MT of fruits, 0.79 lakh MT of vegetables and 0.30 lakh
MT of spices. Productivity of fruits in the state is found to be higher as compared to NER (8.57
MT/ha) but it lags behind the national productivity level (11.73 MT/ha). Overall productivity of
horticultural crops is lower in comparison to national and NER productivity levels.
Horticulture area in the state represents fruits (49.70%), vegetables (38.95%) and spices
(11.36%). In terms of horticulture production, fruits contribute 56.24%, vegetables 31.62% and
spices 12.14%. Important among the vegetable crops grown are potato, cassava, colocasia,
cabbage, cauliflower, peas and cucumber while ginger, chillies, cardamom, garlic, black pepper
make up the major spice crops. Amongst the plantation crops, areca, coconut, tea and rubber
offer the best potential for cultivation on a commercial scale. Among the fruit crops, pineapple,
mandarin orange and passion fruit are already being produced on a commercial scale.
Table 21: Area, Production and Productivity of Horticultural Crops in Nagaland (2010-11)
Crops Nagaland NER India
Area
(ha)
Production
(MT)
Productivity
(MT/ha)
Productivity
(MT/ha)
Productivity
(MT/ha)
Fruits 13,653 141,250 10.35 8.57 11.73
Vegetables 10,700 79,400 7.42 10.13 17.25
Spices 3,120 30,495 9.77 5.28 1.82
Grand Total 27,473 251,145 9.14 9.11 12.73
Source: NHB
Figure 38: Share in Area  Production of Horticulture Crops (2010-11)
Area
49.70%
38.95%
11.36%
56.24%
31.62%
12.14%
Production
Fruits Vegetables Spices
Source: ISAP Analysis  NHB
Figure 39: Fruit-wise Share
in Area (2010-11)
Figure 40: Fruit-wise Share
in Production (2010-11)
Source: ISAP Analysis  NHB
Banana 20%
Other Fruits 7%
Papaya 5%
Citrus 41%
Pineapple 27%
Banana 42%
Citrus 12% Papaya 4%
Pineapple 41%
Other Fruits 1%
35Chapter 3 | Horticulture Scenario in North East Region
Table 22: Crop-wise Area, Production and Productivity of Horticultural Crops in Nagaland
(2010-11)
Sl.
No.
Crops Nagaland NER India
Area (ha) Production (MT) Productivity
(MT/ha)
Productivity
(MT/ha)
Productivity
(MT/ha)
A Fruits
1 Banana 2,700 59,000 21.85 12.46 35.86
2 Papaya 670 5,600 8.36 15.71 39.75
3 Citrus 5,650 17,030 3.01 5.30 8.82
4 Pineapple 3,700 57,500 15.54 11.93 15.95
5 Other Fruits 9,33 2,120 2.27
Total Fruits 13,653 141,250 10.35 8.57 11.73
B Vegetables
1 Brinjal 100 2,200 22.00* 14.02 17.49
2 Cabbage 300 3,000 10.00 18.47 21.55
3 Okra 300 1,200 4.00 10.99 11.61
4 Peas 100 1,000 10.00* 2.64 9.51
5 Potato 1,500 10,000 6.67 8.77 22.72
6 Tomato 700 4,000 5.71 19.83 19.45
7 Other Veg. 7,700 58,000 7.53 7.50
Total Veg. 10,700 79,400 7.42 10.13 17.25
C Spices
1 Ginger 3,000 30,000 10.00
2 Turmeric 120 495 4.13
Total Spices 3,120 30,495 9.77 5.28 1.82
Grand Total 27,473 251,145 9.14 9.11 12.73
* Productivity is greater than NER and national average productivity
Source: NHB
In Nagaland, citrus is grown on 41% of total area under fruits followed by pineapple (27%),
banana (20%), other fruits (7%) and papaya (5%) while in terms of production banana is the
largest crop and shares 42% in total fruit production followed by pineapple (41%), citrus
(12%), papaya (4%) and other fruits (1%).
Figure 41: Vegetable-wise Share
in Area (2010-11)
Figure 42: Vegetable-wise Share
in Production (2010-11)
Source: ISAP Analysis  NHB
Peas 1%
Brinjal 1% Cabbage 3%
Okra 3%
Potato 14%
Tomato 6%
Other Veg. 72%
Okra 1%
Peas 1%
Tomato 5%
Potato 13%
Other Veg. 73%
Cabbage 4%Brinjal 3%
In terms of area under vegetables, other vegetables share 72% of total area followed by
potato (14%), tomato (6%), okra and cabbage (3% each), peas and brinjal (1% each). While in
terms of production, other vegetables contribute 73% followed by potato (13%), tomato (5%),
cabbage (4%), brinjal (3%), peas and okra (1% each).
36 Value Chain Analysis of Select Crops in North Eastern States
The state is divided into two agro-climatic zones – subtropical hilly and mild tropical hilly.ˆˆ
Fruit production contributes more than 50 percent of total horticulture production,ˆˆ
major fruits being pineapple and banana.
Initiative taken by NHB and local institute Central Institute of Horticulture (CIH) toˆˆ
market the Nagaland pineapple to distant markets of Delhi and Bangalore has opened
new vistas of organised distant markets.
The ginger produced in Nagaland is one of the best quality, the productivity is relativelyˆˆ
higher; five-fingered with low fibre content which makes it suitable for processing.
General apprehension of law and order to outside traders who are interested inˆˆ
purchasing products like pineapple, ginger etc.
Naga chilli is an ethnic product of Nagaland which sells at a premium, although theˆˆ
volumes are low.
Charges levied by various insurgent groups on transportation and trade are not onlyˆˆ
restricting the trade but also adding to the cost.
Salient Features of Horticulture in Nagaland
Figure 43: Seasonality of Major Crops in Nagaland
Crops Jan Feb Mar Apr May Jun Jul Aug Sep Oct Nov Dec
Banana                        
Jackfruit                        
Pineapple                        
Mandarin                        
Chillies                        
Litchi                        
Mango                        
Potato                        
Turmeric                        
Ginger                        
K. Vegetables                        
R. Vegetables                        
                    Beginning Peak Lean
Source: “An In-depth Market Study and Impact Assessment Report”
Based on the elevation, both subtropical fruits such as pineapple, banana, citrus, guava,
etc. and temperate fruits such as plum, peach, pear, passion fruit and various nuts have
potential for exploitation. In case of pineapple, productivity status of state (15.54 MT/ha) is
almost equivalent to national level (15.956 MT/ha) and more as compared to NER (11.93 MT/ha).
Productivity of banana in the state is also more than NER.
In case of vegetables, the productivity of brinjal and peas in the state is higher (22  10 MT/ha)
as compared to national (17.49  9.51 MT/ha) and NER (14.02  2.64 MT/ha) productivity
levels. However, the requirement of crops such as potato, leafy vegetables, peas, brinjal,
okra, apple, papaya and several other fruits and vegetables for domestic consumption,
exceeds the existing production and to meet the consumption demand leads to increased
dependence on other states.
37Chapter 3 | Horticulture Scenario in North East Region
Sikkim
Agro-Climatic Zones  Potential Crops Grown
The distribution of horticultural crops among zones based on rainfall is as follows:
Horticulture Scenario
The state is endowed with varied agro-climatic conditions suitable for the cultivation of
large number of subtropical and temperate horticultural crops but mainly due economic
viability, mandarin and passion fruit are being commercially cultivated. In the state, the
vegetables are grown mainly in three seasons viz. kharif, rabi and off season. Ginger,
large cardamom, turmeric, off season vegetables, floriculture etc. can be commercially
cultivated to enhance income per unit area. The small size holdings of the farmers could be
utilised efficiently with family labour thereby generating both employment and additional
income.
Rainfall Potential Horticulture Crops Air temperature Altitude
 300 cm
Very heavy
rainfall zone
Ginger, Vegetables, Potatoes,
Large Cardamom
12-16°C in the southern parts of North
District and 15-18°C whole of East
District from north-western parts to
south-eastern parts
1000-2000
300 to  200 cm
Heavy rainfall
zone
Ginger, Vegetables, Potatoes,
Large Cardamom, Oranges,
Citrus, Banana, Papaya
13-17°C in the northern parts of South
and West Districts; 16-19°C in the central
parts of South  West Districts and over
the valleys between East and South
Districts and South and West Districts;
and 20°C in the southern most parts
of East, South and West Districts and
over the valleys between East and South
Districts and South and West Districts.
Less than 1000 m
to 2000 m
200 to 100 cm
Moderate
rainfall zone
Seed-Potato, Cabbage,
Peas, Radish, Other winter
vegetables, Off season cabbage
7-9°C 2000-3000 m
 100 cm
Low rainfall
zone
Cultivable land is not available
above 4000 m. Vegetation
is mainly herbs or medicinal
herbs.
6.5°C Above 3000 m
Source: “An In-depth Market Study and Impact Assessment Report”
Table 23: Agro-Climatic Regions in Sikkim
Crops Sikkim NER India
Area (ha) Production (MT) Productivity
(MT/ha)
Productivity
(MT/ha)
Productivity
(MT/ha)
Fruits 11,340 17,900 1.58 8.57 11.73
Vegetables 23,855 120,900 5.07 10.13 17.25
Spices 9,180 49,490 5.39 5.28 1.82
Grand Total 44,375 188,290 4.24 9.11 12.73
Source: NHB
Table 24: Area, Production and Productivity of Horticultural Crops in Sikkim (2010-11)
38 Value Chain Analysis of Select Crops in North Eastern States
During the year 2010-11, the state recorded 44,375 (ha) land under horticultural crops
cultivation accounting for 188000 MT in production. The overall productivity level of
horticultural crops in the state is observed to be low, to the tune of 4.24 MT/ha which is far
below national and NER productivity levels.
Commodity-wise area under vegetable cultivation found maximum (53.76%) followed
by fruits (25.55%) and spices (20.69%). Though area under fruit cultivation is significant,
but production is observed very low (9.51%), on the contrary contribution of vegetables
(64.21%) and spices (26.28%) to the production basket of the state is observed to be
significant.
Citrus shares 74% in total area under cultivation, followed by banana (15%) and other fruits
(11%) while in production, citrus are 80% of total fruits produced followed by banana (19%).
and other fruits (1%).
Potato shares 39% area under vegetable cultivation followed by other vegetables (34%), peas
(8%), cabbage and okra (5% each), tomato (4%) and cauliflower (3%). Production-wise potato
shares 38% of the total vegetable production, followed by other vegetables (31%), tomato
and peas (7% each), okra and cabbage (6% each) and cauliflower (3%).
Figure 44: Share in Area  Production of Horticulture Crops (2010-11)
Area
25.55%
53.76%
20.69%
9.51%
64.21%
26.28%
Production
Fruits Vegetables Spices
Source: ISAP Analysis  NHB
Figure 45: Fruit-wise Share
in Area (2010-11)
Figure 46: Fruit-wise Share
in Production (2010-11)
Source: ISAP Analysis  NHB
Banana 15%Fruits 11%
Citrus 74%
Banana 19%
Citrus 80%
Other Fruits 1%
39Chapter 3 | Horticulture Scenario in North East Region
Table 25: Crop-wise Area, Production and Productivity of Horticultural Crops in Sikkim
(2010-11)
Sl.
No.
Crop Sikkim NER India
Area
(ha)
Production
(MT)
Productivity
(MT/ha)
Productivity
(MT/ha)
Productivity
(MT/ha)
A Fruits
1 Banana 1,730 3,350 1.94 12.46 35.86
2 Citrus 8,330 14,420 1.73 5.30 8.82
3 Other Fruits 1,280 130 0.10
Total Fruits 11,340 17,900 1.58 8.57 11.73
B Vegetables
1 Brinjal 250 1,590 6.36 14.02 17.49
2 Cabbage 1,180 6,900 5.85 18.47 21.55
3 Cauliflower 740 3,900 5.27 15.72 18.29
4 Okra 1,100 7,170 6.52 10.99 11.61
5 Onion 300 1,600 5.33 3.15 14.21
6 Peas 1,950 8,550 4.38 2.64 9.51
7 Potato 9,400 45,700 4.86 8.77 22.72
8 Tomato 940 8,050 8.56 19.83 19.45
9 Other Veg. 7,995 37,440 4.68 7.50
Total Vegetables 23,855 120,900 5.07 10.13 17.25
C Spices
1 Ginger 8,510 45,890 5.39
2 Turmeric 670 3,600 5.37
Total Spices 9,180 49,490 5.39 5.28 1.82
Grand Total 44,375 188,290 4.24 9.11 12.73
Source: NHB
Figure 47: Vegetable-wise Share
in Area (2010-11)
Figure 48: Vegetable-wise Share
in Production (2010-11)
Source: ISAP Analysis  NHB
Cabbage 5%
Cauliflower 3%
Okra 5%
Onion 1%
Peas 8%
Potato 39%
Tomato 4%
Other Veg. 34%
Brinjal 1%
Cabbage 6%
Cauliflower 3%
Okra 6%
Onion 1%
Peas 7%
Potato 38%
Tomato 7%
Other Veg. 31%
Brinjal 1%
40 Value Chain Analysis of Select Crops in North Eastern States
Sikkim has four agro-climatic zones based on the altitude and rainfall.ˆˆ
Horticultural scenario is characterised by very low productivity. Two-third of horticultureˆˆ
production comprises of vegetables, while fruits contribute less than 10 percent to the
total horticultural production.
Seasonality of mandarin is same as the Bhutan mandarin but it is unable to competeˆˆ
with the Bhutanese mandarin at the market because of high per unit logistic cost,
thus slowly Sikkim mandarin is being replaced by Bhutan mandarin for export to
Bangladesh.
Sikkim ginger is one of the major crops and contributes one-fourth to the totalˆˆ
horticultural production. During season, there is a situation of glut in the market.
Government agencies such as SIMFED  NERAMAC are procuring ginger and
transporting it to Gangtok and Siliguri market. However, these two agencies are profit
making bodies and do not support farmers in case of glut.
Sikkim produces more than 90 percent of the total large cardamom produced in India,ˆˆ
various market-led interventions such as auctioning system have led to high price
realisation by the farmers.
Salient Features of Horticulture in Sikkim
Crops Jan Feb Mar Apr May Jun Jul Aug Sep Oct Nov Dec
Banana                        
Passion Fruit                  
Mandarin                        
Cabbage            
Cauliflower                    
Peas                        
Potato                        
L. Cardamom                        
Ginger                        
Off Season Vegetables                        
                    Beginning Peak Lean
Figure 49: Seasonality of Major Crops in Sikkim
Source: “An In-depth Market Study and Impact Assessment Report”
The horticultural crops of Sikkim such as mandarin and passion fruit are commercially
cultivated and can be processed and marketed to distant markets, profitably. The state
has made considerable improvement in vegetable production, but certain vegetables of
subtropical and tropical region are being imported from other states. However, the off
season vegetables grown in the high altitude areas are being exported to other states. In
case of spices, the state is the largest producer of large cardamom. Also, floriculture has
immense potential due to favourable climate and altitude.
41Chapter 3 | Horticulture Scenario in North East Region
Tripura
Agro-Climatic Zones  Potential Crops Grown
The ICAR has categorised Tripura under agro-climatic zones of Humid Eastern Himalayan
Region. The distribution of horticultural crops among districts is depicted below:
Horticulture Scenario
The state occupies about 66 thousand ha area under horticultural crops cultivation and
produces 802 thousand MT of varied horticulture produce. The overall productivity of
horticulture crops in the state analysed to be 11.98 (MT/ha) which is higher compared to NER
productivity levels (9.11 MT/ha) but lower than national levels (12.73 MT/ha). The productivity
of both fruits and vegetables in the state is found to be more than NER productivity levels.
Sl.
No.
Potential Horticultural
Crops Grown
Districts/Areas
1 Pineapple All Districts of State but mainly North ( Nalkata, Kanchanchera, Nepaltila,
Darchar, Betchera) and West (Kamramgatali, Sheelghati, Mohan Bhog,
Jumerdhepa, Baidagi Bazar) districts
2 Jackfruit  Litchi All Districts of State (South, West, Dhalai and North)
3 Orange North and Dhalai District
4 Banana West and South Districts
5 Potato South and West Districts
6 Tomato West District
7 Cauliflower and Cabbage West, South and North District
8 Ginger South and North District
9 Turmeric South District
Source: “An In-depth Market Study and Impact Assessment Report”
Table 26: Agro-Climatic Zones in Tripura
Table 27: Area, Production and Productivity of Horticultural Crops in Tripura (2010-11)
Crops Tripura NER India
Area
(ha)
Production
(MT)
Productivity
(MT/ha)
Productivity
(MT/ha)
Productivity
(MT/ha)
Fruits 31,934 269,894 8.72 8.57 11.73
Vegetables 36,019 532,337 14.78 10.13 17.25
Grand Total 66,953 802,211 11.98 9.11 12.73
Source: NHB
Amongst horticulture crops grown in the state, fruits occupy nearly 46.20% of the area
and vegetables 53.80%. From the production point of view, fruits add about 33.64% and
vegetables 66.36% to the production basket of the state. Most of the cultivators follow
traditional methods of producing crops. The state government of Tripura has taken special
steps to improve the agricultural growth of the region.
42 Value Chain Analysis of Select Crops in North Eastern States
Figure 50: Share in Area  Production of Horticulture Crops (2010-11)
Area
46.20%
53.80%
33.64%
66.36%
Production
Fruits Vegetables
Source: ISAP Analysis  NHB
Table 28: Crop-wise Area, Production and Productivity of Horticultural Crops in Tripura
(2010-11)
Sl.
No.
Crop Tripura NER India
Area (ha) Production
(MT)
Productivity
(MT/ha)
Productivity
(MT/ha)
Productivity
(MT/ha)
A Fruits
1 Banana 7,800 12,500 1.60 12.46 35.86
2 Litchi 2,934 16,565 5.65 6.59 6.41
3 Mango 5,408 23,861 4.41 6.70 6.61
4 Papaya 1,541 22,578 14.65 15.71 39.75
5 Citrus 6,078 39,053 6.43 5.30 8.82
6 Pineapple 6,789 153,309 22.58* 11.93 15.95
7 Other Fruits 384 2,008 5.23
Total Fruits 31,934 269,894 8.72 8.57 11.73
B Vegetables
1 Brinjal 3,199 43,876 13.72 14.02 17.49
2 Cabbage 1,868 45,625 24.42 18.47 21.55
3 Cauliflower 1,843 33,752 18.31* 15.72 18.29
4 Okra 1,589 12,498 7.87 10.99 11.61
5 Potato 6,238 109,790 17.60 8.77 22.72
6 Tomato 1,382 30,152 21.82* 19.83 19.45
7 Other Veg. 19,900 256,644 12.90 7.50
Total Vegetables 36,019 532,337 14.78 10.13 17.25
Grand Total 66,953 802,211 11.98 9.11 12.73
* Productivity is higher than NER and national average productivity
Source: NHB
Figure 51: Fruit-wise Share
in Area (2010-11)
Figure 52: Fruit-wise Share
in Production (2010-11)
Source: ISAP Analysis  NHB
Banana 25%
Litchi 10%
Mango 17%
Citrus 20%
Papaya 5%
Pineapple 22%
Other Fruits 1% Banana 5%
Litchi 6%
Mango 9%
Papaya 8%
Citrus 14%
Pineapple 57%
Other Fruits 1%
43Chapter 3 | Horticulture Scenario in North East Region
In terms of fruit area, banana has 25% area under cultivation followed by pineapple (22%)
citrus (20%), mango (17%), litchi (10%) and papaya (5%) while in terms of production pineapple
shares 57% followed by citrus (14%), mango (9%), papaya (8%), litchi (6%) and banana (5%).
Figure 53: Vegetable-wise Share
in Area 2010-11
Figure 54: Vegetable-wise Share
in Production (2010-11)
Source: ISAP Analysis  NHB
Brinjal 9%
Potato 17%
Okra 5%
Cabbage 5%
Cauliflower 5%
Tomato 4%
Other Veg. 55%
Brinjal 8%
Cabbage 9%
Cauliflower 6%
Okra 2%
Potato 21%
Tomato 6%
Other Veg. 48%
In terms of area under vegetables, other vegetables have 55% area under cultivation, followed
by potato (17%), brinjal (9%), cabbage, cauliflower and okra (5% each) and tomato (4%) while
in terms of production, other vegetable have 48% share, followed by potato (21%), cabbage
(9%), brinjal (8%), tomato and cauliflower (6% each) and okra (2%).
Contribution of other vegetables in the state accounted for 32%. Over the years, the
production of vegetables has also gained momentum in the state. Previously, vegetables
from outside the state used to come to Tripura, whereas some vegetables such as ‘kakrol’,
‘chara kachu’ (mukhi), patol, radish, sweet gourd etc. are also reaching the markets of other
states. The cultivation of vegetables, which was mainly confined to traditional areas, has now
spread over to non-traditional areas. Also, introduction of hybrid vegetables has started a
new era in vegetable cultivation in the state.
Crops Jan Feb Mar Apr May Jun Jul Aug Sep Oct Nov Dec
Banana                        
Pineapple                        
Orange                        
Mango                        
Potato                        
Lemon                        
                    Beginning Peak Lean
Figure 55: Seasonality of Major Crops in Tripura
Source: “An In-depth Market Study and Impact Assessment Report”
44 Value Chain Analysis of Select Crops in North Eastern States
Tripura has favourable climatic conditions which offer immense scope for cultivation of various
kinds of horticultural crops including fruits, vegetables, spices, nuts and flowers. Agriculture
is the backbone of the economy of Tripura. Most of the indigenous local inhabitants of the
state are engaged in the traditional occupation of cultivating fruits and vegetables. Some of
the important agricultural products of the state of Tripura are jackfruit, orange, pineapple,
banana, mango, litchi, lemon, kharif vegetables, potato, rabi vegetables, cashewnut, coconut,
areca nut, turmeric, ginger and chilly. The farmers of the state practice organic cultivation of
fruits, vegetables and spices.
Tripura has a distinctive advantage and potential in some of the horticulture commodities
such as pineapple (22.58 MT/ha), cabbage (24.42 MT/ha), cauliflower (18.31 MT/ha) and
tomato (21.82 MT/ha). The productivity levels of these crops in the state are found to be
higher, compared to national and NER productivity levels.
Based on the above discussion, it has emerged that there is a wide variety of horticulture
produce/crops available in all the states of NER. However, all these crops do not qualify
to meet the parameter of commercial threshold level to be projected as a potential crop;
therefore an exercise is being carried out to select the potential crops for undertaking
detailed value chain study.
Vegetable produced constitute 2-3rd of the total horticulture crops, although fruitsˆˆ
are only 1/3rd of the total crops. Pineapple is produced in large area, but there is a
problem of abundance.
Productivity of horticulture crops is better than or at par with entire NE Region.ˆˆ
Major chunk of pineapple, jackfruit and vegetables are sent to Bangladesh throughˆˆ
unofficial channels.
Tripura has been notified as an AEZ for pineapple.ˆˆ
The only conduit for pineapple is biweekly markets which present daily harvesting ofˆˆ
produce hence quality degradation of the fields.
Government initiatives have made farmers adopt staggering plants to extend theˆˆ
availability of the produce.
Salient Features of Horticulture in Tripura
C hap t e r
Identification of Focus Crop Groups
4
With a view to identify the commercially potential crops, various crops have been rated on the
basis of certain parameters, which have been devised keeping various production and market-
related factors in mind. These parameters have helped in selecting the crops in a particular
state as well as crop production clusters within a state, so that the crops for detailed value chain
analysis may be decided.
The key parameters adopted for the selection of focus crop groups and their production clusters
are detailed below:
Contribution of crops in the NER:™™ To assess the importance of each crop in the total
crop basket of horticultural crops, percentage contribution has been calculated on
the basis of volume and value, as these crops, due to high value or volume have
the potential to achieve economy of scale and can make space in distant markets.
Crops contributing significantly to this basket have been selected for the detailed
value chain study.
Economically important crops:™™ There are few high value crops in the region which can
absorb the cost of logistics to compete in the distant markets with products arriving
from various other production belts either domestically or internationally.
Exclusive window of production:™™ Certain horticulture crops are produced only in
some states of NER during times when there is no production in other parts of the
country; such crops are transported to the other states during the times when there
is no production and qualify for off season crops.
Demand in distant market:™™ Certain crops which are produced in abundant quantity
or such products which are ethnic in nature in NER and have a good demand in the
distant markets have also been included in the list of Focussed Crop Groups for the
purpose of study.
Inherited advantage:™™ The agro-climatic conditions prevalent in a particular region are
suitable for the production of certain crops. Such regions/states possess inherited
advantage in the production of these crops.
Contiguity of potential area:™™ The production clusters of a crop in a state are either
contiguous or non-contiguous which determines the feasibility of consolidation of
produce and its further movement to the markets. On the basis of the contiguity of
production areas and taking into account the potential production areas, crops have
been selected.
Integration of activities for commercial uptake:™™ The availability of post-harvest,
marketing and logistics infrastructure, processing and value addition facilities have
been taken into account to arrive at the commercial viability of different crops.
46 Value Chain Analysis of Select Crops in North Eastern States
Product-wiseContributionofStatesinNERProductionBasket(2010-11)
Sl.
No.
State/CropArunachal
Pradesh
AssamManipurMeghalayaMizoramNagalandSikkimTripuraTotalNER
Production
(MT)
%Sharein
TotalNER
Production%ShareinTotalNERProduction(Volume)
1Apple99.75%0.00%0.00%0.00%0.00%0.18%0.07%0.00%28,4330.96%
2Banana2.13%71.29%7.53%0.00%11.68%5.81%0.33%1.23%1,015,07534.41%
3Grapes0.00%0.00%0.00%0.00%99.51%0.49%0.00%0.00%20,5000.69%
4Guava0.00%94.42%0.00%0.00%2.18%1.36%0.09%1.95%103,0483.49%
5Litchi0.00%68.82%0.00%0.00%2.70%0.29%0.03%28.15%58,8451.99%
6Mango0.00%63.66%0.00%0.00%3.82%0.54%0.00%31.98%74,6112.53%
7Papaya0.00%76.31%0.00%3.86%3.83%3.18%0.00%12.82%176,1285.97%
8Citrus26.93%38.95%9.06%6.36%7.17%2.78%2.36%6.39%611,52120.73%
9Kiwi96.35%0.00%0.00%0.00%3.65%0.00%0.00%0.00%4,0790.14%
10PassionFruit0.00%0.00%92.47%0.00%7.53%0.00%0.00%0.00%78,4912.66%
11Pineapple9.22%31.22%15.65%12.17%1.92%8.13%0.00%21.69%706,87723.96%
12OtherFruits19.09%0.00%77.84%0.00%3.07%0.00%0.00%0.00%72,7202.46%
FruitProduction(MT)297,6341,502,200371,601131,700218,169141,25017,900269,8742,950,328100.00%
13Ginger1.45%36.02%8.49%18.03%10.67%10.02%15.32%0.00%299,52512.42%
14Turmeric0.00%15.19%25.50%15.46%37.45%0.77%5.62%0.00%64,00210.77%
15Brinjal0.00%77.18%0.00%3.68%4.08%0.70%0.50%13.87%316,3984.67%
16Cabbage0.00%77.51%7.09%4.43%4.13%0.37%0.85%5.62%812,47212.91%
17Cauliflower0.00%76.73%5.35%8.23%0.86%0.05%0.91%7.87%428,5986.81%
18Okra0.00%76.48%0.00%3.04%9.68%0.62%3.71%6.47%193,2043.99%
19Onion0.00%80.55%0.00%11.23%2.37%0.00%5.84%0.00%27,3980.58%
20Peas0.00%22.61%56.91%5.98%2.55%1.25%10.69%0.00%79,9492.02%
21Potato0.00%69.08%0.00%15.21%0.21%0.94%4.28%10.28%1,067,77510.42%
22Tomato0.00%80.12%4.17%5.69%1.28%0.83%1.67%6.24%483,29910.71%
23Chilly0.00%0.00%56.31%0.00%43.69%0.00%0.00%0.00%109,51110.53%
24OtherVegetables0.79%41.69%5.15%7.10%9.49%5.88%3.81%26.10%983,48714.18%
Veg.Production(MT)12,1073,043,088300,253420,404277,144109,895170,390532,3374,865,618100.00%
Source:ISAPanalysis,NHBandSateHorticultureDepartments
Table29:Product-wiseContributionofStatesinNERProductionBasket(2010-11)
47Chapter 4 | Identification of Focus Crop Groups
Product-wiseContributionofStatesinNERProductionValue(2010-11)
Sl.
No.
State/CropArunachal
Pradesh
AssamManipurMeghalayaMizoramNagalandSikkimTripuraTotalNER
Production
(Valuein
Cr)
%Sharein
TotalNER
Production
(Value)
%ShareinTotalNERProduction(Value)
1Apple28.69%0.00%0.00%0.00%0.00%0.12%0.37%0.00%271.453.10%
2Banana7.93%55.06%26.22%0.00%51.80%53.18%22.65%5.92%3,516.9440.15%
3Grapes0.00%0.00%0.00%0.00%21.15%0.21%0.00%0.00%168.611.92%
4Guava0.00%2.14%0.00%0.00%0.28%0.36%0.18%0.27%103.051.18%
5Litchi0.00%5.58%0.00%0.00%1.26%0.28%0.24%14.21%369.404.22%
6Mango0.00%4.93%0.00%0.00%1.70%0.49%0.00%15.41%352.754.03%
7Papaya0.00%8.64%0.00%6.80%2.49%4.26%0.00%9.03%515.585.89%
8Citrus47.48%14.24%14.93%36.17%15.04%12.06%76.56%14.52%1,663.9018.99%
9Kiwi2.50%0.00%0.00%0.00%0.11%0.00%0.00%0.00%24.470.28%
10PassionFruit0.00%0.00%17.97%0.00%1.86%0.00%0.00%0.00%196.232.24%
11Pineapple13.40%9.40%21.25%57.02%3.32%29.02%0.00%40.64%1,371.4615.66%
12Fruit(value)5.15%0.00%19.62%0.00%0.98%0.00%0.00%0.00%254.522.91%
TotalFruits943.734,552.931,009.65292.60793.32384.3751.25731.928,759.77100.00%
13Ginger61.64%8.84%7.91%25.69%10.44%50.16%44.61%0.00%1,292.1912.42%
14Turmeric0.00%3.23%20.59%19.09%31.76%3.36%14.20%0.00%1,120.0410.77%
15Brinjal0.00%7.12%0.00%1.97%1.50%1.31%0.55%8.51%485.614.67%
16Cabbage0.00%19.77%6.87%6.56%4.20%1.92%2.57%9.53%1,342.9112.91%
17Cauliflower0.00%10.32%2.73%6.43%0.46%0.13%1.45%7.05%708.426.81%
18Okra0.00%6.04%0.00%1.39%3.05%1.00%3.48%3.40%415.623.99%
19Onion0.00%0.92%0.00%0.75%0.11%0.00%0.79%0.00%60.220.58%
20Peas0.00%0.90%8.62%1.38%0.41%1.02%5.06%0.00%210.082.02%
21Potato0.00%14.22%0.00%18.18%0.17%3.93%10.46%14.09%1,084.1410.42%
22Tomato0.00%16.95%3.35%6.99%1.08%3.57%4.18%8.78%1,113.9310.71%
23Chilly0.00%0.00%44.45%0.00%36.23%0.00%0.00%0.00%1,095.1110.53%
24OtherVeg.38.36%11.68%5.47%11.56%10.60%33.60%12.65%48.65%1,475.2314.18%
Veg.(value)30.375,264.981,387.12907.001,320.84258.03443.79791.3610,403.49100.00%
Source:ISAPanalysis,NHBandSateHorticultureDepartments
Table30:Product-wiseContributionofStatesinNERProductionValue(2010-11)
48 Value Chain Analysis of Select Crops in North Eastern States
1. Pineapple
Sl.No.
Criteria
Ar.Pradesh
Assam
Meghalaya
Manipur
Mizoram
Nagaland
Sikkim
Tripura
Total
1 Contribution of crops in NER 1 2.9 1.5 1.2 0.1 0.8 0 2.5 10
2 Economically important crop/s 0 2 2 1.5 0 1.5 0 3 10
3 Exclusive window of production 1 1 1 1 1 2 0 3 10
4 Accessability 0.5 2.5 1.5 1.25 1.25 1.5 0 1.5 10
5 Contiguity of potential area 0.5 1 2 0.5 3 3 10
6 Integration of activities for
commercial uptake
0.5 1.5 1.5 0.5 2 0 4 10
Total 3.5 10.9 9.5 5.95 2.35 10.8 0 17
2. Citrus
Sl.No.
Criteria
Ar.Pradesh
Assam
Meghalaya
Manipur
Mizoram
Nagaland
Sikkim
Tripura
Total
1 Contribution of crops in NER 2.7 3.9 1 0.6 0.7 0.2 0.2 0.7 10
2 Economically important crop/s Same for all states
3 Exclusive window of production Same for all states
4 Accessability 0.5 2 1.5 1 1 1 2 1 10
5 Contiguity of potential area 1.5 2 2 0.5 0.5 0.5 2 1 10
6 Integration of activities for
commercial uptake
0.5 2 1 3 1 1.5 1 10
Total 5.2 9.9 5.5 5.1 3.2 1.7 5.7 3.7
3. Ginger
Sl.No.
Criteria
Ar.Pradesh
Assam
Meghalaya
Manipur
Mizoram
Nagaland
Sikkim
Tripura
Total1 Contribution of crops in NER 0.1 3.6 0.9 1.8 1 1 1.5 0.1 10
2 Inherited Advantage 1 1.5 1 1 1.5 2 1 1 10
3 Exclusive window of production Same for all states
4 Accessability 0.5 1.75 1.75 1 1 1.5 1.5 1 10
5 Contiguity of potential area 0.7 2 1.8 1.75 0.75 1.25 1.25 0.5 10
6 Integration of activities for
commercial uptake
0 2.5 2 1 0.5 1 3 0 10
Total 2.3 11.35 6.95 6.55 4.75 6.75 8.25 2.6
49Chapter 4 | Identification of Focus Crop Groups
4. Turmeric
Sl.No.
Criteria
Ar.Pradesh
Assam
Meghalaya
Manipur
Mizoram
Nagaland
Sikkim
Tripura
Total
1 Contribution of crops in NER 0 1.5 2.5 1.5 3.7 0.1 0.6 0.1 10
2 Inherited Advantage Same for all states
3 Exclusive window of production Same for all states
4 Accessability 0.5 1.75 1.75 1 1 1.5 1.5 1 10
5 Contiguity of potential area 0.5 2.5 1 1.5 2 1 1 0.5 10
6 Integration of activities for
commercial uptake
0.5 2.5 1 2 2 1 0.5 0.5 10
Total 1.5 8.25 6.25 6 8.7 3.6 3.6 2.1
Source: ISAP Analysis
Identified Focus Crop Groups Based on the Parameters
Identified for Selection Criteria
Focus
Crop
Group
Arunachal
Pradesh
Assam Manipur Meghalaya Mizoram Nagaland Sikkim Tripura
Pineapple   √   √   √   √
Citrus   √ √  √     √  
Ginger   √   √     √  
Turmeric   √  √ √      
Passion
Fruit
          √    
Kiwi Fruit √              
Naga Chilli           √    
Large
Cardamom
            √  
Vegetables   √   √        
Source: ISAP Analysis
Table 31: Identified Focus Crop Groups
50 Value Chain Analysis of Select Crops in North Eastern States
Identified Production Clusters of FCGs*
Crops Arunachal
Pradesh
Assam Manipur Meghalaya Mizoram Nagaland Sikkim Tripura
Citrus Kamrup
(R),
Kamrup
(M),
Tinsukia,
Karbi
Anglong,
N.C. Hills
Tamenglong,
Ukhrul,
C.Cpur
East Khasi
Hills, West
Khasi Hills,
Jaintia Hills
East,
South,
West
Kiwi Tawang,
West
Kameng,
Lower
Subansiri
Pineapple Cachar,
Kamrup,
Karbi
Anglong,
N.C. Hills
Ri Bhoi,
East Garo
Hills, West
Garo Hills
Kohima,
Wokha,
Mokokchung,
Dimapur,
Peren
South,
West,
Dhalai,
North
Passion
Fruit
Kohima,
Wokha,
Mokokchung
Ginger N C Hills,
Karbi
Anglong,
Golaghat,
Sonitpur
Ri Bhoi,
East Garo
Hills, West
Garo Hills
East,
South,
West
Turmeric Kamrup,
Barpeta,
Sonitpur,
Nagaon,
Baksa,
Golaghat,
Lakhimpur,
Karbi
Anglong
Jaintia Hills,
West Garo
Hills
Saiha,
Champhai,
Mamit,
Kolasib,
Serchhip
Naga Chilli Kohima,
Dimapur,
Peren
Large
Cardamom
North,
East
Vegetables Darrang,
Kamrup,
Barpeta,
Marigaon
East Khasi
Hills, Jaintia
Hills, East
Garo Hills,
West Garo
Hills
* Detailed criteria of clusters selection in identified states are given in annexure
Source: ISAP Analysis
Table 32: Identified Production Clusters of FCGs
51Chapter 4 | Identification of Focus Crop Groups
A complex matrix of criteria described above was prepared for all the eight states of NER
based on field experience and inputs from experts, which has led to shortlisting the focus
crop groups which will be studied for a specific state. Weighted average method was adopted
to select the state and for identification of cluster for study, major production cluster was
taken into account. The score cards for each crop have been depicted below. As these score
cards have been based on field observation and perception of experts, there are chances
that opinion of people may differ from each other; however, an exercise has been done to
compile these tables as practically as possible.
Seasonality of Selected Fcgs
In case of perishable produce, it is important to know the availability of the produce for
marketing and getting better prices. In NE Region, vegetables  banana are available
throughout the year. Ginger is available mainly in the months of February and May. Pineapple
is harvested twice in a year i.e. May to August and December to January. Mandarin is available
from November to January. Turmeric is harvested from December to January. Passion fruit is
harvested in the months between September and December. Cardamom is harvested twice
in a year i.e. July–August and November–January. Therefore, it is important to understand
that one or the other horticultural crops are available throughout the year from NER and
due to varying altitude, the availability of each crop is possible for extended duration from
different production clusters.
On the basis of parameters followed for the selection of Focus Crop Groups, the major crops,
seasonality and their production clusters have been mapped. A detailed product rank matrix
has been developed to filter out the crops, which have potential and have been selected for
detailed value chain mapping.
Crops Jan Feb Mar Apr May Jun Jul Aug Sep Oct Nov Dec
Kiwi                        
Pineapple                        
Mandarin                        
Large Cardamom                        
Turmeric                        
Passion Fruit                        
Ginger                        
Vegetables                        
Naga Chilli                        
Beginning Lean Peak
Figure 56: Availability of Horticultural Produce in NE Region
Source: “An In-depth Market Study and Impact Assessment Report”
C hap t e r
Value Chain Analysis
5
An extensive study of the production region of the crops was undertaken during the field
visits to map the detailed value chain from production to post-harvest management and
marketing. The stages covered during value chain study are production, pre-harvest, post-
harvest and marketing. During the survey and analysis, various aspects of production such
as sources of input material supply, production practices, level of input application, crop
varieties, labour requirement, technology adoption, intercultural operations, harvesting time
and methods, seasonality, logistics and marketing were covered. Detailed value chains of the
following crops have been mapped:
Pineapple – Assam, Meghalaya, Tripura, Nagaland™™
Citrus – Assam, Manipur, Meghalaya, Sikkim™™
Ginger – Assam, Meghalaya, Sikkim™™
Turmeric – Assam, Meghalaya, Mizoram™™
Kiwi – Arunachal Pradesh™™
Passion Fruit – Nagaland™™
Vegetables – Assam, Meghalaya™™
Naga Chilli – Nagaland™™
Large Cardamom – Sikkim™™
Pineapple
All the eight North Eastern states produce pineapple. The advantageous position of NER in
terms of fertile and organically rich soils, abundant rainfall, water resources and great agro-
climatic diversity supports the cultivation of best quality pineapple in the region. The region
produces more than 40 percent of pineapple produced in the country and almost 90-95 percent
of the produce is organic. Pineapple produced in the region is qualitatively different and is
said to be among the best in the world as they are sweet (high TSS) with less fibre.
Pineapple is a perennial crop with an economic life of 5-7 years, however, in the North
Eastern region; the farmers cultivate it beyond 12-15 years through crop manipulation and
traditional agronomic practices. In many parts of North Tripura and in the Barak valley of
Assam, even 20-25 year old plantations can be seen.
Assam, Tripura, Meghalaya and Nagaland are major pineapple producing states.
There are two popular varieties of pineapple cultivated in North East:
Kew (also known as Smooth Cayenne) – Suitable for canning with an average fruit1.	
weight of 2-3 kg.
Queen – Table fruit variety with an average fruit weight of 1-2 kg.2.
54 Value Chain Analysis of Select Crops in North Eastern States
Assam
In Assam, pineapple is cultivated in all districts, while the identified clusters for pineapple
cultivation are Cachar, Kamrup, Sonitpur, Karbi Anglong and North Cachar Hills. Kew, Giant
Kew and Queen are the major varieties grown in the state.
Production Practices™™
Planting is done from April to October. About 30,000 to 40,000 plants are accommodated in
one ha area. Propagation of pineapple is done through suckers which costs ` 3 per sucker.
Flowering starts next year in March-April and June-July while fruiting starts five months after
flowering.
Pineapple is a perennial crop; hence cultivation lasts for four to seven years. The crop cycle
of pineapple for optimum production is four years but farmers in Assam take the crop till
the seventh year from planting. Productivity starts decreasing 4th year onwards. As per the
FGDs held with the farmers, the cost of production of pineapple for the first five years is as
follows:
In the first year, the plantingv material cost is the major cost which accounts for about
70 percent of the total production cost. The other costs involved are the costs for irrigation,
manures and fertilisers, insecticides and pesticides which remain almost constant during
the first four years. The labour cost during first year is nearly 25 percent of the total cost
which gradually increases to 40 percent in second year and 74 percent in the subsequent
years. Labour in the first year is employed for farm operations such as land preparation and
sowing while from the second year onwards it is employed for intercultural operations and
harvesting. Around 200-250 mandays are required in the first year, while in the second year
50 mandays are employed and from the third year onwards 200-250 mandays are required
for various farm operations such as application of manures, fertilisers, pesticides, weeding
and harvesting.
Year 1 Year 2 Year 3 Year 4 Year 5
Labour cost (Manday) 37500 7500 30000 30000 30000
Irrigation 1500 1500 1500 1500 1000
Insecticide/Pesticide 1000 1000 1000 1000 500
FERTILIZER 4000 4000 4000 4000 5000
FYM/VERMICOMPOST 4000 4000 4000 4000 4000
Planting Material Cost 105000 0 0 0 0
Total Cost 153000 18000 40500 40500 40500
0
20000
40000
60000
80000
100000
120000
140000
160000
180000
CostinINR
Figure 57: Cost of Pineapple Production in Assam
Source: ISAP Analysis from farmers’ interaction
55Chapter 5 | Value Chain Analysis
The above cost analysis has been carried out taking into account the cost of production
for the first five years during which the fruit yield is optimum and cost of planting material
dominating in the first year and labour being another predominant part of the value chain.
Post-harvest Practices:™™
Harvestingƒƒ : The fruiting starts from the second year onwards, the fruit bearing is
good till the fourth year of planting and reduces afterwards. However, the farmers
take the crop till the seventh or eighth year. The fruits are harvested in May-August
and November-December. Average weight of each pineapple is 1-1.5 kg and yield of
Kew variety is 30-35 MT/ha.
Average cost of production is approximately ` 3 per piece. The farm gate price per piece
varies from ` 4 to ` 12 depending upon the production and market demand. During the
lean season, the farmer gets ` 8-12 per piece while during the peak season, when there is
abundant supply in the market, the farmer is able to sell it at ` 4-6 per piece.
Value Addition at Farm Level:ƒƒ Before taking to the market, the farmers grade the
produce as per size. Generally fruits of 1 to 1.5 kg weight are more acceptable.
Marketing and Logistics:ƒƒ Marketing channels followed by the farmer are as depicted
in the figure below:
Farmers
` 0.5 per fruit
` 0.6 per fruit
Local Market
Aggregators Markets in Guwahati
Markets in
Guwahati/Kolkata
At farm
gate
At farm gate
Contractors
Manuring Fertilisers
Insecticides
 Pesticides
Irrigation Labour Cost
Planting
Material
Yr 1–70%
Yr 2–0
Yr 3–0
Yr 4–0
Yr 5–0
Yr 1–2.6%
Yr 2–22%
Yr 3–10%
Yr 4–10%
Yr 5–10%
Yr 1–3%
Yr 2–22%
Yr 3–9.88%
Yr 4–9.88%
Yr 5–9.88%
Yr 1–1.0%
Yr 2–5.0%
Yr 3–3.0%
Yr 4–3.0%
Yr 5–2.0%
Yr 1–1.0%
Yr 2–8.0%
Yr 3–4.0%
Yr 4–4.0%
Yr 5–4.0%
Yr 1–25.0%
Yr 2–42.0%
Yr 3–74.0%
Yr 4–74.0%
Yr 5–74.0%
Figure 58: Cost Analysis of Pineapple Value Chain in Assam
Source: ISAP Analysis
Figure 59: Marketing Channel of Pineapple in Assam
56 Value Chain Analysis of Select Crops in North Eastern States
Case Study - Bongaon
From villages in Bongaon and Boko, pineapple is transported to the nearest market in gunny
bags/plastic bags in small quantity by farmers while when taking to distant markets such as
Guwahati, the produce is carried in Tata ACE/mini trucks in loose form. As most of the farmers
do not have large quantity of produce and therefore are not able to afford to transport to the
Guwahati market, they sell their product at the farm gate only. Markets at sub-division/block
level act as consolidation point and from there the produce moves to Guwahati.
TataAceof2000-2500fruitscapacityischargedaroundaround`1200to1500dependingupon
the distance. During transportation, wastages range from 4-5 percent. At the wholesalers and
retailers level, due to handling and post-harvest losses, the wastages are nearly 2 percent.
In Assam, there is issue of post-harvest losses in the field when it is glut in the market and
farmers leave the produce in the field itself without harvesting. Most of the produce is
consumed fresh and the opportunity of processing is also not being tapped.
Tripura
Production Practices™™
Pineapple is cultivated in the entire state;
however, few clusters such as Kumbharghat
and Nalkota are major production areas.
North, South, West and Dhalai districts are
major pineapple producing districts in the
state.
Both the varieties of pineapple - Queen and
Kew are grown in Tripura during mid-May
to mid-September. The variety used for
processing i.e. Kew covers the maximum
area. Nearly 25,000-30,000 plants are being
plantedinonehectareofland.Theeconomic
life of the crop is 5-7 years, although farmers
in the region cultivate it up to 12-15 years
through traditional agronomic practices. The plants do not require much care, the farmers
generally clean the cultivation patches after harvesting and can get a healthy fruit crop the
next year.
Pineapple field in Tripura
Price Build-up Amount (in `) Price Markup (` Per Piece) % contribution
Farm gate price 8.00 8.00 34%
Aggregator Margin @30% 2.40 10.40 10%
Transportation 0.60 11.00 3%
wastage@ 5% 0.55 11.55 2%
Wholesaler (@30%) 3.47 15.02 15%
wastage@ 2% 0.30 15.32 1%
Retailer (50%) 7.66 22.97 33%
wastage@ 2% 0.46 23.43 2%
Source: ISAP analysis from various stakeholders’ interaction
Table 33: Price Build-up-of Pineapple from Farm Gate in Bongaon to Guwahati (per piece)
57Chapter 5 | Value Chain Analysis
Case Study - Bishramganj
In the district of Sipahijila (Bishramganj), the average land holding of farmers under pineapple
cultivation is 0.5 to 1 hectare (3-6 kenis – local unit).
Since 80 percent of the crop becomes ready for harvest within a short period of 2-3 months
(May-June-July), there is a situation of glut in the market which forces the farmers to sell the
produce at low prices. In order to overcome this problem, ICAR Research Centre at Agartala,
Tripura has come up with the following solutions to produce the fruit for more than five
months in a year:
Use of different planting material1.	
Staggered planting  chemical induction of flowering2.	
Genotypic diversification3.	
Various farmers have adopted these techniques due to which they are able to get regular
yield of pineapple for more than five months in a year.
Post-harvest Practices™™
Harvesting:ƒƒ The peak season for pineapple harvesting in the region is May to July. The
yield is around 20,000 to 25,000 fruits per ha per season. Fruit size varies from 0.5 to
2 kg (average 1 kg/piece). Thus, the production is 20 to 25 MT per ha per season.
Individual farmers are able to harvest around 300-500 fruits on a daily basis to be taken to
the market, however, due to non-availability of regular markets, around 20 percent of the
fruits are wasted at the field level itself.
Value Addition at Farm Level:ƒƒ Farmers, generally do not carry out any kind of grading
at the field level and all sizes of fruits are sold as one lot. However, some progressive
farmers have started grading as per size.
Marketing  Logisticsƒƒ : The fruits are carried from the field (from Batsuli
village) to the nearby market (Bishramganj market) in a jeep or auto. At
Bishramganj, the trade of pineapple takes place during two days of the week only
(Sunday  Thursday). Transportation cost is approximately ` 30 per 100 fruits,
which comes to approximately ` 0.30 per kg/per piece. There is no wastage during
the transit.
In the Bishramganj market, the fruit is generally procured by traders from Sonamara who
then export it to Bangladesh through unofficial trade channels. Some produce is procured
by traders from Agartala also. During early season, the wholesale price of the fruit remains
at ` 10 per piece, however, during peak season, the rates drop to as low as ` 2 per piece.
At times, when there is no market demand, the prices drop even further. The rate mainly
depends upon the size of the fruit; large and same size fruits get better price in the
market.
The traders from Agartala transport the produce to Agartala market in vehicles such as
Bolero, Commander etc. The transportation distance is around 60 km and the cost varies
from ` 0.40-0.50 per piece. The price in Agartala market varies from ` 20-40 per fruit-based
on the demand and supply.
58 Value Chain Analysis of Select Crops in North Eastern States
Issues:
At production level, although the farmers have started adopting practice of staggering,™™
However, general production practices are still not very advanced. Regular weeding
or intercultural operations are not followed by the farmers and there is no use of
scientific irrigation for pineapple crop. Yield of pinapple can be improved significantly
if farmers are motivated to adopt the scientific package of practices for pineapple
production in the state.
The marketing of pineapple has been the biggest challenge for the farmers, as™™
during the peak season, the price goes very low and sometimes there are no buyers.
Earlier, companies such as Dabur and NERAMAC (North Eastern Regional Agricultural
Marketing Corporation Limited) used to buy pineapple for processing purpose, but
now the NERAMAC plant has been closed down and Dabur does not buy due to high
logistics cost.
Market is organised twice in a week at Bishramganj (for this particular cluster) and™™
farmers do not have any other choice to bring the produce in the market, other than
these two days. This leads to high level of product wastage at field level due to over-
maturing.
Farmers
` 0.30
per fruit
` 0.40-0.50
per fruit
Trader
(Bishramganj
Market)
Agartala Market
Importer from
Bangladesh
Figure 60: Marketing Channel of Pineapple in Tripura
Price Build-up Amount (in `) Price Markup (` Per Piece) % Contribution
Farm gate price 7.00 7.00 34.04%
Loading/unloading 0.20 7.20 0.97%
Aggregator Margin @20% 1.40 8.60 6.81%
Transportation to local
market
0.30 8.90 1.46%
wastage@ 0% 0.00 8.90 0.00%
Transportation to main
market
0.50 9.40 2.43%
Wholesaler (@40%) 3.76 13.16 18.29%
wastage@ 2% 0.28 13.44 1.36%
Retailer (50%) 6.72 20.16 32.68%
wastage@ 2% 0.40 20.56 1.96%
Source: ISAP analysis from various stakeholders’ interaction
Table 34: Price Build-up of Pineapple from Farm Gate in Bishramganj to Agartala Market
(per piece)
59Chapter 5 | Value Chain Analysis
Meghalaya
In Meghalaya, the pineapple cultivation is carried out on the slopes. Ri Bhoi, East Garo Hills
and West Garo Hills are the main production clusters identified after the study. Both the
varieties – Queen and Kew are cultivated in the state.
Production Practices™™
The plantations are congested as the plant to plant spacing is very less. There are about
37,500-50,000 plants per ha. For new plantations, the farmers get the planting material
i.e. either sucker or crown for ` 2-3 per piece. Sowing is carried out in the month of
May-June.
The farmers generally do not use FYM/Vermicompost, chemical fertilisers, insecticides/
pesticides or weedicides. No irrigation is applied and the crop is dependent on the monsoon
for its water requirement. Weeding is mainly done manually by the farmers and his family
members. The labour is employed for harvesting and other intercultural operations. Total
mandays of 400-500 are required for carrying out farm operations but generally the hired
labour is available for only 100-150 mandays.
The pre-harvest fruit loss due to fruit drop, insect pest attack and diseases generally ranges
from 3-5 percent at the field level.
Post-harvest Practices:™™
Harvesting:ƒƒ The peak season for pineapple harvesting in Meghalaya is from May to
July. The average yield in the region is nearly 12-15 MT per acre (25-30 MT/ha).
Value Addition at Farm Level:ƒƒ At the field level, the farmers do manual grading of
fruits based on sizes (small: upto 1 kg, medium: 1.5-2.5 kg, large: 3-4 kg). The uniform
and bigger sized fruits get a better price in the market.
Marketing  Logistics:ƒƒ The fruits are packed in bamboo baskets which
accommodate 40-50 big fruits or 60-70 small fruits. The cost of the bamboo
basket is ` 60 per basket and the life is one year. The produce is sold on the basis
of kuri (1 kuri = 20 pineapple pieces) or big bhar (1 big bhar =64 pieces) in the
local market. Thus, one bamboo baskets accommodates 2 kuri (40 pineapple
pieces).
The farmers usually carry the produce as head loads to the nearest transport point and
from there it is transported by jeep/maxi to the local market. The transportation cost for
carrying the produce to local market is ` 20-25 per bamboo basket which translates into
` 0.50-0.60 per fruit. The transportation loss while taking the produce from field to local
market is approximately 0.25 percent.
The produce moves through the following marketing channels:
In the local market, the farmer sells the produce to the middlemen/aggregator, who then
transports to the main market in the same packaging by means of mini trucks or buses.
The transportation cost by mini truck is ` 40-50 per bamboo basket (` 1-1.20 per fruit) and
` 30-35 per bamboo basket (` 0.75-0.875 per fruit). The transportation cost varies with the
distance also. During the transportation from the local market to main market such as Bara
Bazaar and Maowing market in Shillong, the loss is about 3 percent, while at the wholesaler’s
and retailers’ level the post-harvest and handling losses are 2 percent each.
60 Value Chain Analysis of Select Crops in North Eastern States
Nagaland
In Nagaland, major production clusters are Dimapur, Peren, Kohima, Mokokchung and
Wokha. Molvom (Jharnapani) is the pioneer village in pineapple cultivation in the state, where
every farmer family in the village is growing pineapple. Almost 90 percent of the fields in the
villages are covered with pineapple. In the entire state, pineapple variety Giant Kew is the
most popular variety cultivated. It is larger than the normal variety and average weight of a
single fruit is 1.5-2 kg.
Production Practices™™
The planting of pineapple is carried out in the months of March-April. Earlier the farmers
were carrying out single row planting due to which the fruits used to be oversized, which are
less acceptable in the market and used to fetch lower price. However, now the Government is
providing training and encouraging the farmers to plant in double rows. Double row planting
leads to a smaller fruit size of 1 to 1.15 kg.
Farmers
` 0.50-0.60
per fruit
` 1.50-1.80 per fruit
` 1-1.20 per fruit
Local Market
Main Market-
Shillong
Markets in
Guwahati/Kolhata/Silchar
Main Market-
Shillong
Markets in
Guwahati/Kolhata/Silchar
Contractors
Figure 61: Marketing Channel of Pineapple in Meghalaya
Particular Amount
(in `)
Price Markup
(` Per Piece)
% contribution
Average Selling of Farmers 15 15 41.73%
Loading/Unloading 0.2 15.2 0.56%
Transportation to Local Market 0.5 15.7 1.39%
Cost of wastage (@ 0.25% till local market) 0.04 15.74 0.11%
Aggregator charges (20%) 3.14 18.88 8.76%
Transport to Main Market 1 19.88 2.78%
Cost of wastage (@ 3% till Main Market) 0.59 20.47 1.64%
Wholesaler's margin (@25%) 5.11 25.59 14.24%
Cost of wastage (@ 2% wholesale) 0.51 26.10 1.42%
Retailer's Margin (@35%) 9.13 35.24 25.42%
Cost of wastage (@ 2% Retail level) 0.7 35.94 1.95%
Source: ISAP analysis from various stakeholders’ interaction
Table 35: Price Build-up of Pineapple from Farm Gate to Shillong
61Chapter 5 | Value Chain Analysis
The average number of plants per ha is 30,000 to 35,000. Up to the fourth year of harvest,
the fruit size and weight is uniform and fruit is of good quality but after the fourth year,
the fruit weight and size starts declining. But the farmers usually take the crop till seventh
year.
Farmers do not apply any farm input like chemicals, pesticides etc. A limited number of
farmers are applying vermicompost. The grass near the fields is cut and spread in the
field which after decomposing provides the nutrition to the plants. No outside labour is
hired by the farmers for carrying out farm operations. They work in each other’s field
and carry out all the necessary farm operations. Average number of mandays required
for carrying out field operation in a season varies from 250-300 per ha. The wastages
during production and harvesting due to rodents and heart rot account for a loss of 8 to
10 percent.
Post Harvest Practices™™
Harvestingƒƒ
The fruits are harvested twice a year in summer and winter as below:
The average yield per ha is 30-35 MT per ha which includes both summer and winter harvest.
During the first year, the production is nearly 40 percent of the total yield (optimum yield),
which goes up to 80 percent and 90 percent during the second and third years of harvest
respectively.
Value Addition at Farm Levelƒƒ
Farmers do not carry out any kind of value addition at the farm level except size grading. The
produce moves through the following marketing channels:
Farmers
` 0.8-1.0 per fruit
` 0.6-0.8 per fruit
` 2-2.25 per fruit
Aggregators
Local Markets in
Dimapur/Kohima
Markets in
Guwahati
At farm gate
At farm gate
Contractors
Figure 62: Marketing Channel of Pineapple in Nagaland
Crop Flowering Harvesting
Summer March-April July-August
Winter July-September November-January
62 Value Chain Analysis of Select Crops in North Eastern States
Farmers take the produce to local markets in Dimapur – Murgi Patti, New Market and Old
Daily market, where they sell to the aggregators/wholesalers. Post-harvest loss during
transit from field to market is around 1 percent. However, due to poor connectivity, limited
transportation facility and less volumes, the farmers are sometimes bound to sell the produce
to the aggregator who collects it from the farm gate.
Marketing and Logistics™™
The transportation of fruits from Village to the markets in Dimapur or Guwahati is done
through Tata ACE/minitruck, which can carry 2000-2500 fruits. The transportation cost
from Molovom village to Dimapur is ` 1000-2000 (` 0.80-1.0 per fruit) and from Molovom to
Guwahati is ` 4500-5000 (` 2-2.25 per fruit). The aggregator who collects the produce from
farm gate usually takes it to distant markets such as Guwahati for better price realisation.
The post-harvest losses during transit range 5-6 percent. During peak season, 10-20 mini
trucks are loaded from Molovom on a daily basis. At the wholesaler’s and retailer’s level,
average post-harvest and handling wastage accounts to 2 percent of the produce value.
Price Build-up Amount (in `) Price Mark-up (` Per Piece) % Contribution
Farm gate price 8.00 8.00 39%
Aggregator Margin (@20%) 1.60 9.60 8%
Loading/Unloading 0.20 9.80 1%
Transportation 0.50 10.10 2%
wastage@ 1% 0.10 10.20 0%
Wholesaler (@30%) 3.06 13.26 15%
wastage@ 2% 0.27 13.53 1%
Retailer (50%) 6.76 20.29 33%
wastage@ 2% 0.41 20.70 2%
Source: ISAP analysis from various stakeholders’ interaction
Table 36: Price Build-up of Pineapple from Farm Gate to Dimapur (per piece)
Particular Amount
(in `)
Price Markup
(` Per Piece)
% Contribution
Average selling price of farmers 8.00 8.00 34%
Loading/Unloading 0.20 8.20 1%
Transport to Guwahati 2.00 10.20 9%
Cost of wastage (@ 5% till Main Market) 0.51 10.71 2%
Wholesaler's Margin @40% 4.28 14.99 18%
Wastage (@ 2% wholesale level) 0.30 15.29 1%
Retailer's Margin (@50%) 7.65 22.94 33%
Wastage (@ 2% retail level) 0.46 23.40 2%
Source: ISAP analysis from various stakeholders’ interaction
Table 37: Price Build-up of Pineapple from Farm Gate to Guwahati (per piece)
However, there are times when the price in the market is so less, that the farmers are forced
to leave their produce in the field. Pineapple is not being processed at commercial level in
the state. At the time of field visit in end of February, as the season was coming to an end,
the wholesale price was ` 20 per piece in the New Market and retail price was ` 25 per piece
in the Old Daily Market.
63Chapter 5 | Value Chain Analysis
Conclusion
Pineapple which is a very significant crop of the North East is also one of the traditional crops
of the region and has abundant potential in terms of production and productivity. The key
points which have emerged out of discussions with various value chain actors and field visits
are as follows:
Key Observations:™™
In most of the states, the farmers do not apply any farm inputs, so the produceƒƒ
is organic by default and can be positioned as a premium product. However, in
Assam, where the pineapple cultivation is carried out on plain area, the farmers
are well-versed with the cultivation practices. They are applying fertilisers,
insecticides, pesticides and irrigation as per their affordability.
Farmers in Tripura have started adopting staggered planting which is leading toƒƒ
the availability of pineapple for 5-6 months of the year.
Strengths/USP:™™
In all the states and regions visited, except Assam, there are no expenses onƒƒ
fertilisers and chemicals, making the produce largely organic.
The cultivation practices are labour-intensive with labour employed for almost allƒƒ
the activities from land preparation to harvesting.
During the visit to Nagaland, a meeting was held with officials from ICCOA. ICCOA is
directly procuring pineapple from the farmers as per the client’s demand for which they
pay a premium of 20-30 percent above the market price. The produce is picked from the
farmers’ field, packaged in CFB boxes by labourers and then transported to the railway
station by means of a mini carrier of 2.5 MT capacities. This carriage costs around ` 1500
from farm gate to Dimapur railway station (30-35 km), thus the transportation cost comes
to around ` 0.60 per kg (` 0.90 per fruit). From Dimapur to Kolkata, the produce is shipped
via a goods train, which costs around ` 3.5 to 4 per kg. The wastages during rail transport
range from 2-3 percent.
During summer season last year (2011), ICCOA procured approximatelly 6 MT of pineapple
from the farmers directly. ICCOA is implementing Organic Cluster Project (OCP) in Molvom
(Dimapur) and Gaili (Peren) for pineapple.
ICCOA is involved in training of farmers on organic farming of pineapple, ginger,
turmeric, passion fruit and Naga chilli. It becomes easy to procure by making farmers’
group for a particular crop in a cluster. They are working to make farmers’ groups
in the production cluster villages for potential crops. Along with government bodies
they are working to improve the post-harvest practices and certification of organic
farming.
Their model of procurement of pineapple can be implemented in other places also by
improving the cultivation, post-harvest and linkage practices. This will be helpful to directly
procure from farmers and reduce the transaction cost and wastage.
ICCOA - Direct Procurement from Farmers – A Case Study
64 Value Chain Analysis of Select Crops in North Eastern States
Issues in Pineapple Cultivation:™™
The plantations are very congested and the plant to plant spacing is very less,ƒƒ
which leads to low productivity.
No technological intervention is carried out and the crop is cultivated in aƒƒ
traditional method which costs a huge amount of labour and time. Mechanisation
of cultivation practices, especially harvesting would save on the time and
resources.
Issues in Pineapple Marketing:™™
During the peak season, the markets are covered with big heaps of pineapple,ƒƒ
which leads to a glut in the market. Of the total production, barely 67 percent of
the fruit is processed, the rest being consumed in the fresh form, which leads to
a very low price.
There is no regular market in most of the production zones and a large quantityƒƒ
of pineapple gets wasted in the field itself.
No value addition is being undertaken by the farmers at the field level. The fruitƒƒ
being perishable has a short shelf life. The absence of any kind of cold chain adds
to the post-harvest wastages.
Citrus
The North Eastern Region where citrus is cultivated in valleys, sub-mountane areas and in
low hills, has been identified as one of the major centres of diversity for citrus. The Khasi
Mandarin is the most important commercial citrus crop being grown in the hilly regions of
NER. Another important citrus crop is Assam lemon, which is a seedless variety of lemon and
is under cultivation to a considerable extent in the region.
Khasi mandarin is well-known for its quality, colour development, unique sugar acid
blend and shelf life which makes it the most sought after and popular citrus cultivar in
the North Eastern Region of the country. It covers the largest area in the region due to
its commercial value. Assam and Meghalaya have the maximum area and production of
Khasi mandarin.
Assam lemon, developed from a chance seedling, is quite popular and is grown on a
commercial scale in Assam and other states. In the state of Manipur, Kachai lemon – a very
high yielding variety of rough lemon mainly cultivated in Kachai village of Ukhrul district is a
popular variety.
The value chain of lemon has been studied in detail in Assam while that of Khasi mandarin
has been detailed in Assam, Arunachal Pradesh, Manipur, Meghalaya, Mizoram and
Sikkim.
Assam
Khasi mandarin and Assam lemon are the major focus citrus crop groups identified in
Assam.
Kamrup, Tinsukia, Karbi Anglong and North Cachar Hills are leading production clusters of
Khasi mandarin while Barpeta, Nalbari, Darrang, Kamrup have been identified as the major
production clusters of Assam lemon.
65Chapter 5 | Value Chain Analysis
Khasi Mandarin
Production Practices™™
The Khasi mandarin orchards are nearly 50-100 years old, which has led to low productivity
of the fruits. One hectare orchard accommodates 300-400 trees. The fruit bearing per tree
is nearly 300-400 fruits. The government is encouraging the farmers to use budded plants
for planting new orchards and the rejuvenation of old orchards. However, the farmers are
less interested in carrying out the rejuvenation of the orchards because they are getting
produce from old orchards effortlessly while the new plantation will take time in fruiting.
There is very limited input used in the orchards. Only few farmers who receive fertilisers and
micronutrients from government department apply it to their fields.
The planting of budded plants is carried out before the monsoons between May and
August.
As per the discussions held with the farmers, the cost of cultivation of Khasi mandarin was
calculated as follows:
1 2 3 4 5 6 7 8 9 10 11 12 13 14 15
Labourcost(Rs./Manday) 4500 1200 1200 1200 1200 1200 1200 1200 1200 2250 2625 3000 3375 3750 4500
Irrigation 500 500 500 800 800 1000 1000 1000 1000 1200 1500 1500 1500 1500 1500
Staking 3000
Insecticide/Pesticide 200 300 300 300 300 300 300 300 300 450 450 450 600 600 600
FERTILIZER 400 800 1200 1600 2000 2400 2800 3200 3600 4000 4400 4800 5200 5600 6000
FYM/VERMICOMPOST 2000 4000 6000 8000 1000 1200 1400 1600 1800 2000 2200 2400 2600 2800 3000
0
10000
20000
30000
40000
50000
60000
70000
80000
90000
CostinINR
Figure 63: Cost of Khasi Mandarin Production in Assam
Source: ISAP analysis from farmers’ interaction
Cultivation cost is worked out from planting till 15th year when the yield reaches its optimum
level. Labour cost is the major cost in the first year of cultivation as labour is employed for
land preparation, cleaning, planting and other farm operations. During the later years, the
labour cost increases with the years as labour is generally employed for various intercultural
operations and harvesting. The mandays requirement is 250-300 mandays per ha for fully
grown orchard.
The planting material cost in the first year is nearly 15 percent of the total cost, 5 percent
during second year and 2 percent in the fifth year, which is mainly the cost of filling the gaps
and replacing the mortal plants.
66 Value Chain Analysis of Select Crops in North Eastern States
Thus, the cost of cultivation of per kg is estimated at ` 8.6, which has been calculated taking
into consideration the fact that the trees start bearing fruits in the sixth year and optimum
yield is obtained till the eleventh year of bearing.
Post-harvest Practices:™™
Harvestingƒƒ
The orchard starts bearing in the sixth year from planting, fruit bearing is around 50 fruits
per tree in the sixth year which goes up to 150 fruits in the seventh year and 200-400 fruits
in the subsequent years; per kg cost of production comes to around ` 8-9. However, at the
production level, about 5-6 percent of the fruit is lost due to fruit drop and citrus decline.
Harvesting starts in the month of November which extends up to February. The big farmers
with 100 or more than 100 trees sell the fruit to the contractor before harvesting, at a pre-
fixed price; the contractor does the harvesting to sell the fruit to the wholesaler in the main
market.
Value Addition at Farm Levelƒƒ
Farmers do the manual grading of fruits in orchards only. They separate the damaged fruits
and grade the fruits in three different sizes and pack them in gunny/plastic bag. When the
orchard is sold to traders then all these activities are done by hired labour.
Marketing and Logisticsƒƒ
Following channels for the marketing of the produce are adopted in Assam:
The farmers take the produce to the nearest market in plastic/gunny bags of capacity
30-35 kg. The produce is carried on the rooftop of a bus/jeep etc. which costs ` 10 per gunny
bag. The farm gate price varies from ` 2-5 per piece (` 20 per kg). Per kg transportation
cost is approximately ` 0.60. During transportation, the losses are up to 5 percent when
transported from the village to Main market in Guwahati. At the wholesaler and retailer level,
the losses are approximately 2 percent.
Farmers
` 0.5 per fruit
` 0.6-0.10 per fruit
Local Market
Aggregators
Markets in Guwahati
Markets in
Guwahati/Kolkata
At farm gate
At
farm gate
Contractors
Figure 64: Marketing Channel of Khasi Mandarin in Assam
67Chapter 5 | Value Chain Analysis
One of the major constraints is that farmers are not able to access the markets in Guwahati
and they sell their produce to the contractors/middlemen at the farm level. Either they are
selling small quantity of citrus in local markets or orchards to the contractors; there is no
organised procurement system which can help the farmers in realising better price.
Price Build-up Amount (in `) Price Mark-up (` Per kg) % Contribution
Farm gate price 20.00 20.00 39%
Aggregator Margin @20% 4.00 24.00 8%
Loading/unloading 0.20 24.20 0%
Transportation 0.06 24.26 0%
wastage@ 5% 1.21 25.47 2%
Wholesaler (@30%) 7.64 33.11 15%
wastage@ 2% 0.66 33.78 1%
Retailer (50%) 16.89 50.67 33%
wastage@ 2% 1.01 51.68 2%
Source: ISAP analysis from various stakeholders’ interaction
Table 38: Price Build-up of Khasi Mandarin from Farm Gate to End-consumer in Guwahati
(per kg)
Assam Lemon
Assam lemon is a locally grown variety which
is elongated in shape, unlike the North Indian
lemon which is round in shape. Many farmers
are growing it in the backyard of their houses
but commercial level cultivation is also done
to sell in the distant markets in Assam and
neighbouring states.
Production Practices™™
Farmers grow 10-20 plants in the backyard, for
which they generally use their own planting
material grown through stem cuttings and
layering for propagation. The planting is carried
out between the months of May and August
before the onset of Monsoon. Nearly 800-900 plants are accommodated in one ha in a
commercially managed orchard.
During the first year, 300-400 mandays are required approximately for farm operations such
as cleaning, land preparation, planting etc., while in the subsequent years, 200-250 labour
mandays are required for various farm operations.
Post-harvest Practices:™™
Harvesting:ƒƒ The plant starts bearing fruit in the second year, July to September is
the peak time of harvesting. About 100-120 fruits are borne per tree under normal
conditions. Fruit is borne during the entire year, off season fruit can be harvested in
March. Nearly 8-10 percent of the fruit is lost at the field level due to insects, pests
and diseases. Harvesting is done when the fruits gain full size.
Value Addition at Farm Level:ƒƒ Only packing in gunny/plastic bags is done.
Assam Lemon in Market in Assam
68 Value Chain Analysis of Select Crops in North Eastern States
Lemon Village Coming up in Assam
First tried out in Japan and Thailand, a concept village is coming up in a sleepy hamlet
in Assam’s Nalbari district where thousands of lemon trees will be planted to improve
local economy. Under the concept of ‘one village one product’, the North East Financial
Development Corporation along with a leading NGO is setting up what it describes as a
‘lemon village’ at Arora, not very far from Guwahati.
The institution’s chairman-
cum-managing director,
Kashi Nath Hazarika, says
that the concept, which has
been a success in Japan
and Thailand, is being tried
out for the first time in the
Northeast with planting
of nearly 10,000 lemon
saplings.
Hazarika says the yield,
which will find a ready
market among local
population, will generate
annual average revenue
of ` 10 lakh per year. He
exudes confidence that the
climatic condition was suitable for the growth of lemon and the village will be able to
generate its own market for the product. Hazarika during the recent launching of the
scheme urged youth to set up plants for processing lemons from 2012 onwards after
mass-scale production begins.
Arora is an agrarian village with nearly 600 families most of whom are farmers. Initially,
250 farmers have been provided with lemon saplings. The NEDFI has facilitated one-time
funding for initial requirement of manure and insecticide and has engaged a technician
as mentor for the project. Hazarika hoped in the third year around 10,000 lemon plants
will be grown in the village which will yield at least 10 lakh lemons. “The availability of
such a large quantity of lemons from a single village will not only help the farmers, but
also benefit the market.”
Assam Lemon farmer in Arora village, Nalbari
Marketing  Logistics:ƒƒ The farmer generally transports the fruit in gunny bags
to the nearby markets; one gunny bag accommodates about 50 kg of fruit. The
transportation is through private vehicles such as bus/mini trucks which costs
` 10 per gunny bag. The post-harvest losses during transportation are nearly
3 percent, while at wholesaler and retailer level, the handling losses are about
2 percent. In the local market, the farmers sell the fruit to the aggregators who then
further sell it to the wholesalers. Big farmers having more than 100 plants per orchard
sell the orchard to the contractor who then gets the harvesting done and sells the
fruit to the wholesaler or retailer directly.
69Chapter 5 | Value Chain Analysis
Manipur
Tamenglong, Ukhrul and Chudachandpur are the major districts of citrus production in
Manipur. Khasi Mandarin is the most important commercial citrus species grown up to an
altitude of 1000 m above mean sea level and is the most popular cultivar in the region.
Production Practices™™
On an average, there are 100-200 trees per family, out of which 60-70 percent are fruit-
bearing trees. ICAR Research Centre at Imphal and KVKs are providing technical support
for citrus cultivation in the state. The farmers buy the planting material (budded seedlings)
from nurseries, the cost of which is around ` 10 per seedling. Approximately 300 seedlings
of citrus are required for planting in one ha, planting is done at a distance of 5.5 X 5.5 m.
Labour is employed for clearance of jungle and land development. After clearing the land,
land preparation is done and digging and filling up of pits is carried out. All these operations
are carried out by hired labour. After the filling up of the pits, the transplanting is carried
out. For land preparation and planting operations, approximately 100-110 labourers are
employed. The labour rates are ` 120 to ` 130 per manday.
During the subsequent years, the farmers do not employ much labour and farm operations
like weeding etc are done manually by family members only. The application of manures,
fertilisers and pesticides is negligible. However, nowadays some farmers have started
applying lime in the fields. The orchards are rain-fed with no irrigation facitilities during the
growth years.
Although, the package of practices has been developed by the research centre, farmers in
the field are following traditional practices. Most of the citrus orchards in the state are very
old and senile. Yield of existing orchards can be improved significantly by rejuvenation. The
state government has received a huge fund from Central government for citrus rejuvenation;
however, a very limited difference is being seen on ground.
Post-harvest Practices:™™
Harvesting:ƒƒ A good bearing tree of 20 years can produce around 400-500 fruits
(60-70 kg) per year. However, at the field level, due to not harvesting the fruit on time,
the losses range from 10-20 percent.
Price Build-up Amount (in `) Price Markup (` Per 80 Piece) % contribution
Farm gate price 80.00 80.00 40%
Aggregator Margin @20% 16.00 96.00 8%
Loading/unloading 1.00 97.00 1%
Transportation 5.00 102.00 3%
wastage@ 3% 3.06 105.06 2%
Wholesaler (@30%) 31.52 136.58 16%
wastage@ 2% 2.73 139.31 1%
Retailer (40%) 55.72 195.03 28%
wastage@ 2% 3.90 198.93 2%
Source: ISAP analysis from various stakeholders’ interaction
Table 39: Price build-up of Assam lemon from Farm-gate in Boko to Guwahati (per 80 piece)
70 Value Chain Analysis of Select Crops in North Eastern States
Marketing  Logistics:ƒƒ The harvested fruit is generally packed in jute bags
at the farm level for transportation; one bag accommodates on an average
200 pieces (30-35 kg). The farmers take the produce to the markets in Imphal
or Tamenglong by jeep, depending upon the nearness to the market and sell it
to the wholesalers. The transportation cost to Imphal (70-80 km) is ` 50 per
bag of 200 pieces (30-35 kg), thus the per kg logistics cost is ` 1.50-1.80 per kg
(` 0.25 per fruit).
Occasionally the wholesalers buy the fruits from the farm gate itself and transport it to the
market. In such cases, the transportation cost is borne by the wholesaler. Upto the point the
produce reaches the retailers, the wastages during handling range from 4-5 percent, while
at the retailers end, due to rejection by customers, the losses vary from 5 to 8 percent.
The wholesale selling price of the fruit in Imphal is ` 250 per 100 pieces (15-17 kg)
for good quality fruits, ` 120-150 per 100 pieces for average quality fruits and `
70 per 100 pieces for poor quality fruits. The price also depends on seasonality and
demand supply scenario. The retail price in the Imphal market is around ` 60-80 per kg
(5-8 pieces).
Financial Assistance:
Manipur has got special financial package of™™ ` 218 crore from Prime Minister’s office
for next five year for revival of citrus orchards in the state.
In addition to the above,™™ ` 1.5 cr has been approved for setting-up of pack-houses
and ` 21 crore for processing unit (from DoNER, SFAC  MoFPI).
Farmers
` 0.25 per fruit
` 0.25 per fruit
Markets in
Imphal/Tamenglong
At farm gate
Contractors
Figure 66: Marketing Channel of Khasi Mandarin in Manipur
Price Build-up Amount (in `) Price Markup (` Per kg) % Contribution
Farm gate price 16.00 16.00 39%
Aggregator Margin @20% 3.20 19.20 8%
Loading/unloading 0.20 19.40 0%
Transportation 0.06 19.46 0%
wastage@ 5% 0.97 20.43 2%
Wholesaler (@30%) 6.13 26.56 15%
wastage@ 2% 0.53 27.09 1%
Retailer (50%) 13.55 40.64 33%
wastage@ 2% 0.81 41.45 2%
Source: ISAP analysis from various stakeholders’ interaction
Table 40: Price Build-up of Khasi Mandarin from Farm Gate to Imphal Market
71Chapter 5 | Value Chain Analysis
Issues and Challenges
Currently, the citrus/mandarins of Manipur are losing their importance in the market due to
various reasons; some of them are as follows:
Lack of awareness amongst farmers about modern package of practices and inputs™™
usage.
Major production area for Citrus is in Tamenglong district of Manipur and every year™™
Manipur Small Farmers’ Agri-business Consortium organises Orange Festival in the
district. However, over a period of time, the focus of the festival has shifted from
promoting Oranges to spending on Orange Queen (A Fashion Show organised as part
of the Orange Festival).
Citrus orchards in the state are very old (above 50 years) and have started decaying™™
due to lack of care and maintenance.
Citrus decline has become a major threat to the orchards in the state due to improper™™
planting material, inadequate nutrition, poor management practices and damage
caused by pests and diseases.
Productivity has declined drastically over a period of time.™™
Accessibility to production area is the biggest challenge.™™
Although the quality of citrus is very good, however, marketing is a major issue.™™
Transportation cost in Manipur is very high, approximately four times as that in any™™
other part of the country and this makes any product of Manipur uncompetitive in
the market and same is applicable for citrus.
Marketing facilities  infrastructure is non-existing in the state, specifically pack-™™
house, waxing facility, storage facilities etc.
KVK has started training farmers on orchard maintenance – which includes plant™™
rejuvenation practices, application of fertiliser and pesticides, pruning and proper
irrigation etc.
Demonstration of these practices have been organised at KVK campus as well as™™
at farmers’ fields, however, there is still resistance to adoption of these practices
amongst the farmers.
Current political situation, issues of underground insurgency groups and lack of™™
seriousness at state government level for revival of citrus crop in the state are few
factors, which have restricted the development of citrus in the state.
Meghalaya
The main citrus variety cultivated in Meghalaya is Khasi mandarin. Major production clusters
of Khasi mandarin in Meghalaya are East Khasi Hills, West Khasi Hills and Jaintia Hills. Majority
of the orchards are very old upto 80-150 years.
Production Practices™™
Due to less plant to plant spacing, the plantations are congested. Number of trees per acre
varies from 200 to 300 (500-750 per ha). For new plantations, the planting material costs
` 15-25 per plant. The sowing for new orchards is carried in the months of June-July.
Most of the farmers apply FYM/Vermicompost to enhance the fertility of soil. The farmers are
not using any kind of chemical fertiliser in the orchards. Use of insecticides and pesticides by
72 Value Chain Analysis of Select Crops in North Eastern States
the farmers in the region is negligible. Approximately 10-15 percent of the fruit is lost in the
field due to insect/pests (trunk borer, leaf miner, mealy bug white flies, fruit flies and sucking
moth), diseases (citrus canker, gummosis, root rot and powdery mildew) and fruit drop. Only
recently, for last 2-3 years few farmers have started using insecticides/pesticides.
Weeding is mainly done manually by the farmers with few exceptions using weedicides
(glysophate). Majority of crops in the region are monsoon-dependent.
On an average 250-300 labour mandays per acre are engaged for doing various cultivation
practices in citrus. The cost is around ` 200 per day for a male labourer while it is
` 100 per day for a female labourer:
Post-harvest Practices™™
Harvesting:ƒƒ The plants start bearing fruit in November–December and the
fruiting period continues up to February. Average yield in the region is nearly
15-20 MT/Acre.
Value Addition at Farm Level:ƒƒ Manual grading of fruits based on sizes (large:
100-150 gms, medium: 80-100 gms, small: 40-50 gms) is carried out by the farmers.
Marketing  Logistics:ƒƒ The fruit is generally packed in bamboo baskets (small basket
accommodates 55-60 kg and big basket accommodates 80-85 kg). The farmers carry
the bamboo baskets on head loads to the nearest transportation point and from
there it is transported by jeep/maxi which cost the farmers ` 20-25 per bamboo
basket. Thus, the per kg transportation cost for local market comes to around ` 0.35
to 0.40 per kg.
Farmers sell the produce to the aggregator who carries it to the main market by mini trucks
or buses. Logistics cost for mini truck and bus is ` 40-50 per basket and ` 30-35 per basket
respectively. However, this cost varies as per the distance from the main market. During
transportation from farm gate to local market, the post-harvest losses are around 0.5 percent,
while from local market to main market, the losses are upto 2 percent.
The produce is sold on the basis of bhar (1 small bhar=32 pieces and 1 big bhar=64 pieces).
Price of product varies with the sizes (small, medium and large).
The marketing channels by which the produce moves in Meghalaya are:
Farmers
` 0.35-0.40 per kg
` 1-1.25 per kg
` 0.70-0.80
per kg
Local
Market
Contractors
Main Market-Shillong
Markets in
Guwahati/Kolkata/
Silchar
Markets in
Guwahati/Kolkata/
Silchar
Figure 67: Marketing Channel of Khasi Mandarin in Meghalaya
73Chapter 5 | Value Chain Analysis
At the Wholesaler’s Level and Retailer’s Level, the losses are one percent each.
Sikkim
The only mandarin variety cultivated all over Sikkim is Khasi Mandarin which is also known as
Sikkim Mandarin. Major production clusters are East, South and West districts. The orchards
are around 60 years old. The rejuvenation of old orchards is very limited. One ha area
accommodates 350-400 plants.
Production Practices™™
Labour cost is one of the major cost in the first year as manpower is used for land preparation
and planting. In the subsequent years, the labour requirement reduces lesser activities.
Post-harvest Practices:™™
Harvesting:ƒƒ The fruits are harvested between October–February. At the field level,
due to fruit drop, the crop loss in the production stage is 8-10 percent. The yield of
the old orchards is nearly 200-250 fruits per plant.
Value Addition at Farm Level.ƒƒ
Marketing  Logistics.ƒƒ
The marketing channels followed by the farmers are:
Farmer ------- Aggregator -------- Wholesaler (Gangtok) ------- Retailer ---------1.	
Consumers
Farmer ------- Wholesaler (Gangtok) ------- Retailer -------- Consumers2.	
Farmer -------- Traders/Contractor (village level) ------- Wholesalers (Siliguri/Kolkata)3.	
------- Retailers -------- Consumers
The fruit is manually sorted and graded as per the size. The fruits are packed in gunny bags.
In some cases, the farmers sell the produce to the aggregator at the village level, who then
takes it to the wholesale market in Gangtok. The fruits in gunny bags are then carried on the
rooftops of private vehicles to the market in Gangtok (20-30 km) and sold to the wholesaler.
During transportation to Gangtok, the post-harvest losses due to handling are about
5 percent, while when carried to the distant markets of Siliguri and Kolkata, the post-harvest
and handling losses are nearly 10 percent.
Particular Amount (in `) Price Markup (` Per kg) % Contribution
Average Selling of Farmers 32.00 32.00 56.82%
Transportation to Local Market 0.70 32.70 1.24%
Cost of wastage (@ 0.5% till local market) 0.16 32.86 0.29%
Aggregator charges (10%) 3.29 36.15 5.84%
Transport to Main Market 1.50 37.65 2.66%
Cost of wastage (@ 2% till Main Market) 0.75 38.40 1.34%
Wholesaler's margin (@15% ) 5.76 44.16 10.23%
Cost of wastage (@ 1% wholesale) 0.44 44.60 0.78%
Retailer's Margin (@25%) 11.15 55.76 19.80%
Cost of wastage (@ 1% Retail level) 0.56 56.31 0.99%
Source: ISAP analysis from various stakeholders’ interaction
Table 41: Price Build-up of Citrus from Farm Gate to Consumers in Shillong
74 Value Chain Analysis of Select Crops in North Eastern States
Another channel through which the produce reaches the market is through the trader/
contractor at the village level who buys the crop at a pre-fixed price before harvesting. He is
responsible for the harvesting. Once the crop is harvested, the traders/contractors carry the
fruits to the distant markets in Siliguri and Kolkata.
NERAMAC and SIMFED are supporting to realise the better price but there is competition with
Bhutan Mandarin in the markets of Siliguri and Bangladesh. During the end of the season
(February/March), price at retail level reaches ` 100-120 for 12 pieces of orange.
Conclusion
Issues in Citrus Cultivation:™™
The overall productivity level of North East Region is lagging behind compared toƒƒ
other states such as A.P., Karnataka, TN and MH.
Majority of mandarin orchards are senile and need rejuvenation.ƒƒ
Farmers use seeds from previous crops to raise the seedlings, which are grownƒƒ
without any care which leads to poor quality of planting material and hence low
productivity.
Poor investment capability of the farmers has lead to dependency on govt. subsidyƒƒ
for rejuvenation, inputs, equipments and nutrient requirements.
Farmers practice traditional cultivation methods in the absence of technical know-ƒƒ
how which has led to deterioration of the orchards due to various insect pests and
diseases, specifically citrus decline.
Majority of farmers sell their produce in the nearby local markets without anyƒƒ
value addition.
Price Build-up Amount (in `) Price Markup (` Per kg) % Contribution
Farm gate price 20.00 20.00 40%
Aggregator Margin @20% 4.00 24.00 8%
Loading/unloading 0.20 24.20 0.4%
Transportation 0.70 24.90 1.4%
wastage@ 5% 1.25 26.15 3%
Wholesaler (@30%) 7.84 33.99 16%
wastage@ 2% 0.68 34.67 1%
Retailer (40%) 13.87 48.54 28%
wastage@ 2% 0.97 49.51 2%
Source: ISAP analysis from various stakeholders’ interaction
Table 42: Price Build-up of Mandarin from Farm Gate to Gangtok (per kg)
Price Build-up Amount (in `) Price Markup (` Per kg) % Contribution
Farm gate price 22.50 22.50 39%
Loading/unloading 0.20 0.20 0.3%
Transportation 1.50 24.00 2.6%
wastage@ 10% 2.40 26.40 4%
Contractor's Margin (@40%) 10.56 36.96 18%
wastage@ 2% 0.74 37.70 1%
Retailer (50%) 18.85 56.55 33%
wastage@ 2% 1.13 57.68 2%
Source: ISAP analysis from various stakeholders’ interaction
Table 43: Price Build-up of Mandarin from Farm Gate to Siliguri (per kg)
75Chapter 5 | Value Chain Analysis
Though govt. regulated market are operational (catchment area of 100-200 km)ƒƒ
still dependency of farmers on the intermediaries  commission agents due to
lack of proper FV handling infrastructure.
Cash requirement of farmers forces them to distress sell in case of mandarin,ƒƒ
ginger  turmeric.
Lack of proper logistics arrangements for fruits and vegetables adds higherƒƒ
transportation cost, lack of fruit processing industry due to which the farmers
have to sell the produce at throw away prices to the traders.
Ginger
Ginger is an important spice crop in the world. It is cultivated in almost all the states of the
country; however, the North Eastern Region is one among the highest ginger productivity
areas in the world. The agro-climatic conditions of North East India, characterised by warm
and humid summers with abundant rainfall and cool winters are favourable for ginger
cultivation. The North Eastern States of Arunachal Pradesh, Mizoram, Sikkim, Meghalaya,
Manipur, Tripura and Nagaland account for 24.6% of area under ginger and 24.1% of India’s
ginger production. The ginger produced in NER also has higher oil and oleoresin content,
making it one of the best in quality.
The traditional system of ginger cultivation in the North East is jhum system or shifting
cultivation which is prevalent in all states except Sikkim.
Assam
Maran and Nadia are the most popular varieties of ginger grown in Assam. Major identified
production clusters are Sonitpur, Udalguri, Golaghat, Tinsukia, Karbi Anglong and North
Cachar Hills.
Production Practices™™
Figure 68: Production Cost of Ginger in Assam
Source: ISAP analysis from farmers’ interaction
Ginger
Labour 45000
Irrigation 2200
Fertilizers 2900
Manures 8000
Seed/Planting Materials 24000
Total 82100
0
10000
20000
30000
40000
50000
60000
70000
80000
90000
CostinINR
76 Value Chain Analysis of Select Crops in North Eastern States
Approximately 1 to 1.2 MT seed ginger is used for planting one ha area. Planting is carried
out in month of March-April. The farmers generally do not use much fertiliser; those who
can afford the fertilisers do apply it in small quantity. Nearly 300 labour mandays are
required for various farm operations such as land preparation, weeding and harvesting.
At the field level, the losses are nearly 8-10 percent of the crop value due to pests and
diseases.
Post-harvest Practices:™™
Harvesting:ƒƒ Harvesting of the rhizomes starts in October which continues till
January.
Value Addition at Farm Level:ƒƒ The farmers do the cleaning, washing and packing of
the rhizomes before taking it to the markets. The rhizomes are packed in gunny bags
which accommodates 50 kg each.
Marketing  Logistics:ƒƒ The farmer usually sells the rhizome to the aggregator at the
village level, who then takes it to the main market where it is sold to the wholesaler.
The post-harvest and handling loss during transportation and at wholesaler’s and
retailer’s level is about 2 percent each.
The yield comes to 8-10 MT per ha. Thus, the production cost per kg comes to be ` 10 per kg.
The average selling price of the farmer is ` 12-15, thus the farmer earns about ` 14000 per ha.
Excluding the cost of family labour add to more profit.
Most prevailing marketing channel of ginger in the region is as below:
In most ginger growing districts except Karbi Anglong, farmers are not realising better price
due to involvement of aggregators and farmers’ inability to sell the produce directly in the
markets. Established ginger pack house is yet to be utilised so that farmers can supply directly
to pack house.
Farmers Aggregators
At farm gate ` 0.8 per/kg
Market in Guwahati
Figure 69: Marketing Channel of Ginger in Assam
Table 44: Price Build-up of Ginger from Farm Gate in Boko to Guwahati (per kg)
Price Build-up Amount (in `) Price Markup (` Per kg) % Contribution
Farm gate price 10.00 10.00 34%
Aggregator Margin @30% 3.00 13.00 10%
Loading/unloading 0.40 13.40 1%
Transportation 0.80 14.20 3%
wastage@ 2% 0.28 14.48 1%
Wholesaler (@30%) 4.35 18.83 15%
wastage@ 2% 0.38 19.21 1%
Retailer (50%) 9.60 28.81 33%
wastage@ 2% 0.58 29.38 2%
Source: ISAP analysis from various stakeholders’ interaction
77Chapter 5 | Value Chain Analysis
Meghalaya
In Meghalaya, ginger is cultivated on slopes. The most popular varieties under cultivation are
Nadia and Vara in the identified major cluster of Ri Bhoi, East Garo Hills and West Garo Hills.
Nadia is popular due to its low fibre content.
Production Practices™™
Farmers generally use their own seeds (rhizomes) for cultivation purpose. The seed rate
varies from 1 MT to 1.5 MT per ha. Sowing is mainly carried out in the month of April-May in
the region and harvesting starts from November and goes on up to January. Farmers apply
FYM/Vermicompost at the rate of 5-6 MT per ha. Use of chemical fertilisers, insecticides/
pesticides or weedicides is not practiced by the farmers in the region.
The farmers usually spread the straw, grasses and other plant residues on the ginger beds
immediately after planting. This acts as mulch which protects the seedlings from rain,
prevents weed growth, keeps the soil moist and soft and accelerates plant growth.
The crop is monsoon-dependent. Weeding is mainly done manually by the farmers. During
the entire season from May to January, labour is employed for land preparation, intercultural
operations and harvesting. The labour mandays used for ginger cultivation in 1 ha area range
from 200 to 250. The rate of a male labour is ` 200 per day, while a female labourer charges ` 100
per day. In the field, the losses due to insects, pests and diseases range from 1-2 percent.
Post-harvest Practices:™™
Harvesting:ƒƒ Ginger attains harvest maturity in 8-9 months. Hence, the peak harvest
starts from November and extends till January. On an average, 8-10 MT of ginger is
harvested from a hectare.
Value Addition at Farm Level:ƒƒ Farmers carry out the manual grading of rhizomes
based on size (small, medium and large). Price of rhizomes varies with size. Most of
the farmers sell the produce to the middlemen or aggregator or the trader from the
distant market in the village itself. The rhizomes are packed in gunny bags of size
50 kg which costs the farmers ` 15-20 per gunny bag.
Marketing  Logistics:ƒƒ The marketing channels followed by the farmers are as
follows:
Farmers
` 0.60/kg
Aggregators Market in Shillong
Contractor/
Trader
Markets in Guwahati,
Kolkata, Silchar
etc.
Figure 70: Marketing Channel of Ginger in Meghalaya
78 Value Chain Analysis of Select Crops in North Eastern States
The farmers sell the ginger on the basis of rhizome size; small sized rhizomes for ` 5-6 per kg,
medium sized for ` 8-10 per kg and large sized rhizomes for 12-15 per kg.
The aggregator/middlemen then carry the produce to the main market where it
is sold to the wholesaler who sells it further to the retailer. The traders from
other states i.e, Guwahati, Kolkata and Silchar, who come to the farm gate to collect
the produce, carry the ginger to their respective markets in the state to sell it to the
wholesalers and retailers. The transportation cost of one gunny bag from the village to
the main market by jeep/bus varies between ` 30-40 depending on the distance. At the
wholesaler’s level and retailers’ level, the post-harvest losses vary from 0.5 to 1 percent
due to handling.
The table above shows net loss of ` 11,000-29,000 per hectare, this loss is mainly due to
consideration of high labour cost, which is in most of the cases, farmer’s own family working
Sl. No. Particular Amount (in `)
1 Planting Material (1-1.5 MT/ha) 60,000
2 Manures (5-6 MT/ha) 9,000
3 Fertilizers  Pesticides 0
4 Irrigation 0
5 Labour (including family labour) 50,000
6 Total Production cost 1,19,000
7 Average production cost (` Per kg) 13.5
8 Yield (in MT/ha) 9
9 Average Selling price (` Per kg) 10-12
10 Total income per ha. (in `) 90,000-108,000
11 Net loss (` per ha.) 11, 000-29,000
Source: ISAP analysis from farmers’ interaction
Table 45: Cost Economics of Ginger Cultivation in Meghalaya
Particulars Amount (in `) Price Markup
(` Per kg)
% Contribution
Production Cost 13.5 13.5*
Average Selling price of Farmers 12 12 44.64%
Loading/unloading 0.4 12.4 1.49%
Carriage Cost (Gunny Bags ` 20 per 50 kg bag) 0.4 12.8 1.49%
Middlemen/Aggregator charges (10-15%) 1.86 14.66 6.92%
Transport to Main Market (` 30-40 per 50 kg
gunny bag)
0.6 15.26 2.23%
Wholesaler's margin (25-30%) 4.46 19.72 16.59%
Cost of wastage (@ 0.5% wholesale) 0.1 19.82 0.37%
Retailer's Margin (30-35%) 6.8 26.62 25.30%
Cost of wastage (@ 1% Retail level) 0.26 26.88 0.97%
* After reducing the family labour cost, cost of production comes below the farm gate price.
Source: ISAP analysis from various stakeholders’ interaction
Table 46: Cost Build-up of Ginger from Farm Gate to Consumers
79Chapter 5 | Value Chain Analysis
in the field. If own labour is deducted, cultivation of ginger turns profitable. Similarly, manure
used by the farmers is also not purchased from the market, it is mainly dung collected from
domestic animals.
Sikkim
Major production belts in all four districts of Sikkim are as below:
North Sikkim: Lower Rongong, Lingdok, Nampatam, Nadey, Passingdong, Lum, Gor, Sangtok
East Sikkim: Whole area
South Sikkim: Poklok, Kamrang, Namchi, Singithang, Namthang, Rateypani, Melli, Barfung,
Rangyang, Ynagyang, Temi, Namphing
West Sikkim: Tikjyek, Lungik, Rathang, Tikpur, Ambotey, Lower Buriokhop
Ginger is grown in all four districts upto 6000 mt. altitude hence production is less in North
District which has higher altitudes. It is one of the major spice crops in the region which
contributes 14 percent to the total ginger production on the North Eastern Region.
Production Practices™™
Local varieties Bhaisey, Majaole and Gurubathaney etc. are used for cultivation. Farmers use
the seed rhizomes preserved in the last season for the sowing purpose. The horticulture
department also distributes seeds free of cost to the farmers but only a few farmers get the
free seeds. In case, the farmer needs to buy the seed from the market, in the peak season,
the cost reaches ` 1000 per 25 kg bag (` 40 per kg). The sowing of the seed rhizome is carried
out in the February-end which extends up to April-end.
Farmers do apply FYM in the fields. Some farmers who have their own vermicompost units
built with the subsidy from the Government Department use vermicompost as per the
availability.
Sikkim has been declared as an Organic State, hence the use of chemicals and fertilisers
is not allowed. A limited quantity of biofertilisers and biopesticides supplied by the govt.
department are used, however, the farmers are reluctant to buy the organic fertilisers
from the market. The crop is mainly rain-fed as irrigation facilities are limited in the state.
Availability of labour for agriculture purpose is also a constraint. The labour requirement
is 350-400 mandays which includes family labour. The manday cost is ` 150 per day plus
one time food. No major insects, pests or diseases have been noticed in the area. However,
sometimes there is damage due to soft rot. The losses during the production at the field level
are about 5-6 percent.
The Horticulture Department is now supplying seed rhizomes of improved varieties which
have minimised the occurrence of the diseases and insects and pests.
Post Harvest Practices:™™
Harvesting:ƒƒ The harvesting of rhizomes is carried out in October and continues up
to January. The yield in one ha area is 5-6 MT of ginger rhizomes.
Value Addition at Farm Level:ƒƒ The farmer carries out the cleaning and washing of
the rhizomes at the field level which are then packed in gunny bags. A small gunny
bag which accommodates 25 kg costs ` 10.
80 Value Chain Analysis of Select Crops in North Eastern States
Marketing  Logistics:ƒƒ
The farmer either sells the produce to the aggregator at the village level or to the wholesaler or
traderfromSiliguriorKolkata.Thepost-harvestlossesduringtransportationtoGangtokisabout
1 percent only, but when transported to distant markets of Siliguri and Kolkata, the handling
loss ranges upto 2-3 percent. At the wholesalers and retailers level, this loss is 2 percent.
Glut is also a major issue for ginger. Farmers have to leave the ginger in the field itself due to
very low price offered and they use it as seed for the next season.
Conclusion
At production level:™™
Farmers are using their own seed, which becomes carrier of various seed borneƒƒ
diseases such as rhizome rot (more than 70% farmers use their own seed saved
from last seasons’ crop).
At least 30% of the total ginger gets destroyed at farm level due to rhizome rot ofƒƒ
ginger.
Low yield due to poor production practices (flat bed method is used by theƒƒ
farmers).
Non-availability of labour is also a big problem at field level.ƒƒ
Low level of yield leading to high production cost per kg thus making productƒƒ
uncompetitive.
At Market level:™™
Uneconomical quantity with each farmer, increasing cost of individual farmers toƒƒ
take their produce to the market.
Lack of infrastructure for primary cleaning, sorting  grading to make the produceƒƒ
marketable.
Farmers have limited option of getting arbitrage.ƒƒ
At processing level:™™
Absence of any kind of value addition at the farm or primary level.ƒƒ
There is lack of entrepreneurship in society in general to take up ginger (or anyƒƒ
other fruit) processing activities and establish the brand in the market.
Price Build-up Amount (in `) Price Markup (` Per kg) % Contribution
Farm gate price 12.00 12.00 38%
Aggregator Margin @20% 2.40 14.40 8%
Loading/unloading 0.40 14.80 1%
Transportation 0.65 15.45 2%
Wastage@ 1% 0.15 15.60 0%
Wholesaler (@30%) 4.68 20.29 15%
Wastage@ 2% 0.41 20.69 1%
Retailer (50%) 10.35 31.04 33%
Wastage@ 2% 0.62 31.66 2%
Source: ISAP analysis from various stakeholders’ interaction
Table 47: Price Build-up of Ginger from Farm Gate to Gangtok (per kg)
81Chapter 5 | Value Chain Analysis
Turmeric
Turmeric is the dried rhizome of Curcuma Longa L. which is used as a condiment,
flavouring and colouring agent, is a principal ingredient in the Indian kitchens
as curry powder. The turmeric derives its taste, aroma and colour from its active ingredient
‘curcumin’ which is the principal phenol responsible for the yellow colour and medicinal
characteristics of turmeric. The higher the curcumin content, the better the turmeric
variety.
Assam
Kamrup, Barpeta, Sonitpur, Nagaon, Baksa, Golaghat, Lakhimpur and Karbi Anglong are major
identified production clusters for Assam. Most of the farmers use locally grown varieties
which are not recommended by the Agriculture Department but give good yield.
Production Practices™™
Aamda and Lakadang are the identified varieties grown by the farmers. A seed rate of
12 quintals per ha is used for planting which costs the farmers ` 25 per kg seed. The sowing
of the seeds is carried out in the months of March-April. Farmers either use their own seed
preserved during the last season or buy the seed rhizome from the market. About 300 labour
mandays are required for carrying out various farm operations.
As per the discussions with the farmers during FGDs, the following cost of production has
been estimated:
Post-harvest Practices:™™
Harvesting:ƒƒ The harvesting begins in the month of November, which extends till
January. The yield is 6 -7 MT of rhizome per ha.
Figure 71: Production Cost of Turmeric in Assam
Source: ISAP analysis from farmers’ interaction
Turmeric
Labour 45000
Irrigation 2200
Fertilizers 3700
Manures 6000
Seed/Planting Materials 30000
Total 86900
0
10000
20000
30000
40000
50000
60000
70000
80000
90000
100000
CostinINR
82 Value Chain Analysis of Select Crops in North Eastern States
Value Addition at Farm Level:ƒƒ Few farmers sell rhizomes after curing it.
Marketing  Logistics.ƒƒ
The farmers generally sell the rhizomes to the aggregator at the village level. The marketing
channel followed by the farmers is:
Farmers -------- Aggregators ---------- Wholesalers --------- Retailers -------- Consumers1.	
At the production level, due to insect pests and diseases, the crop loss is nearly 5 -6 percent
while during transportation, the loss is 1-2 percent.
Farmers sell the turmeric at field level to aggregators who further carry it to Guwahati market
by mini trucks and sell to wholesalers. It is supplied to other markets in Assam also from
Guwahati.
Meghalaya
The major production clusters that have been identified in Meghalaya are Jaintia Hills and
West Garo Hills. Lakadang is main popular variety, which is a much sought after variety by
the extraction industry due to its high curcumin content (5.5%).
Production Practices™™
The sowing of turmeric is carried out on beds on slopes. Usually farmers use their own seeds
(rhizomes) preserved from the previous season’s crop for cultivation purpose. The seed
rate varies from 0.8 to 1 MT per ha. For sowing, both the mother rhizomes and fingers are
used. Sowing in the region is carried out in the month of April-May. Farmers apply only FYM/
Vermicompost @5-8 MT per ha during the entire cropping season. No chemical fertilisers,
insecticides/pesticides or weedicides are applied by the farmers in the region. The crop is
monsoon-dependent. Weeding is mainly done manually by the farmers.
Figure 72: Marketing Channel of Turmeric in Assam
Farmers Aggregators
At farm gate ` 0.8/kg
Market in Guwahati
Price Build-up Amount (in `) Price Markup (` Per kg) % Contribution
Farm gate price 20.00 20.00 41%
Aggregator Margin @25% 5.00 25.00 10%
Loading/unloading 0.40 25.40 1%
Transportation 0.80 26.20 2%
Wastage@ 2% 0.52 26.72 1%
Wholesaler (@30%) 8.02 34.74 16%
Retailer (40%) 13.90 48.64 29%
Source: ISAP analysis from various stakeholders’ interaction
Table 48: Price Build-up from Farm Gate Boko to Guwahati
83Chapter 5 | Value Chain Analysis
About 200-250 labour mandays are required for the cultural operations from land preparation
to harvesting. The charges for labour are ` 200 per day for men labour and ` 100 per day for
women labour.
Post Harvest Practices:™™
Harvesting:ƒƒ The harvesting starts in the month of December and extends
till March. The average yield of green turmeric in the region is 6-8 MT/ha.
The produce is packaged in 50 kg gunny bags. The cost of one gunny bag is
` 15-20 per bag.
Value Addition at Farm Level:ƒƒ Some quantity is sold in fresh form while majority
of the farmers carry out washing, drying and slicing of the rhizome. From
1 MT of fresh turmeric, only 150 to 200 kg of dry turmeric is obtained (recovery
percentage – 15 to 20 percent).
	The selling price of fresh turmeric varies from ` 15-18 per kg, while dried rhizome sells
at a price of ` 150-180 per kg.
Marketing  Logistics:ƒƒ The fresh rhizomes are sold to middlemen or
aggregator at the village level itself while the dried and sliced rhizomes are
sold to the processor in nearby villages. The aggregator/middlemen take the
produce to the market; sell it to the wholesaler who further sells it to
the retailer. The logistics cost for transporting one 50 kg bag from village
to main market by jeep/bus varies from ` 30-40 depending upon the
distance. For dried form, the processors carry out the grinding and the
powdered spice is sold in the local market and distant markets of
Guwahati, Silchar, Kolkata and Bangladesh (through illegal trade practices) at
` 250-300 per kg.
There are negligible post-harvest losses due to the nature of the produce which is sold in the
dried form.
Farmers
` 0.60-0.80 per kg
Aggregators Markets in Shillong
Processors
Markets in Shillong/
Kolkata/Guwahati/
Silchar
Figure 73: Marketing Channel of Turmeric in Meghalaya
84 Value Chain Analysis of Select Crops in North Eastern States
Sl. No. Particular Amount (in `)
1 Planting Material (0.8-1 MT/ha) 40,000
2 Manures (5-8 MT/ha) 12,000
3 Fertilisers  Pesticides 0
4 Irrigation 0
5 Labour (including family labour) 50,000
6 Total Production cost 102,000
7 Average production cost (` Per kg) 12.75
8 Yield (in MT/ha) 8
9 Average Selling price (` Per kg) 15 -18
10 Total income per ha (in `) 120,000-144,000
11 Net gain (` per ha) 18, 000-42,000
Source: ISAP analysis from farmers’ interaction
Table 49: Cost-economics of Turmeric Cultivation in Meghalaya
Particular Amount
(in `)
Price Markup
(` Per kg)
% Contribution
Production Cost 12.75 12.75
Average Selling of Farmers 18.00 18.00 45.45%
Carriage Cost (Gunny Bags ` 20 per 50 kg bag) 0.40 18.40 1.01%
Middlemen/Aggregator charges (10-15%) 2.76 21.16 6.97%
Transport to Main Market (` 30-40 per 50 kg
gunny bag)
0.60 21.76 1.52%
Wholesaler's margin (30% ) 6.53 28.29 16.48%
Retailer's Margin (40%) 11.32 39.60 28.57%
Source: ISAP analysis from various stakeholders’ interaction
Table 50: Cost Build-up of Turmeric (1 kg) from Farm Gate to Consumers
Mizoram
In Mizoram, Reiek village in Mamit district is very famous for turmeric cultivation. Mamit
is the largest turmeric producing district in Mizoram. Other identified clusters are Saiha,
Champhai, Kolasib and Serchhip.
Production Practices™™
The varieties used are Lakadong and RCT-I. The Horticulture Department is supplying the
RCT-I planting material (rhizomes) to few selected farmers. The seed rate used is 6-8 quintals
per ha which yields around 4-5 MT of finished product.
Sowing is done in the month of February and March. No fertiliser and other chemical use
have been noticed. Labourers are mainly family members. About 150-200 mandays per ha
are required for farm operations from field preparation to harvesting. The labour charges
are ` 200/manday for hired labour.
Post-harvest Practices:™™
Harvesting:ƒƒ The crop is harvested from December to April; December and January
are the peak harvesting months. During the crop production and harvesting, the
losses due to shoot borer are nearly 10 percent. The selling price of the fresh
rhizomes is ` 15 per kg.
85Chapter 5 | Value Chain Analysis
Value Addition at Farm Level:ƒƒ Farmers do the cleaning, washing, curing and drying
after harvesting and then pack the rhizomes in plastic bags. The plastic bags with
small quantities of produce are carried on the roof of the passenger vehicles by
the farmers to the nearby city or town.
Marketing  Logistics:ƒƒ The transportation cost for transporting to a distance of
3-40 km is ` 30 per 30-40 kg plastic bag. Aggregators and traders carry full truck loads
of the cured and dried turmeric in Tata 407 which accommodates 2.5-3 MT, to Aizawl
market and other neighbouring markets in Assam. The logistics cost till Aizawl market
is ` 2500-3000 per truck load and up to Silchar it is ` 8000 per truck load. The losses
during transit range from 1-2 percent when carrying to Aizawl market and 3-4 percent
when carrying to Silchar market. The handling losses at the wholesaler’s and retailers’
level are approximately 1 percent.
Marketing channels:
Farmers-Middleman (village level)-Local wholesale markets in Mizoram-retailers-1.	
consumers
Farmers-Local wholesale markets in Mizoram-retailers-consumers2.	
Farmers-Traders/contractors(fromneighbouringdistrictsofAssam,Silchar,Karimganj3.	
etc.)-wholesale markets-retailers-consumers
Farmers
` 0.80-1.0 per kg
` 1 per kg
` 2.50-3 per kg
Aggregators
Local markets in
Aizawl
Contractors
Markets in Silchar,
Cachar etc.
Figure 74: Marketing Channel of Turmeric in Mizoram
Particular Amount (in `) Price Mark-up
(` Per Piece)
% Contribution
Average selling price of farmers 15.00 15.00 42%
Aggregator Margin (@20%) 3.00 18.00 8%
Transport to Aizawl 1.00 19.00 3%
Cost of wastage (@ 1% till Main Market) 0.19 19.19 1%
Wholesaler's Margin @ 30% 5.76 24.95 16%
Wastage (@ 1% wholesale level) 0.25 25.20 1%
Retailer's Margin (@40%) 10.08 35.28 28%
Wastage (@ 1% retail level) 0.35 35.63 1%
Source: ISAP analysis from various stakeholders’ interaction
Table 51: Price Build-up of Turmeric from Farm Gate to Aizawl Market (per piece)
86 Value Chain Analysis of Select Crops in North Eastern States
Naga Chilli
The Naga Chilli is the traditional food item of the Naga community. It is believed to have
originated in Nagaland and the State Government has obtained GI rights for the product in
2008. It has a distinct taste and pungency and is used in many forms - fresh, dried, powdered
and pickled. Major identified clusters are Kohima, Peren and Dimapur. 
Nagaland
Naga Chillii is also known as ‘Raja Merja’ at local level. The identified major production clusters
are Kohima, Peren and Dimapur districts.
Production Practices™™
The seed rate is 1 kg/ha. The farmers use the seeds
preserved from the last season’s crop. It is grown
as a rain-fed crop in all kind of soils from plains of
Dimapur to the high hills. In plains, the sowing of
the seed is carried out in August to October and
transplanting is done in September–November.
In the hills, the sowing time is February to March
and transplanting of seedlings is carried out from
March to May.
About 200-250 mandays are required for carrying
out the farm operations. Being a highly perishable
product, the crop loss varies from about 5-10 percent
at the field level.
Post-harvest Management™™
Harvesting:ƒƒ The chilli is ready for harvest within
75-90 days after sowing. The yield per ha of fresh chilli
is 2-2.5 MT. However, dry chilli fetches better price in
the market than fresh chilli, so the farmers prefer to
dry them before they sell it to the traders.
Value Addition at Farm Level:ƒƒ Most of the farmers have
installed indigenous drying units where the drying and
bulk packaging of the chilli is carried out.
Marketing  Logistics:ƒƒ
The following channels are followed for chilli marketing:
Farmer-aggregator-Wholesaler-Retailer-Consumer (Local Market)1.	
Farmer/s-Trader/Contractor-Wholesaler (in Kolkata, Delhi, Mumbai, Bangalore etc.)-2.	
Retailer-Consumer (Dry Chilli)
The farm gate price of dry chilli during lean season or during times of less production may
go up to ` 1500 per kg. Fresh chilli sells for ` 1 to ` 5 per piece in the retail market, while a
packet of five dry chilli pieces in a retail outlet in Dimapur was being sold at ` 50. Fresh chilli
is sold locally while dried chilli can be transported to distant places such as Kolkata, Delhi,
Mumbai and Bangalore.
Manual Sorting  Grading of Naga Chilli
87Chapter 5 | Value Chain Analysis
Farmers generally carry fresh chilli in very small quantities to local markets in the districts of
Nagaland on rooftop of vehicles which costs them ` 0.50-1/kg. During transportation of the
fresh produce, there are nearly 5 percent post-harvest losses during handling. Due to its
highly perishable nature, fresh chilli is not transported to distant markets. At the wholesaler’s
and retailer’s level, the handling wastages account for 2-3 percent of fruit loss. Dry chilli is
transported in CFB to distant markets by traders like ICCOA and Shimla Hills for which the
transportation cost is ` 25 to 100 per box depending upon the distance. The handling and
transportation loss for dry chilli is nearly 2-3 percent.
Farmers
` 0.60-0.80 per kg
` 0.50-1.0 per kg
Dry Chilli
Aggregators
Markets in
Dimapur/Kohima
Traders/
Contractors
Markets in
Dimapur/Kohima
Markets in Guwahati/
Kolkata/Delhi/Banglore
/Mumbai
Figure 75: Marketing Channel of Naga Chilli in Nagaland
Particulars Amount (in `) Price Mark-up
(` Per Piece)
% Contribution
Average selling price of farmers 120.00 120.00 63%
Aggregator Margin (@5%) 6.00 126.00 3%
Transport to Dimapur/Kohima 1.00 127.00 1%
Cost of wastage (@ 5% till Main Market) 6.35 133.35 3%
Wholesaler's Margin @10% 13.34 146.69 7%
Wastage (@2% wholesale level) 2.93 149.62 2%
Retailer's Margin (@25%) 37.40 187.02 20%
Wastage (@ 2% retail level) 3.74 190.76 2%
Source: ISAP analysis from various stakeholders’ interaction
Table 52: Price Build-up of Fresh Naga Chilli from Farm Gate to Dimapur/Kohima (per kg)
Fresh Naga Chilli cannot be transported to distant markets such as Delhi/Mumbai due to its
high perishable nature. There is huge difference between farmer’s and consumer’s price in
dry chilli.
Passion Fruit
Passion fruit is a high value and potentially a foreign exchange earning crop. It is a potential
crop in Nagaland which is mainly cultivated from mid-hills to high-hills in the state. The fruit
is grown to eat or for its juice, which is often added to other fruit juices to enhance aroma.
88 Value Chain Analysis of Select Crops in North Eastern States
The fruit can be grown in all kinds of soils; however, soils rich in organic matter are most
suitable for its cultivation. A temperature range of 16°C to 30°C is most suitable for its
cultivation. There are two varieties - the purple passion fruit and yellow passion fruit. Both
the varieties are cultivated in the region.
Nagaland
Kohima, Wokha and Mokokchung are major production clusters of passion fruit in
Nagaland.
Production Practices™™
The seed sowing for primary nursery is carried out during the month of September which
is then transplanted in the secondary nursery after 30-45 days (October–November). The
8-10 month old seedlings are transplanted in the field in the months of May–June. 1600 to
1700 plants are grown in one ha area.
Post Harvest Practices:™™
Harvesting:ƒƒ The harvesting starts 2 years after the transplanting in the main field. The
fruit ripens in the months between August and December and March and May. At the
farmers’ level, losses up to 5-6 percent are reported due to powdery mildew. The yield
is around 10 MT/ha per year.
Value Addition at Farm Level:ƒƒ Farmers do not carry any kind of value addition at
their end.
Marketing  Logistics:ƒƒ Farmers generally carry the passion fruit on the rooftop of
private vehicles to nearby markets, the transportation costs for which comes to ` 0.5
to 1 per kg. Average farmers’ selling price ranges from ` 10-15 per kg. However,
in cases where processors directly procure from the farmers groups, the farmers
get ` 10-12 per kg. For distant markets such as Guwahati and Kolkata, the cost is
` 2-2.50 and ` 3.5 to 4 per kg, respectively. During transportation, post-harvest losses
range from to 2-5 percent, while at the retailer’s level, the handling losses are nearly
2 percent.
Particular Amount (in `) Price Mark-up
(` Per kg)
% Contribution
Average selling price of farmers 600.00 600.00 40%
Packaging 10 610.00 1%
Transportation to Dimapur 10 620.00 1%
Wastage till Dimapur @ 1% 6.2 626.20 0%
Transportation from Dimapur to Bangalore 100 726.20 7%
Wastage till Bangalore @2% 14.52 740.72 1%
Traders, Margin 250 990.72 17%
Wholesalers, Margin 200 1190.72 13%
Retailers, Margin 300 1490.72 20%
Source: ISAP analysis from various stakeholders’ interaction
Table 53: Price Build-up of Dry Naga Chilli from Farm Gate to Bangalore (per kg)
89Chapter 5 | Value Chain Analysis
Commercial level cultivation is not taking up further due to poor condition of processing
plants, their linkages further with major processed product marketing organisations. Due to
lesser demand sometime fruits go wasted at farm level so farmers are discouraged sometime
to take the crop in future.
Kiwi Fruit
Kiwi fruit or Chinese gooseberry is one of the best known nutritious fruit among the soft
fruits. It is being cultivated in some sizeable area in Arunachal Pradesh in North East,
although the other NE states too have a vast potential for the cultivation of Kiwi fruit.
The fruit is mainly consumed as a fresh fruit or combined with other fruits, in salads and
desserts. The nutritive value and flavour are retained when the fruit is processed to jam,
jelly or preserves.
Farmers
` 1 per kg
Aggregators
Processors
Markets in
Dimapur/Kohima
Processed products in
markets
Figure 76: Marketing Channel of Passion Fruit in Nagaland
Particular Amount (in `) Price Mark-up (` Per Piece) % Contribution
Average selling price of farmers 10.00 10.00 39%
Aggregator Margin (@20%) 2.00 12.00 8%
Loading/Unloading 0.40 12.40 2%
Transport to Dimapur/Kohima 1.00 13.40 4%
Cost of wastage (@ 2%) 0.27 13.67 1%
Wholesaler's Margin @ 30% 4.10 17.77 16%
Wastage (@2% wholesale level) 0.36 18.12 1%
Retailer's Margin (@40%) 7.25 25.37 28%
Wastage (@ 2% retail level) 0.51 25.88 2%
Source: ISAP analysis from various stakeholders’ interaction
Table 54: Price Build-up of Passion Fruit from Farm Gate to Dimapur/Kohima (per kg)
90 Value Chain Analysis of Select Crops in North Eastern States
The plant needs a long growing season (at least 240 frost-free days), which will not be
hampered by late winter or early autumn freeze. For high yield and quality fruits, it requires
700-800 chilling hours below 7°C to break dormancy period. It prefers somewhat acidic
(pH 5 -6.5), well-drained soils that are rich in organic matter.
The fruit grows on vines which require vigorous pruning. Fruit is borne on one-year old and
older canes, but production declines with the ageing of the canes.
Arunachal Pradesh
In Arunachal Pradesh, the crop is grown on the sharp hilly terrains, with plantation carried
out on slopes. Major growing districts are Tawang, West Kameng and Lower Subansiri.
Production Practices™™
The most popular varieties grown are Alison and Harvard. The orchards are mixed with old
plantations (which are almost 15-20 years old) and new plantations. However, the plantations
are generally congested with less plant to plant spacing.
During the crop cycle, the farmers do not apply any kind of chemical fertilisers, insecticides,
pesticides and weedicides. Only FYM/Vermicompost are applied at the rate of 5-7 kg per
plant. The weeding is carried out manually by the farmers. During discussions with farmers,
it emerged that there are losses up to 5-10 percent due to insects and pests such as beetles
etc. The orchards are mainly rain-fed; however, few progressive farmers have started using
drip irrigation and water tankers also. Nearly 1200 to 1500 labour mandays are required for
various farm operations; the farmers usually hires outside labour for the field operations.
At the field level, due to fruit drop and insects, pests and diseases, the fruit loss is nearly
5-10 percent.
Post-harvest Practices:™™
Harvesting:ƒƒ The fruiting period is two months i.e. October and November. The yield
in the region is nearly 3-4 MT/ha.
Value Addition at Farm Level:ƒƒ The farmers carry out the manual sorting and grading
of the fresh produce on the basis of weight as follows:
Marketing  Logistics:ƒƒ The fruits are transported in mini trucks without any kind of
packaging, or packed in gunny bags. The farmers either sell the fresh fruit directly
to consumers at the local or main market, in case main market is situated close
to the production area. The farmers carry the fruit on head loads to the nearest
transport point and from there it is transported by jeep/maxi to the local market.
The transportation cost per gunny bag comes to ` 20-50 depending upon the
distance. During the transit from field to local market, the post-harvest losses during
transportation are 0.5 percent.
Grade Weight Market
A Grade 90 gm and Above Exports
B Grade 60-90 gm Domestic/Local
C Grade 50-60 gm Domestic/Local
D Grade 40-50 gm Processing
91Chapter 5 | Value Chain Analysis
From the local market, the produce moves through mini trucks which accommodates 5 MT
due to modified body of the mini truck (the original capacity of the mini truck is 2-3 MT) and
buses (bamboo baskets on the rooftop of the bus) to the main market. The logistics cost for
transportation to the main market is around ` 3500-7000 per mini truck and ` 75-100 per
bamboo basket. The post-harvest losses during transportation from local market to main
market are nearly 8-10 percent due to the perishable nature of the fruit.
The fruit is sold on the basis of grades.
In most of the cases, the farmers sell the whole orchard to the contractor before harvesting at
a pre-fixed price. However, some farmers do sell the produce to the middlemen/aggregators/
traders from outside places such as Guwahati, Silchar, Kolkata and Delhi.
At the wholesaler and retailer’s level, the post-harvest losses are to the tune of 3-5 percent
due to handling losses.
Grade Weight Farmers Selling Price Market Market Price
A Grade 90 gms and Above ` 100/kg Exports ` 150-200/kg
B Grade 60-90 gms ` 65/kg Domestic ` 100-125/kg
C Grade 50-60 gms ` 50/kg Local ` 75-100/kg
D Grade 40-50 gms ` 35/kg Processing
Farmers
At farm gate
Contractor/
Aggregator
Markets in
Guwahati/Silchar/Kolkata/
Delhi
Export
Figure 77: Marketing Channel of Kiwi Fruit in Arunachal Pradesh
Particular Amount (in `) Price Markup (` Per kg) % Contribution
Average Selling of Farmers 65.00 65.00 52.11%
Aggregator charges (15-20%) 13.00 78.00 10.42%
Transport to Main Market including
loading and unloading
2.00 80.00 1.60%
Cost of wastage (8-10% till Main Market) 8.00 88.00 6.41%
Wholesaler's/Retailer's margin (30-35%) 30.80 118.80 24.69%
Cost of wastage (3-5%) 5.94 124.74 4.76%
Source: ISAP analysis from various stakeholders’ interaction
Table 55: Price Build-up of Kiwi (per kg) from Farm Gate to Consumers in Itanagar
92 Value Chain Analysis of Select Crops in North Eastern States
Large Cardamom
Large cardamom is a perennial herbaceous plant with subterranean rhizomes that give rise
to leafy shoot and panicles. It is believed to be the native crop of Sikkim. The cardamom
capsules are categorised as high value spice crops in the country and have multiple
domestic uses. India is the largest producer of large cardamom with almost 54 percent
share in world production and out of this Sikkim contributes up to 88 percent of India’s
production.
Large cardamom grows well under the shade of forest trees at altitudes ranging from
1000-2000 metres with rainfall ranging from 3000-3500 mm per annum.
Sikkim
Large cardamom is the main cash crop of Sikkim, being cultivated in an area of 15,020 ha
(Directorate of Horticulture, 2010-11) in all the four districts of the state. Two major producing
clusters are North and East Sikkim.
Production Practices™™
There are five popular cultivars being grown in Sikkim i.e, Ramsey, Sawney, Golsey, Varlangey
and Seremna. The propagation of large cardamom is through seeds and suckers. Seeds
are generally sown in September-October.
However, the existing cardamom orchards in the state are very old thus affecting the yield
of the capsules. Viral diseases such as chirkey and foorkey are very common in the old
plantations which destroy large number of fields in the region and cause heavy losses to the
farmers.
The State Horticulture Department is preparing tissue cultured plants to
be supplied to the farmers. These plants would be resistant to viral and bacterial
diseases.
The fully grown cardamom plantations require 150-200 mandays per ha for various farm
operations such as intercultural operations and harvesting.
Post Harvest Practices:™™
Harvesting:ƒƒ The yield of the plants is approximately 1.5 to 2.5 MT per ha.
Value Addition at Farm level.ƒƒ
Marketing  Logistics.ƒƒ
The main marketing channel being followed by the farmers is as follows:
Farmers ----- Aggregators ------- Wholesalers ------- Retailers ------- Consumers1.	
Farmers ------ Contractors ------- Wholesalers ------- Retailers ------- Consumers2.	
Farmers ------- Bidders ------ Wholesalers ------ Retailers ------- Consumers3.	
The losses in the field vary from 5 to 10 percent which may go up to 80 percent in case of
viral diseases.
93Chapter 5 | Value Chain Analysis
Average selling price of the farmer ranges from 550-900
depending upon the marketing channel. NERAMAC
provides a platform for farmers and bidders from
time to time. NERAMAC has an auction centre and
warehouse at Rong-Po. Warehouse service is free of
cost for farmers. There is direct interaction between
farmers and traders and farmers have the option not to
sell even to the highest bidder and keep their produce
in the warehouse for next auction. During the auction,
good quality cardamom fetches ` 800-900 per kg to the
farmers.
Vegetables
In the North Eastern Region, vegetables are grown mainly in three seasons – rabi, kharif
and off season. The vegetables produced in the hills during the summer months of March
to June when the production is less in the plains, constitute the off season vegetables.
These vegetables are supplied to the plains and fetch good prices. The NE states of Assam,
Meghalaya have a huge potential to supply off season vegetables.
Farmers
` 1-3/Kg
At farm gate
Contractor/
Bidder
Aggregator
Markets in
Silliguri/Kolkata/
Delhi/Mumbai
Markets in
Silliguri/Gangtok
Figure 78: Marketing Channel of Large Cardamom in Sikkim
Particulars Amount (in `) Price Markup (` Per Piece) % Contribution
Farm gate price 600.00 600.00 60%
Aggregator Margin @10% 60.00 660.00 6%
Transportation 2.00 662.00 0%
wastage@1% 6.62 668.62 1%
Wholesaler (@20%) 133.72 802.34 13%
Retailer (25%) 200.59 1002.93 20%
Source: ISAP analysis from various stakeholders’ interaction
Table 56: Price Build-up of Large Cardamom from Farm Gate to Siliguri Market (per kg)
Farmer Interaction with NERAMAC
94 Value Chain Analysis of Select Crops in North Eastern States
Assam
In Assam, the major vegetables cultivated are cabbage, cauliflower, knol-khol, tomato, brinjal,
potato, pea, carrot, French bean, cucumber, okra, ridge gourd, cowpea, sponge gourd, spine
gourd, pointed gourd and bottle gourd. The four districts of Kamrup, Nalbari, Darrang and
Morigaon are the major vegetable clusters in the state.
Sl. No. Name of Vegetables Popular Varieties
Primary (Major)
1 Potato 1. Kufri Chandra Mukhi
2. Kufri Jyoti
3. Kufri Sindhuri
2 Cabbage Early maturity :
Golden Acre1.	
Pride of India2.	
Pusa Mukta (Sel-8)3.	
Late maturity :
Drum Head1.	
Eclipse Drum Head2.	
3 Cauliflower Early:
Early kunwari1.	
Pusa katki2.	
Pusa Deepali3.	
Mid :
Improved Japanese1.	
Pusa Synthetic2.	
Pusa Snowball3.	
Main Crop Patna4.	
Late :
Snowball-161.	
Pusa Snowball2.	
K-13.	
Hissar 14.	
4 Radish Early :
Pusa Deshi1.	
Pusa Chetki2.	
Pusa Himani3.	
Late :
Japanese White1.	
Jaunpuri2.	
Bombay Red3.	
5 Carrot Nantes1.	
Pusa Kesar2.	
Chantenay3.	
6 Peas T-1361.	
Table 57: Popular Varieties of Vegetables Cultivated in Assam
95Chapter 5 | Value Chain Analysis
Sl. No. Name of Vegetables Popular Varieties
7 French Beans Pusa Parvaty1.	
Contender2.	
UPF-2033.	
UPF-1914.	
8 Tomato Punjab Chhuhara1.	
S-122.	
Punjab Kesri3.	
Pusa Early Dwarf4.	
Sioux5.	
Pusa Ruby6.	
VC-48-17.	
Arka Abha (BWR-1)8.	
Arka Alok (BWR-5)9.	
BT-110.	
Bilahi-111.	
Bilahi-212.	
9 Ash Gourd 	Selected local varieties
10 Lettuce Great Lakes1.	
Chinese Yellow2.	
Slow Bolt3.	
Secondary (Minor)
11 Capsicum (Green) California Wonder1.	
Elephant Trunkm2.	
Arka Mohini3.	
Arka Gaurav4.	
Selection 165.	
12 Broccoli Early :
Early Danish Giant1.	
De Cicco Green Bud2.	
Sparton Ealy3.	
Coastal4.	
Atlantic5.	
Mid :
Green sprouting medium1.	
Late:
Waltham 291.	
Green Mountain2.	
Coastal3.	
Atlantic4.	
Hybrid :
Southern Comet1.	
Premium Crop2.	
Clipper3.	
Laser (extra early and early)4.	
13 Coriander Bold seeded :
UD 211.	
GAUI2.	
CSI3.	
CIMPO 334.	
Small seeded :
UP 411.	
Pusa 3602.	
Local selection3.
96 Value Chain Analysis of Select Crops in North Eastern States
Sl. No. Name of Vegetables Popular Varieties
14 Pumpkin Arka Suryamukhi1.	
Arka Chandan2.	
Selected Local cultivar3.	
15 Cucumber Chinese Green1.	
Pusa Sanyog2.	
Poinsette3.	
AAUC-14.	
AAUC-25.	
AAUC-36.	
AAUC-47.	
16 Knol Khol Early maturity:
White Vienna1.	
Late maturity :
Purple Vienna1.	
17 Brinjal Long:
Cluster1.	
Borbengena2.	
JC-13.	
Kuchia4.	
BWR-345.	
Pusa Kranti6.	
Pusa Purple Long7.	
Pusa Purple8.	
Round :
Pusa Purple Round1.	
Pusa Vairab2.	
JC-23.	
BWR-124.	
Oblong :
BB-71.	
Pant Samrat2.	
18 Ladies Finger Pusa Sawani1.	
Arka Anamika2.	
Parbhdani Kranti3.	
Red Wonder (Hill Zone)4.	
Panchasira (North Brahmaputra Valley Zone)5.	
19 Bottle Gourd Pusa Summer Prolific1.	
Pusa Summer Prolific Round2.	
Pusa Meghdoot3.	
Pusa Manjiri4.	
Keyari Lsao5.	
20 Onion (Green Leaf) Pusa Red1.	
Pusa Ratnar2.	
Pusa White (Round)3.	
Pusa White (Flat)4.	
N-535.	
Agrifound Light Red6.	
Punjab Red Round7.	
Pusa Madhuri8.	
Arka Niketan9.
97Chapter 5 | Value Chain Analysis
Sl. No. Name of Vegetables Popular Varieties
24 Bitter Gourd For spring season :
Earliest of All1.	
Long Green2.	
Extra Long3.	
Pusa Do Mausmi4.	
For summer season :
Monsoon Monarch1.	
Long Green Monsoon2.	
Coimbatore Long3.	
25 Ridge Gourd Pusa Nasdar1.	
AAUJ-12.	
AAUJ-23.	
AAUJ-34.	
Source: Discussion with stakeholders, KVKs, District Agriculture Offices
Farmers in most of the vegetable production clusters around Guwahati use hybrid/HYV
seeds and also use other inputs for increasing yield and production. However, the production
practices for vegetable are non-scientific and therefore there is a huge scope for intensification
of vegetable production.
Table 58: Cost of Production of Selected Vegetables in Assam
Cost of Production of Selected Vegetable Crops (in `) Total cost
Sl.
No.
Crop
Name
Seed Cost Pesticide
Cost
Fertilizer
Cost
Irrigation
Cost
Labour
Cost
(During
Season)
Any Other
Cost
1 Ash Gourd 4500 900 5328 2000 3000 1000 16728
2 Brinjal 4800 3750 3300 2000 3000 1000 17850
3 Cabbage 10000 3750 5000 2000 2500 1000 24250
4 Carrot 500 500 2000 2500 3000 1000 9500
5 Cauliflower 10000 3750 5000 2000 2500 1000 24250
6 Cowpea 5000 400 2432 2000 3000 1000 13832
7 Cucumber 3000 2000 3000 3500 2000 1000 14500
8 French-
bean
8400 0 15000 1200 6000 2000 32600
9 Knol –Khol 1500 1500 4220 2000 3000 1000 13220
10 Okra 4500 3000 15000 2500 2000 1000 28000
11 Potato 25000 2500 5270 2000 3000 1000 38770
12 Pumpkin 10000 3500 4000 3000 3000 2000 25500
13 Radish 3000 1000 4800 2000 3000 1000 14800
14 Ridge
Gourd
10000 4500 2295 2000 3000 1000 22795
15 Tomato 20000 1000 7000 2000 3000 1000 34000
Source: Primary Survey by ISAP
98 Value Chain Analysis of Select Crops in North Eastern States
The per ha cost of production of potato is highest followed by tomato, French beans and
okra. The farmers use hybrid seeds for sowing, thus the cost of seed is one of the major
component. The other major cost in vegetable production is fertiliser cost. It is important to
note that the cost of irrigation is minimal in total production cost due to rain-fed cultivation of
vegetables. Looking at the cost of production of per kg vegetable, production cost of cowpea
(` 4.60 per kg) is highest, followed by French bean (` 3.84 per kg), potato (` 3.23 per kg) and
cauliflower (` 2.85 per kg).
Figure 79: Estimated per ha Cost of Production of Vegetables (in `)
0
5000
10000
15000
20000
25000
30000
35000
40000
45000
AshGourd
Brinjal
Cabbage
Carrot
Cauliflower
Cowpea
Cucumber
Frenchbean
KnolKhol
Okra
Potato
Pumpkin
Radish
RidgeGourd
Tomato
Cost of Production Seed Cost Cost of Production Pesticide Cost
Cost of Production Fertilizer cost Cost of Production Irrigation cost
Cost of Production Labour Cost (during season) Cost of Production Any other cost
Source: ISAP analysis of primary survey
Figure 80: Estimated per kg Cost of Production for Select Vegetables (`/kg)
0.67
2.83
2.61
2.71
2.85
4.61
0.62
3.84
0.71
2.77
3.23
0.85
1.74
1.90
2.43
0
1
2
3
4
5
Cost of production (`/kg)
AshGourd
Brinjal
Cabbage
Carrot
Cauliflower
Cowpea
Cucumber
Frenchbean
KnolKhol
Okra
Potato
Pumpkin
Radish
RidgeGourd
Tomato
Source: ISAP analysis of primary survey
99Chapter 5 | Value Chain Analysis
Farmers harvest the vegetables in the evening of the first day so that they can reach the market
early morning the next day. Farmers either sell their products to local consolidators or take it
to the nearest market. In case farmers are taking their products to the market, transportation
cost is being paid by the farmers themselves. Mostly vegetables are packed in gunny bags
(jute and plastic bags, empty bags of cement, fertiliser, wheat, sugar etc.) and in baskets.
Bags are chosen for relatively longer distance and baskets for local selling of products.
Farmers carry their vegetables to the markets in bullock carts, autos, small trucks and
matadors etc. Means of transport depends on distance and quantity of vegetables to be
carried to the market. Farmers also hire transport vehicles on sharing basis, specifically in
production areas such as Kharupetia.
There are various channels by which vegetables are being brought from farm gate to the
markets in Guwahati. Some of these channels, as identified during the primary survey are
described as below:
Farmers – Consumers1.	
Farmers – Commission Agents - Wholesalers (Machkhowa market) – Retailers -2.	
Consumers
Farmers – Aggregators/consolidators/local traders – Commission Agents - Wholesalers3.	
(Machkhowa market) – Retailers - Consumers
Farmers – Aggregators/consolidators/local traders – Wholesalers at Transit markets –4.	
Commission Agents (Machkhowa market) – Wholesalers (Machkhowa market) –
Retailers - Consumers
Channels 2  3 contribute approximately 80-85% of total vegetables’ arrival in the
Machkhowa market of Guwahati. Almost 95% of the total vegetables that arrive in Guwahati,
comes through organised channel of consolidating, wholesaling and retailing and only 5%
of vegetables are being brought directly by the farmers. Though the distances of production
centre and market is not much, there are multiple players involved in the supply chain and
that adds to the cost of vegetables to consumers.
Cost components in the supply chain, at the market level, includes margin of local
consolidators:
Market fee at primary market level™™
Margin of wholesaler in primary market/commission of commission agent at primary™™
market
Transportation cost to secondary market™™
Market fee at secondary market level™™
Commission of commission agents™™
Margin of wholesalers™™
Local transportation cost for transporting it to retail store™™
Margin of retailers™™
Wastage at various levels™™
100 Value Chain Analysis of Select Crops in North Eastern States
Table 59: Price Build-up for Vegetables from Farm Gate to Consumers
Particular Amount
(in `)
Price Markup
(in `)
% Contribution
Average selling price of farmers 7.00 7.00 29.9%
Packaging cost 0.50 7.50 2.1%
Local transportation to primary market 0.60 8.10 2.6%
Cost of wastage (@ 6% till primary market) 0.49 8.59 2.1%
Mandi fee at primary market (@1%) 0.09 8.67 0.4%
Margin of consolidators/aggregators 0.25 8.92 1.1%
Labour cost for material handling 0.10 9.02 0.4%
Transportation from Primary market to Guwahati 0.60 9.62 2.6%
Margin of CA/wholesaler of primary market (@ 25%) 2.41 12.03 10.3%
Commission charges from Sellers (@ 5%) 0.60 12.63 2.6%
Commission charges from Buyers (@ ` 13 per kg) 0.13 12.75 0.5%
Cost of wastage (@ 10%) 1.28 14.03 5.5%
Wholesaler's margin (@15%) 1.91 15.94 8.2%
Transportation cost 0.60 16.54 2.6%
Cost of wastage (@ 7% till Retail) 1.16 17.70 5.0%
Packaging cost (plastic retail pack) 1.00 18.70 4.3%
Retailer's Margin (@25%) 4.68 23.38 20.0%
Source: ISAP analysis of primary survey
Cost build-up from farm gate to wholesale market: Average price spread from farm gate
to retail market worked out to be ` 7.00 per kg to ` 23.40 per kg of vegetables on an average
in the region. Farmers get only about 30% share of the consumer price in Guwahati. The
margins of wholesalers and retailers depend on the produce, perishability, season, demand
and supply factors. In case of wholesalers, the margin varies from 15-25% and in case of
retailers from 25-35%.
101Chapter 5 | Value Chain Analysis
Figure 81: Average Price Markup in the Supply Chain of Major Vegetables to Guwahati
29.9%
2.1%
2.6%
2.1%
0.4%
1.1%
0.4%
2.6%
10.3%
2.6%
0.5%
5.5%
8.2%
2.6%
5.0%
4.3%
20.0%
0.0%
5.0%
10.0%
15.0%
20.0%
25.0%
30.0%
35.0%
-
5.00
10.00
15.00
20.00
25.00
%Contribution
Amountin`
Price Mark-up % Contribution
Averagesellingpriceoffarmers
Packagingcost
Localtransportationtoprimarymarket
Costofwastage(@6%tillprimarymarket
Mandifeeatprimarymarket(@1%)
Marginofconsolidators/aggregators
Labourcostformaterialhandling
TransportationfromPrimarymarkettoGuwahati
MarginofCA/wholesalerofprimarymarket(@25%)
CommissionchargesfromSellers(@5%)
CommissionchargesfromBuyers(@`13perkg)
Costofwastage(@10%)
Wholesaler’smargin(@15%)
Transportationcost
Costofwastage(@7%tillRetail)
Packagingcost(plasticretailpack)
Retailer’sMargin(@25%)
Source: ISAP analysis of primary survey
Level of wastages for major vegetable products at field level (post-harvest), wholesale level
and till it reaches the consumers has been depicted in Table 60.
Range of wastage is 4-10% at farmers’ level, 2-15% at wholesale level and 2-10% at the
retail level. The quantum of wastage for different products also depends on the nature of
product.
Wastages in whole supply chain of vegetables for Guwahati vary from 9% for some crops to
as high as over 32% for crops like pea.
102 Value Chain Analysis of Select Crops in North Eastern States
Estimated Wastages of Vegetables in Supply Chain
Vegetable Name Farmers Level Wholesale Level Retail Level
Knol-Khol 5% 5% 5%
Potato 5% 2% 2%
Radish 5% 5% 5%
Ridge Gourd 5% 5% 5%
Cow Pea 5% 5% 5%
Bhindi 5% 5% 5%
Ash Gourd 5% 5% 5%
Cucumber 10% 5% 5%
Cabbage 10% 8% 8%
Cauliflower 10% 10% 10%
Tomato 7% 5% 4%
Carrot 6% 2% 2%
Brinjal 5% 6% 6%
Spine gourd 5% 6% 6%
French-bean 5% 7% 7%
Onion 15% 5%
Chilli 5% 15% 5%
Pointed gourd 5% 15% 7%
Sweet gourd 5% 15% 7%
Pea 10% 15% 7%
Pumpkin 5% 15% 5%
Bitter gourd 5% 15% 5%
Bottle gourd 4% 15% 5%
Garlic 7% 15% 5%
Ginger 5% 15% 5%
Capsicum 5% 15% 8%
Source: Primary survey of farmers, wholesalers and retailers by ISAP
Table 60: Estimated Wastages of Vegetables in Supply Chain
Figure 82: Estimated Percentage Wastage of Vegetables in Supply Chain for Guwahati
0%
5%
10%
15%
20%
25%
30%
35%
KnolKhol
Potato
Radish
RidgeGourd
CowPea
Bhindi
AshGourd
Cucumber
Cabbage
Cauliflower
Tomato
Carrot
Brinjal
Spinegourd
French-bean
Onion
Chilli
Pointedgourd
Sweetgourd
Pea
Pumpkin
Bittergourd
Bottlegourd
Garlic
Ginger
Capsicum
Farmers level Wholesale level Retail level
Source: Primary survey of farmers, wholesalers and retailers by ISAP
103Chapter 5 | Value Chain Analysis
Issues Related to Vegetable Marketing
Vegetable marketing in the Kamrup region is not organised due to lack of adequate
infrastructure and basic facilities. Farmers don’t have any alternate channel than to sell
the fresh produce through intermediaries. Two major and adjacent wholesale-cum-retail
markets, Machkhowa and Fancy Bazaar have the following situation and concerns:
Machkhowa Market:1.	 Located 9 kms from the National Highway and 3 kms from the
railway station, it is the largest vegetable market in the region but it doesn’t have the
basic facilities to handle the produce and quality management. Market is in an open
area, operates in a congested area and unhygienic conditions and there is no shed for
protection from sun and rain. This market is under the administration of Guwahati
Municipal Corporation (GMC).
Fancy Bazaar Vegetable Market:2.	 One of the oldest fresh produce markets in Kamrup
it is less than 500 mts. from Machkhowa market and 9 kms from NH-37 and 2 kms
from Guwahati railway station. Fancy Bazaar also deals in other commodities such
as fruits, betel nut and flowers etc. It is also under the administration of GMC and
traders pay the rent.
Both of the markets are lacking the following basic infrastructure, which is required for fresh
fruits and vegetable market:
Cold store™™
Sorting/grading machines™™
Auction platforms™™
Electronic display™™
Weigh bridges™™
Garbage disposal system™™
Water and sewerage system, etc.™™
Other vegetable markets in Guwahati city are Paltan Bazaar, Ganeshguri Subzi Bazaar and
Basistha Chariali vegetable market. All of these markets are lacking basic infrastructure.
Rural3.	 Haats and Mandis: At block level, small towns and rural markets, vegetable
mandis and haats are operational. Most of the vegetable markets at block and village
level are under gram panchayats or are private. Rural markets are very much preferred
by the farmers due to proximity to production cluster, less transportation cost and
absence of trader’s cartel. Rural markets also lack infrastructure such as covered
sheds, platforms, plastic crates, sorting/grading machines etc., which are imperative
to handle fresh produce.
Meghalaya
East Khasi hills are the major vegetable production cluster identified in Meghalaya. The
major vegetables cultivated in this region are potato, cabbage, cauliflower, radish, carrot,
peas, French beans, tomato, squash, lettuce and mustard (leaf). However, apart from these,
farmers cultivate other minor vegetables such as capsicum, broccoli, coriander, beet root,
pumpkin, cucumber, turnip, knol khol, brinjal, okra, onion (green) bitter gourd, bottle gourd
and ridge gourd. The protected cultivation of the following crops is undertaken: capsicum,
tomato, broccoli, pea, cucumber and mustard leaves.
104 Value Chain Analysis of Select Crops in North Eastern States
The agro-climatic conditions in the region favour the cultivation of vegetables round the year.
During the summer season, when no vegetable is produced in the neighbouring states of
Assam, Nagaland, Tripura, Mizoram and Manipur, the produce from Meghalaya is regularly
sent to these markets as off season vegetables and fetch good prices.
Crop-wise, per ha cost of production has been observed to be highest in case of potato
(` 41,500 per ha) due to higher seed cost, followed by tomato (` 39,700 per ha), beans
(` 36,900 per ha), cauliflower (` 35,700 per ha), cabbage (` 32,200 per ha), pea (` 31,000 per ha),
carrot (` 29,900) and radish (` 24,800 per ha). Contribution of hybrid seeds to the cost of
cultivation is observed to be maximum in all the crops except for tomato and beans in which
pesticide cost is found to be maximum. Due to rain-fed vegetable cultivation, irrigation cost
is observed to be minimum.
Sl. No. Name of Vegetables Popular Varieties
Primary (Major)
1 Potato Kufri Jyoti, Kufri Megha, Giri Raj
2 Cabbage Mahyco 139, Sultan, NS25, 10-15% O.P.V.
3 Cauliflower Snow Ball (hybrids less than 20%), O.P.V.
4 Radish 100% O.P.V.
5 Carrot Kuroda (US Agri), New Kuroda (NunHems), 15-20% O.P.V.
6 Peas Sultan, Azad, 40% O.P.V.
7 French Beans Sultan, Selection 9, Anupam, 20-30% O.P.V.
8 Tomato Avinash, 017, NS52 (Namdhari)
9 Squash 100% O.P.V.
10 Lettuce ICE Berg, General, 50% O.P.V.
11 Mustard (Leaf) 100% O.P.V.
Secondary (Minor)
12 Capsicum (Green) California Wonder
13 Broccoli Pushpa  Aishwarya
14 Coriander Italian Beauty, US Agri, Namdhari
15 Beet Root Ruby Queen
16 Pumpkin 100% O.P.V.
17 Cucumber Malini, 50% O.P.V.
18 Turnip 100% O.P.V.
19 Knol Khol Purple Top, Early White Viena (100% Hybrid)
20 Brinjal Puple Long, 50% O.P.V.
21 Ladies Finger 100% O.P.V.
22 Bottle Gourd 100% O.P.V.
23 Onion (Green Leaf) N53, Pusa Nashik Red
24 Bitter Gourd 70% O.P.V.  30% Hybrid
25 Ridge Gourd 100% O.P.V.
Source: Discussion with stakeholders, KVKs, District Agriculture Offices
Table 61: Popular Varieties of Vegetables in Meghalaya
105Chapter 5 | Value Chain Analysis
Mostly traditional practices are
followed for post-harvest handling
of vegetables and only washing is
carried out by few farmers in case
of potato, radish. Few farmers
also revealed adoption of sorting
activity in case of potato, cabbage,
cauliflower, tomato. The farmers
generally harvest the produce in the
evening of the previous day to be
taken to the market the next day.
After harvesting, the vegetables are
kept in gunny/jute bags (potato/
radish) and bamboo baskets
(cabbage, cauliflower, tomato,
French beans etc. ), which are carried
to the market the next day. There are no separate storage facilities for vegetables at the
field level.
The movement of produce to urban markets is through bus/mini trucks/jeeps in the region.
The head loads are carried to a distance of 1-5 kilometres on an average, to reach the rural
market or a point from where motor transport is available for transporting the produce to
Shillong markets. Farmers travel upto 50-60 kms to Shillong to dispose off their produce. The
cost of transportation varies for:
Tata 407/truck™™ ` 0.50 to ` 1 per kg.
Bus:™™ ` 1 to ` 1.20 per kg.
Figure 83: Estimated per ha Cost of Production of Vegetables in Meghalaya
0
5000
10000
15000
20000
25000
30000
35000
40000
45000
Potato Cabbage Tomato Beans Carrot Pea Cauliflower Radish
Seed Cost Pesticides Cost Fertilizer Cost Irrigation Cost Labour Cost Total Cost
Source: Primary survey of farmers by ISAP
Vegetable Market in Meghalaya
106 Value Chain Analysis of Select Crops in North Eastern States
The packaging of the vegetable crops at the farm level is conventional and suffers from
quality deterioration and transit loss. Mostly vegetables are packed in gunny/jute bags
(potato/radish) and bamboo baskets (cabbage, cauliflower, tomato, French beans etc.) for
transporting to the market. The cost of packaging varies for:
Gunny bag -™™ ` 20-30 per bag, jute bag
Jute bag -™™ ` 10-20 per bag
Bamboo basket -™™ ` 40-60 per basket.
Average post-harvest loss at the farm gate is estimated around 5%. Farmers revealed
higher post-harvest losses in case of tomato, beans, leafy vegetables, brinjal, carrot and
gourds.
Transportation of their produce to the nearest urban markets for sale at remunerative prices
is a major problem faced by farmers. Harvested vegetables are transported to markets
either manually, by bus or autos as per convenience and distance. The following marketing
channels are followed by the farmers:
Farmers – Consumers:1.	 Most of the farmers prefer to sell their produce in the rural
market (held periodically) or nearest urban market which are largely unorganised
directly to consumers or agents of traders. The farmers also feel convenient to dispose
off their produce at the village as it saves their time and energy in transporting the
produce to the urban markets.
Farmers – Village level aggregators (agents/big farmers/SHG/farmer Club/producer2.	
organisation) or Agents of traders – Consumers: It is also observed that a large
number of farmers sell their vegetable produce to the village level aggregators or
agents of the traders who collect it either from their conventional storage at home or
from the field and sell produce to consumers.
Farmers – Wholesalers – Retailers – Consumers:3.	 Farmers of nearby production
clusters visit the nearest market and sell their produce to the wholesaler who offers
maximum price for it. Wholesaler in turn sells the produce to retailers as well as
consumers.
Farmers – Agents/Traders/wholesalers (from Assam, Tripura, Mizoram, Manipur,4.	
Nagaland) – Traders at respective local markets – Wholesalers – Retailers –
Consumers: It has also been found agents of traders from nearby states (Assam,
Tripura, Mizoram, Manipur and Nagaland) procure the vegetables at the village.
The farmers sell their produce to the available channels in the village (farm gate) at
comparatively lower prices than the urban markets in order to avoid the problems of
transport. Secondly, in case of urban market, trading cost of transportation is higher and
the farmer is more dependent on the wholesaler. Wholesalers adopt unfair trade practices
in the procurement and raise issues on quality to pay less to the farmers. Thirdly, in few
cases, the wholesalers/traders purchase vegetable produce against the money advanced to
the farmer for operations. Under such circumstances, the farmer is at a disadvantage as he
has to compromise for the lower pre-harvest price and adjust more volume of the produce
towards the interest of the debt availed.
107Chapter 5 | Value Chain Analysis
Post-harvest losses of fresh vegetables in the region at wholesalers’ level are estimated
to range from 3% for peas to 15% in tomato crop, with an overall average loss of 8% at
wholesaler’s level. Losses at the retail levels are estimated to be 4% in the region, as volumes
handled by retailers are small for day to day consumer demand. Majority of this wastage is
due to sorting and daily surplus, which needs to be discarded at the end of day.
Conclusion
The above discussed value chains are truncated value chains.™™
Around 20–30% of the produce gets wasted at field level.™™
Entire produce is not sold at market level.™™
Due to low volume, farmers sell directly to consumers also at village level or at nearby™™
markets.
Marketing and post-harvest infrastructure is yet to be scaled-up to improve the overall™™
value chain.
Existing markets are not very supportive to the farmers due to traditional system of™™
procurement.
Markets are found to be lacking in basic facilities.™™
In most of the states either there is no regulated market or most of the trade is being™™
practiced in non-regulated/traditional markets.
Benchmarking with Existing Best Practices
C hap t e r
6
To improve the cultivation practices, technological interventions, supply chain and marketing,
it is essential to map out the best practices in the region and disseminate the same in
identified clusters. There are locations in the North East itself which have success stories
of higher production, better marketing linkages and good income from the venture. These
success stories would be helpful to improve the value chain of potential horticulture in the
clusters as well as in other production areas. Benchmarking study of the identified crops is
as below:
Pineapple
Productivity of pineapple in the identified states for study
State Productivity (MT/ha)
Arunachal Pradesh 5.7
Assam 15.8
Meghalaya 8.9
Nagaland 15.5
Tripura 22.6
Source: NHB and State Horticulture Departments
From the productivity point of view, Tripura, Assam and Nagaland are the top three
states. Average farm gate prices are also lesser in Tripura (` 7), Assam (` 10) and Nagaland
(` 8) than Arunachal Pradesh (` 15) and Meghalaya (` 15). For a pineapple of 1-1.5 kg, ` 8 is
modal price for the farmers. When the farm gate price goes down below ` 8, it creates stress
among the farmers.
Molvom in Dimapur (Nagaland) will be an ideal village for benchmarking study. Average yield
is 30-35 MT per hectare. Farmers have started applying improved production technologies
after training from Horticulture Department and Central Institute of Horticulture (CIH). Cost
of production is low due to group farming where farmers work in one another’s field and
they don’t have to pay for labour.
Farmers havegoodincomefrompineapplefields dueto direct linkages withtraders. Guwahati
is the nearest main market for the pineapple produced in Molvom. Traders from Guwahati
contacts directly to the farmers groups and visit the farms for procurement and transports
the produce to Guwahati. Most of the crop is sold at farm gate only so farmers don’t have
any burden of loading, packaging, transportation and logistics etc. Farmers’ group use the
collection centre constructed in the village when there is big order either from Guwahati
traders or when they have to supply to Delhi, Bangalore etc. Harvesting of pineapple is done
at different stages of green colour based on the distance of markets and farm gate. Farmers
in Molvom are well aware about the harvesting stages.
110 Value Chain Analysis of Select Crops in North Eastern States
Packing of pineapple is done at farm gate level for distant markets. Labour charges
are provided by the traders to the farmers. Pineapples are wrapped in paper and kept
the crown downside in CFBs which reduces the chance of damage due to jerk during
transportation. It is carried in open, only by keeping crown downside, in mini trucks to
Guwahati.
Thus, the Molvom village model can be implemented to other pineapple farming clusters in
North East for better marketing linkages and to improve the overall value chain.
Guwahati can be identified as focus market for the pineapple produced in Nagaland and in
nearby districts in Assam (Kamrup and Karbi Anglong) and Silchar for the pineapple produced
in Tripura and North Cachar Hills and Cachar districts of Assam. Products can be moved
easily to other parts of country from Assam due to better connectivity.
Mandarin
Productivity of mandarin in the identified states for study
State Productivity (MT/ha)
Arunachal Pradesh 4.3
Assam 10.59
Manipur 5.89
Meghalaya 3.99
Mizoram 3.2
Sikkim 1.73
Tripura 7.03
Source: NHB and State Horticulture Departments
Assam, Tripura and Manipur have higher productivity of Khasi mandarin. In Assam it is
10.59 MT/ha. Farmers in Kamrup (rural) district, especially in Boko sub-division are reaping
the profit from mandarin orchards. Although most of the orchards are very old, however,
due to appropriate plant management practices, they are getting a satisfactory yield of
7-8 MT/ha. Traders from Guwahati approach them directly and procure produce from the
farm gate. During the time of peak demand in major markets, these farmers are able to get
a farm gate price as high as ` 5 per piece. The connectivity from Boko to Guwahati is also
good which provides an extra edge as the produce can be taken to the market quickly. The
Govt. has provided a small pack house for common use so that some farmers can sell fruits
of different grades to the traders at good rates instead of selling the whole orchard as per
pre-decided low rates.
Khasi mandarin produced in Tinsukia, which is better known as Tinsukia variety, is of
good quality. Area under mandarin was reduced in past due to diversification towards tea
cultivation but due to Agriculture Department’s intervention and assistance under NHB
Scheme for rejuvenation, it has started resuming and now farmers are benefitting from it.
Farmers are being trained by KVK and Agriculture Department for application of protection
chemicals, nutrients and weed management. They have been given training on ‘Prophylactic
Rejuvenation’ also which prevents the shoot borer attack. Tinsukia mandarin is in demand
in the major markets in Assam. Now farmers are getting 25,000-50,000 oranges per ha of
orange orchard. Mandarin reaches directly from farm gates to the markets in Guwahati,
Dibrugarh, Golaghat and Jorhat etc.
111Chapter 6 | Benchmarking with Existing Best Practices
Farmers in the other North Eastern region can also get the good returns by direct contact
with traders, availability of market at farm gate and by establishing the common facility
centre for sorting and grading.
Ginger
Productivity of ginger in the identified states for study
State Productivity (MT/ha)
Arunachal Pradesh 5.5
Assam 6.88
Manipur 11.57
Meghalaya 5.79
Mizoram 4.92
Nagaland 6.9
Sikkim 5.39
Source: NHB and State Horticulture Departments
Ginger is widely grown spice all over North Eastern Region and supplied to other major
markets in the country. Assam is the largest producer and trader of ginger from NER. Ginger
productivity in Assam is better than other states also. One of the two hill districts of Assam,
Karbi Anglong has set new dimensions in ginger production and trading. A group of more
than 1500 small and marginal tribal farmers are the part of Ginger Growers’ Co-operative
Marketing Federation (Gin-Fed), an initiative of Rashtriya Sam Vikas Yojana. Gin-Fed supplies
directly to Azadpur Mandi, New Delhi. Farmers through middlemen were getting as low as
` 3-4 per kg but Gin-Fed minimised the distress selling and facilitated fair price. Farmer price
ranges from ` 6-35/kg comparable to National mandis. It also arranges the procurement,
primary processing, marketing information, obtaining order and shipment.
Farmers under Gin-Fed have been provided ‘G-card’ who doesn’t sell the produce anywhere
else except Gin-Fed (but they are not bound to sell only to Gin-Fed). G-card assists in credit
facility from public sector banks. Gin-Fed charges only for handling at ` 1.50 per kg and
administrative cost at ` 0.30-1.00 per kg. Whatever extra profit is earned from the business
goes to the shareholders’ (farmers) pocket. Gin-Fed has tie-ups with major traders in India
such as ITC, Sresta Bio Products, NAFED, Stacon, RayFarm and Ace Agro. They are approached
by leading firms in Japan and South Korea for organic ginger export as it has more oil
content. Though ginger is grown in naturally organic condition but Gin-Fed is in the process
of certification of the fields to facilitate direct export to European countries.
Railway has provided one parcel van facility to Gin-Fed to transport directly to New Delhi with
charges as low as 50 paisa per kg. While transporting a 20 MT load by truck, costs ` 4-5 per kg (`
45,000-50,000 transportation cost plus other illegal taxes).
Turmeric
Productivity of turmeric in the identified states for study
State Productivity (MT/ha)
Assam 0.7
Manipur 11.34
Meghalaya 5.06
Mizoram 5.1
Sikkim 5.37
Source: NHB and State Horticulture Departments
112 Value Chain Analysis of Select Crops in North Eastern States
Turmeric is the second major spice crop in NER which is also grown in all eight NE States.
In Mizoram, Mamit District is largest turmeric producer. Area under turmeric is more than
any other spice crop. Reiek village in Reiek block of Mamit (12 km from Aizawl) is famous
for turmeric cultivation. In Reiek, they have ‘Turmeric growing farmers’ society’ which sells
turmeric rhizome to State Horticulture Department and the Department further supplies
the rhizome all over state as seed material to farmers. Farmers generally grow Megha and
Lakadong varieties. Local turmeric rhizome productivity is 10 MT/ha. Turmeric grown here
is organic by nature as farmers don’t use any chemical input. Farmers are very laborious
and cultivate as per training provided by the District Horticulture Department. Farmers in
the Reiek village sell rhizomes, cured ginger and ginger powder as well. Traders from Aizawl
and outside Mizoram visit the village for procurement of spices such as ginger, turmeric
and Bird’s Eye chilli. There is small scale grinding machine where a group of farmers do the
grinding. By forming the growers’ society, farmers of the village have acquired the ability to
negotiate the price with traders. Turmeric rhizome is procured by Horticulture Department
at ` 20-25 per kg, while cured turmeric is sold by the farmers at ` 60-80 per kg and powder
at ` 100-150 per kg.
Traders from Assam (mainly from Cachar and Karimganj) buy from here and sell to markets
in Assam. But more than 50% of produced turmeric is procured by the Horticulture
Department.
C hap t e r
Conclusion  Recommendations
7
The value chain study has been carried out to examine the supply and demand dimensions
of identified FCGs from North East Region, which can be sold in raw or processed form along
with certain specialty crops such as passion fruit, kiwi, naga chilli, large cardamom etc. which
are grown only in this region of the country have considerable domestic and international
market potential which is yet to be exploited.
The value chain study has analysed the stages that these crops pass through, (FCGs) from
production to end-consumer, identify the gaps and devise strategies to overcome these
shortcomings.Ithasalsobeenobservedthattheaverageproductivity,production,technology,
logistics, post-harvest and marketing infrastructure need to be upgraded for identified FCGs
so that the potential of the region can be fully realised.
The major concerns that have emerged of the value chain study are:
Land Tenure and Ownership System
Land ownership and laws are uneven and unclear in the entire NE Region. The entire system
falls under the following three broad categories:
Land owned collectively by the villagers™™
Land owned by the tribal chiefs, who allot land among the individual households for™™
shifting cultivation purposes, and
Individually-owned land.™™
Most of the horticultural crops have elongated conception periods and preliminary cost of
establishment of orchard or plantation is high, which makes it almost impractical for the
small and marginal farmers to go for such propositions without taking long-term credits
from financial institutions such as banks. However, banks do not find it a very encouraging
venture and are not sure about the recovery of loans because of the peculiar land tenure
system, particularly in the tribal belts. Apart from this, the small farmers are not tuned to
the idea of commercial horticulture cultivation and are not familiar with the formalities of
acquiring bank loans.
Poor Cultivation Practices and Low Productivity
Small land holdings, poor investment capacity, general neglect and non-adoption of
scientific cultivation practices are the major constraints for poor return from most of the
horticultural crops in the NE Region and despite the favourable agro-climatic conditions,
the rate of production and growth of all horticultural crops is far below the all India
average.
114 Value Chain Analysis of Select Crops in North Eastern States
In most of the cases, the fruit orchards are very old and senile and the yields are very low.
The high capital cost involved in establishing orchard/plantation and setting up of required
infrastructure is a serious constraint in the expansion of area under fruit crops in the NE
Region. Due to high altitudes, water runoff is rapid and therefore the region lacks water
during the winter season despite having abundant rainfall in summer. Therefore, lack of
irrigation facilities and the absence of water retention practices severely limits possibilities
of multiple cropping, resulting in low land productivity.
In case of vegetables, by planting HYVs which take nearly 3.5 to 4 months from sowing to
harvesting, instead of the traditional crops, which take nearly 5 to 6 months, it is possible
to increase crop intensity without changing the irrigation facilities. However, these crops
require large investments in terms of fertilisers, seeds and pesticides, which poor farmers
(due to the small land holdings) are not able to afford.
Shifting cultivation (jhum) is widely prevalent in NE Region of India. Though the cycle has
now been shortened to 2-3 years because of increased population pressure on land and
decrease in productivity, leading to utilisation of more area under jhuming. This system has
caused large-scale deforestation, soil degradation/erosion (it removes nutrient-rich top soil)
and depletion of resource base.
Poor and Weak Extension System
Despite high potential, difficult terrain with poor connectivity, lack of trained  dedicated
human resources and poor coordination among departments are some of the key factors
responsible for ineffective and poor extension programme in the NE Region as compared to
other states of India where the extension services are very efficient. However, the NE Region
is lagging far behind in this aspect. Due to an inadequacy in the extension support staff and
information dissemination system at the grass root level, farmers remained unaware of the
latest technologies, govt. schemes and programmes pertaining to horticulture cultivation
and promotion.
Poor Logistics and Connectivity
Poor infrastructure in terms of roads and railways are the main constraints in the
development of NE Region. From the trade point of view, existing rail infrastructure is
mainly limited to Assam (broad gauge track). Due to hilly terrain, most of the farmers
transport their saleables on head loads (in case of periodic markets), as the public
transport in the region is expensive and mostly inaccessible from the production zones
or villages. The head loads are carried to a distance of 1-5 kilometres on an average to
reach the primary or rural markets or a point from where the motor transport is available
for transporting the produce to the main markets. The movement of produce to main
(urban) markets is through buses/mini trucks/jeeps that add up transportation costs. The
estimated transportation loss from production zone to distant markets is approximately
15-20 percent and the farmer is able to get the price only for better quality produce.
Transportation of perishable produce is perhaps the most serious constraint in the
development of horticulture in this region.
115Chapter 7 | Conclusion  Recommendations
Poor Marketing and Post-harvest Infrastructure
Due to lack of organised and alternative marketing structure in the region, farmers are getting
low return compared to the other parts of India, whereas the middlemen get the profit at
their expense. Farmers in the existing market are cheated by middlemen (wholesalers/
retailers) and the share (margin) which the farmers should be getting ends up with these
middlemen. Except the organised tea industry, producers of almost all the commodities
including specialised products such as kiwi and passion fruit, face considerable marketing
problems. Due to poor markets and the perishable nature of the products the farmers sell
their produce at a throwaway prices to the middlemen without even getting the opportunity
to display them in the open market. Rural markets are much preferred by the farmers due
to proximity to production cluster, less transportation cost and absence of trader’s cartel.
However, rural markets lack the infrastructure such as covered sheds, platforms, plastic
crates, sorting/grading machines etc., which is crucial to handle fresh produce.
Lack of primary processing, logistics, marketing and post-harvest infrastructure across
various levels of the value chain, are the major factors for quality detoriation and value loss
of the perishable produce in the region. For e.g., in case of pineapple, due to lack of assured
market in NER, about 20-30 percent of the produce gets wasted and during the period of
glut, when abundant produce is being taken to the markets, the farmers are not even able
to recover the logistics cost and are forced to distress sell as they do not have any other
option.
In the absence of plastic crates, farmers use gunny/jute bags, bamboo baskets for packaging
of fresh produce which leads to post-harvest losses due to physical injury to the vegetables.
Also, the shelf life of packaging material is very less and farmers need to spend frequently to
purchase packaging material.
Lack of Processing Industries
For NE Region, the success of growing perishables is closely linked to the success of fruit
processing units. The processing industry can help in sorting out the problem of proper
disposal of perishable commodities. To date, there are hardly any cold storage facilities
available; few processing units exist and those too are not functioning up to the desired
capacity. Use of appropriate pre and post-harvest practices is vital for the success of the
crops and to provide good return to the growers. Unfortunately, this is a major lacuna in the
entire region. Value addition should be given top priority for crops such as pineapple, citrus,
chilli, ginger and turmeric.
From the value chain analysis, it seems that the farmers are getting around 50 percent of
the consumers’ price but in reality they get this price only for the high quality produce which
fetches premium price in the market and the produce which reaches the market; so although
farmers are getting good returns per unit produce, but the actual returns per unit area are
very low. About 20-30 percent of the produce gets wasted at the farm level for which the
farmers get nothing.
116 Value Chain Analysis of Select Crops in North Eastern States
Recommendations
Pineapple
StateProduction
Practices
HarvestingPost-harvestMarketing
Systems
Market
infrastructure
Any
Other
Assam,
Meghalaya,
Tripuraand
Nagaland
Trainingofa.	
farmerstofollow
cleancultivation
practices.By
followingthe
scientificpackage
ofpractices,
theyieldscan
besignificantly
improved.
Farmersneedto
betrainedabout
theeconomic
lifeofthecrop
andtheneedto
replantthecrop
whentheplants
becomeveryold
whichreducesthe
yieldsignificantly.
Trainingcapacityb.	
buildingof
farmersforbetter
fieldmanagement
practicesincluding
diseasepest
management.
Appropriatec.	
application
ofFYMand
vermicompost.
Exposurevisitd.	
offarmersto
progressive
farmers’field
withinoroutside
thestate.
Trainingfarmers’a.	
intimingthe
harvestatthe
appropriate
maturitylevel
andadditionto
goodharvesting
practices.
Identificationb.	
ofcolour
development
toschedulethe
harvestingfor
targetedmarkets
(basedon
distance).
Schedulingofc.	
harvestingasper
marketdemand
byfollowing
thetechnique
ofstaggered
planting.
Promotionofsizea.	
gradingpractices
atfarmlevel.
Farmersandb.	
traderstraining
onpost-harvest
management
especially
handlingduring
loading/unloading,
logisticsand
supplychain.
Keepingthec.	
crowndownside
duringloose
transportationby
vehiclestoavoid
physicaldamage
tothefruit.
Useofscientificallyd.	
developed
packagingmaterial
fordistant
transport.
State-specific
Nagaland:
Exposurevisita.	
offarmersto
Molvomvillage
tobecomeaware
abouthandling
andpackagingof
fruits.
Tradelinkagesa.	
withtradersin
MarketsinAssam
andWB.
Promotinglocalb.	
entrepreneurs
toparticipate
inthetradeof
horticultural
products.
Farmerstrainingc.	
onmarketing,
logisticsandprice
negotiationforthe
marketsinNER.
Networkingwithd.	
theprocessors
intheregion
tosupplythem
directlyfromfarm
gate.
State-specific
Meghalaya:
Formationofa.	
farmersgroup
tosupplyinbulk
toGuwahatiand
Kolkata.
Trainingofa.	
farmersonquality
management,
pricenegotiation
andmarketingtie
ups.
Setupofb.	
collectioncentres
atthefarmgateof
majorproduction
belts.
Settingupc.	
ofpineapple
processingunits
nearmajor
production
clusterstoavoid
wastageduring
glutsothatunsold
fruitscanbeused
forvalueadded
products.
Upgradationd.	
ofexisting
processingunits
andstrong
marketing
linkages.
Developmentofaa.	
modelpineapple
villageforbulk
productionand
supply.
Creationofb.	
entrepreneurship
interestsandskill
development
ofyouthforthe
employmentin
pineappleindustry
fromproduction
tomarketing.
Pineapplefromc.	
theNEregionis
organicbydefault
asthefarmers
donotapplyany
kindofchemicals,
theproducecan
bepositionedas
organicandsold
atapremium.
Scopeexistsford.	
exportingthe
organicpineapple
tovariousother
countries.
117Chapter 7 | Conclusion  Recommendations
StateProduction
Practices
HarvestingPost-harvestMarketing
Systems
Market
infrastructure
Any
Other
State-specific
AssamMeghalaya:
Trainingofthea.	
farmerstoadopt
thetechnique
ofstaggered
planting,asbeing
followedinthe
stateofTripura.
Nagaland:
Farmerstraininga.	
ondoublerow
plantingandavoid
singlerowplanting
whereveritis
noticed.
Avoidtheb.	
productionof
oversizedfruits
whichfetchesa
comparativelylow
price.
Tripura:
Thereisaneeda.	
tosetupformal
tie-upswith
Bangladesh.
Promotionofb.	
Tripurapineapple
asabrandin
horticulture
exhibitionand
tradeshows,pan
Indiabasis.
Nagaland:
Promotionofa.	
marketingin
NewDelhiand
Kolkatamarketas
thereisdirectrail
connectivityfrom
Dimapur.
State-specific
Tripura:
Regularmarketsa.	
shouldbe
organisedforthe
farmerstosellthe
produceinthe
market.
118 Value Chain Analysis of Select Crops in North Eastern States
StatesProduction
Practices
HarvestingPost-harvestMarketing
Systems
Market
infrastructure
Any
Other
Assam,
Manipur,
Meghalaya
andSikkim
Rejuvenationofa.	
oldorchardsby
trainingfarmers.
Promotionofb.	
qualityrootstock
planting.
Optimumandc.	
recommendeduse
ofinputs.
Trainingcapacityd.	
buildingoffarmers
forbetterorchard
management
practicesincluding
diseasepest
management.
Promotionofe.	
biopesticidesand
insecticidesas
thereissignificant
lossduetoinsect
andpest.
Identificationoff.	
fewprogressive
farmerswho
canestablish
smallscaleplant
propagationunits
withgovtsupport
andsupplygood
qualityplanting
material.
Trainingfarmers’a.	
intimingthe
harvestatthe
appropriate
maturitylevel
andadditionto
goodharvesting
practices.
Schedulingofb.	
harvestingasper
marketdemand.
Groupformationc.	
offarmersfor
aggregation
ofproduce
andcollective
marketing.
State-specific
Sikkim:
Harvestingata.	
propertime
targetingthe
distantmarkets
ofSiliguri,Kolkata
andBangladesh.
Promotionofa.	
primarygrading
sortingpracticesat
farmlevel.
Sortinggradingb.	
offruitsaspersize
colour.
Distributionandc.	
promotionof
plasticcrates
insteadofbamboo
baskets.
Establishmentofd.	
collectioncentres
withwaxingfacility
intheproduction
zones.
Establishmente.	
ofsmallcitrus
packhouses
fordispatchto
markets.
Minimumpricea.	
fixationduringthe
timeofglut/peak
production.
Strengtheningb.	
offorward
linkagesby
encouragingretail
chainsfordirect
procurementand
distribution.
Facilitationofc.	
buyers-sellers
meet,before
harvestingseason
toensurequality,
supplyandprice.
Promotinglocald.	
entrepreneurs
toparticipate
inthetradeof
horticultural
productsin
generalandcitrus
inspecific.
State-specific
Manipur:
Promotionofa.	
fruitcollection
nearfarmgate
toaccessdistant
marketsdirectly
fromfield(asof
nowcitrusisnot
goingtomarkets
outofManipur,
althoughthereis
gooddemand).
Betterlogistica.	
infrastructure.
Promotionb.	
throughNERAMAC
outlets.
Establishmentofc.	
govt.promoted
outletsinmajor
fruitsvegetable
markets.
Developingcitrusd.	
collectioncum
packagingcum
waxingcentre
nearproduction
clustersfor
targetingdistant
marketsinstead
ofrestricting
movementof
citrusonlyto
nearbymarkets.
State-specific
Sikkim:
Implementationa.	
ofproposed
packhouse
projectswithout
delay.
Assam:
Thoughcitrusa.	
isgrownin
everydistrict
butmajorityof
productionis
concentratedin
4-5districtsonly.
Productionshould
bepromotedto
otherdistricts
alsowhichhave
suitableclimate.
Manipur:
Thereisneedtoa.	
makeManipur
citruscompetitive
inthemarketand
thatcanbedone
onlybydoingtwo
keythings,
one–byimproving
productivity
ofcitrusand
secondly
byreducing
transportation
cost(which
havebeen
keptartificially
veryhighby
transportersin
Manipurcompare
toanyotherpart
ofthecountry).
Citrus
119Chapter 7 | Conclusion  Recommendations
StatesProduction
Practices
HarvestingPost-harvestMarketing
Systems
Market
infrastructure
Any
Other
Fieldg.	
demonstration
ofintegrated
cultivationpackage
includingnutrient
managementby
extensionworkers
inthefarmers
orchard.
Facilitatingtradeb.	
withtradersfrom
distantmarkets
suchasGuwahati,
Kolkataandfrom
Myanmarby
introductionto
producersand
organisingbuyer-
sellermeets.
Meghalaya:
Formationofa.	
farmers’groups
andtie-upswith
tradersinmarkets
ofShillongand
Guwahati.
Sikkim:
Betterpoliciesa.	
topromote
exporttradewith
Bangladeshand
toplaceproduce
competitively
againstBhutan
Mandarin
price-wise.
Introductionofb.	
awidenumber
offarmerswith
SIMFEDand
NERAMACfor
directselling
andbetterprice
realisation.
Strengthentheb.	
marketingdivision
ofDirectorate
ofHorticulture
andCashCrop
Development
departmentto
improvethe
horticulture
marketingfrom
farmgateto
markets.
Involvinglocalb.	
youthand
entrepreneurs
inbusinessof
horticultural
trade,asoutsiders
havealotof
apprehensionin
doingbusiness
inManipurdue
tolawandorder
situation.
Meghalaya:
Setupoffarmgatea.	
logisticservices
willbehelpfulto
collectthefruits
fromscattered
orchardsasitis
timeconsuming
tocarrythehead
loadsfromfieldto
connectingroad
andthentolocal
marketsandfinally
mainmarkets.
Sikkim:
Formationofmorea.	
farmersgroupsto
availtheexisting
subsidyprovided
bystategovt.
totransportin
Siliguri/Kolkata
markets.
120 Value Chain Analysis of Select Crops in North Eastern States
StateProduction
Practices
HarvestingPostHarvestMarketing
Systems
Market
infrastructure
Any
Other
Assam,
Meghalaya
andSikkim
KVKa.	
recommended
packageof
practicesshould
befollowed
especiallyforseed
rateandnutrient
requirement.
Improvedseedb.	
varietiestobe
used.
Certificationofc.	
purelyorganic
fields.
State-specific
Sikkim:
Selectionofa.	
farmersforseed
distributionshould
notbepolitically
influenced.
Weedb.	
management
shouldbedone
duringthecritical
stages.
Gingershoulda.	
beharvestedas
perrequirement/
targetoffreshand
drygingerand
harvestingshould
notbedelayed.
Propercleaninga.	
andwashing.
Dryinginhygienicb.	
condition.
Trainingonpost-c.	
harvesthandling
andpackaging.
Useofcoldd.	
storeswherever
available.
Interventionofa.	
govt.agencies
isnecessaryto
minimisethe
involvement
ofvarious
stakeholder
bydirect
procurementfrom
farmers/farmers’
groups.
Effortshouldbeb.	
madesothat
farmerscanget
agreaterpieof
profitcompared
tovarious
stakeholders
involvedinginger
trading.
Ensurethec.	
availabilityof
logisticservicesat
farmgatesothat
farmerscancome
directlytomain
markets.
Exposureofd.	
farmerstoGIN-
FEDinKarbi
Anglongfor
improvement
intrading
marketing.
Gingerfarmerse.	
shouldbe
supportedduring
steepfallof
pricebygovt.
Interference.
Indigenousa.	
cleaningand
washingfacilities
attheproduction
clusters.
Co-operativeb.	
modellikeGIN-
FEDshouldbe
implementedin
otherclusters
alsoforbetter
marketing
linkages.
State-specific
Assam:
Alreadya.	
established
integratedginger
packhousein
Kamrupshould
runsmoothly.
Meghalaya:
Efficientutilisationa.	
ofexisting
processingunits.
Settingupofb.	
procurement
centresinthe
clustersduring
harvestingseason.
GIN-FEDmodela.	
shouldbestudied
astheyare
supplyingdirectly
toAzadpurmandi
inNewDelhi.
Promotionofb.	
ginger-based
bakeryproducts
canbedoneby
useoforganic
gingerandthe
productscanbe
soldwithorganic
brandinginmajor
cities.
State-specific
Sikkim:
Gingergrowinga.	
farmerswho
arenotrealising
satisfactoryprofit
fromtheventure
maybetrainedin
floriculturewhich
isverypromising
inSikkimcurrently.
Ginger
121Chapter 7 | Conclusion  Recommendations
StateProduction
Practices
HarvestingPostHarvestMarketing
Systems
Market
infrastructure
Any
Other
Marketinglinkagesf.	
withprocessors
tosupplyforoil
extraction.
State-specific
Meghalaya:
Marketlinkagesa.	
offarmers’group
withtradersin
Shillongand
Guwahatito
realisebetter
shareofconsumer
price.
Betterb.	
procurement
systemby
attachment
withNERAMAC
ProcessingCentre
atRiBhoiand
organisations
tradinginspices
nationwide.
Sikkim:
GIN-FEDlikea.	
modelcanbe
implemented
tointegratethe
production,supply
chain,marketing
tie-upasginger
shares1/4th
of
totalhorticulture
productionin
region.
Sikkim:
Gingerpackhousea.	
builtinBirdang
shouldbeused
efficiently.
Simfedshouldb.	
promotethe
valueadded
gingerproducts
manufactured
atBirdangpack
housebytargeting
themajorcities
andexport
markets.
Certifiedorganicc.	
gingershouldbe
promotedinretail
outletsinmajor
citiesbybusiness
tie-ups.
122 Value Chain Analysis of Select Crops in North Eastern States
StateProduction
Practices
HarvestingPost-harvestMarketing
Systems
Market
infrastructure
Any
Other
Assam,
Meghalaya
andMizoram
Properapplicationa.	
ofpackageof
practicesto
improvethe
overallyieldinthe
state.
Treatmentofb.	
rhizomesbefore
sowingtoavoid
rhizome-borne
diseases.
State-specific
Assam:
Improvetheseeda.	
rateupto2MT/ha
Exposurevisitofb.	
turmericfarmers
toleadingbelts
inSouthIndia/
Mizoram.
Meghalaya:
Useofhealthya.	
rhizomesof
Lakadongvariety
asplanting
material.
Mizoram:
Increasethea.	
productionareain
Aizawldistrict.
Implementationb.	
ofReiekmodelof
farmersgroupin
otherproducing
belts.
Turmericshoulda.	
notbeleftin
thefieldfora
longtimeafter
maturityasit
affectsthequality.
Hence,itshould
bedoneatproper
timeofmaturity.
Propertraininga.	
shouldbe
impartedin
washing,grading,
slicinganddrying
tomatchthe
qualityinnational
markets.
Largelevelcuringb.	
atthefarmers
placeshould
bepromoted
forbetterprice
realisationof
finishedproduct.
Valueadditionc.	
activitiessuchas
powder-making
andcurcumin
extractionshould
bepromoted
underagro-based
industry.
Farmersshoulda.	
beencouraged
tosellfinished
turmeric.
Directb.	
procurement
systemshould
beimplemented
through
NERAMACand
renownedprivate
organisations.
Linkageofc.	
farmersgroups
withtradersinthe
cities.
State-specific
Meghalaya:
Marketinga.	
linkagewith
nationalaswell
asinternational
processorswhere
Lakadongvariety
isindemanddue
tohighcurcumin
content.
Brandingofb.	
Lakadong
turmericsuchas
Erode.
Mizoram:
Marketinga.	
linkageswithspice
industryinstead
ofmiddlemen
forbetterprice
realisation.
Setupofa.	
scientific/
indigenous
slicing,dryingand
grindingunitat
majorproduction
belts.
Setupofvalueb.	
addition
processingunitto
procuredirectly
fromfarmersand
marketfurtherto
majorlocations.
Commonc.	
procurement
infrastructureto
sellinthemarkets
outsidethestate.
Formationofa.	
turmericvillagein
majorproduction
districtsand
trainingon
scientific
cultivationto
improvethe
productivity.
Directlinkageb.	
withregionaland
distantmarkets.
StateSpecific
Meghalaya:
G.I.registrationofa.	
Lakadongvariety.
Mizoram:
Exposurevisitofa.	
lowproduction
districtstoMamit
toadoptbetter
production
andmarketing
practices.
Turmeric
123Chapter 7 | Conclusion  Recommendations
Vegetables
StateProduction
Practices
HarvestingPost-harvestMarketing
Systems
Market
infrastructure
Assamand
Meghalaya
Vegetablefarmersshoulda.	
betrainedproperlyfor
systematiccultivation
techniques.
Availabilityofgoodb.	
qualityseedsshouldbe
ensured.
Seedsandotherinputc.	
materialshouldbe
procuredeasilyby
farmers.
VisitofVLEWstod.	
vegetablefarmersat
regularintervals.
State-specific
Meghalaya:
Promotionofexotica.	
vegetablescanbedone
atcommerciallevel
astheagro-climatic
conditionisfavourable.
Organisedcultivationofb.	
offseasonvegetables.
Trainingofa.	
farmerson
harvesting
practices,seasons
andasper
marketdemandis
essential.
State-specific
Meghalaya:
Harvestinga.	
ofoffseason
vegetablesshould
bemanagedas
perthedemand
inotherstates
whereitistobe
supplied.
Properhandlinga.	
ofvegetablesafter
harvestingandduring
loadingandunloading
isnecessary.
Useofcratesduringb.	
longdistance
transportation
toavoidphysical
damage.
Packagingofc.	
vegetablesasper
marketrequirement
andtoavoiddamage
duringtransportation
shouldbefollowed.
Useofexistingcoldd.	
storesforvegetable
storagecanbe
promotedtoavoid
wastageandto
facilitateefficient
utilisationofcold
stores.
Trainingoffarmersa.	
onmarketingof
vegetablesisnecessary
astheyarenotable
tonegotiatewith
theaggregators/
consolidators.
Involvementofvariousb.	
stakeholdersshould
beminimisedby
establishingorganised
procurementsystem.
Groupoffarmersc.	
canbeintroducedto
wholesalersinthe
mainmarketsfordirect
supply.
State-specific
Meghalaya:
Networkingoffarmersa.	
groupsdirectlywith
thetradersindistant
markettoimprovethe
shareofprofitshould
beencouraged.
Vegetablesshouldb.	
benotifiedinthe
regulatedmarketsfor
organisedtrading.
Establishmentofvegetablea.	
packhouseisdoneon
urgentbasis.
Infrastructureintheb.	
regulatedmarketsshould
beupgraded.
Formationofcollectionc.	
centresatmajor
productionbeltsis
necessary.
Logisticsystemfromfarmd.	
gatetoconsumermarkets
shouldbestrengthen.
Basicfacilitiessuchase.	
office,sheds,hygienicity,
toilets,weighingfacilities,
gradingandcoldstores
shouldbeprovidedinthe
wholesalemarkets.
Wastageshouldbef.	
minimizedbyuseof
propermethods,toolsand
facilitiesfromproduction
tillendconsumers.
124 Value Chain Analysis of Select Crops in North Eastern States
StateProduction
Practices
HarvestingPost-harvestMarketing
Systems
NagalandSeedavailabilityshouldbea.	
ensured.
Organisedfarmingbymakingb.	
farmers’group.
FieldexposuretoJalukiec.	
(Peren)forimproved
cultivationpractices.
NoneProperpackagingoffresha.	
anddrychillitoavoidquality
degradation.
Bigchilliescanbegradedandb.	
soldathigherpriceasthey
sellonaperpiecebasisinthe
retailmarkets.
Drychillicanbesoldonaa.	
panIndiabasisthroughspice
traders.
Brandcanbepromotedb.	
throughagri-fairs/trade
exhibitionsandotherevents.
StateProduction
Practices
HarvestingPost-harvestMarketing
systems
Marketing
Infrastructures
NagalandIntegrateda.	
managementof
orchardsespecially
nutrientanddisease/
pestsmanagement.
Certificationofb.	
organicallymanaged
orchards.
Forcommerciala.	
use,fruitshouldbe
harvestedwhenitis
90%yellowand10%
green.
Fruitshouldbepickedb.	
fromvineratherthan
beingallowedtofallon
theground.
Secateurs/sharpknifec.	
shouldbeusedto
preventwaterlossand
developmentoffungus.
Useofcratesatfieldd.	
leveltocollectthe
fruits.
Forcedairpre-cooling,a.	
washing,sortingand
gradingshouldbedone
torealiseagoodprice.
Timebetweenb.	
harvestingandpacking
shouldbekeptata
minimumtoavoid
waterloss.
Plasticbagpackingc.	
shouldbeavoided
whichcausesskin
shrinking.
Packinginoneord.	
twolayercellpacks
orpunnetsshould
bedonetomarket
indistantaswellas
exportmarkets.
Fruitsofuniformsizee.	
andstageofripeness
shouldbepacked
together.
Directcontactsofa.	
orchardistswith
processorsinNagaland
andotherstates.
Linkageoffarmersb.	
groupsorlocal
traderwithtraders
inGuwahati,Kolkata,
NewDelhiandother
promisingmarketswill
helptrade.
Organiseda.	
procurementsystem
shouldbeformed
duringharvesting
season.
Availabilityoflogisticb.	
facilityinproduction
clusterstoreducethe
timebetweenfarm
gatesandconsumer
markets.
Efficientutilisationofc.	
existingprocessing
unitsinNagalandand
promotionofvalue
addedproductsin
domesticandexport
markets.
NagaChilli
PassionFruit
125Chapter 7 | Conclusion  Recommendations
KiwiFruit
LargeCardamom
StateProduction
Practices
HarvestingPost-harvestMarketing
Systems
Marketing
Infrastructure
Arunachal
Pradesh
Integrateddiseasea.	
andpestmanagement
especiallypassionvine
hopper.
Pruningshouldb.	
bedoneatproper
intervals.
Verydenseplantingc.	
shouldbeavoided
(6X6sqftis
acceptable).
Oldtreesshouldbed.	
replacedwithnew
plants.
Certificationofe.	
organicallymanaged
orchards.
Hardberriesshouldbea.	
harvestedfortargeted
distantmarkets.
Secateurs/sharpknifeb.	
shouldbeusedfor
harvesting.
Useofcratesatfieldc.	
leveltocollectthe
fruits.
Thefruitscanbestoreda.	
foraboutonemonth
atroomtemperature
and4-5monthsinthe
coldstorageat10°Cto
extendthemarketing
period.
Glutcanbeavoidedbyb.	
keepingincoldstorage
forthetime-being.
Attractivepackagingc.	
tofetchbetterpricein
primemarketsofmajor
citiesofIndiaaswellas
exportmarkets.
Cratesshouldbeusedd.	
fortransportation
insteadoflooseor
gunnybagpackagingto
avoidphysicaldamage.
Formationofkiwia.	
farmers’groupsfor
efficientmarketing
practicesandprice
negotiation.
Marketingthroughb.	
organisedchannelby
directprocurement
fromfarmgateby
NERAMACandother
corporategroups
involvedinfruitsand
vegetableventures.
Logisticsystemshoulda.	
beupgradedtoaccess
themajormarketsin
Indiaasitisseenthat
kiwifromNewZealand
canaccesstheIndian
marketseasilybutkiwi
producedinArunachal
Pradeshisfacing
difficultiesinreaching
themarkets.
Integratedpackhouseb.	
shouldbeinstalledto
gradehighqualitykiwi
totargettheexport
marketsandprime
Indianmarkets.
StateProduction
Practices
HarvestPost-harvestMarketing
systems
Marketing
Infrastructures
SikkimUseofhealthyanda.	
micro-propagated
plantingmaterials.
Replacementofoldb.	
plantswithnew
onestoincreasethe
productivity.
Properweedc.	
managementinthe
fields.
Fieldsshouldbea.	
cleanedofdriedplants,
leavesandstubbles.
Harvestingisdoneb.	
whentopcapsulesof
thespikeattaindark
greycolour.
Pseudostemsshouldc.	
beremovedduring
harvesting.
Harvestedspikesa.	
shouldnotbeleft
forlongerduration
becauseitishighly
perishable.
Fuelpipesystemb.	
shouldbeadopted
insteadofopenBHATTI
tomaintainthecolour
andflavourand
avoidtheburningof
capsules.
Awidenumbera.	
offarmerscanbe
encouragedtosell
throughNERAMAC-
organisedauctioning
system.
Logisticsupportshoulda.	
beprovidedtofarmers
livingatdistanceplaces
toreachtheauction
centreatRongPo.
126 Value Chain Analysis of Select Crops in North Eastern States
Annexure1
IdentificationofProductionClustersintheStatesfortheSelectedFCGs
Inordertoidentifytheproductionclustersinthestatesforidentifiedcrops,district-wiseproductiondatahasbeenanalysed.
Duetonon-availabilityofcurrentyeardata(2010-11)withfewstatedepartments,previousyeardatahasbeenused.
Sl.
No.
Crops/
Districts
ArunachalPradesh(2010-11)
Tawang
West
Kameng
East
Kameng
Papum
Pare
Lower
Subansiri
Upper
Subansiri
Kurung
Valley
WestSiang
EastSiang
Upper
Siang
Dibang
Valley
Roing
Lohit
Anjaw
Changlang
Tirap
Total
Production
(MT)
AFruits
1Apple9.21%84.93%0.00%0.00%1.76%0.00%0.00%0.00%0.00%0.00%3.89%0.00%0.00%0.21%0.00%0.00%28,363
2Walnut11.33%88.67%0.00%0.00%0.00%0.00%0.00%0.00%0.00%0.00%0.00%0.00%0.00%0.00%0.00%0.00%609
3Kiwi7.51%60.31%0.00%0.00%24.33%0.00%0.00%1.17%0.00%0.00%3.82%0.89%0.00%1.98%0.00%0.00%3,930
4Citrus0.01%0.35%0.71%1.63%1.27%3.60%1.21%13.85%12.70%15.11%0.49%16.46%28.53%2.13%1.26%0.68%164,673
5Pineapple0.00%0.00%5.37%7.21%5.06%5.98%1.67%19.98%21.33%6.44%0.44%9.17%8.13%1.84%4.45%2.92%65,180
6Banana0.00%0.00%6.02%8.33%8.24%6.94%5.51%8.80%8.56%8.29%1.85%6.85%10.65%0.00%10.15%9.81%21,603
7OtherFruits1.49%10.43%3.48%2.94%5.95%7.23%6.78%6.85%7.81%7.27%3.39%7.71%7.53%7.50%7.45%6.18%13,276
TotalFruits1.07%9.73%2.16%3.22%3.16%4.13%1.74%13.00%12.66%10.70%1.08%11.97%18.68%1.96%2.74%2.00%297,634
BVegetables0.00%30.89%0.00%17.27%0.00%0.00%0.00%0.00%0.00%0.00%0.00%22.11%29.73%0.00%0.00%0.00%7,087
CMAPs11.31%13.46%4.50%3.46%6.98%4.23%4.02%8.10%10.62%11.00%3.37%3.29%5.17%4.19%3.11%3.18%108,108
DSpices
1L.Cardamom0.00%0.00%3.09%3.53%9.85%9.12%3.97%7.35%8.82%6.18%2.06%6.03%5.44%20.29%8.53%5.74%680
2Ginger0.00%0.00%0.00%0.00%12.90%0.00%0.00%3.23%8.06%5.99%0.00%31.68%19.01%12.90%6.22%0.00%4,340
TotalSpices0.00%0.00%0.42%0.48%12.49%1.24%0.54%3.78%8.17%6.02%0.28%28.21%17.17%13.90%6.53%0.78%5,020
GrandTotal3.69%10.94%2.71%3.48%4.21%4.05%2.29%11.40%11.87%10.54%1.64%10.09%15.35%2.65%2.83%2.26%417,849
127Annexure 1
Sl.
No.
Crops
/Districts
Assam(2009-10)
CacharHaila-
kandi
Karim-
ganj
GoalparaDhubriKokra-
jhar
Bongaig-
aon
Kamrup
(R)
NalbariBarpetaDarrangSonitpurNagaonMoriga-
on
AFruits
1Banana6.02%3.34%2.39%6.77%2.10%3.23%1.28%5.32%2.96%5.63%3.20%7.22%7.17%2.51%
2Pineapple11.35%4.76%1.82%1.95%0.27%2.16%2.21%14.62%0.48%1.88%0.95%5.56%3.17%0.51%
3Jackfruit6.35%1.62%4.79%7.39%2.17%2.75%3.29%3.65%4.43%3.74%6.80%4.64%8.48%3.26%
4Citrus2.61%1.44%1.27%2.65%0.85%1.69%1.26%10.99%1.53%1.57%1.43%2.45%3.17%1.90%
5Papaya2.76%1.29%0.78%3.42%0.98%4.59%1.96%5.35%3.27%4.70%1.47%3.78%5.57%1.38%
6OtherFruits5.48%2.79%3.91%3.73%3.69%3.60%4.03%3.59%3.75%3.65%4.76%5.52%4.12%4.71%
TotalFruits5.98%2.84%2.50%4.96%1.79%2.97%2.03%6.97%2.72%4.01%3.12%5.54%5.71%2.43%
BVegetables
1Cabbage5.86%1.52%2.60%1.85%6.88%3.16%2.78%2.28%5.07%14.61%3.03%2.50%7.36%1.28%
2Potato2.55%0.66%1.30%1.51%4.87%5.55%3.28%6.23%2.27%6.69%6.33%12.72%4.72%1.09%
3Tomato5.82%1.50%1.56%2.55%7.17%2.24%3.16%3.82%4.76%5.31%4.21%3.95%8.38%4.88%
4Cauliflower3.49%1.16%5.04%2.24%6.69%3.70%2.21%6.37%3.65%7.22%2.92%2.86%9.16%1.83%
5Brinjal4.86%1.75%2.53%7.20%5.37%4.32%4.73%3.79%3.13%3.97%3.78%6.18%5.39%3.15%
6Radish4.33%1.01%1.59%2.14%44.23%2.14%1.89%4.64%2.64%2.55%2.72%1.34%4.54%0.98%
7Okra5.96%1.96%2.10%2.90%7.83%3.41%3.05%6.28%1.99%5.49%5.13%3.27%8.10%2.39%
8Ginger1.35%1.01%0.79%2.71%0.79%2.08%0.98%2.64%1.07%3.13%2.47%5.77%4.56%1.81%
9Turmeric5.20%1.08%1.41%2.12%2.50%4.40%1.47%6.44%3.00%8.45%3.29%7.89%11.59%1.78%
10OtherVeg.1.40%3.53%3.45%3.64%2.34%3.24%3.78%3.86%2.06%5.38%4.95%8.87%5.87%1.93%
TotalVeg.2.91%2.40%2.88%3.04%5.37%3.37%3.36%4.20%2.80%6.58%4.55%7.22%6.31%2.00%
Sl.
No.
Crops/
Districts
Assam(2009-10)
BaksaChirangKamrup
(M)
UdalguriJorhatGolaghatSivasa-
gar
Lakhim-
pur
DhemajiDibru-
garh
TinsukiaK.
Anglong
N.C.HillsTotal
Prod.
(MT)
AFruits
1Banana4.08%1.16%1.07%1.15%5.32%6.59%3.24%3.56%3.24%1.14%4.09%4.39%1.84%621,747
2Pineapple1.46%3.22%1.69%4.42%0.78%1.28%1.17%2.57%1.06%0.51%2.19%14.18%13.77%210,241
3Jackfruit2.54%2.68%4.65%0.45%4.14%1.32%3.23%3.93%2.31%2.25%3.22%3.51%2.42%178,076
4Citrus2.67%3.45%6.74%4.35%2.69%2.87%1.09%2.17%1.31%2.26%9.21%6.73%19.65%215,365
5Papaya3.83%2.29%0.57%4.71%3.79%3.15%1.80%2.64%0.81%1.10%2.15%6.68%25.19%122,445
6OtherFruits1.95%2.42%3.61%3.17%3.56%4.32%3.86%3.08%4.31%2.67%3.14%2.98%3.60%194,240
TotalFruits3.06%2.18%2.64%2.50%3.85%4.18%2.62%3.14%2.51%1.53%4.17%5.96%8.10%154,2114
BVegetables
1Cabbage3.50%2.95%2.33%2.49%3.56%4.35%3.09%4.17%2.48%2.76%4.47%1.18%1.90%605,515
2Potato4.67%3.02%0.57%8.41%1.26%3.58%0.96%4.66%4.16%0.87%1.38%1.53%5.17%600,153
3Tomato3.67%4.32%5.56%4.05%3.23%3.85%4.60%1.52%3.39%1.26%1.52%2.17%1.52%375,417
4Cauliflower2.15%2.99%7.72%2.86%2.86%6.18%1.97%3.26%2.65%2.61%3.10%1.37%1.74%347,678
5Brinjal3.59%3.64%3.30%2.45%2.63%3.94%1.23%5.81%2.20%3.35%4.29%2.22%1.19%219,787
6Radish2.25%3.85%2.64%1.74%1.11%1.31%1.78%2.28%0.84%1.46%1.94%1.54%0.53%167,551
7Okra4.43%6.73%4.46%4.29%1.75%2.76%2.47%2.89%1.54%1.92%3.16%2.42%1.30%137,139
8Ginger3.51%1.37%0.56%5.65%1.20%7.29%1.03%2.98%3.06%0.08%5.66%16.17%20.26%107,893
9Turmeric5.60%2.09%1.03%3.81%2.44%6.92%2.02%5.77%0.00%0.61%1.45%6.02%1.63%97,19
10OtherVeg2.95%4.18%2.89%4.01%3.42%2.94%3.28%4.78%2.39%4.57%4.07%2.71%3.54%252,3318
TotalVeg.3.24%3.80%3.10%4.17%2.94%3.57%2.80%4.25%2.65%3.23%3.50%2.42%3.32%503,7720
128 Value Chain Analysis of Select Crops in North Eastern States
Sl.
No.
Crops/
Districts
Manipur(2010-11)
Imphal(E)Imphal(W)BishunupurThoubalTameng-
long
SenapatiUkhrulChandelC.CpurTotalProd.
(MT)
AFruits
1Pineapple8.59%4.16%12.23%19.60%6.66%25.24%1.55%6.08%15.89%110,598
2Banana11.59%11.54%11.11%9.32%15.31%8.78%7.07%11.37%13.91%76,422
3Lime/Lemon3.60%3.91%4.37%6.04%5.89%9.63%32.82%10.24%23.50%29,405
4Orange0.00%0.00%0.00%0.00%62.42%2.85%6.54%3.50%24.69%25,990
5PassionFruit1.28%1.24%1.88%1.02%7.73%36.65%20.13%5.79%24.28%72,581
6OtherFruits6.34%5.00%13.99%13.16%13.48%9.92%10.80%13.84%13.46%56,605
TotalFruits6.44%4.92%8.77%10.43%13.53%18.95%10.55%8.44%17.97%371,601
BVegetables
1Cauliflower20.85%18.00%20.29%22.67%2.18%4.46%2.30%3.54%5.72%22,935
2Cabbage17.19%14.93%17.73%17.06%3.65%12.52%8.59%4.34%3.99%57,624
3Tomato21.43%12.62%23.42%18.49%3.24%4.66%3.84%4.61%7.69%20,156
4Peas17.83%16.79%16.17%15.85%4.34%7.51%9.53%5.08%6.91%45,502
5OtherVeg.15.21%14.38%10.30%18.04%8.11%7.36%9.39%8.63%8.58%46,738
TotalVeg.17.74%15.36%16.46%17.83%4.68%8.31%7.76%5.48%6.38%192,955
CSpices
1Chillies17.76%13.32%10.15%15.35%7.61%11.71%3.45%5.12%15.53%61,661
2Ginger9.24%7.53%8.47%6.32%6.50%6.29%4.54%8.47%42.65%25,443
3Turmeric10.87%11.55%9.54%9.20%5.75%12.94%10.54%7.12%22.47%16,323
4Others
Spices
11.62%13.38%12.94%13.51%11.31%6.43%9.07%11.00%10.72%3,871
TotalSpices14.47%11.68%9.76%12.21%7.20%10.42%4.99%6.43%22.84%107,298
GrandTotal10.97%9.00%11.14%12.84%9.97%14.53%8.86%7.27%15.42%671,854
129
Sl.
No.
Crops/
Districts
Meghalaya(2009-10)
Ri-BhoiEastKhasiHillsWestKhasi
Hills
JaintiaHillsEastGaroHillsWestGaro
Hills
SouthGaro
Hills
TotalProd.
(MT)
AFruits
1Pineapple38.89%6.01%3.96%0.54%19.93%23.48%7.17%103,432
2Banana18.74%10.14%5.25%2.28%29.95%28.98%4.66%78,822
3Citrus4.39%51.65%12.67%13.63%6.48%9.70%1.46%39,070
4Papaya25.26%14.07%4.07%0.90%28.08%25.66%1.96%4,541
TotalFruits25.62%15.51%5.92%3.42%21.26%23.06%5.21%225,865
BVegetables
1Potato0.10%68.07%27.88%0.56%0.62%2.50%0.27%162,445
2Cabbage0.44%76.77%2.92%3.00%10.24%5.38%1.25%36,022
3Cauliflower0.46%54.02%1.67%35.27%2.68%4.64%1.26%35,271
4Tomato5.77%24.77%1.38%49.39%4.84%10.24%3.61%27,522
5Pumpkin1.12%7.92%14.59%3.58%41.16%11.75%19.88%12,191
6Brinjal1.31%5.97%1.18%2.10%50.55%30.99%7.91%11,641
7Peas6.15%24.58%4.94%10.38%18.62%31.90%3.43%4,780
8Onion17.71%12.93%7.24%1.17%18.16%31.35%11.44%3,078
9OtherVeg.6.24%22.49%10.92%8.08%21.99%21.45%8.84%106,307
TotalVeg.4.28%37.60%4.23%16.35%16.16%14.87%6.52%399,257
CSpices
1Ginger14.16%6.64%3.67%5.49%40.78%27.08%2.19%54,009
2TurmericGreen3.97%4.97%2.87%59.46%5.66%19.44%3.62%9,895
3ChilliesGreen10.47%15.35%3.30%2.80%14.42%42.04%11.62%1,394
4BlackPepper18.87%22.78%14.75%3.47%3.47%32.10%4.56%461
TotalSpices12.58%6.69%3.62%13.54%34.67%26.28%2.62%65,759
Annexure 1
130 Value Chain Analysis of Select Crops in North Eastern States
Sl.
No.
Crops/
Districts
Mizoram(2010-11)
AizawlLungleiSaihaChamphaiMamitKolasibSerchhipLawngtaiTotalProd.
(MT)
AFruits
1Mandarin17.44%9.85%6.30%13.35%15.56%16.20%18.27%3.04%19,701
2Banana24.85%9.62%4.97%6.76%6.01%6.18%37.31%4.28%118,600
3Lime/Lemon13.32%11.96%9.32%9.75%14.91%13.62%14.83%12.30%24,150
4Pineapple12.55%11.17%9.95%10.55%9.71%19.09%17.95%9.04%13,590
5Grape8.02%5.79%4.74%55.09%4.10%5.04%11.53%5.69%20,400
6PassionFruit18.82%6.53%1.03%61.88%1.12%5.94%2.31%2.37%5,910
7Papaya21.30%2.85%1.75%7.86%57.73%3.16%2.75%2.60%6,750
8Mango19.75%10.70%9.05%13.61%15.02%11.23%12.56%8.07%2,850
9OtherFruits19.88%12.20%8.56%14.79%12.69%11.97%12.77%7.14%6,219
TotalFruits20.08%9.43%5.81%14.29%9.69%8.74%26.45%5.51%218,170
BVegetables
1Brinjal25.33%8.63%3.42%19.45%1.23%13.67%21.93%6.35%12,108
2BitterGourd16.94%13.11%12.77%12.83%3.07%15.18%16.51%9.59%16,889
3Cabbage30.25%8.42%3.82%7.04%9.57%9.57%27.30%4.04%33,569
4Chayote36.70%12.07%4.95%7.71%8.23%7.38%15.64%7.32%56,849
5Bean34.58%11.50%6.91%6.03%11.57%7.38%16.73%5.29%4,956
6Okra19.91%8.86%9.60%9.95%12.91%13.43%19.16%6.18%18,710
7Cucumber21.08%7.76%6.76%7.62%1.78%14.01%32.95%8.03%3,651
8Tomato54.90%13.60%2.08%4.72%9.92%9.92%3.85%1.00%6,180
9Pea32.07%15.60%6.78%7.76%1.55%9.11%20.43%6.70%1,933
10OtherVeg.26.97%13.09%8.41%16.97%5.81%12.78%10.90%5.06%14,064
TotalVeg.30.17%10.92%6.21%9.79%7.74%10.42%18.52%6.23%168,909
CSpices
1BlackPepper33.98%0.00%0.00%0.00%0.00%66.02%0.00%0.00%88
2Ginger16.33%5.07%6.63%15.55%14.92%16.02%17.27%8.20%31,950
3Turmeric5.36%5.77%11.20%11.61%31.22%12.45%15.37%7.02%23,970
4BirdEyeChilli12.13%15.52%9.77%14.37%13.22%11.72%11.67%11.61%47,850
TotalSpices11.88%10.04%9.12%14.08%17.89%13.26%14.24%9.49%103,858
131
Sl.
No.
Crops/
Districts
Nagaland(2008-09)
KohimaWokhaMokokc-
hung
Zunhe-
boto
Tuenn-
sang
PhekMonDimapurKiphereLonglengPerenTotal
Prod.(MT)
AFruits
1Banana10.00%11.67%10.83%8.33%8.33%8.33%8.33%8.33%8.33%8.33%9.17%60,000
2Pineapple10.43%10.43%10.43%5.22%5.22%6.09%5.22%20.87%5.22%3.48%17.39%57,500
3Citrus13.66%17.69%23.83%3.23%6.55%6.46%3.23%5.05%9.80%3.23%7.27%30,970
4PassionFruit15.87%15.87%12.70%9.52%9.52%9.52%6.35%0.00%6.35%6.35%7.94%6,300
5Papaya13.79%13.79%13.79%5.17%6.90%5.17%6.90%6.90%6.90%6.90%13.79%5,800
6Guava10.20%10.20%10.20%8.16%6.80%6.80%12.59%6.46%8.16%6.80%13.61%1,470
7OtherFruits12.76%11.57%13.85%6.53%8.51%6.82%5.93%9.00%8.51%7.02%9.50%5,055
TotalFruits11.27%12.58%13.36%6.19%6.92%7.09%6.16%11.68%7.41%5.54%11.81%167,095
BMAPs9.09%9.09%9.09%0.00%9.09%0.00%10.91%21.82%9.09%0.00%21.82%550
CVegetables
1Ginger10.00%10.00%10.00%10.00%10.00%6.67%10.00%3.33%6.67%6.67%16.67%30,000
2Chillies13.04%13.04%8.70%8.70%8.70%8.70%8.70%4.35%8.70%8.70%8.70%23,000
3Colocasia15.00%15.00%7.50%7.50%10.00%12.50%12.50%5.00%5.00%5.00%5.00%20,000
4Cabbage8.55%8.55%8.55%4.27%4.27%42.74%4.27%8.55%4.27%4.27%1.71%11,700
5Chowchow12.05%12.05%12.05%8.43%8.43%15.66%10.84%0.00%7.23%7.23%6.02%8,300
6Bean8.86%8.86%8.86%5.70%35.44%5.70%4.43%8.86%4.43%4.43%4.43%7,900
7Tapioca11.67%11.67%16.67%10.00%10.00%10.00%6.67%6.67%6.67%6.67%3.33%6,000
8LeafyVeg.10.00%10.00%10.00%10.00%10.00%10.00%10.00%10.00%5.00%5.00%10.00%5,000
9Tomato18.75%7.50%7.50%7.50%10.00%7.50%5.00%6.25%7.50%10.00%12.50%4,000
10OtherVeg.12.07%12.03%10.89%7.03%6.70%7.40%6.99%11.99%6.22%6.34%12.35%12,305
TotalVeg.11.81%11.45%9.63%8.12%10.39%12.14%8.74%5.71%6.37%6.46%9.18%128,205
Annexure 1
132 Value Chain Analysis of Select Crops in North Eastern States
Sl.
No.
Crops/
Districts
Sikkim(2006-07)
NorthEastSouthWestTotalProd.(MT)
AFruits
1Orange0.81%46.18%18.87%34.14%9,300
2PassionFruit7.11%44.66%22.92%25.30%2,53
3OtherFruits2.71%37.56%24.40%35.33%3,946
TotalFruits1.48%43.63%20.56%34.32%13,499
BVegetables
1KharifVeg.10.51%32.52%31.93%25.04%14,199
2RabiVeg.5.99%32.52%34.91%26.58%17,101
3OffseasonVeg.9.41%30.16%32.39%28.05%12,900
TotalVeg.8.44%31.83%33.22%26.52%44,200
CTotalRootTuberCrops6.70%27.97%26.62%38.70%36,598
DSpices
1L.Cardamom31.93%30.61%19.89%17.57%3,182
2Ginger1.82%34.08%36.54%27.57%36,001
3Turmeric4.55%25.64%47.03%22.77%2,020
TotalSpices4.28%33.40%35.76%26.56%41,203
Sl.
No.
Crops/
Districts
Tripura(2009-10)
SouthWestDhalaiNorthTotalProd.(MT)
AFruits
1Jackfruit30.01%28.37%22.10%19.52%251,569.00
2Pineapple23.41%24.47%18.11%34.00%117,531.00
3Banana18.59%53.83%13.37%14.21%105,615.00
4Orange7.76%0.19%11.13%80.91%22,230.00
5Papaya27.19%24.73%22.17%25.91%18,455.00
6Litchi38.52%20.72%16.59%24.17%16,972.00
7Mango51.07%25.98%7.68%15.28%13,170.00
8Lime/Lemon26.23%39.48%23.32%10.98%11,716.00
9OtherFruits22.77%35.06%13.10%29.07%16,567.00
TotalFruits26.05%31.19%18.53%24.23%573,825.00
BVegetables
1Potato45.12%26.63%10.69%17.56%99,416.00
2Tomato32.55%43.04%9.47%14.94%29,550.00
3Brinjal22.53%63.18%6.01%8.27%22,651.00
4Radish22.02%55.81%3.73%18.44%19,068.00
5Colacasia24.01%30.82%4.87%40.30%18,426.00
6OtherVegetables24.10%49.86%10.82%15.22%133,886.70
TotalVegetables25.91%49.54%8.63%15.92%347,527.70
CSpices
1Ginger61.01%11.30%12.42%15.28%7,932.00
2Turmeric40.49%28.80%6.82%23.89%5,965.00
3Chilly52.86%30.47%7.10%9.57%3,042.00
4BlackPepper16.04%41.51%2.83%39.62%106.00
5TotalSpices52.45%21.18%8.83%17.54%16,929.40
133
Annexure 2
Agriculture Marketing and Post-Harvest Infrastructure
Arunachal Pradesh
Scenario of Agricultural Marketing in Arunachal Pradesh
The Government of Arunachal Pradesh has enacted the Arunachal Pradesh Marketing
(Regulation) Act, 1989 to provide for a legal mechanism to establish and regulate markets in
Arunachal Pradesh with a view to remove the handicaps from which a farmer was suffering.
This will be done by ensuring fair and remunerative prices of their produce by rationalising/
standardising various activities and practices in the markets through legislation.
In accordance with the provision of the said Act, 14 agricultural produce marketing
committees have been established to facilitate and regulate transaction of agricultural and
allied produces. So far 14 Agricultural Produce Marketing Committees are functioning in
the state. The Arunachal Pradesh Agriculture Marketing Board is to oversee the functioning
of Agricultural Produce Marketing Committees and to provide necessary assistance in
establishment of infrastructural facilities such as market sheds, storage, godowns out of the
grants released by the state government.
The efforts of the state government and Agricultural Produce Marketing Board (APAMB)
have been supplemented to some extent by the Directorate of Marketing and Inspection,
Government of India, under Mini Mission III of the Technology Mission for Development of
Horticulture in the North East and Macro Management Programme. The facilities created
under various financial supports at different locations are given in Table A, B and C. In
order to promote better marketing access to the enterprising farmers, Arunachal Pradesh
Agriculture Marketing (Regulation) Act, 1989 was amended during 2006, by incorporating
contract farming and establishment of private market yards to facilitate private investment in
agricultural marketing. This amendment will encourage the entrepreneurs in establishment
of private market and facilitate the farmers to sell their products to the purchasers, which
will considerably enhance the farmers’ income.
Table ‘A’: Statement Showing the Marketing Infrastructure Created in the Different APMCs
under Marketing Board Against Grant-in-Aid
Sl. No. Name of APMC Infrastructure Created Location
1 Khonsa Fish Market (12 seated Platform) Khonsa
Meat Market (6 seated Platform
Two Shoes Market
One store for fish traders
Slaughter House
One Market shed Rangluas
Extension of Market Khonsa
Market shed with CGI roofing Deomali
OBT shed for Fish Market Deomali
MIBT double unit cloth shed Deomali
Repairing/Renovation of Market shed Longding
MIBT single unit Market shed (3 ) Longding
Open platform CC flooring Longding
5 room transit camp at Tinsukia Tinsukia
SPT type Market shed (2) Khonsa
Construction of Cattle Market shed Kanubari
Annexure 2
134 Value Chain Analysis of Select Crops in North Eastern States
Sl. No. Name of APMC Infrastructure Created Location
2 Miao Godown Miao
Auction Platform Miao
Shop Miao/Kharsang
Cont. of check gate Bordumsa
Cont. of check gate Diyun
3 Tezu Establishment of one closed Market yard Tezu
One Small SPT store (10 MT capacity) Tezu
Guest House (2 rooms) Tezu
Cont. Check post and rest camp Tezu
4 Roing Two hectares of land allotted to APMC, Roing for market
yard (security fencing with barbed wire)
Jia
Two unit barrack type Quarter Jia
Two Market sheds Jia
One Market Godown Jia
One weekly Market shed Jia
5 Pasighat 3 Unit Bachelor Barrack Pasighat
16 Unit Fish Market shed Pasighat
Open Market shed Nari
12 Unit Vegetable Market shed Pasighat
Cont. of Godown Jampani
6 Along Cont. of Primary Market shed Mechuka
7 Ziro One Market shed Yechuli
One Market shed Koloriang
Improvement of Gandhi Market Hapoli
8 Papum Pare Market Godwon (Cap. 125 MT) Balijan
Market yard at Gohpur Tinali and Chandan Nagar Gohpur and Chandan
Nagar
One Truck for transportation of Agri/Horti.Produces Yupia
Construction of Boundary Kimin
Renovation of SGL Naharlagun
Cont.of Market shed Lower Subansiri
Cont. of Office-cum-sale counter Tarasso
Cont. of Market shed Nirjuli
9 Bombdila One sale counter (RCC) Bombdila
0.7 Room SPT type Market shed Rupa
9 Room RCC Market shed Bombdila
Garage with Timber/CGI Sheet roofing Bombdila
Installation of 63 KVA power station of cold storage Tippi
10 Tawang Daily Market shed Near Bus Stand
Repairing of Potato Godown Lemberdung
Construction of Potato Godown Seru
11 Seppa Cont. Market shed Sejiosa
12 Daporijo Cont. of Market sheds Daporijo, Siyung, Taliha
Radding
13 Yingkiong Cont. of Market sheds Yingkiong
135
Sl. No. Particulars Quantity District/Location
1 Establishment of Primary Market 3 1. Singchung, West Kameng District
2. Neri, East Siang Distict
3. Aalo, West Siang District
2 Establishment of Primary Marketa.	 6 1. Raga, L/Subansiri Distict
2. Ziro, L/Subansiri District
3. Longding, Tirap District.
4. Mirmir, East Siang District
5. Ganga Market, Papumpare District
6. Nari/Pam, East Siang District.
Establishment of Secondary Marketb.	 6 1. Tenga, West Kameng District
Tata Truck – 709c.	 6 1. Roing, L/Dibang valley District.
3 Establishment of Primary Marketa.	 3 1. Yazali, L/Subansiri District
2. Hija, L/Subansiri District.
3. Nyapin, Kurung Kumey District
Rice Houllerb.	 15 4. Pasighat, East Siang District - 6
5. Aalo, West Siang District - 4
6. Papumre District - 2.
7. Kurung Kumey District - 1
8. Lohit District - 2.
Tata Truck – 709c.	 2 1. Aalo, West Siang District - 1.
2. Kurung Kumey District - 1
4 Mustard Oil Milla.	 4 1. East Siang District - 1
2. Lohit District -1
3. L/Dibang valley District - 1
4. Changlang District - 1
Spices grading unitb.	 3 1. Changlang District - 1
2. West Siang District - 1
3. West Kameng District - 1
Cattle food production unitc.	 1 1. Papumpare District - 1.
Rice Milld.	 10 1. East Siang District - 3
2. West Siang District - 3
3. East Kameng District - 1
4. Tirap District - 1
5. Upper Siang District - 2
Gur Making Machinee.	 2 Nos 1. Tirap District - 1
2. Upper Subansiri District - 1.
Tata Truck-709f.	 1 1. Lower Subansiri District -1
Construction of Transit Godowng.	 1 1. Tirap Distict -1
5 Establishement of Primary Marketa.	 2 Bordumsa, Changlang District -1
Dolungmukh,L/Subansiri District - 1
Mini Rice Millb.	 10 1. East Siang District -2
2. West Siang District - 2
3. Lower District -2
4. Changlang District - 2.
5. Ziro, L/Subansiri District - 2
Table ‘B’: Statement Showing the Infrastructure Creation Under Macro Management
Scheme at different Location/District
Annexure 2
136 Value Chain Analysis of Select Crops in North Eastern States
Table ‘C’: Statement Showing the Marketing Infrastructure Created in the Different APMCs
under Technology Mission of Mini Mission - III
	Wholesale Markets - 6
Rural Primary Markets - 24
State Grading Laboratories - 2
Sl. No. Name of APMC Infrastructure Created Location
1 Khonsa One Rural Primary Market Kanubari
2 Miao One Rural Primary Market Miao
3 Tezu One Wholesale Market Tezu
5 nos. Rural Primary Market Tezu/Chowkham/Hayuliang/
Lathao/and Piyong
4 Roing One whole sale Market Roing
2. One Rural Primary Market Roing
5 Pasighat One Wholesale Market Pasighat
5 nos. Rural Primary Market Koyu/Bolong/Nari/Koreng/Mebo
State Grading Laboratory Pasighat
6 Along One Rural Primary Market Likabali
7 Ziro One Wholesale Market Hapoli
Two Rural Primary Market Hapoli/Boushimla
8 Papum Pare One Wholesale Market at Gohpur Tinali Itanagar
3 Rural Primary Market Chandan Nagar/Sagalee/Kimin
State Grading Laboratory Naharlagun
9 Bomdila One Wholesale Market Tenga
5 Rural Primary Market Lui Kalaktang/Dirang/Kaspi/
Thrizino  Bhalukpogn
Till 2010-11, Arunachal Pradesh Agriculture Marketing Board (APAMB) under Dept. of
Agriculture was responsible for establishment of infrastructure and promotion of marketing
activities. For the purpose, 3 cold storages in the region (West Kameng, Passighat and Lohit)
are established but have remained unoperational/unutilised till date, 6 regulated markets
(West Kameng, Papum Pare, Ziro, Passighat, Roing, Khonsa) are established by the Arunachal
Pradesh Agriculture Marketing Board but due to lack of proper infrastructure facilities in
the markets such as sheds, storages, boundary walls, weigh bridges, auction platforms etc.
traders and farmers are not interested to operate and utilise the same.
Horticulture perspectives and future Policy
From the point of view of horticulture produce (perishables), the infrastructural facilities
created so far are inadequate and traders  farmers are not keen on utilising the markets
because of lack of basic infrastructure such as auction sheds, cold storages, boundary walls,
weigh bridges, auction platforms, electricity, water, rest rooms and also due to location
disadvantages. Therefore, there is a need for creation of market infrastructure facilities
within the reasonable limit enabling traders and farmers to utilise the same.
The following infrastructural facilities are to be created:
Adequate marketing infrastructure at village/circle/district and state level such as™™
rural primary market, storage godowns, grading, sorting and packing facilities.
Transport facilities to be strengthened.™™
137
APMCs are to be equipped with modern amenities.™™
Appropriate linkage between producers and sellers.™™
Wholesale and terminal market.™™
Pre-cooling and cold storage facilities.™™
Availability of manpower with proper market orientation.™™
Credit support.™™
Market intelligence.™™
Processing and value addition.™™
Rural road connectivity.™™
Conclusion
In spite of all the efforts taken by the Dept. of Agriculture, Government of Arunachal Pradesh,
the desired result could not be achieved with regard to agricultural marketing. This may be
possibly due to dependence of marketing activities with the existing paraphernalia of the
department as well as inadequate fund position.
In order to boost marketing of horticulture produce in the state, a separate Horticulture
Marketing Board was established in 2011, under the Directorate of Horticulture which is
solely responsible for horticulture produce marketing activities for speedy development and
regulation but due to lack of funds, it is yet to take up these activities.
Therefore, in view of the vast potential and resources in horticulture sector including aromatic
and medicinal plants in the state, there is an urgent need for adequate infrastructural
support as per suitability to streamline the Horticulture Marketing in the state to attract
private investors and sponsor for contract farming.
Assam
Post-harvest and marketing infrastructure status in Assam
Market yards are a long felt need of the farming community of Assam as they go a long
way in ensuring optimum if not higher remuneration to them through proper weighing,
cleaning, grading and better price realisation of their produce. The farmers look
forward to a regulated market yard as a dependable infrastructure for furtherance of
their economic goal. The advantages of a regulated market yard system are immense
and wherever such a system exists, it has been widely appreciated. Today, the farmers
consider it a boon to be in a place where they can confidently sell their produce and
get an appropriate return for the quantity and quality they produce year after year. The
state has 20 Regulated Market Committees, 20 Primary Market Yards and 206 Secondary
Market Yards.
Markets established under Technology Mission
Uparhali Market™™ under Guwahati Sub-Divisional Market Committee in Kamrup
district.
Gauripur Market™™ under Gauripur Regulated Market Committee in Dhubri district.
Mandia Market™™ under Baharihat Regulated Market Committee in Barpeta district.
Annexure 2
138 Value Chain Analysis of Select Crops in North Eastern States
Hojai Market™™ under Lanka Regulated Market Committee in Nagaon district.
Dhubri Market™™ under Gauripur Regulated Market Committee in Dhubri district.
Markets established under NEC Scheme of 10th Five Year Plan
Singimari market™™ under Guwahati Sub-Divisional Market Committee in Kamrup
district.
Darrangiri market™™ under Goalpara District Regulated Market Committee in Goalpara
district.
Sapekhati market™™ under Sibsagar District Regulated Market Committee in Sibsagar
district.
Gamariguri market™™ under Golaghat District Regulated Market Committee in Golaghat
district.
Nagabat market™™ under Jorhat District Regulated Market Committee in Jorhat
district.
Details of Infrastructure under the Regulated Market Committees
RMC No. of
Auction
Plat-
form/
Retailer
Shed
No. of
Godown
No. of
Selling
Com-
plex/
Trader's
Shop
No. of
Cattle
Market
Shed
No. of
Drying
Platform
No. of
Health
Care
Unit
No. of
Guest
House/
Krishak
Bhawan
No. of
Cold
Storage
Others
(Bank/
Canteen
Bldg.
etc.)
Baharihat RMC 4 2 2
Bongaigaon
DRMC
6 1
Cachar DRMC 8 6 1
Darrang DRMC 36 3 2 1 1
Dhemaji DRMC 6 2 1 2 1
Dhing RMC 33 5 1
Dhubri DRMC 35 13 2 4 1 1 1
Dibrugarh DRMC 13 1 1
Goalpara DRMC 19 2
Golaghat RMC 35 3 3 3 4
GSMC 51 6 3 3 6 1 2 1
Hailakandi DRMC 6 1
Howly RMC 14 2 1
Jorhat DRMC 60 4 2 4 2 1
Karimganj DRMC 2 1 1
Kokrajhar DRMC 21 1 1
Lanka RMC 13 1 3 1 1
Morigaon DRMC 15 2
N/Lakhimpur RMC 16 1
Nalbari DRMC 11 1 3 2 1 3
Rangia SDRMC 5 1
Sivasagar DRMC 16 1 1
Sonitpur DRMC 9 1 1
Tinsukia DRMC 11 2
Total 445 48 12 22 33 6 10 3 2
Source: http://asamb.in/html/?u=infra
139
Guwahati Sub-Divisional Market Committee (Kamrup)
This is the one of the oldest market committees in the state and has total 8 market yards. In
the following tables important features of each market have been discussed:
Sl. No. Name of the Market
Yards
Features
1 Bijoynagar Market Daily primary market, total arrival of green vegetables about 1000 Tons™™
per annum and 70% of this is sent to Guwahati, not qualified market
related infrastructure.
2 Boko Market Weekly market but not a FV market™™
3 Chhayagaon Market Biweekly market but not a FV market™™
4 Fancy Bazar One of the oldest market in the heart of the city for fruits, vegetable™™
and spices
5 Hahim Market Biweekly market™™
6 Machkhowa market Machkhowa daily vegetable wholesale mandi was established in 1989™™
and located at 9 kms. From NH-37 in Guwahati. It is one of the largest
vegetable markets in Assam, spread over two bigha area. Almost all
the vegetables are traded in this market. Produces arrives from the
markets as near as Singimari (16 kms) and as far as from Karbi Anglang
(350 kms). There are 25 traders, 85 commission agents (commodity
wise), 145 Faria and 60 hamal (Coolie) involved in this wholesale mandi.
Produce is sent to Greater Guwahati and Shillong from Machkhowa
mandi.
Activities such as cleaning, filling, weighing, grading and standardisation™™
is done manually in the market. Though Machkhowa is major vegetable
mandi in Guwahati but it is lacking in basic facilities and post-harvest
infrastructure. This mandi does not even have the facility of a board
to display market price. It is lacking in post-harvest facilities such as
sorting grading, washing, packaging and cold storage. It also does
not have office building, auction platform, drying platform, godown,
drinking water, sanitation and parking. Garbage disposal is very poor
and the place is very much congested. Internal road in the market is
very narrow.
Due to lack of above facilities, condition of Machkhowa market is™™
very poor and traders have to sell their produce on a daily basis. By
providing post-harvest infrastructure wastage can be checked to a
major extent. Sorting, grading facilities, cold store and godowns
should be availed to improve the market condition and for business
of quality product.
7 Nagabera Market Weekly market but not a vegetable market™™
8 Singimari Market Daily market and annual arrival of vegetables is about 700 tons and act™™
as a feeder market for Machkhowa market.
Annexure 2
140 Value Chain Analysis of Select Crops in North Eastern States
Manipur
Post-harvest and marketing infrastructure status in Manipur
Proposed/upcoming processing projects in Manipur
Sl. No. Proposed Project Production Capacity
1 Fruits  vegetables processing 80 MT/Day
2 Ginger dehydration and oleoresin 33 MT/Day
3 Spices processing plant 5 MT/Day
4 Integrated mushroom processing plant 15 MT/Day
5 Lime Ginger (RTS) Plant 100 lakh bottles of 200 ml per annum
6 Agri export zone for passion fruit 2 MT/Hour
7 Manipuri traditional liquor plant (distillery) 9 lakh lt./annum
8 Integrated pineapple concentration plant 50 MT/day
Sl. No. Processing
Unit
Sector Type Capacity
MT/Annum
Type of Products
1 MAGFRUIT Hort.  Soil
Conservation,
Govt. of Manipur
SSI Unit 240 Canned fruits and vegetables, fruit
syrups, pickles, jam jellies, RTS (Lime-
ginger) cordials, squashes, candies, etc.
2 HEIRANG Co-operative SSI Unit 240 Canned fruits and vegetables, fruit
syrups, pickles, jam jellies, RTS (Lime-
ginger) cordials, squashes, candies, etc.
3 WAIFRU N.G.O. SSI Unit 240 Canned fruits and vegetables, fruit
syrups, pickles, jam jellies, RTS (Lime-
ginger) cordials, squashes, candies, etc.
4 RATNA FRUITS PRIVATE Cottage Scale 50 Squashes, jam
5 LIKLA PRIVATE Cottage Scale 50 Squashes, RTS, jam, jelly (Fruit based)
6 SANA PRIVATE Cottage Scale 50 Squashes, pickle, jelly, jam
7 MANIFRU PRIVATE Cottage Scale 50 Squashes, pickle, jelly, jam
8 HILL FRUITS PRIVATE Cottage Scale 50 Squashes, jam, etc.
141
Sl.
No.
Name of Processing Unit
with Address
Crops Processed Production
Capacity
Remarks
1 Fruit Preservation Centre,
Fruit Garden, Shillong
Orange, Pineapple, Lemon, Sohiong,
Carambola, Plum, Guava, Litchi, Chilli, Passion
fruit and some indigenous fruits of the state.
60 MT Public sector
2 Fruit Preservation Centre,
Dainadubi, East Garo Hills.
Orange, Pineapple, Lemon, Litchi,
Carambola, Mango, Passion fruit, Amla, Chilli,
40 MT -Do-
3 M/s Mansan Fruit Products,
Umiam,Ri-Bhoi District
Orange, Pineapple, Lemon, Sohiong,
Carambola, Plum, Strawberry, Passion Fruit
and some indigenous fruits of the state.
400 MT Private sector
4 M/s Megha Cashew,
Byrnihat, Ri-Bhoi District
Cashewnuts 1200 MT -Do-
5 M/s Kara Fruit Processing,
Pokseh, Shillong
Orange, Pineapple, Lemon, Sohiong,
Carambola, Plum, Guava, Litchi, chilli,
passion fruit and some indigenous fruits
10-15 MT -Do-
6 Wahkdait Pashun Ropeway
transport fruit, vegetable
and livestock Co-operative
Society, Wahkdait, Pynursla
Block, East Khasi hills
Orange, Pineapple, Lemon, Sohiong,
Carambola, Plum, Guava, Litchi, Chilli,
Passion fruit and some indigenous fruits
60-80 MT -Do-
7 NERAMAC Ginger Processing
Unit, Byrnihat, Ri-Bhoi District
Ginger 5 MT/Day
(Seasonal)
Public sector
8 M/s K.D. Agro
Chibinang, West Garo hills
Pineapple, tomato etc. 7 MT/Day
(Seasonal)
Private sector
9 M/s B.R. Industries
Phulbari, West Garo Hills
Cashewnuts 380 MT/Year -Do-
10 Meghalaya Ginning Mill
Phulbari, West Garo Hills
-do- 145 MT/Year -Do-
11 M/s O. Sangma
Sansanggiri, West Garo Hills
-do- 175 MT/Year -Do-
12 M/s Aminul Islam Phulbari,
West Garo Hills
-do- 110 MT/Year -Do-
13 M/s Binay Ghosh
Phulbari, West Garo Hills
-do- 165 MT/Year -Do-
14 M/s Pradip Saha
Phulbari, West Garo Hills
-do- 195 MT/Year -Do-
15 M/s Uttam Kothari
Monabari, West Garo Hills
-do- 196 MT/Year -Do-
16 M/s Kazi Zaman
Bhaitbari, West Garo Hills
-do- 170 MT/Year -Do-
17 M/s Khalil Miya
Bhaitbari, West Garo Hills
-do- 355 MT/Year -Do-
18 M/s Hunbit Spices
Shangpung, Jaintia Hills
Turmeric, Black pepper and other spices 150 MT/Year -Do-
19 M/s Dkhiah Processing unit
Khliehriat, Jaintia Hills
-do- 50-80
MT/Year
-Do-
20 M/s Three Leaves Consumer
Products Pvt. Ltd.
Baridua, Ri-Bhoi District
-do- 0.15 MT/Day -Do-
Meghalaya
Post-harvest and marketing infrastructure status in Meghalaya
Existing horticulture processing units in Meghalaya
Annexure 2
142 Value Chain Analysis of Select Crops in North Eastern States
Marketing Infrastructure in Meghalaya
Regulated Markets:1.	 Two regulated markets in Meghalaya viz. Mawoing Regulated
Market in East Khasi Hills and Garobadha Regulated Market in West Garo Hills.
Only potatoes and ginger are notified in fruits and vegetables for trading. One
cold storage in each market has been established but remained unoperational till
date. Both markets lack basic marketing infrastructure such as auction platforms,
weigh bridges, covered sheds, electricity, water, toilets, sorting grading machines,
poor roads.
Infrastructural Development
Mawiong Wholesale Regulated Market
1000 MT capacity godowns - 21.	
Auction platform – 12.	
Grading  assorting shed - 13.	
Farmers’ rest house - 14.	
Traders’ store - 515.	
Office building of the Market Committee - No6.	
Internal roads7.	
Compound Fencing8.	
Drainage facility9.	
Electricity10.	
Water supply  sanitary arrangement11.	
Garobadha Wholesale Regulated Market
1000 MT capacity godowns – 21.	
Auction platform - 12.	
Grading  sorting shed - 13.	
Open trading sheds - 84.	
Piggery and Goat sheds - 25.	
Water supply  sanitary arrangement Electricity6.	
Internal roads7.	
Iewduh -Bara Bazaar (Non-regulated): To cater to the vegetable needs of the population
of Shillong city, Iewduh-Bara Bazaar (non-regulated) market is the major market. Located
within the Shillong city; Iewduh market is the only preferred market for trading all kinds
of vegetable produce in the region (due to absence of regulated market for vegetables in
the region  distance). Farmers of nearby production belts/blocks (within 60 kms radius
of Shillong city) used to sell their produce in the market. In the market, approximately
300-400 small and big traders are operating. Discussions with the traders in the market
revealed, that on an average 500-800 quintal of vegetable produce arrives daily in the market.
Besides vegetables, other commodities such as fish, spices, general grocery items are also
traded in the same market place.
143
The market serves both wholesale and retailing point for trading of vegetable produce.
Farmers from nearby production belts bring their produce in wooden baskets/jute bags and
sell it to traders who offer the maximum price. Traders in turn sell their produce to retailers
as well as to consumers.
The market operates in a very congested area and unhygienic conditions and lacks basic
infrastructure amenities for vegetable trading such as parking, even roads, clean and regular
supplyofwater,irregularelectricity,auctionplatforms/sheds,weighbridges,sortinggrading
machines, cold stores, godowns, market information system, garbage disposal system etc.
Iewduh is run and managed by the Syiem of Mylliem, head of the traditional democratic
institution of Syiemship. The most distinctive feature of this ancient market is the total
domination of its retail trade by the Khasi women, who are everywhere, all over Iewduh.
Though the market is non-regulated, but discussions with the traders and farmers revealed
payment of money to person deputed on behalf of the King for provision of facilities in the
market such as sanitation, parking etc.
By and large, trading in horticulture produce is done in markets yet to be ‘regulated’. In fact,
there is a resistance to transactions taking place in APMCs yards and the trading associations
have moved the Hon’ble High Court for redressal of this matter.
In the interest of the future growth of the city, the need of the hour is to shift the Iewduh
(Bara Bazaar) to Farmers Market at Upper Shillong (under construction) which has hygienic
conditions, sufficient parking space, pucca roads, auction platforms, sorting, grading and
packing machines, electronic display system, ripening chamber  multipurpose cold storage
facility in addition to small godowns etc.
Farmers Market at Upper Shillong (Under Construction):1.	 To provide marketing facility
forthesefarmers,toenablethemtomarkettheirproduce,theGovernmentofMeghalaya
through the State Agricultural Marketing Board set out to establish a farmers’ market
under ACA (Additional Central Assistance) at a cost of ` 47,18,731.00. The construction
of this farmers’ market has been completed and it is likely to be inaugurated soon.
The main objectives of establishing the farmers’ market is (a) to provide a place which is
equipped with infrastructure and facilities for the farmers to sell their produce in a transparent
and fair manner to buyers and sellers alike, (b) to enable farmers to come together and
manage the facility, (c) to provide a platform to farmers for exchanging information and for the
Department of Agriculture to meet with farmers with a view to providing technical information
and advisories, (d) to facilitate direct seller and trader interaction and trading between farmers
and traders which eliminates the operation of superfluous middlemen to a great extent.
Infrastructural details of the Upper Shillong – Farmers’ Market
TheUpperShillongFarmers’MarketisbuiltonlandbelongingtotheStateAgricultureDepartment
at 5th Mile Upper Shillong, on the road to Shillong peak. It consists of the structures as shown
in the table given on page 144.
Collection and Forwarding Centre: To improve the marketability and add value to the
produce brought by the farmers to the market, the State Government has proposed to set
up a Collection and Forwarding Centre at Upper-Shillong adjacent to the farmers’ market.
At the Collection and Forwarding Centre, the produce will be properly graded stored and
packed, before being transported to the larger markets outside Shillong and even outside
the state. This will provide a better market and better price for their marketable surplus
produce and enable the farmers to enhance their income from their cultivation.
Annexure 2
144 Value Chain Analysis of Select Crops in North Eastern States
The intended purpose and activity of the Collection and Forwarding Centre is meant to be
as follows:
Fresh harvested vegetables and fruits are brought to the centre for:
Cleaning, sorting, grading and packing in appropriate packets.1.	
To enhance shelf life of fresh produce by pre-cooling.2.	
To keep the produce in cold rooms for short term, prior to dispatch to markets.3.	
The facility which should be created should be able to handle 20 Metric Tons of fruits 
vegetables arriving daily in 10 working hours per day. The proposed building of the facility
will have the following components:
Main building size
L30 x W18 x H5 m. The building shall be constructed as a civil structure, with a standard shed
with 1 mtr raised platform with steel structure and roof profile sheeting – end coverings etc
and shall be divided so as to cater to definite purpose as follows:
2 cold stores of 10 MT storage capacity each and 1 pre-cooling chamber of capacityi.	
3MT/batch will be provided along the width side of the main building. The technical
specification of the cold store and pre-cooler will be as per revised specification
as i)  ii) given above except for generator size/MCC should be suitable  common
to both.
Work Hall size L20 x W18 x H4.5 m will be at the centre portion, the 2 side walls alongii.	
the length of the work hall will be of 40 mm thick PUF sandwich panels and will also
have a false ceiling of 40 mm thick PUF sandwich panels. 2 sliding doors of size 2 x 2
shall be provided for movement of fresh arrivals and despatch of packed produce.
On both side walls high level fixed glazed windows of size 500 x 1000 mm shall be
provided, along with 6 exhaust fans of 300 mm diameter.
Sl. No. Infrastructure Size (in m) Area/Unit Specifications
1 Open stall – 6 3.65 x 3.00 10.95m2
With tabular trusses
 C.G.I. sheet
2 Auction platform – 1 20.00 x 8.00 160.00 m2
3 Go-down – 1 15.00 x 5.00 75.00 m2
4 Grading  Sorting Hall – 1 8.00 x 6.00 48.00 m2
5 Farmers Meeting Hall – 1 8.00 x 4.00 32.00 m2
6 Septic Tank – 1 50 users
7 Approach Road L = 125.00 Rm 768.50 m2
Black Topped
8 Foot path from motorable road L = 53.24 Rm 106.48 m2
Cement concrete
9 Garbage disposal/Dustbin 2.00 x 2.00 x 1.2 4.80 m2
10 Toilet 3.00 x 1.50 4.50 m2
11 Deep tube well
12 Over head RCC staging
13 Footpath  drain
a) Drain
b) Footpath
346.00 Rm
23.93 Rm
Cement concrete
14 Electrification
145
The remaining side of the building will house supervisor’s office size L4 x W4 x H3 m,iii.	
Laboratory L4 x W3 x H3 m, ladies and gents toilets each L4 x W4 x H3 m with a middle
corridor of size L4 x W2 x H3 m. This portion of the building will have all end walls and
partition walls of brick plaster finished and painted. False ceiling either with wood or
acoustic tiles shall be provided in this area. Toilets shall be fitted with WC/urinal/wash
basin fittings appropriate for use by 40 persons. Suitable septic tank shall be provided
for the toilet waste disposal.
The lean to portion of the building will be a covered veranda to enable truck unloading/iv.	
loading and at the cold store end will be separated with brick wall (6 x 6 m area) for
the utility equipment such as water filtration plant, EPT, DG set, electrical panels
etc.
Electrification of the building shall be as follows: lighting 2 in cold store, 10 in thev.	
work hall, 2 each in office, lab and toilets. 15 amp power sockets-12 in the work
hall, 4 at the office, 2 in each toilet. Sufficient external lighting is to be provided as
required.
Two compost pits of size L6 x W6 x D3 m are to be provided at least 100 m away fromvi.	
the building for disposal of vegetable waste.
Plant and Machinery
Refrigeration equipment for cold stores and pre-cooler and the specs of PUF insulatedi.	
panels, cold store doors etc will be same as given in the revised specs given as item i
and ii above.
Sorting and grading tables size 1 x 2 m, qty. 10, SS304 sheet covered top, G.I. frameii.	
and legs.
4 trolleys with raised handle for moving plastic crates, painted MS construction withiii.	
200 mm diameter rubber wheels, size 1 x 2 m.
4 pallets trucks-hydraulic hand-operated, to move PVC pallets of size 1.2 x 1 m andiv.	
weight carrying capacity of 1,000 kg.
500 perforated plastic crates size 600 x 400 x 300 mm.v.	
2 hand tools for strapping cartons.vi.	
6 electronic table top weighing scales of 0-30 kg range.vii.	
10 fly/insect killer for wall mounting/hanger type.viii.	
One platform type electronic weighing scale range upto 1,000 kg.ix.	
One silent diesel generator 85 KVA, 415V/3ph, 50 Hz. Complete with 500 Litre dieselx.	
tank, accessory electrical switch gear and monitoring panel.
One water filtration to produce clean water at the rate of 1mxi.	 3
/hr complete with
5000 Litre storage tank.
Rural Markets (Non-Regulated):2.	 Besides Bara Bazar (Iewduh Market), Mawiong
(East Khasi Hills) and Garobadha (West Garo Hills) Regulated Market, each district
has traditional non-regulated rural markets established at the block level. The
periodicity of these markets is bi-weekly and ownership of management is mainly by
local authorities. The small and marginal farmers of nearby villages mainly sell their
produce in the local markets at block level. Being traditional establishments, all rural
markets lack basic infrastructure facilities to handle fresh produce.
Annexure 2
146 Value Chain Analysis of Select Crops in North Eastern States
Block Markets
Amlarem Dawki
Baghmara Emangiri
  Sibbari
Betasing Ampati
Chokpot Chokpot
Dadenggiri Dadenggiri
  Romagal
Dalu Dalu
  Purakhasia
Dambo Rongjeng Rongjeng
Jirang Jirang
  Patharkhmah
Kharkuta Adokgiri
  Kharkutta
Khliehriat Khliehriat
  Umkiang
Laitkroh Laitlyngkot
Laskein Raliang
  Shangpung
Mairang Kynshi
  Mairang
Mawkyrwat Mawkyrwat
Mawphlang Mawngap
  Sohiong
Mawryngkneng Mawryngkneng
  Smit
Mawshynrut Riangdo
  Shallang
Mawsynram Mawsynram
  Tyrsad
Mylliem Iewduh(Shillong)
  Mawiong Regulated Market
Nongstoin Nongstoin
  Rambrai
Pynursla Pynursla
Ranikor Balat
Resubelpara Bajengdoba
  Mendipathar
Ronggara Maheshkhola
  Ronggara
Rongram Rongram
  Tura
Samanda Rongsak
  Samanda
Samanda Williamnagar
Selsella Garobadha Regulated Market
Shella-Bholaganj Shella
Block-wise Listing of Markets in the State
147
Post-harvest and Marketing Infrastructure Status in Mizoram
Food Processing Plant, Sairang, Aizawl1.	
Input Annual Input Capacity (Quintals) Product
Pineapple 1200 Squash
Orange 2500 Squash
Passion Fruit 2300 Squash
Bamboo Shoots 2000 Canned
Others 1200 Tidbits, RTS, beverages
Total 9200
Fruit Juice Concentrate Plant, Chhingchhip2.	
Input Annual Input Capacity (TPA)
Pineapple 250
Orange 400
Passion Fruit 1120
Total 1770
Both of the above facilities are underperforming currently, they are underutilised and in huge
monetary loss. They are not able to pay the farmers in full for the procured raw materials.
Multipurpose Pack house at Horticulture Complex3.	
Cold store (40MT)™™
Sorting grading (2.5 MT/hr)™™
Washing, crushing, waxing and packaging facility™™
This was constructed last year and has been now leased out to Shimla Hills Pvt. Ltd. @ a rent
of ` 50,000 per month.
Block Markets
Songsak Songsak
Thadlaskein Jowai
  Khanduli
Thadlaskein Nartiang
  Wahiajer
Tikrikilla Raksamgiri
  Tikrikilla
Umling 20th Mile
  Byrnihat
Umling Nongpoh
  Umden
Umsning Umroi
  Umsning
Zikzak Kalaichar
  Mahendraganj
Annexure 2
148 Value Chain Analysis of Select Crops in North Eastern States
Small cold storage at4.	
Champhai™™
Serchhip™™
Aizawl™™
These cold stores are meant for spice storage but are not being used optimally.
Wholesale and rural primary markets5.	
There are 10 wholesale and 85 rural primary markets constructed by MAMCO. MAMCO
charges nominal rent from the tenants.
Wholesale Markets
Sl. No. Name of the Wholesale Market Location with District
1 Variengte Vairengte, Kolasib District
2 Kanhmun Kanhmun, Mamit District
3 Bairabi Bairabi, Kolasib District
4 Champhai Champhai, Champhai District
5 Hunthar Aizawl, Aizawl District
6 Ngaizel Ngaizel, Aizawl District
7 New Market Dawrpui Dawrpui, Aizawl District
8 Mission Vengthlang Mission Vengthlang, Aizawl District
9 Zemabawk North Zemabawk, Aizawl District
10 Farkawn Farkawn, Champhai District
Rural Primary Markets
Sl. No. Name of the Rural Primary Market Location with District
1 Khumtung Khumtung, Serchhip
2 Chhingchhip Chhingchhip, Aizawl District
3 Tlungvel Tlungvel, Aizawl District
4 Saitual Saitul, Aizawl District
5 Zawlnuam Zawlnuam, Mamit District
6 Khawzawl Dinthar Khawzawl, Champhai District
7 Kamalanagar Kamalanagar, Lunglei District
8 Khawzawl Hermon Khawzawl, Champhai District
9 Mamit Mamit, Mamit Dist.
10 Tlabung Tlabung, Aizawl Dist.
11 Khanpui Khanpui, Aizawl Dist.
12 Darlawn Darlawn, Aizawl Dist.
13 Bilkhawthlir Bilkhawthlir, Kolasib Dist.
14 Serchhip Serchhip, Serchhip Dist.
15 Saiha Saiha, Saiha Dist.
16 Lawngtlai Lawngtlai, Lawngtlai Dist.
17 Zokhawthar Zokhawthar, Champhai Dist.
18 Bukpui Bukpui, Kolasib Dist.
149
Sl. No. Name of the Rural Primary Market Location with District
19 Baktawng Vengpui Baktawng, Serchhip Dist.
20 Seling Seling, Aizawl Dist.
21 Zanlawn Zanlawn, Aizawl Dist.
22 Sairang Sairang, Aizawl Dist.
23 Kawnpui Kawnpui 'N' Kolasib Dist.
24 Luangmual Luangmual, Aizawl Dist.
25 Aibawk Aibawk, Aizawl Dist.
26 Khabung 'S’ Khaaabung 'S' Chamhai Dist.
27 Chawlhhmun Chawlhhmun, Aizawl Dist.
28 Pukpui Pukpui (Lunglei )
29 Haulawng Haulawng, Lunglie
30 Kawlkulh Kawlkulh, Champhai Dist.
31 West Phaileng W. Phaileng, Mamit Dist.
32 Thenzawl Thenzawl, Serchhip Dist.
33 Khuangleng Khuangleng, Champhai Dist.
34 Keifang Keifang, Aizawl Dist.
35 Tuikual 'N' Tuikual 'N', Aizawl Dist.
36 Tuipang Tuipang, Saiha Dist.
37 Bualpui 'NG' Bualpui 'NG', Lawntlati Dist.
38 Pangzawl Pangzawl, Lunglei Dist.
39 Chawngtlai Chawngtlai, Champhai Dist.
40 Durtlang Durtlang, Aizawl Dist.
41 Sihphir Vengthar Shiphir Vengthar, Aizawl Dist.
42 Durtlang Durtlang, Aizawl Dist.
43 Sialhawk Sialhawk, Champhai Dist.
44 N.Vanlaiphai N.Vanlaiphai, Serchhip Dist.
45 Darlak Darlak, Mamit Dist.
46 Tlangsam Tlangsam, Champhai Dist.
47 Tawipui 'S' Tawipui 'S', Lunglei Dist.
48 Sawleng Sawleng, Aizawl Dist.
49 Sangau Sangau, Lawntlai Dist.
50 Reiek Reiek, Mamit Dist.
51 Zotlang Zotlang, Aizawl Dist.
52 Nursery Veng Nursery, Aizawl Dist.
53 Republic Veng Republic, Aizawl Dist.
54 Chawnpui Veng Chawnpui veng, Aizawl Dist.
55 Dinthar Dinthar, Aizwla Dist.
56 Khawruhlian Khawruhlian, Aizawl Dist.
57 Zobawk Zobawk, Lunglei Dist.
58 Hrangchalkawn Hrangchalkawn, Lunglei Dist.
59 Thualthu Thualthu, Lunglei Dist.
60 Thingsai Thingsai, Lunglei Dist.
61 S. Vanlaiphai S.Vanlaiphai, Lunglei District
62 Lungsen Lungsen Lunglei Dist.
63 Diltlang 'S' Diltlang 'S', Lawngtlai Dist.
Annexure 2
150 Value Chain Analysis of Select Crops in North Eastern States
Turmeric processing facility in Khopai village, Saiha District: 400 kg turmeric per month is6.	
being processed here.
Farmers are not getting the full benefit due to poor market accessibility. Transportation
facilities are also limited and there are difficulties due to hilly terrain. It takes longer duration
to reach the destination. Transportation costs are also very high. Connectivity with the major
markets like Guwahati and Kolkata is also limited. Farmers are getting a larger pie of good
purchasing power parity of people in Aizawl town.
Traders and contractors from Cachar, Silchar and Karinganj in Assam visit the farmers and
negotiate with them to buy the produce. Farmers don’t have control on the price offered to
them. Most of the farmers grow ginger but in the current season, prices went as low as ` 5/
kg for them and they are in a difficult situation. There is no growers’ group as such for the
major crops such as mandarin, pineapple, banana, grape, passion fruit etc.
MIFCO has no forward linkage with renowned groups such as Coca-Cola, Pepsi or Dabur etc.
so that they can supply the finished products to them. Marketing strategy and promotional
activities of MIFCO are very poor. Due to this their produce keeps lying at the store for long
duration and they are not able to pay the farmers.
Sl. No. Name of the Rural Primary Market Location with District
64 M.Kawnpui M.Kawnpui, Lawngtlai Dist.
65 Ngopa Ngopa, Champhai Dist.
66 Vaphai Vaphai, Champhai Dist.
67 Hnahlan Hnahlan, Champhai Dist.
68 Biate Biate, Champhai Dist.
69 Khawhai Khawhai, Champhai Dist.
70 N.E. Khawdungsei N.E Khawdungsei, Champhai Dist.
71 Keitum Keitum, Serchhip Dist.
72 Khawlailung, Khawlailung, Serchhip, Dist.
73 Sihhmui, Sairang Sihhmui Sairang, Aizawl Dist.
74 Muallungthu Muallungthu, Aizawl Dist.
75 Sateek Sateek, Aizawl Dist.
76 Ratu Ratu, Aizawl Dist.
77 Buarpui Buarpui, Lunglei Dist.
78 Vanhne Vanhne, Lunglei Dist.
79 Zawngling Zawngling, Saiha Dist.
80 Kawlchaw 'W' Kawlchaw 'W' Laungttai Dist.
81 Rawpuichhip Rawpuichhip, Mamit Dist.
82 Mualkawi Mualkawi, Champhai Dist.
83 Chhawruit Chhawrtui, Champhai Dist.
84 Suangpuilawn Suangpuilawn, Aizawl Dist.
85 Bilkhawthir 'W' Bilkhawthir 'W' Kolasib Dist.
86 Dulte Dulte, Champhai Dist.
87 Bungtlang Bungtlang, Serchhip Dist.
151
Nagaland
Post-harvest and Marketing Infrastructure Status in Nagaland
The total cold storage capacity is 6150 MT with two multipurpose cold storages in Nagaland,
one co-operative and the other privately owned. Following are the details:
Marcofed Cold Storage in Dimapur – Capacity 1150 MT1.	
Private Cold Storage in Dimapur- Capacity 5000 MT2.	
Since pineapple is a major crop of the region, a collection centre to collect the fruit from
nearby villages has been set up by the Government at Jharnapani (in Dimapur).
There are two pineapple processing units which carry out pineapple slicing and canning and
sell in the nearby markets:
Naandi foundation has one pineapple processing centre in Medziphema run by™™
women members of SHGs.
Zhimoni food processing centre in Dimapur.™™
List of Existing Markets in Nagaland
Annexure 2
WSM: Wholesale Market RPM: Rural Primary Market AM: Apni Mandi
152 Value Chain Analysis of Select Crops in North Eastern States
APMC Wholesale Markets in Nagaland
Dimapur NSAMB Market Complex
Facilities available:
Godowns – 61.	
Traders Chambers – 62.	
Auctions plat forms with tin roofing – 1 unit3.	
Shops – 2 units4.	
Canteen – 1 unit5.	
Market Yard 15,000 sq ft (Cemented)6.	
Bath room cum latrine – for publics – 4 units7.	
Conference room, 30 x 60 ft fully air condition – 18.	
Office complex separate9.	
Spices drying unit – 110.	
Animal feed block making – 1 unit11.	
Waste disposal unit – 10 x 60 x 8 ft – 1 unit12.	
Electronic Weight bridge – 20 MT capacity – 1 unit13.	
Water supply available14.	
Electricity available15.	
Wokha APMC Market complex
Facilities available:
Godown – 3 (20 x 30) capacity1.	
Drying Yard – 42.	
Auctions platforms with tin roofing – 1 unit3.	
Trader chamber – 14.	
Vehicle parking yard available5.	
Electronic weight bridge – 20 MT capacity available6.	
Spices drying machine – available7.	
Office complex separate8.	
Conference room available9.	
Electricity available10.	
Public latrine – available11.	
Water facilities available12.	
Mokokchung APMC Complex
Facilities available:
Godown – 31.	
Auction Yard – 12.	
Drying Yard – 23.	
Trader chamber 24.
153
Shops – 2 units5.	
Vehicle parking yard available6.	
Water facilities available7.	
Conference room available8.	
Spices drying machine – available9.	
Electronic weight bridge – 20 MT capacity - 1 available10.	
Electricity available.11.	
Mon APMC Complex
Facilities available:
Godown – 31.	
Conference room available2.	
Traders chamber – 23.	
Auction Yard available4.	
Drying Yard – 25.	
Vehicle parking yard available6.	
Public sanitation available7.	
Electricity available.8.	
Spices drying unit – 19.	
Office complex separate.10.	
Tuensang APMC Complex
Facilities available:
Godown – 21.	
Traders chambers – 12.	
Drying Yard – 23.	
Auction Yard – 14.	
Electronic Weight Bridge – 20 MT capacity- 15.	
Public sanitation available6.	
Water facilities available7.	
Vehicle parking yard available8.	
Conference room available9.	
Spices drying machine – available10.	
Office complex separate11.	
Kohobuto APMC Complex, Dimapur
Facilities available
Godown – 21.	
Conference room available2.	
Drying Yard – 23.	
Auction platform – 14.	
Annexure 2
154 Value Chain Analysis of Select Crops in North Eastern States
Electronic Weight Bridge – 20 MT capacity available5.	
Conference room available6.	
Vehicle parking yard available7.	
Public sanitation available8.	
Water facilities available9.	
Traders’ chambers – 210.	
Spices drying machine – available11.	
Waste disposal facility – available12.	
Rural Primary Market Yards in Nagaland
Rural Primary Market Yards are there in each district of Nagaland. Following facilities are
available in Rural Primary Market Yards in Nagaland:
Office-cum-Godown1.	
Drying Yard2.	
Public sanitation facilities3.	
List of Rural Primary Market Yards are as below:
i. Kohima District
Chedema1.	
Tsemenyu2.	
Chiphobouzo3.	
Thongsu4.	
Tesophenyu5.	
Botsa6.	
Khonoma7.	
Khuzama8.	
Zhadima9.	
Peducha10.	
ii. Dimapur District
Khubuto1.	
Nuiland2.	
Kacharigaon3.	
Zutovi4.	
Shikito5.	
Aqhuhuto6.	
Alosa7.	
Suhoi8.	
Domokhia9.	
Bade10.
155
iii. Peren District
Punglwa1.	
Samzuiram2.	
New Jaluki3.	
Mhainmanth4.	
iv. Wokha District
Merapani1.	
Ralan2.	
Longtsung3.	
Yamhon4.	
Baghty5.	
Bhandari6.	
Pangti7.	
Lotsu8.	
Yikhum9.	
Yimpang10.	
Yanthamo11.	
Lakhuti12.	
Changsu Old13.	
N. Longidang14.	
Okotso15.	
Liphi16.	
Liphanyan17.	
v. Phek District
Meluri1.	
Chozuba2.	
Porba3.	
Seidzu4.	
Zukitsa5.	
Chizami6.	
Chetheba7.	
Dzulhami8.	
Khuza9.	
Dupazhu10.	
Pholami11.	
Tsupfume12.	
Annexure 2
156 Value Chain Analysis of Select Crops in North Eastern States
vi. Zunhebuto District
Saptiga1.	
Ighanomi2.	
Hebolumi3.	
Kitsakita4.	
Asukhomi5.	
Kitami6.	
Akaito7.	
Mudutsughu8.	
Sapotomi9.	
vii. Kiphiri District
Kiphiri Town1.	
Amahator2.	
viii. Longleng District
Pungo1.	
ix. Mokokchung District
Asangma1.	
Longjang2.	
Tsutsung3.	
Longkhum4.	
Aliba (New camp)5.	
Tuli6.	
Mokokchung village7.	
Sungkumen8.	
Tsurang valley9.	
Waromong10.	
Chungtia11.	
Merangkong12.	
Mopongchukit13.	
Chuchuyimpang14.	
x. Mon District
Aboi1.	
Tobu2.	
Wakching3.	
Yongkong4.	
Tanhai5.	
xi. Tuensang District
Mangakhi1.	
Shamator2.
157
Chesore3.	
Panso4.	
Yakhur5.	
Apni Mandi in Nagaland
i. Kohima District
Mountain View College Colony1.	
Lerie colony2.	
Kigwema Village3.	
Viswema Village4.	
Kezikia (Kohima Town)5.	
ii. Dimapur District
Pughato1.	
Piphema2.	
Tsuma3.	
Chekiye4.	
Aghunaqa5.	
Nikhekhu6.	
iii. Peren District
Peren Town1.	
iv. Wokha District
Mungya1.	
Rachan2.	
Sanis Town3.	
Sungro4.	
Wozhuro5.	
Yanpha6.	
Longpvu7.	
Dotang8.	
Helipad9.	
Pyochu bridge point10.	
Molonsu11.	
Wokha Village12.	
v. Phek District
Phek Town1.	
Sekruzu2.	
Losami junction3.	
Sakraba4.	
Annexure 2
158 Value Chain Analysis of Select Crops in North Eastern States
vi. Zunhebuto District
Naghutomi1.	
Naltoqa2.	
Zaphu3.	
Doyang bridge Mkg. Road4.	
Surohuto5.	
vii. Longleng District
Longlen Town1.	
Tamlu Town2.	
viii. Mokokchung District
Puniboto1.	
Alichen2.	
Changtongya3.	
Yajang4.	
Yisemyong5.	
Chuchuyimlang6.	
ix. Mon District
Ukha junction1.	
Naganimora2.	
x. Tuensang District
Noklak Town1.	
Longkhim Town2.	
Post-harvest and Marketing infrastructure Status in Sikkim
Following post-harvest infrastructure facilities are available in Sikkim
Ginger Pack house at Birdang, West Sikkim1.	
Capacity: 7.5 MT/day™™
Washing, draying, grading and waxing facilities™™
Ginger crushing, separation of cake  liquid/drying and powder-making™™
Ginger oil extraction™™
Government Fruit Preservation Factory, Singtam, East Sikkim2.	
Established in 1956, manufactures orange squash, lemon squash, passion fruit squash,
tomato ketchup, tomato puree, orange, marmalade, mixed fruit jam, synthetic vinegar,
mango pickle, Dallae chilly (hot balls) pickle, Dallae chilly with bamboo shoot pickle, mixed
pickle, pineapple squash, orange juice, mango juice, pineapple juice, litchi juice, guava juice
and canned fruits and jams under the brand name of ‘Sikkim Supreme’.
Installed plant and machineries are very old and need overhauling. It is not a very profit-
making venture. Marketing linkages are not very strong. NERAMAC sold GFPF products under
its outlets all over NER.
159
Apart from these, there is one cold store in Rong Po, used for potato storage, flowers pack
houses and agriculture check posts (Rong Po  Melli) to record the inflow and outflow of
produce.
Agriculture marketing is not regulated in the states so the marketing of fruits and vegetables are
also unorganised. Largest fruits and vegetable market in Kanchanjungha Complex in Gangtok is
occupied by wholesalers/retailers. NERAMAC, SIMFED and few farmers’ groups and individuals
have outlets in the complex. There is no other facility available as per the APMC guideline.
Government made effort to organise horticulture trade by locating it under one regulated
market in East Sikkim but due to non-interest of traders it could not be implemented.
Post-harvest and Marketing Infrastructure Status in Tripura
The state lacks post-harvest infrastructure for handling, however, there is sufficient cold
storage capacity in the state. Total of 14 cold storages are there in Tripura with total capacity
of 31,450 MT.
District-wise Cold Storage Capacity in Tripura
District No. of Cold Storage Capacity Remark
North Tripura 3 5200 Multipurpose
West Tripura 7 16250 Multipurpose
Dhalai 1 2000 Multipurpose
South Tripura 3 8000 Multipurpose
Total 14 31450  
Source: Directorate of Marketing and Inspection, MoA, GoI
Out of total cold storage capacity, approximately 9750 MT of capacity has been created by
private sector and 2000 MT by cooperatives, rest cold storage capacity has been developed
by the public sector. Most of the capacity is used for storage of potato.
At present, there are 21 regulated markets in Tripura, of which 9 are in West Tripura district,
6 in South Tripura and 3 each in Dhalai and North districts.
Sl.
No.
District No. of Regulated
Markets
Locations
1 West 9 Mohanpur, Bishalgarh, Champaknagar, Teliamura, Bechaibari,
Melagar, Sonamura, Kalyanpur, Jumpuijala
2 South 6 Garjee, Santirbazar, Barpathari, Kalashi, Nutanbazar, Silachari
3 Dhalai 3 Chawmanu, Gandachara, Kulai
4 North 3 Dasda, Pabiachhara, Panisagar
Although a sufficient number of regulated markets are present in Tripura, these
markets are not functioning properly due to the various shortcomings like inefficient
management systems, lack of infrastructure for the perishable products in the market etc.
In addition to the regulated markets, there is large number of non-regulated markets in
the state.
Theregulatedmarketsinthestatedonothavespecificinfrastructureforhandlinghorticultural
products. In addition to these regulated markets, there are 554 listed rural primary markets
and 84 wholesale assembling markets.
Annexure 2
160 Value Chain Analysis of Select Crops in North Eastern States
For fruits and vegetables, biggest wholesale markets in the state are Golbazar and Battala
markets in Agartala. Both of these markets are non-regulated markets. These two markets
serve to Agartala as well as distribution centre for whole of Tripura for products coming from
other states. There are around 30-35 commission agents and wholesalers in the Golbazar
market and around 15 Traders in Battala market.
Stakeholders Met During the Field Visits
Arunachal Pradesh
Director Horticulture, Itanagar™™
Deputy Director Horticulture (HQ), Itanagar™™
Asst. Director Horticulture (RD), Itanagar™™
Horticulture Marketing Officers, Itanagar™™
Director, AP Agriculture Marketing Board (APAMB), Itanagar™™
District Horticulture Officer, Papum Pare District™™
Horticulture Development Officers, Yupia, Papum Pare District™™
District Horticulture Officer, Lower Subansiri District™™
Horticulture Development Officers, Lower Subansiri District™™
Wholesaler’s/Retailer’s (10), Papum Pare Regulated Market, Itanagar™™
Farmers’ FGDs (2) at Yupia (Papum Pare)  Ziro- Lower Subansiri™™
Assam
Director – Horticulture and Food Processing™™
Deputy Director – Horticulture and Food Processing™™
K K Choudhary – Superintendent Engineer, Agriculture Engineering Department™™
Horticulture Statistics Inspector – Directorate of Horticulture™™
Ashok Kr. Sharma – Executive Engineer – Cold Storage, Agriculture Engineering™™
Department
G. Baishya – Packhouse Division, Assam Industrial Development Corporation™™
Dilip Bora, District Agriculture Officer, Kamrup™™
Agriculture Development Officers of Boko, Khetri, Bongaon, Goroimari and Rani™™
Agriculture Information Officer, Kamrup™™
Secretary, APMC Bijoynagar, Kamrup™™
Wholesalers, retailers and commission agents (15), Machkhowa and Fancy Bazar,™™
Guwahati
Farmers’ FGD (2) in Bongaon and Boko (Kamrup)™™
Meghalaya
Director Horticulture, Shillong™™
Deputy Director Horticulture, Shillong™™
Horticulture Development Officer (Marketing), Shillong™™
Secretary, Meg. State Agriculture Marketing Board, Shillong™™
District Horticulture Officer, East Khasi Hills™™
Asst. Director of Horticulture (Fruit Preservation Unit), Shillong™™
161
Supervisor (Fruit Preservation Unit), Shillong™™
Block Development Officer (Horticulture), Sohara Block, East Khasi Hills™™
Horticulture Development Officer, Sohara Block, East Khasi Hills™™
Block Development Officer (Horticulture), Pynursala Block, East Khasi Hills™™
Asst. Director Horticulture, Jaintia Hills™™
Horticulture Development Officer, Jaintia Hills™™
District Horticulture Officer, Ri Bhoi District™™
Horticulture Development Officer, Ri Bhoi District™™
Traders (5), Mawoing Regulated Market, Shillong™™
Wholesaler’s/Retailer’s (10), Bara Bazar (Iewduh), Shillong™™
Farmers’ FGDs (5) at Sohara  Pynursala (East Khasi Hills), Jowai (Jaintia Hills) and™™
Ri Bhoi
Manipur
Mr. K. Ngaciken, Director – Horticulture, Government of Manipur (Mb. 09436021887)™™
Mr. Ratan Kumar – Head, Horticulture Technology Mission, Manipur™™
Mr. Kipchen (Joint Director  Incharge NVI, Government of Manipur) (for further™™
information – Mr. Iboton PA to joint director – 09436603076)
Dr. Suresh Kumar Methi – KVK Programme Coordinator, Tamenglong (Mb. 09206176715)™™
Tawa Fruits – Lemon processors™™
Mrs. Rehma – KVK Programme Coordinator, Imphal™™
Mr. R. K. Darendrajit Singh (Superintendent – Custom Preventive Force  LCS, Moreh) –™™
(Landline 038722 264238, Mb. 09436025417)
Mr. Holichand, Inspector, LCS Moreh (Mb. 09402757179)™™
Dr. S. S. Roy, Horticulture expert, KVK, Imphal (09436891040)™™
Nagaland
Sl. No. Name Post Address Contact No.
1 Dr. N. Benjong Aier Joint Director Kohima 9436002381
2 Mr. Pawan Kumar Deputy Director - Planning Kohima 9436437806
3 Ms. Mesetuonuo Deputy Director Kohima 9856162465
4 Mr. Jerry Patton Divisional Horticulture Officer Kohima 9436009026
5 Mr. Engyol Divisional Horticulture Officer Dimapur 9856051130
 6 Mr. Temsu Longkumer Area Horticulture Officer Dimapur 9436004486
7 Mr. Mishento Divisional Horticulture Officer Peren 9436422004
8 Dr. Akali Sema Director - CIH Medziphema 03862-247707
9 Mr. Prabin Kumar Marketing Officer - CIH Medziphema 03862-247707
10 Mr. Gimzie Secretary-APMC Jalukie, Peren 9436018340
11 Mr. Loanry Horticulture Extension Officer Gaili, Peren 9856537260
12 Mr. Kishor Marketing Officer - ICCOA Dimapur 9401169719
13 Ms. Abea Mero MD, Naga Spices Pvt. Ltd. Dimapur 9856125529
14 Mr. Duolo Director - Kuda Cold Storage Dimapur 9436008303
15 Mr. Velsete Manager - Kuda Cold Storage Dimapur 9612836651
16 Wholesalers and retailers (10) at wholesale and retail markets in Dimapur
17 FGD with farmers at Molvom, Dimapur (1); Kohima (1) and Gaili, Peren (1)
Annexure 2
162 Value Chain Analysis of Select Crops in North Eastern States
Mizoram
Sl. No. Name Post Address Contact No.
1 Mr. Samuel Rosanglura Principal Director Aizawl 9436140587
2 Mr. R Zotawna Joint Director Aizawl 9436149232
3 Mr. T. Llankunga  HDO HMNEH
Deputy Director - Planning
Aizawl 9436151320 
4 Mr. Moantya Divisional Horticulture Officer Aizawl 9436144012
5 B. Lalchariliana AHEO Aizawl 8575567779
6 H. Lalpiaumama HDO Aizawl 8014529618
7 Mana Samto Field Consultant Aizawl 9856681789
8 Sangzuala Manager-Project Aizawl 2322180
9 Wholesellers/retailers (8) in Aizawl
10 FGD with farmers (1) at Thiak village in Aizawl
Sikkim
Principle Director, Horticulture  Cash Crop Development Department, Sikkim™™
Deputy Director (Projects), Horticulture  Cash Crop Development Department,™™
Sikkim
Deputy Director (Project ME), Horticulture  Cash Crop Development Department,™™
Sikkim
Deputy Director (Plasticulture  Mrktg.), Horticulture  Cash Crop Development™™
Department, Sikkim
Pack-House Incharge, Tadong, Gangtok™™
District Government official (East District  South District)™™
SIMFED, Gangtok™™
NERAMAC, Gangtok™™
Wholesalers and retailers in Gangtok™™
Farmers FGD (2) in East and South Districts™™
Tripura
Mr. P. B. Jamatia, Joint Director, Department of Horticulture, GoT (Mb. 09436455259)™™
Dr. S. P. Das, In-charge-Horticulture, ICAR Research Complex, Agartala™™
Mr. N. S. Das, Agriculture Section Officer, Bishanganj Agri Sector (Mb. 09436126731)™™
Mr. Chandra Mohan Deb, Agriculture Inspector, Bishanganj Agri Sector (Mb. 9612283641)™™
Mr. R. P. Malik, Managing Director, Tripura Horticulture Corporation Ltd.™™
Dr. Deepak Vaidya, Superintendent of Horticulture, South Tripura  Food™™
Technologist
Mr. M. L. Devnath, President, Tripura Chamber of Commerce and Industries™™
Mr. Gautam Roy, Export-Import business™™
Farmers meeting at field (Bastuli ADC village)™™
Wholsalers and retailers meeting at Agartala™™
Literature Reviewed
Vision 2020 ADB’s Trade  Investment Strategy – and how to create spillover from™™
India’s NorthEast Achievements  Future Direction; Hans Peter Brunner, Senior
Economist, ADB, 2008
Preparing the North Eastern States Trade  Investment Creation Initiative; prepared™™
fro ADB by Global Development Solutions
Prospectus for setting up rural business hubs in North East by Access Development™™
Services
Agriculture – Annual Report 2010-11 by Ministry of Agriculture™™
Agriculture Value Chain Finance Strategy and Design by FAO™™
ASAMB Five Year Plan 07-12 by Assam State Agriculture Marketing Board™™
An Indepth Study and Impact Assessment Report by SFAC™™
Mizoram: Export Potential and Prospectus by EXIM Bank™™
Sikkim: Export Potential and Prospectus by EXIM Bank™™
Diversity of Ginger Cultivation in India by Indian Society for Spices™™
Traditional practices of ginger cultivation in Northeast India by ICAR Research Complex™™
for NEH Region, Gangtok
Ginger by Agri Exchange, APEDA™™
ICCOA Project in Nagaland™™
North East Region: Vision 2020 by MoDoNER  NEC™™
North East – Harnessing Agribusiness Potential: YES Bank Report for MoDoNER™™
 Report on North East India: Dorabji Tata Trust™™
Annual Report – 2009-10: Spice Board of India™™
 Imparting skill development training to the Lakadong turmeric farmers of the Jaintia™™
Hills of Meghalaya by by Prof. Debjani Roy and Dr. Jayashree Kurup
Vision – 2025 by Indian Institute of Horticulture Research, Banglore™™
Package of Organic Practices from Assam, Manipur, Meghalaya  Nagaland for™™
Arecanut, Ginger, Large Cardamom, Passion Fruit and Pineapple; North Eastern
Region Community Resource Management Project for Upland Areas (NERCORMP)
(IFAD  GOI/DoNER/NEC) Shillong, September 2006
North East India Local Economic Development and Global Markets™™
Editorial Team
Pravesh Sharma™™
D. Bhuyan™™
M.J. Das™™
Case Study Preparation
Alok Kumar Srivastava, Team Leader™™
Sunil Kumar™™
Gaurav Vats™™
Om Prakash™™
This document is a public resource and may be freely quoted and excerpted. However, any
form of commercial exploitation is prohibited.
NOT FOR SALE
© Small Farmers’ Agribusiness Consortium (SFAC), New Delhi, 2012.
Design and Print: Macro Graphics Pvt. Ltd. www.macrographics.com
Note for Readers
This study has been conducted on behalf of SFAC by Indian Society of Agribusiness
Professionals (ISAP). Due diligence has been exercised by the consultant to obtain authentic
secondary data and conduct field studies and interviews in a professional manner. The
analysis and conclusions drawn are also made in an objective and fair manner. All original
records related to the study are available with ISAP.
SFAC encourages all readers to bring any factual errors in this publication to our attention.
SFAC value chain-analysis

SFAC value chain-analysis

  • 5.
    Contents Chapter 1: Introduction1 Project Background 2 Objectives 2 Scope of Work 2 Approach and Methodology 3 Significance of Value Chain Analysis Study 5 Chapter 2: The North East Region: An Overview 7 Strategic Location 7 Topography and Agro-Climatic Characteristics 7 Connectivity/Logistics 7 Demographic and Socioeconomic Characteristics 8 Agriculture 10 Swot Analysis of Agribusiness Scenario in North East Region 11 Chapter 3: Horticulture Scenario in North East Region 13 State-wise Profile 15 Arunachal Pradesh 15 Assam 19 Manipur 23 Meghalaya 26 Mizoram 30 Nagaland 33 Sikkim 37 Tripura 41 Chapter 4: Identification of Focus Crop Groups 45 Product-wise Contribution of States in Ner Production Basket (2010-11) 46 Product-wise Contribution of States in Ner Production Value (2010-11) 47 Identified Focus Crop Groups Based on the Parameters Identified for Selection Criteria 49 Identified Production Clusters of FCGs 50 Seasonality of Selected FCGs 51 Chapter 5: Value Chain Analysis 53 Pineapple 53 Assam 54 Tripura 56 Meghalaya 59 Nagaland 60 Citrus 64 Assam 64 Manipur 69 Meghalaya 71 Sikkim 73
  • 6.
    iv Value ChainAnalysis of Select Crops in North Eastern States Ginger 75 Assam 75 Meghalaya 77 Sikkim 79 Turmeric 81 Assam 81 Meghalaya 82 Mizoram 84 Naga Chilli 86 Nagaland 86 Passion Fruit 87 Nagaland 88 Kiwi Fruit 89 Arunachal Pradesh 90 Large Cardamom 92 Sikkim 92 Vegetables 93 Assam 94 Meghalaya 103 Conclusion 107 Chapter 6: Benchmarking with Existing Best Practices 109 Pineapple 109 Mandarin 110 Ginger 111 Turmeric 111 Chapter 7: Conclusion Recommendations 113 Land Tenure and Ownership System 113 Poor Cultivation Practices and Low Productivity 113 Poor and Weak Extension System 114 Poor Logistics and Connectivity 114 Poor Marketing and Post-Harvest Infrastructure 115 Lack of Processing Industries 115 Recommendations 116 Pineapple 116 Citrus 118 Ginger 120 Turmeric 122 Vegetables 123 Naga Chilli 124 Passion Fruit 124 Kiwi Fruit 125 Large Cardamom 125 Annexure 1 126 Annexure 2 133 Literature Reviewed 163
  • 7.
    LIST OF ABBREVIATIONS AGMARKNET Agricultural Marketing Information Network APMC Agricultural Produce Marketing Committee FCGs Focus Crop Groups FGDs Focussed Group Discussions GDP Gross Domestic Product ha Hectares ISAP Indian Society of Agribusiness Professionals KVK Krishi Vigyan Kendra MAPs Medicinal Aromatic Plants MoDoNER Ministry of Development of North Eastern Region MSL Mean Sea Level MT Metric Tonnes NE North East NEC North Eastern Council NEDFi North Eastern Development Finance Corporation Ltd. NER North Eastern Region NERAMAC North Eastern Regional Agricultural Marketing Corporation Limited NHB National Horticulture Board SFAC Small Farmers’ Agribusiness Consortium VCA Value Chain Analysis
  • 9.
    Preface The North Eastregion of India, comprising of the state Assam, Arunachal Pradesh, Manipur, Meghalaya, Mizoram, Nagaland, Tripura and Sikkim, is a reservoir of rich natural resources. All the North-Eastern States have distinct advantages, and provide immense economic and trade opportunities to domestic and international players. The NE region shares borders with China in the north, Bangladesh in the South-West, Bhutan in the North-West and Myanmar in the East. This makes the North-East a prospective hub of international trade and commerce. Unlike the rest of India, North East India has an added demographic advantage, in the sense that it occupies 7.8 percent of the country’s total land space but has a population of only 44 million, which makes it approximately 3.80 percent of the country’s population. Blessed with rich biodiversity, conducive agro climatic conditions, forest wealth, fruits and vegetables, flowers, herbs and aromatic plants, rare and rich flora and fauna, NE India has all the potential to transform into a commercial horticulture hub. The area is a vibrant source of varied horticultural crops, which can be linked to distant markets within the country as well as for export. Horticultural crops in the NE region cover 857 thousand ha, constituting 2.34% of the total horticulture area in the country. From the production point of view, NE region produces about 7815 thousand MT of horticulture produce and contributes 6.79% to the total production basket of the country. Major horticultural crops grown in the NE region include citrus, pineapple, kiwi, mango, guava, litchi, banana among fruits, potato, onion, tomato, cauliflower, cabbage, brinjal, beans among vegetables, chrysanthemum, rose, orchids etc. in flowers, ginger, turmeric large cardamom, coriander, cumin among spices and cashew nut, arecanut and tea among plantationcrops.TheproductivityofmanyofthehorticulturalcropsinentireNEregionismuch below the National level. This weakness of the region can be converted into an opportunity, and productivity and production levels can be increased significantly to enhance the total production at national level, to meet the ever-growing demand for horticulture produce. Since horticulture provides higher return per unit of land and generates higher employment, development of horticulture also helps in alleviating the economic condition of people below the poverty line. However, despite these distinct advantages, North-East horticulture has not grown at par with the rest of the country, and the region’s horticulture potential has not been tapped, mainly due to lack of market led production practices, poor commercial understanding of farmers, insufficient infrastructure at the farm level, poor transportation system, inadequate road network, lack of post harvest infrastructure like dedicated markets, pack houses, cold storages, sorting grading lines, processing industries etc. Due to the lack of adequate post harvest infrastructure in the region, not only are post harvest losses high, but dependency of farmers on intermediaries for marketing is very high.
  • 10.
    viii Value ChainAnalysis of Select Crops in North Eastern States With significant initiatives taken by the Government of India to promote horticulture development in the North-East region, appropriate strategies like adoption of market- driven production system, enhancement of productivity, appropriate post-harvest handling through proper packaging, loading/unloading of commodities and promotion of pack house concept including collection centre in the production clusters, cold storage, processing and value addition, creation of adequate transportation infrastructure and organised marketing system are necessary additions to current interventions to provide remunerative prices to farmers. With necessary infrastructure development within the region, and the building of connecting links between North-East and the rest of India, and North-East and South-East Asia, the horticulture potential of the region can be suitably exploited. Time-bound implementation of projects, monitoring of fund–flows and necessary marketing and branding of the region can truly transform this goldmine region into a vibrant hub of horticulture business and trade. ThisvaluechainstudybySmallFarmers’AgribusinessConsortiumisaninitiativetounderstand the working of the production and supply chain of major high value works in the NE region and recommend or strategy to achieve the goal of making the North-Eastern region a true horticulture hub, not only of India but of the entire South-East Asian region.
  • 11.
    C hap te r Introduction 1 The North Eastern Region (NER) of India includes the states of Arunachal Pradesh, Assam, Manipur, Meghalaya, Mizoram, Nagaland, Sikkim and Tripura. The eight states share a number of attributes such as frontier locations, rich natural resources, variety in agro- climatic conditions and inherited potential of growing various types of crops. Out of a total geographical area of the region, 65% is under undulating tracks and hills and remaining 35% is plain. The North Eastern Region falls under the high rainfall zone and the climate ranges from tropical to alpine. The region is physiographically characterised by difficult terrain, wide variations in slopes and altitudes and traditionally indigenous cultivation practices. Agriculture constitutes of 26% of the total GDP of NER and is one of the major contributors to the economy of North Eastern States, engaging one-third of the total work force in the region. The eight contiguous states of undulating terrains cover a total geographical area of 2.62 lakh Sq Km, out of which the gross cultivable area is 65,500 Sq Km. Paddy and maize dominate the rain-fed hill ecosystem, however, in selected areas, horticulture is emerging as a primary source of income for the farmers due to conducive physiographic conditions of the region. Assam and Tripura are the major states producing fruits and vegetables, with Assam leading with a contribution of 60 percent to the total horticulture produce of NER. State-wise share of horticulture in NER is as follows: Assam 60% Arunachal Pradesh 4% Manipur 7% Meghalaya 9% Mizoram 1% Nagaland 2% Tripura 15% Sikkim 2% Figure 1: State-wise Contribution to Horticulture in NER Source: ISAP Analysis NHB Data, 2011
  • 12.
    2 Value ChainAnalysis of Select Crops in North Eastern States Project Background North East Region is endowed with diverse agro-climatic conditions which are conducive for cultivation/production of varied horticultural crops. Though NER has the potential to achieve maximum productivity, but it has not been capitalised so far because of various factors In order to evolve a strategic module for the wholesome development of horticulture, there is a need to identify gaps, efficiency levels, inherited advantages across value chain of potential horticultural crops of the North Eastern region. With this background, Small Farmers’ Agribusiness Consortium (SFAC) has decided to conduct a detailed value chain study of Focussed Crop Groups (FCGs) of North Eastern Region and has engaged the Indian Society of Agribusiness Professionals (ISAP) for this purpose. The study comprises of mapping of main and supporting activities of production, post-harvest operations, logistics, marketing and services etc. Objectives The specific objectives of the Value Chain Analysis were as follows: To map the movement of price and journey of the raw materials from farmers to™™ commission agent, traders, processors, wholesalers, retail chains and ultimately to the end consumer; To track the food miles;™™ To identify the location of the proposed collection centres in terms of the sustainable™™ supply and profitability; To locate and pin point possible collection centres for the above mentioned crop™™ groups; To develop the proposed crop calendar: Activity calendar from sowing to harvesting™™ across various months; To calculate the number of man-days utilised for various crop groups in the district;™™ To separate peak and off season of focus crop groups;™™ To study particular crops from the view point of various stakeholders such as farmers,™™ traders, consumers etc. Scope of Work The following six focus crop groups have been identified for detailed value chain mapping and analysis: Root spices – Ginger/turmeric1. Citrus – Mandarin/oranges and lemon2. Pineapple3. Naga Chilli4. Vegetables – Legumes, solanaceous, cruciferous, cucurbitaceous and others5. Others – location-specific crop groups6. The project entailed studying the primary and supporting value chain activities for each of the six focus crop groups. The following activities were mapped under the project:
  • 13.
    3Chapter 1 |Introduction Primary Value Chain Activities Inbound logistics™™ Operations™™ Outbound logistics™™ Marketing and sales™™ Service™™ Supporting Value Chain Activities Procurement™™ HRM™™ Technology development™™ Infrastructure™™ Approach and Methodology Approach As the scope of study required in-depth understanding of the product flow, its treatment at each level, price markup, roles being played by each value chain player as well as factors affecting the value chain, ISAP has adopted a combination of research tools including secondary and primary research followed by quantitative and qualitative assessment for comprehensive analysis to achieve the desired results and objective of the study. Methodology Secondary Research This step served as a prefix of study, providing basic understanding of regions and helped in developing the approach for the next stage of the study. Secondary information helped in understanding the crop profile of catchment areas, existing levels of production, marketing infrastructure available for focus crops groups as well as infrastructure facilities for logistics, storage and marketing. The following data sources were targeted for collecting various data and information: Data gathering from NHB, AGMARKNET, NEDFi, NERAMAC, State Horticulture Deptt.™™ and other database to ascertain: Current production, surplus, domestic international tradeƒƒ Information on current status of the infrastructure basic facilitiesƒƒ Literature study on current supply value chains™™ Primary Research and Qualitative Assessment An interaction was held with all the stakeholders in the identified belts and region and focus group discussions helped to gather information on the situation of horticulture across the value chain. This has lead to finding out the gaps and suggestions provided by all the stakeholders.
  • 14.
    4 Value ChainAnalysis of Select Crops in North Eastern States The following stakeholders across the value chain of horticulture produce were targeted in the identified clusters: Farmers™™ Intermediaries™™ Commission agents, wholesalers and retailers™™ Service providers (logistics, storage, pack houses)™™ Govt. officials including horticulture department, KVKs, APMCs, research stations,™™ academic institutes etc. The stakeholders were selected on the basis of secondary information on area and production, as well as by interacting with the state government officials. Interactions were either facilitated by the government officials at the local level or were introduced for getting desired information and inputs. In addition to the line department of the state governments, meetings were held with other concerned agencies/organisations/institutions involved directly or indirectly in the production and marketing of selected crops. Focus Group Discussions (FGDs) Two to three FGDs in each identified cluster of focus crop groups was conducted in each state. A focus group comprised of 8-10 people, in some cases it was a homogenous group comprising of crop producers, while in some cases, it was a heterogenous group and comprised of prominent stakeholders. In each focus group there were 4-5 focus crop growers, 1-2 grower/s willing to grow in future and 2-3 extension worker/marketing service providers. FGDs were conducted to understand the value chain – production practices, technology adoption, cultivation costs, movement of product and price markup from farm gate to the local and distant markets. • Identification of area/ region of study for each focus crop groups • Literature Study on current supply value chains • Focussed Group Discussions (FGDs) with farmers • Focussed Group Discussions (FGDs) with Traders • Validation of data by means of in-depth interviews with all value chain actors • Analysis of Secondary Primary Data • Draft Report Submission • Feedback incorporation • Finalisation of report Compilation Final Report Submission Analysis Report Writing Validation of Data Primary Research Secondary Research Week 0-6 Week 6-8 Week 8-10 Week 6-14 Week 14-16 Figure 2: Approach Methodology
  • 15.
    5Chapter 1 |Introduction In-depth Interviews Discussion and in-depth interviews were held with state government officials, experts and policy makers. Analysis, Compilation and Report Writing The following steps were followed for report writing: Secondary data analysis™™ Analysis of in-depth interviews and FGDs™™ Compilation of data and analysis™™ Draft report writing™™ Significance of Value Chain Analysis Study Value Chain Analysis Study helps to map the value chain of a specific product involving various value chain actors, which may use qualitative or quantitative approach. While the produce moves from one chain actor to another chain actor, it gains value in the form of price markup. The chain actors who actually transact a particular product as it moves through the value chain, include input dealers (e.g., seed suppliers), farmers, traders, processors, transporters, wholesalers, retailers and final consumer. The value chain framework has been used as a powerful analysis tool for strategic planning and is useful in identifying and understanding crucial aspects to achieve competitive strengths and core competencies in the marketplace. The model also reveals how the value chain activities are tied together to ultimately create value for the consumer. In order to conduct the value chain analysis, the activities are split into primary and support activities (Figure VCA Framework). Primary activities are those that are related with production, while support activities are those that provide the background necessary for the effectiveness and efficiency, such as human resource management. The primary and secondary activities are discussed in detail below: Primary activities The primary activities include the following: Inbound logistics:™™ The activities concerned with receiving the material and handling them. Operations:™™ The activities related to quality checks, processing, packaging, labelling of products etc. Outbound logistics:™™ All the activities concerned with distributing the final product to the consumers. Marketing and sales:™™ This functional area essentially analyses the needs and wants of consumers and is responsible for creating awareness among the consumers about the products and attract consumers to their products.
  • 16.
    6 Value ChainAnalysis of Select Crops in North Eastern States Support activities The support activities include the following: Procurement:™™ This function is responsible for purchasing the materials that are necessary for the operations. An efficient procurement department should be able to obtain the highest quality goods at the lowest prices. Human Resource Management:™™ This is a function concerned with recruiting, training, motivating and rewarding the workforce. Human resources are increasingly becoming an important way of attaining sustainable competitive advantage. Technology Development:™™ This is an area that is concerned with technological innovation, training and knowledge that is crucial today in order to survive. Infrastructure:™™ Thisincludesplanningandcontrolsystems,suchasfinance,accounting and corporate strategy etc. It is important to analyse the value chain with the core competence at its very heart. The nature of value chain activities differs greatly in accordance with the types of industries. The five primary activities and four support activities form an interdependent system that is connected by linkages. The first step in conducting the value chain analysis is to break down the key activities according to the activities entailed in the framework. The next step is to assess the potential for adding value, through the means of cost advantage or differentiation. Finally, it is imperative for the analyst to determine strategies that focus on activities that would enable to attain sustainable competitive advantage. Value chain analysis, specifically in case of studying various horticultural products of North Eastern region has specific relevance. The markets for most of the crops being produced or targeted for production are distant domestic markets and export markets. For a product of NER to be competitive, it is necessary to achieve price parity in these markets. Value chain, in this regard helps in defining the benchmarks for selected crops to compete in the market and therefore in the identification of key strengths, weaknesses, comparative advantages or disadvantages and analysing the efficacy and efficiency of the entire value chain as well as in finding solutions, interventions and identified challenges. With this background and adopting this approach and methodology to achieve the objective of the study, we need to study in detail the horticulture scenario of the entire NER. • Inbound Logistics • Operations • Outbound Logistics • Marketing and Sales • Procurement • Technology Development • Human Resource Management • Infrastructure The difference between the total value and the cost of performing the value activities Added Value or Prices Support Activities Primary Activities Figure 3: VCA Framework
  • 17.
    C hap te r The North East Region: An Overview 2 The region falls in the foothills of the Himalayas in the eastern range and is surrounded by Bangladesh, Bhutan, China, Nepal and Myanmar. It includes the seven states - Arunachal Pradesh, Assam, Manipur, Meghalaya, Mizoram, Nagaland and Tripura, along with a smaller state in the Himalayan fringes, namely, Sikkim. Strategic Location The location of the region is geo-politically important as it shares international boundaries with China and Bhutan in the north, Myanmar in the east, Nepal in the west and Bangladesh in the south and west. This strategic location of NER makes it the potential hub for export of horticultural produce to neighbouring countries in order to cater to their growing need. It also aids the supply of produce to distant markets in India. Topography and Agro-Climatic Characteristics The entire NE Region is located between 22°1’ and 29°31’ North latitude and 89°47’ and 98°55’ East longitude. The region is traversed by the Brahmaputra-Barak river systems and their tributaries. The topography of the area varies from mountainous to plateaus, foothills to riverine plains with altitudes ranging between 100 m to 8400 m from MSL. Being predominantly hilly terrain, altitudinal variation within limited geographical area is the characteristic feature of this region. The region is endowed with all types of climatic conditions ranging from tropical to alpine and it receives rainfall ranging from 150-250 cm. Connectivity/Logistics Air Connectivity All the states in the region are connected by air, expect Arunachal Pradesh and Meghalaya. NE Region has 10 airports, however 3 state capitals lack airport facility (Itanagar, Gangtok Shillong). Looking at the development in the region and potential for international trade with South East Asia, upgradation and improvement of air connectivity is vital.
  • 18.
    8 Value ChainAnalysis of Select Crops in North Eastern States Rail and Road Connectivity Poor infrastructure development in terms of roads, railways, waterways, power and water is the main constraint in the development of NE Region. From the trade point of view, existing rail infrastructure is mainly limited to Assam (broad gauge track). However, improvement of road infrastructure work is under progress in some states of the NE Region. The entire NE Region shares three important border roads i.e. Stilwell road or the Ledo road (connects Assam to China), the Numaligarh-Mreh road (connects Assam, Nagaland Manipur to Myanmar) and the Aizawl-Champhai-Zowkathar road (connects Mizoram to Myanmar). These border roads are crucial for the development of the NE Region. Of the three border roads, two are operational at present from the point of border trade. Proper infrastructure needs to be developed at these border points to boost trade between the countries. This in turn will benefit the entire NE Region. Discussions are in progress with the Bangladesh government to give road access for transportation of goods of Indian origin from West Bengal to Tripura through transit corridors. If such a proposal goes through, the transit time to the NE Region from other parts of the country will reduce substantially. Inland Waterways Opening of inland water route and access to the Chittagong port is important as it serves as a trade gateway for India to East Asian countries. This could provide a business basket to entire NE Region. Demographic and Socioeconomic Characteristics The eight states constitute 7.9 percent of the country’s total geographical area, but have only approximately 4% of the total population of the country. Over 68 percent of the population of the region lives in the state of Assam alone. The density of population varies from 16 per sq km in Arunachal Pradesh to 396 per sq km in Assam. State Airports Assam Guwahati, Dibrugarh, Tejpur, Jorhat, Silchar Nagaland Dimapur Manipur Imphal Tripura Agartala Mizoram Aizawl W. Bengal Bagdogra Table 1: Existing Airport Facilities in NER
  • 19.
    9Chapter 2 |The North East Region: An Overview StateArunachal Pradesh AssamManipurMeghalayaMizoramNagalandSikkimTripura Geographical Location 27.06°Nand 93.37°E. Sharesits national borderwith Nagaland andAssam towards southand international borderwith Chinatowards north,Bhutan towardswest andBurma towardseast 26.14°Nand 91.77°E,the northeastern stateofAssam liesinthe rivervalleys ofBarakand Brahmaputra. Assamis borderedby WestBengaland theotherstates oftheSeven Sistersalong withcountries likeBhutanand Bangladesh 24.817°N and93.95°E, Manipurhas gotthestateof Nagalandtoits north,Assam toitswest andMizoram toitssouth. Thestate hasevengot international bordersby Burmatoits east 25.57°Nand 91.88°E, Meghalayais surrounded bythestate ofAssamin northandthe countryof Bangladeshin south 23.36°Nand 92.0°E.This northeastern statesharesits nationalborder withAssam, Manipurand Tripuraand international borderwith Burmaand Bangladesh 25.67°Nand 94.12°E, thestateis encircledby Assamand Arunachal Pradeshinthe north,Manipur inthesouth andBurmain theeast 27.33°Nand 88.62°E,this landlocked stateofIndia liesinthe Himalayan range.Sikkim sharesits borderwith Tibettowards northandeast, Nepaltowards west,Bhutan towardssouth- eastandWest Bengaltowards south 23.84°Nand 91.28°E.This thirdsmallest Indianstate isbordered byMizoram andAssam towardseast. Itsposition makesitshare mostofits boundarywith Bangladeshon alltheother threesides No.ofDistricts16279781144 Geographical Area(sqkm) 83,74378,55022,34722,72021,08116,5797,09610,491,369 Population1,382,61131,169,2722,721,7562,964,0071,091,0141,980,6026,07,6883,671,032 Densityof Population (persqkm) 16.5396.8121.8130.551.811985.6349.9 LiteracyRate66.95%76.30%79.85%72.10%89.90%63.70%76.60%87.75% NetAreaSown perthousand ha 211275323628495316107280 TotalCropped Areaper thousandha 276398423633795402118295 Source:StateDepartments’websites,NEDFiData Table2:ComparativeSocioeconomicProfileofNEStates
  • 20.
    10 Value ChainAnalysis of Select Crops in North Eastern States Agriculture As per the available data (NEDFI-2008-09), NE Region has 19% of net sown area. Jhum cultivation is widely prevalent in the entire NE Region (around 1.6 million hectare area is under shifting cultivation). Agriculture is predominantly characterised by low cropping intensity, subsistence farming and monocropping. Farming is mixed type and predominantly rice-based. With the present production level, foodgrain deficiency in the region is around 1.6 million tonnes. Subsistence nature of agriculture, low intensity of farming and minimal use of inorganic fertilisers has resulted in retaining the characteristics of soil. In a majority of the region, irrigation facilities are inadequate. Absence of post-harvest, value addition infrastructure and marketing facilities gives the region a unique advantage. Overall the agriculture sector in the entire NE Region has remained unexploited and therefore offers vast opportunities. Forests 58%Not Available for Cultivation 16% Other Uncultivated Land Excluding Fallow Land 3% Fallow Land 4% Net Area Sown 19% Figure 4: Land Utilisation Statistics of NE Region (2008-09) Source: MoDoNER NEC
  • 21.
    11Chapter 2 |The North East Region: An Overview SWOT Analysis of Agribusiness Scenario in North East Region The chapter above has covered an overview and a brief glimpse of the NE Region, however, in the following chapters, a detailed description of the horticultural scenario and its potential has been included. Strengths − Agro climatic diversity ranging from tropical to alpine making it possible to grow a wide variety of crops − Rich biodiversity − Rich surface water resources through perennial rivers and its tributaries − Proximity to export destinations such as Bangladesh and Myanmar − Soil is rich in organic matter − Potential to commercialise products such as kiwi and passionfruit Opportunities − Organic farming − Infrastructural facilities can be created with the participation of private sector − The number of government policies available for the NER can serve as a boosting factor for agricultural development − International markets can be targeted due to geographical location and availability of produce − Huge scope for value addition of surplus produce Weaknesses − Lack of infrastructural facilities along the food value chain − Lack of market access - domestic international − Limited flow of men and material due to hilly terrain − Jhum cultivation and subsistence farming is leading to deterioration of available resources − Non-availability of skilled manpower − Lack of business acumen Threats − Slow growth of infrastrucutre links − Uncertainty in external trade scenario SWOT Figure 5: SWOT Analysis of Agribusiness Scenario in NE Region
  • 23.
    C hap te r Horticulture Scenario in North East Region 3 Different sources have been analysed to compile the data of area and production of different horticultural crops in the North Eastern Region, such as National Horticulture Board, NEDFi and State Horticulture Department. However, the data of area and production of crops in NER available with different sources vary widely. Availability of systematic and accurate estimate of area and production of different horticultural crops is limited. According to the data available (2010-11), horticultural crops cover 857 thousand ha, constituting 2.34% of the total horticulture area in the country. From the production point of view, NE Region produces about 7815 thousand MT of horticulture produce and contributes 6.79% to the production basket of the country. Within the horticulture sector in the NE Region, fruit crops occupy 40.14%, vegetables 51.83% and spices 8.03% area. From the production point of view, fruit crops contributed 37.75%, vegetables 57.60% and spices 4.65% to the horticulture production basket of the Source: NHB and State Departments, 2010-11 Crops NER India Area (ha) Production (MT) Productivity (MT/ha) Area (ha) Production (MT) Productivity (MT/ha) Fruits 344,379 2,950,328 8.57 6,382,559 74,877,530 11.73 Vegetables 444,603 4,502,091 10.13 8,494,545 146,554,465 17.25 Spices 68,858 363,527 5.28 2,940,389 5,350,468 1.82 Grand Total 857,840 7,815,946 9.11 17,817,493 226,782,463 12.73 Table 3: Crop-wise Area, Production and Productivity of Horticultural Crops in NE Region (2010-11) Fruits 40.14% 37.75% 51.83% 57.60% 8.03% 4.65% Vegetables Spices Area Production Figure 6: Share in Area Production of Horticulture Crops (2010-11) Source: ISAP analysis, NHB State Department Data
  • 24.
    14 Value ChainAnalysis of Select Crops in North Eastern States NE Region. Considering the excellent climatic conditions, abundant rainfall and fertile soil (high organic content) of the region, the productivity of different horticultural crops is quite low as compared to national productivity. Among fruits, citrus has the largest area under cultivation (34%), followed by banana (24%), pineapple (17%), apple (4%), papaya, mango, litchi, passion fruit (3% each), guava (2%) and kiwi (1%). Other fruits have 6% of the total horticulture area under cultivation. In terms of production, banana has the largest share (34%), followed by pineapple (24%), citrus (21%), papaya (6%), mango, guava, passion fruit (3% each), litchi (2%), grapes and apple (1% each). *Productivity is greater than national average productivity Source: NHB and State Departments (2010-11) Table 4: Crop-wise Area, Production and Productivity of Horticultural Crops in NE Region (2010-11) Sl. No. Crop NE Region India Leading Area (ha) Production (MT) Productivity (MT/ha) Productivity (MT/ha) State Productivity (MT/ha) A Fruits 1 Apple 13,566 28,433 2.10 10.00 JK 13.07 2 Banana 81,454 1,015,075 12.46 35.86 TN 65.83 3 Grapes 1,755 20,500 11.68* 11.08 PUN 28.32 4 Guava 6,952 103,048 14.82* 12.02 MP 28.99 5 Litchi 8,930 58,845 6.59* 6.41 PUN 14.67 6 Mango 11,133 74,611 6.70* 6.61 PUN 15.83 7 Papaya 11,211 176,128 15.71 39.75 TN 164 8 Citrus 115,482 611,521 5.30 8.82 KAR 20.73 9 Kiwi 2,670 4,079 1.53 10 Passion Fruit 9,866 78,491 7.96 11 Pineapple 59,276 706,877 11.93 15.95 KAR 62.0 12 Other Fruits 22,084 72,720 3.29 Total Fruits 344,379 2,950,328 8.57 11.73 TN 30.96 B Vegetables 1 Brinjal 22,567 316,398 14.02 17.49 UP 30.72 2 Cabbage 43,978 812,472 18.47 21.55 TN 56.13 3 Cauliflower 27,272 428,598 15.72 18.29 MEG 35.27 4 Okra 17,574 193,204 10.99 11.61 JK 16.66 5 Onion 8,695 27,398 3.15 14.21 GUJ 24.42 6 Peas 30,329 79,949 2.64 9.51 JK 31.28 7 Potato 121,740 1,067,775 8.77 22.72 WB 32.96 8 Tomato 24,367 483,299 19.83* 19.45 HP 39.06 9 Chilly 16,910 109,511 6.48 10 Other Veg. 131,171 983,487 7.50 Total Veg. 444,603 4,502,091 10.13 17.25 TN 29.86 C Spices 1 Ginger 46,010 299,525 6.51 2 Turmeric 22,848 64,002 2.80 Total Spices 68,858 363,527 5.28 1.82 Grand Total 857,840 7,815,946 9.11 12.73
  • 25.
    15Chapter 3 |Horticulture Scenario in North East Region Among vegetables, potato has the maximum area (27%) under cultivation followed by cabbage (10%), peas (7%), cauliflower (6%), tomato and brinjal (5%), okra and chilli (4%), onion (2%) while other vegetables have 30% of the total area under vegetable cultivation. In terms of production, potato has the highest production and contributes 22% to vegetable production in NER followed by other vegetables (22%), cabbage (18%), tomato (11%), cauliflower (9%), brinjal (7%), okra (4%), peas and chilli (2% each) and onion (1%). The horticulture sector in NE Region offers a variety of products in huge volumes and each state in the NE Region has speciality in the production of few horticultural crops as per the local agro-climatic conditions and have significant benefits for producing that particular horticulture crop. Identification of potential state-specific crops will help in efficient marketing, better prices, minimisation of losses and devoting resources to promote their cultivation. State-wise Profile Arunachal Pradesh Agro-climatic Zones Potential Crops Grown The state has three distinct agro-climatic zones. The distribution of horticultural crops among these zones is as table 5: Figure 7: Fruit-wise Share in Area (2010-11) Figure 9: Vegetable-wise Share in Area (2010-11) Figure 8: Fruit-wise Share in Production (2010-11) Figure 10: Vegetable-wise Share in Production (2010-11) Brinjal 7% Cabbage 18% Cauliflower 9% Okra 4% Onion 1% Peas 2% Potato 24% Tomato 11% Chilly 2% Other Veg. 22% Apple 4% Banana 24% Grapes 0% Guava 2% Litchi 3% Mango 3% Papaya 3%Citrus 34% Kiwi 1% Passion Fruit 3% Pineapple 17% Other Fruits 6% Apple 1% Banana 34% Grapes 1% Guava 3% Litchi 2% Mango 3%Papaya 6% Citrus 21% Kiwi 0% Passion Fruit 3% Pineapple 24% Other Fruits 2% Brinjal 5% Cabbage 10% Cauliflower 6% Okra 4% Onion 2% Peas 7% Potato 27% Tomato 5% Chilly 4% Other Veg. 30% Source: ISAP analysis, NHB State Department Data Source: ISAP analysis, NHB State Department Data
  • 26.
    16 Value ChainAnalysis of Select Crops in North Eastern States Horticulture Scenario As per the available data (2010-11), horticulture crops in the state occupy nearly 102 thousand ha, producing around 418 thousand MT. The overall productivity of horticulture crops in the state worked out to 4.10 MT/ha, which is far behind as compared to national level and NE Region. Within the horticulture sector in the state, fruit crops recorded maximum area (81.4%) under cultivation followed by spices (13.3%), Medicinal Aromatic Plants (MAPs) (5%) and vegetables (0.3%). In terms of contribution in the horticulture production basket of the state, fruit crops contributed maximum (71.2%) followed by MAPs (25.9%), vegetables (1.7%) and spices (1.2%). Figure 11: Share in Area Production of Horticulture Crops (2010-11) Area 81.4% 0.3% 5.0% 13.3% 71.2% 1.7% 25.9% 1.2% Production Fruits Vegetables MAPs Spices Table 6: Area, Production and Productivity of Horticultural Crops in Arunachal Pradesh (2010-11) Crops Arunachal Pradesh NER India Area (ha) Production (MT) Productivity (MT/ha) Productivity (MT/ha) Productivity (MT/ha) Fruits 82,960 297,634 3.59 8.57 11.73 Vegetables 300 7087 23.62 10.13 17.25 MAPs 5148 108108 21.00 - - Spices 13559 5020 0.37 5.28 1.82 Total 101,967 417,849 4.10 9.11 12.73 Source: Directorate of Horticulture, Itanagar, Arunachal Pradesh Table 5: Agro-Climatic Zones in Arunachal Pradesh Agro-Climatic Zones Potential Horticultural Crops Grown Districts/Areas Subtropical Orange, pineapple, black pepper, stevia Plains/foothills of Lohit, Changlang, Tirap, Upper Lower Dibang Valley, East Siang, West Siang, Papum Pare, West and East Kameng, Anjaw, Upper Lower Subansiri, K/Kumey, Subtemperate Stone fruits off season vegetables Areas in between mid-hills and high-hills Temperate Apple, Kiwi and Saffron High-hills of West Kameng, Tawang, Ziro, Anini, Anjaw, Upper Subansiri, Upper Siang Source: “An In-depth Market Study and Impact Assessment Report” Source: ISAP analysis and Directorate of Horticulture, Itanagar
  • 27.
    17Chapter 3 |Horticulture Scenario in North East Region In terms of fruit-wise area, citrus is cultivated on 46% of land under fruits. Apple has 16% area under cultivation followed by pineapple (14%), other fruits (8%), banana (7%), walnut (6%) and kiwi (3%). Table 7: Crop-wise Area, Production Productivity of Horticultural Crops in Arunachal Pradesh (2010-11) Sl. No. Crops Arunachal Pradesh NE India Area (ha) Production (MT) Productivity (MT/ha) Productivity (MT/ha) Productivity (MT/ha) A Fruits 1 Citrus 38,296 164,673 4.30 5.30 8.82 2 Apple 13,506 28,363 2.10 2.10 10.00 3 Pineapple 11,435 65,180 5.70 11.93 15.95 4 Banana 5,685 21,603 3.80 12.46 35.86 5 Walnut 4,780 609 0.13 6 Kiwi 2,620 3,930 1.50 7 Other Fruits 6,638 13,276 2.00 Total Fruits 82,960 297,634 3.59 8.57 11.73 B Total Veg. 300 7,087 23.62 10.13 17.25 C MAPs 5,148 108,108 21 D Spices 1 Large Cardamom 12,770 680 0.05 2 Ginger 789 4,340 5.50 Total Spices 13,559 5,020 0.37 5.28 1.82 Grand Total 101,967 417,849 4.10 9.11 12.73 Source: Directorate of Horticulture, Itanagar, Arunachal Pradesh The state produces a wide variety of fruits, vegetable, flowers, spices and medicinal plants suitable for temperate and tropical climate. High valued crops such as apple, citrus, pineapple, kiwi, walnut, banana, ginger, large cardamom and black pepper have not only attained status as a popular enterprise among the new generation of growers on commercial lines, but have also proved to be a boon for the farmers of the state. Figure 12: Fruit-wise Share in Area (2010-11) Figure 13: Fruit-wise Share in Production (2010-11) Source: ISAP analysis and Directorate of Horticulture, Itanagar Citrus 46% Apple 16% Pineapple 14% Banana 7% Walnut 6% Kiwi 3% Other Fruits 8% Citrus 55% Apple 10% Pineapple 22% Banana 7% Walnut 0% Kiwi 1% Other Fruits 5%
  • 28.
    18 Value ChainAnalysis of Select Crops in North Eastern States Citrus is the leading crop in terms of production also and it contributes 55% of total fruit production. Pineapple is the second largest produced fruit (22%) followed by apple (10%), banana (7%), other fruits (5%) and kiwi (1%). Total area under vegetables is only 300 ha with a production of 7,087 MT of vegetables. The productivity of crops in the state, is observed to be lagging behind as compared to other states in the country due to old and senile orchards, use of own cultivars, insect/ pest/disease, rain-fed farming, negligible use of inputs by the farmers to increase the fertility of soil. The state has unique distinction of having a vertical profile ranging from subtropicalˆˆ to temperate. Though inaccessible but able to produce economically important crops such asˆˆ apple and kiwi along with off season vegetables. Area of cultivation is too low to be eligible for the economic scale of activity;ˆˆ Apart from interstate connectivity, intra state connectivity is also a major issue;ˆˆ Cultivation practices are traditional and subsistence.ˆˆ If developed commercially, kiwi has the potential to compete with the imported onesˆˆ being sold in the metros. The citrus plantations are as old as 50 years.ˆˆ Supportive infrastructure for any kind of value addition is almost absent.ˆˆ Poor understanding of state level agencies/institutions involved in upliftingˆˆ horticulture and horticultural markets. Salient Features of Horticulture in Arunachal Pradesh Crops Jan Feb Mar Apr May Jun Jul Aug Sep Oct Nov Dec Apple                         Walnut                         Kiwi                         Citrus                         Pineapple                         Banana                         L. Cardamom                         Black Pepper                         Ginger                         Potato                         Tomato                       Cabbage                         Beginning Peak Lean Figure 14: Seasonality of Crops in Arunachal Pradesh Source: “An In-depth Market Study and Impact Assessment Report”
  • 29.
    19Chapter 3 |Horticulture Scenario in North East Region The diverse agro-climatic conditions make Arunachal Pradesh suitable for cultivation of varied varieties of fruits, vegetables, spices, medicinal and aromatic crops. Apple, mandarin, pineapple, ginger, large cardamom, besides off season vegetables have big opportunity in the domestic markets. Kiwi, though grown in a small area, has good potential to scale it up to the commercial level. Productivity of vegetables in the state of Arunachal is found to be higher (23.62 MT/ha) as compared to national (17.25 MT/ha) and NE Region (10.13 MT/ha) vegetables productivity. Due to the favourable climatic conditions, vegetables can be grown round the year and can be supplied to the plains or distant markets in the off season, when there is little production of vegetables in the plains or less supply of products in the distant market and can fetch good returns. ASSAM Agro-Climatic Zones Potential Crops Grown The state has five distinct agro-climatic zones. The distribution of horticultural crops among these zones is as follows: Horticulture Scenario Assam is the largest producer of fruits and vegetables in the northeast region and contributes 60% to the total horticulture production in the north east region. It is the gateway for the marketing of horticulture produce from the northeast to the rest of the country. Horticultural crops in the state occupy nearly 15% of the gross cultivated area and the state produces more than 15.0 lakh MT of fruits, 29.0 lakh MT of vegetables and 1.0 lakh MT of spices besides nut crops, flowers and medicinal aromatic plants annually. In spite of having such inherent potential, commercialisation of horticulture sector in Assam has not yet happened. From the productivity point of view, productivity of fruits in the state is more (13.50 MT/ha) as compared to national level (11.73 MT/ha) and NE Region (8.57 MT/ha). Productivity of vegetables in the state is found to be less (11.25 MT/ha) in comparison to national level (17.25 MT/ha) but more than NE Region (10.13 MT/ha). This situation leads to the opportunity of productivity enhancement. Agro-Climatic Zones Potential Horticultural Crops Grown Districts/Areas North Bank Plain Zone Banana, Potato, Vegetables, Lemon, Orange Darrang, Sonitpur, Dhemaji, Lakhimpur Upper Brahamputra Banana, Potato, Vegetables, Lemon, Orange, Areca nut, Jackfruit, Pineapple, Guava, Litchi, Mango Sibsagar, Tinsukia, Dibrugarh, Jorhat, Golaghat. Central Brahamputra Banana, Potato, Vegetables, Lemon, Orange, Areca nut, Jackfruit, Pineapple, Guava, Litchi, Mango Nogaon, Morigaon, Kamrup Lower Brahamputra Banana, Potato, Vegetables, Lemon, Orange, Areca nut, Jackfruit, Pineapple, Guava, Litchi, Mango Nalbari, Barpeta, Bongaigaon, Kokrajhar, Goalpara, Dhubri, Barak Valley Banana, Potato, Vegetables, Lemon, Orange, Areca nut, Jackfruit, Pineapple, Guava, Litchi, Mango Cachar, Karinganj, Hailakandi Source: “An In-depth Market Study and Impact Assessment Report” Table 8: Agro-Climatic Zones of Assam
  • 30.
    20 Value ChainAnalysis of Select Crops in North Eastern States In the state, vegetable crops recorded maximum area (64.87%) under cultivation followed by fruits (27.75%) and spices (7.37%). In terms of contribution in the horticulture production basket of the state, vegetable crops contribute maximum (64.36%), followed by fruits (33.05%) and spices (2.59%). Crops Assam NER India Area (ha) Production (MT) Productivity (MT/ha) Productivity (MT/ha) Productivity (MT/ha) Fruits 111,300 1,502,200 13.50* 8.57 11.73 Vegetables 260,136 2,925,476 11.25 10.13 17.25 Spices 29,573 117,612 3.98 5.28 1.82 Grand Total 401,009 4,545,288 11.33 9.11 12.73 Table 9: Area, Production and Productivity of Horticultural Crops in Assam (2010-11) * Fruits productivity in Assam is greater than NER and national average productivity Source: NHB Figure 15: Share in Area Production of Horticulture Crops (2010-11) Area 27.75% 64.87% 7.37% 33.05% 64.36% 2.59% Production Fruits Vegetables Spices Source: ISAP analysis and NHB Figure 16: Fruit-wise Share in Area (2010-11) Figure 17: Fruit-wise Share in Production (2010-11) Source: ISAP analysis and NHB Banana 43% Guava 4% Litchi 5%Mango 4% Papaya 7% Citrus 25% Pineapple 12% Banana 48% Guava 6% Litchi 3% Papaya 9% Mango 3% Citrus 16% Pineapple 15%
  • 31.
    21Chapter 3 |Horticulture Scenario in North East Region Table 10: Crop-wise Area, Production and Productivity of Horticultural Crops in Assam (2010-11) Sl. No. Crops Assam NER India Area (ha) Production (MT) Productivity (MT/ha) Productivity (MT/ha) Productivity (MT/ha) A Fruits 1 Banana 47,600 723,600 15.20 12.46 35.86 2 Guava 4,900 97,300 19.86* 14.82 12.02 3 Litchi 5,200 40,500 7.79* 6.59 6.41 4 Mango 4,800 47,500 9.90* 6.70 6.61 5 Papaya 7,400 134,400 18.16 15.71 39.75 6 Citrus 27,400 238,200 8.69 5.30 8.82 7 Pineapple 14,000 220,700 15.76 11.93 15.95 Total Fruits 111,300 1,502,200 13.50* 8.57 11.73 B Vegetables 1 Brinjal 16,150 244,188 15.12 14.02 17.49 2 Cabbage 30,666 629,732 20.54 18.47 21.55 3 Cauliflower 20,879 328,844 15.75 15.72 18.29 4 Okra 11,068 147,758 13.35* 10.99 11.61 5 Onion 7,960 22,070 2.77 3.15 14.21 6 Peas 22,401 18,077 0.81 2.64 9.51 7 Potato 86,700 737,590 8.51 8.77 22.72 8 Tomato 16,634 387,239 23.28* 19.83 19.45 9 Other Veg. 47,678 409,978 8.60 7.50 Total Veg. 260,136 2,925,476 11.25 10.13 17.25 C Spices 1 Ginger 15,690 107,893 6.88 2 Turmeric 13,883 9,719 0.70 Total Spices 29,573 117,612 3.98 5.28 1.82 Grand Total 401,009 4,545,288 11.33 9.11 12.73 * Productivity is greater than NER and national average productivity Source: NHB In terms of area under fruit crops, banana contributes 43% followed by citrus (25%), pineapple (12%), papaya (7%), litchi (5%), mango and guava (4% each) while production-wise banana contributes 48% of total fruit production followed by citrus (16%), pineapple (15%), papaya (9%), guava (6%), litchi and mango (3% each). In terms of area under vegetables potato has the largest share and has 33% of total area under vegetable cultivation. Potato is followed by other vegetables (18%), cabbage (12%), peas (9%), cauliflower (8%), tomato (7%), brinjal (6%) and okra (4%). In terms of production, potato shares 25% of total vegetable production followed by cabbage (22%), other vegetables (14%), cauliflower (11%), brinjal (8%) and okra (5%). Figure 18: Vegetable-wise Share in Area (2010-11) Figure 19: Vegetable-wise Share in Production (2010-11) Source: ISAP analysis and NHB Brinjal 6% Cabbage 12% Cauliflower 8% Okra 4% Onion 3% Peas 9% Potato 33% Other Veg. 18% Tomato 7% Cauliflower 11% Brinjal 8% Cabbage 22% Okra 5% Onion 1%Peas 1% Tomato 13% Potato 25% Other Veg. 14%
  • 32.
    22 Value ChainAnalysis of Select Crops in North Eastern States Assam is traditionally rich in horticultural production due to its diverse and varied agro climatic condition which is conductive for growing a wide range of horticultural crops such as various fruits, vegetables, flowers, spices, nuts, tuber crops. Citrus is one of the major fruits and the productivity level of citrus in the state is found to be almost equal (8.69 MT/ha) to the national level (8.82 MT/ha) productivity but lagging behind Karnataka where the recorded productivity is 20.73 MT/ha. Major citrus varieties under cultivation in the state are khasi mandarin, Assam lemon, Eureka, Kachai lemon and lime. Though the state is one of the major producers of fruits vegetables in the country, but the quantity is not sufficient to meet the demand of the growing population of the state and dependence on neighbouring states to meet the demand is more during summer months (March to June). It serves as a gateway for the inbound and outbound horticulture produce of Northˆˆ East to the rest of the country. Having distinction of being the largest producer as well as consumption and distributionˆˆ centre in the NE Region. Assam lemon is a distinctive crop which is being supplied to most of the states in NE.ˆˆ Although Assam is the largest producer of horticultural produce in NER but the level ofˆˆ technological interventions from production to post-harvest is very low as compared to the leading states. Old and senile citrus orchards leading to low productivity and prevalence of diseases.ˆˆ Huge gap between demand and supply during the pre monsoon season and generallyˆˆ demand is met by supply from Meghalaya and prices tend to be on a higher side. Supportive infrastructure across the value chain either poor or non-existent leadingˆˆ to substantial wastages. Main market is being fed by the primary market which is leading to price rise andˆˆ inefficient supply chain. During discussions with stakeholders, it emerged that illegal collection of money isˆˆ practiced at the check posts. Salient Features of Horticulture in Assam Crops Jan Feb Mar Apr May Jun Jul Aug Sep Oct Nov Dec Banana                         Jackfruit                         Pineapple                         Orange                         Guava                         Litchi                         Mango                         Potato                         Chilies                         Ginger                         K. Vegetables                         R. Vegetables                                           Beginning Peak Lean Figure 20: Seasonality of Major Crops in Assam Source: “An In-depth Market Study and Impact Assessment Report”
  • 33.
    23Chapter 3 |Horticulture Scenario in North East Region Manipur Agro-Climatic Zones Potential Crops Grown The state has three distinct agro-climatic zones. The distribution of horticultural crops among these zones is as follows: Horticulture Scenario Diverse agro-climatic conditions and abundant rainfall provide immense opportunity for horticulture crops in the state of Manipur. As per the available data (2010-11), the state has 78 thousand ha of area under various horticulture crops, producing nearly 671 thousand MT with overall productivity level of 8.58 (MT/ha) which is lower in comparison to the national and NER productivity levels. Horticulture area in the state constitutes of fruits (58.17%), vegetables (25.76%) and spices (16.07%). From the production point of view, fruits contribute nearly 55.31% to the production basket of the state followed by vegetables (28.72%) and spices (15.97%). The major horticultural crops in the state are passion fruit, banana, citrus, pineapple, ginger, turmeric, tomato, cabbage, pea and potato. It has good potential to export these crops to Myanmar (Burma). Cabbage, tomato and pea are the major vegetables which can cater to neighbouring states. In terms of area under fruits in Manipur, the largest area is under pineapple (26%), followed by other fruits (23%), passion fruit (18%), banana (13%), orange and lime/ lemon (10%) while in terms of production, pineapple share 30% of total fruits production followed by banana (21%), passion fruit (19%), other fruits (15%), lime/lemon (8%) and orange (7%). Agro-Climatic Zones Potential Horticultural Crops Grown Districts/Areas Temperate Subalpine Zone Passion Fruit, Plum, Peach, Pear, Vegetables, Pineapple, Lime, Orange Senapati, Ukhrul Mild Tropical Hill Zone Banana, Papaya, Jackfruit, Orange, Pineapple Thoubal, Tamenglong, Chandal, Churchandpur Mild Tropical Plain Zone Pineapple, Banana, Papaya, Mango, Guava, Jackfruit, Vegetables, Lemon Imphal East, Imphal West, Bishnupur Source: “An In-depth Market Study and Impact Assessment Report” Table 11: Agro-Climatic Zones in Manipur Crops Manipur NER India Area (ha) Production (MT) Productivity (MT/ha) Productivity (MT/ha) Productivity (MT/ha) Fruits 45,574 371,601 8.15 8.57 11.73 Vegetables 20,185 192,955 9.56 10.13 17.25 Spices 12,590 107,298 8.52 5.28 1.82 Grand Total 78,349 671,854 8.58 9.11 12.73 Source: Directorate of Horticulture and Soil Conservation, Imphal Table 12: Area, Production and Productivity of Horticultural Crops in Manipur (2010-11)
  • 34.
    24 Value ChainAnalysis of Select Crops in North Eastern States Figure 21: Share in Area Production of Horticulture Crops (2010-11) Area 58.17% 25.76% 16.07% 55.31% 28.72% 15.97% Production Fruits Vegetables Spices Source: ISAP Analysis Directorate of Horticulture and Soil Conservation, Imphal Table 13: Crop-wise Area, Production and Productivity of Horticultural Crops in Manipur (2010-11) Sl. No. Crops Manipur NER India Area (ha) Production (MT) Productivity (MT/ha) Productivity (MT/ha) Productivity (MT/ha) A Fruits 1 Pineapple 12120 110598 9.13 11.93 15.95 2 Banana 5899 76422 12.96 12.46 35.86 3 Lime/Lemon 4480 29405 6.56 5.30 8.82 4 Orange 4410 25990 5.89 5.30 8.82 5 Passion Fruit 8344 72581 8.7 6 Other Fruits 10321 56605 5.48 Total Fruits 45574 371601 8.15 8.57 11.73 B Vegetables 1 Cauliflower 2340 22935 9.8 15.72 18.29 2 Cabbage 5720 57624 1.07 18.47 21.55 3 Tomato 2210 20156 9.12 19.83 19.45 4 Pea 4688 45502 9.71* 2.64 9.51 5 Other Veg. 5227 46738 8.94 Total Veg. 20185 192955 9.56 10.13 17.25 C Spices 1 Chillies 8210 61661 7.51 2 Ginger 2200 25443 11.57 3 Turmeric 1440 16323 11.34 4 Other Spices 740 3871 5.23 Total Spices 12590 107298 8.52 5.28 1.82 Grand Total 78349 671854 8.58 9.11 12.73 * Pea productivity is greater than NER and national average productivity Source: Directorate of Horticulture and Soil Conservation, Imphal
  • 35.
    25Chapter 3 |Horticulture Scenario in North East Region Cabbage has largest share of 28% of total area under vegetable cultivation followed by other vegetables (26%), peas (23%), cauliflower (12%) and tomato (11%). While in terms of production, cabbage has 30% share, followed by peas and other vegetables (24% each), cauliflower (12%) and tomato (10%). Figure 22: Fruit-wise Share in Area 2010-11 Figure 23: Fruit-wise Share in Production 2010-11 Source: ISAP Analysis Directorate of Horticulture and Soil Conservation, Imphal Pineapple 26% Banana 13% Lime/Lemon 10%Orange 10% Other Fruits 23% Passion Fruit 18% Banana 21% Pineapple 30% Lime/Lemon 8% Passion Fruit 19% Orange 7% Other Fruits 15% Figure 24: Vegetable-wise Share in Area 2010-11 Figure 25: Vegetable-wise Share in Production (2010-11) Source: ISAP Analysis Directorate of Horticulture and Soil Conservation, Imphal Cauliflower 12% Cabbage 28% Tomato 11%Pea 23% Other Veg. 26% Cabbage 30% Cauliflower 12% Tomato 10% Pea 24% Other Veg. 24% Crops Jan Feb Mar Apr May Jun Jul Aug Sep Oct Nov Dec Banana Jackfruit Pineapple Orange Litchi Mango Potato Turmeric Ginger K. Vegetables R. Vegetables Beginning Peak Lean Figure 26: Seasonality of Major Crops in Manipur Source: “An In-depth Market Study and Impact Assessment Report”
  • 36.
    26 Value ChainAnalysis of Select Crops in North Eastern States In the state, pineapple is mostly grown on hill slopes as a rain-fed crop. Giant Kew and Queen are the two leading varieties being grown. Kew is suitable for processing whereas Queen is grown for table purposes. In citrus, Khasi mandarin and orange are popular, besides Assam, Eureka and Kachai lemon. Remarkable area of hatkora (citrus) used as a spice is recorded in the warm and humid areas of Chandel and Jiribam. Due to favourable climate, Manipur has a good potential for the production of off season vegetables. Current off season vegetables grown in the state are cabbage, tomato, peas and beans. However, large scale production and optimum yield are yet to be achieved. The state is characterised by three distinct agro climatic zones, but it isˆˆ net importer of horticulture produce from the other neighbouring states as well as Burma. Khasi mandarin is being grown in Tamenglong district but the orchards are old andˆˆ senile and easily qualify as wild produce. Fruits occupy more than 50 percent of total horticulture produce but forced to consumeˆˆ locally due to exceptionally very high logistic cost. It has emerged during discussions with the stakeholders that there is a goodˆˆ potential for exporting some horticultural crops like Pineapple, citrus, subject to the supportive environment in term of logistics, law and order and infrastructural support. Salient Features of Horticulture in Manipur Meghalaya Agro-Climatic Zones Potential Crops Grown The state has two distinct agro-climatic zones. The distribution of horticultural crops among these zones is as follows: Horticulture Scenario As per the available data during the period (2010-11), horticulture crops occupy nearly 73 thousand ha in the state. Among various horticulture crops, vegetable crops occupied maximum area (57.20%), followed by fruit crops (27.37%) and spices (15.43%). Agro-Climatic Zones Potential Horticultural Crops Grown Districts/Areas Mild Tropical Hill zone Pineapple, Pear, Peach, Plum, Potato, Vegetables, Passion Fruit, Strawberry, Mandarin, Black Pepper Ri-Bhoi, East Khasi Hills, West Khasi Hills, Jaintia Hills, Part of Garo Hills Mild Tropical Plain Zone Pineapple, Mandarin, Potato, Vegetables, Cashewnut, Black Pepper East Garo Hills, West Garo Hills Source: “An In-depth Market Study and Impact Assessment Report” Table 14: Agro-climatic zones in Meghalaya
  • 37.
    27Chapter 3 |Horticulture Scenario in North East Region During the period, the state recorded about 552 thousand MT of horticulture production. As far as production is concerned, vegetable crops contributed about 64.57% to the horticulture production basket of the state, followed by fruit crop contributing 23.85% and spices 11.57%. The overall productivity of horticultural crops in the state was found to be lower (7.56 MT/ha) in comparison to national and NER productivity levels. Crops Meghalaya NER India Area (ha) Production (MT) Productivity (MT/ha) Productivity (MT/ha) Productivity (MT/ha) Fruits 20,000 131,700 6.59 8.57 11.73 Vegetables 41,800 356,500 8.53 10.13 17.25 Spices 11,276 63,904 5.67 5.28 1.82 Grand Total 73,076 552,104 7.56 9.11 12.73 Source: NHB Table 15: Area, Production and Productivity of Horticultural Crops in Meghalaya (2010-11) Table 16: Crop-wise Area, Production and Productivity of Horticultural Crops in Meghalaya (2010-11) Sl. No. Crops Meghalaya NER India Area (ha) Production (MT) Productivity (MT/ha) Productivity (MT/ha) Productivity (MT/ha) A Fruits 1 Papaya 800 6,800 8.50 15.71 39.75 2 Citrus 9,500 38,900 4.09 5.30 8.82 3 Pineapple 9,700 86,000 8.87 11.93 15.95 Total Fruits 20,000 131,700 6.59 8.57 11.73 B Vegetables 1 Brinjal 858 11,641 13.57 14.02 17.49 2 Cabbage 1,644 36,022 21.91* 18.47 21.55 3 Cauliflower 1,000 35,271 35.27* 15.72 18.29 4 Okra 717 5,868 8.18 10.99 11.61 5 Onion 363 3,078 8.48 3.15 14.21 6 Peas 740 4,780 6.46 2.64 9.51 7 Potato 17,722 162,445 9.17 8.77 22.72 8 Tomato 1,826 27,522 15.07 19.83 19.45 9 Other Veg. 16,930 69,873 4.13 7.50 Total Veg. 41,800 356,500 8.53 10.13 17.25 C Spices 1 Ginger 9,321 54,009 5.79 2 Turmeric 1,955 9,895 5.06 Total Spices 11,276 63,904 5.67 5.28 1.82 Grand Total 73,076 552,104 7.56 9.11 12.73 * Cabbage and cauliflower productivity is greater than NER and national average productivity Source: NHB
  • 38.
    28 Value ChainAnalysis of Select Crops in North Eastern States Figure 27: Fruit-wise Share in Production 2010-11 Figure 28: Fruit-wise Share in Production (2010-11) Source: ISAP Analysis NHB Papaya 4% Citrus 47%Pineapple 49% Papaya 5% Citrus 30%Pineapple 65% Figure 29: Vegetable-wise Share in Area 2010-11 Figure 30: Vegetable-wise Share in Production 2010-11 Source: ISAP Analysis NHB Brinjal 2% Cabbage 4% Cauliflower 2% Okra 2% Onion 1% Peas 2% Potato 42% Tomato 4% Other Veg. 41% Brinjal 3% Cabbage 10% Cauliflower 10% Okra 2% Onion 1% Peas 1% Potato 45% Tomato 8% Other Veg. 20% Pineapple has largest area under cultivation i.e., 49% followed by citrus (47%) and papaya (4%) while production-wise also pineapple has largest share of 65% followed by citrus (30%) and papaya (5%). In terms of vegetables, potato contributes 42% of area under vegetable cultivation, followed by other vegetables (41%), cabbage (4%), peas, brinjal, okra and cauliflower (2% each) and onion (1%). While production-wise also, potato shares 45% in the total vegetable production followed by other vegetables (20%), cabbage and cauliflower (10% each), tomato (8%), brinjal (3%), okra (2%) and peas and onion (1% each). A wide range of tropical, subtropical and temperate fruits such as mandarin, orange, pineapple, banana, lemon, guava, pear and plum etc. are grown all over the state. A large variety of vegetables, both indigenous and exotic are grown across a wide range of agro- climatic zones. The productivity status of cabbage and cauliflower in the state is significant and found higher (21.91 35.27 MT/ha) as compared to the national (18.47 15.72 MT/ha) and NER (21.55 18.29 MT/ha) productivity levels. In case of cauliflower, Meghalaya is the leading state in the country, in terms of productivity; however, it is lagging behind Tamil Nadu in case of cabbage productivity (56.13 MT/ha) in the country.
  • 39.
    29Chapter 3 |Horticulture Scenario in North East Region The higher altitudes provide a conducive ecosystem to grow traditional vegetables such as potato and cole crops during the rainy season. Tuber and root crops such as sweet potato and tapioca, spices such as turmeric, ginger, chillies, etc. also grow abundantly. Vegetables such as tomato, cabbage and chayote are the major off season vegetables which are supplied to other neighbouring states. Over a period of time, Meghalaya has postioned itself not only as a major supplier of vegetables to the neighbouring states but also as an off season vegetable producer and supplier for the distant market. Two distinct agro climatic zones which make it conducive to produce a wide range ofˆˆ vegetable crops and these vegetable crops qualify for off season vegetables. Production belts happen to be close to the consumption market as well as exit points/ˆˆ distribution transit points. More than half of the horticulture produce is contributed by vegetable production,ˆˆ but the productivity of vegetable crops is half of the national average productivity and even less than the NER vegetable productivity, however, paradoxically cole crops recorded the highest productivity. A substantial quantity of vegetable finds its way to Bangladesh through unofficialˆˆ channels. Over a period of time, due to the climate and its strategic location, Meghalaya hasˆˆ emerged as an off season vegetable production hub, not only for NER, but also for the neighbouring countries of Bangladesh along with the distant Kolkata market. However, during discussions with stakeholders, it has emerged that climatic changes have started making a detrimental impact on the seasonality and productivity which can lead to its losing the competitive advantage of off season vegetables. Lack of post-harvest infrastructure, specifically modern vegetable packing housesˆˆ is a major impediment in maintaining the comparative advantage in the changing market scenario. Salient Features of Horticulture in Meghalaya Figure 31: Seasonality of Major Crops in Meghalaya (2010-11) Crops Jan Feb Mar Apr May Jun Jul Aug Sep Oct Nov Dec Banana Jackfruit Pineapple Mandarin Chillies Black Pepper Mango Potato Turmeric Ginger K. Vegetables R. Vegetables Beginning Peak Lean Source: “An In-depth Market Study and Impact Assessment Report”
  • 40.
    30 Value ChainAnalysis of Select Crops in North Eastern States Mizoram Agro-Climatic Zones Potential Crops Grown The state has three distinct agro-climatic zones. The distribution of horticultural crops among these zones is as follows: Horticulture Scenario As per the available statistics (2010-11), horticulture area in the state accounted for more than 69 thousand ha with production of 490 thousand MT of various crops. The overall productivity of horticulture crops in the state is around 7.03 (MT/ha) which is lower as compared to the national (9.11 MT/ha) and NER (12.73 MT/ha) productivity levels. Horticulture area in the state consists of fruits (41.01%), vegetables (30.26%) and spices (28.73%) area. In terms of share in the production basket of the state, fruits contribute nearly 44.44%, vegetables 34.41% and spices 21.16%. Agro-Climatic Zones Potential Horticultural Crops Grown Districts/Areas Temperate Zone Passion Fruit, Plum, Peach, Pear, Vegetables, Pineapple, Lime, Orange Eastern and South Mizoram, Major portion of Champhai, Saitual of Aizawl District. S. Vanlaiphai areas of Lunglei District and Saiha Tuipang areas of Chhimtuipui District Subtropical Zone Mango, Guava, litchi, Jackfruit, Orange, Pineapple, Vegetables Central Aizawl, Ngopa areas of Champhai Lunglei sub-division of Southern Mizoram Tropical Zone Pineapple, Citrus, Banana, Papaya, Mango, Sapota, Vegetables Kolasib area of North Mizoram, Mamit areas of Western part of Mizoram bordering Tripura, Demagiri (Lunglei sub-div) and Chawngte sub- division of Southern Mizoram Source: “An In-depth Market Study and Impact Assessment Report” Table 17: Agro-Climatic Zones in Mizoram Table 18: Area, Production and Productivity of Horticultural Crops in Mizoram (2010-11) Crops Mizoram NER India Area (ha) Production (MT) Productivity (MT/ha) Productivity (MT/ha) Productivity (MT/ha) Fruits 28,618 218,169 7.62 8.57 11.73 Vegetables 21,120 168,909 8.00 10.13 17.25 Spices 20,048 103,858 5.18 5.28 1.82 Grand Total 69,786 490,936 7.03 9.11 12.73 Source: Directorate of Horticulture, Aizawl Figure 32: Share in Area and Production of Horticulture Crops (2010-11) Area 41.01% 30.26% 28.73% 44.44% 34.41% 21.16% Production Fruits Vegetables Spices Source: ISAP Analysis Directorate of Horticulture Aizawl
  • 41.
    31Chapter 3 |Horticulture Scenario in North East Region Table 19: Crop-wise Area, Production and Productivity of Horticultural Crops in Mizoram (2010-11) Sl. No. Crops Mizoram NER India Area (ha) Production (MT) Productivity (MT/ha) Productivity (MT/ha) Productivity (MT/ha) A Fruits 1 Mandarin 6515 19700 3.02 5.30 8.82 2 Banana 10040 118600 11.81 12.46 35.86 3 Lime/Lemon 4823 24150 5.00 5.30 8.82 4 Pineapple 1532 13590 8.87 11.93 15.95 5 Grape 1575 20400 12.95* 11.68 11.08 6 Passion Fruit 1522 5910 3.88 7 Papaya 800 6750 8.43 15.71 39.75 8 Mango 645 2850 4.42 6.70 6.61 9 Other Fruits 1166 6219 5.33 Total Fruits 28618 218169 7.62 8.57 11.73 B Vegetables 1 Brinjal 2010 12,108 6.02 14.02 17.49 2 Bitter Gourd 3715 16,889 4.55 3 Cabbage 2600 33,569 12.91 18.47 21.55 4 Chayote 3500 56,849 16.24 5 Bean 2290 4,956 2.16 6 Okra 2800 18,710 6.68 10.99 11.61 7 Cucumber 775 3,651 4.71 8 Tomato 675 6,180 9.16 19.83 19.45 9 Peas 450 1,933 4.30 2.64 9.51 10 Other Veg. 2305 14,064 6.10 Total Veg. 21120 68,909 8.00 10.13 17.25 C Spices 1 Black Pepper 68 88 1.29 2 Ginger 6500 31,950 4.92 3 Turmeric 4780 23,970 5.01 4 Bird’s Eye Chilli 8700 47,850 5.50 Total Spices 20048 103858 5.18 5.28 1.82 Grand Total 69786 90,936 7.03 9.11 12.73 * Grape productivity is greater than NER and national average productivity Source: Directorate of Horticulture, Aizawl Figure 33: Fruit-wise Share in Area (2010-11) Figure 34: Fruit-wise Share in Production (2010-11) Source: ISAP Analysis Directorate of Horticulture, Aizawl Other Fruits 4%Mango 2% Papaya 3% Passion Fruit 5% Mandarin 23% Banana 35% Grape 6% Pineapple 5% Lime/Lemon 17% Mandarin 9% Banana 55% Grape 9% Pineapple 6% Lime/Lemon 11% Other Fruits 3%Mango 1% Papaya 3% Passion Fruit 3%
  • 42.
    32 Value ChainAnalysis of Select Crops in North Eastern States In terms of area under fruits, banana makes up for 35% of the total area under fruits, followed by mandarin (23%), lime/lemon (17%), grape (6%), pineapple and passion fruit (5% each), other fruits (4%), papaya (3%) and mango (2%). Banana shares 55% in fruit production followed by lime/lemon (11%), grape and mandarin (9%) each, pineapple (6%), papaya, passion fruit and other fruits (3% each). Figure 35: Vegetable-wise Share in Area Figure 36: Vegetable-wise Share in Production Source: ISAP Analysis Directorate of Horticulture, Aizawl Bitter Gourd 18% Other Veg. 11% Peas 2% Tomato 3% Brinjal 9% Cabbage 12% Chayote 17% Okra 13% Cucumber 4% Bean 11% Bitter Gourd 10% Cabbage 20% Cucumber 2% Okra 11% Bean 3% Chayote 34% Brinjal 7% Other Veg. 8% Peas 1% Tomato 4% In terms of area under vegetables, bitter gourd has 18% of total area under vegetables followed by chayote (17%), okra (13%) cabbage (12%), bean and other vegetables (11%), brinjal (9%), cucumber (4%) and tomato (3%). In terms of production, chayote shares 34% in total vegetable production followed by cabbage (20%), okra (11%), bitter gourd (10%), other vegetables (8%), brinjal (7%) and tomato (4%). Figure 37: Seasonality of Major Crops in Mizoram Crops Jan Feb Mar Apr May Jun Jul Aug Sep Oct Nov Dec Banana                         Mandarin                         Passion Fruit                         Ginger                         Turmeric                         Cabbage                         Mango                                             Beginning Peak Lean Source: “An In-depth Market Study and Impact Assessment Report” Use of fertilisers and pesticides in agriculture and horticulture fields in Mizoram is almost non-existing. As such, all agri horticulture output of Mizoram are organic products of very high-value in national and international market. Out of the cultivable area, potential area for horticultural activities is found to be 6.31 lakh hectares, which consist of gentle to moderate slope. Out of this potential area, the area under horticulture crops during 2010-11 as recorded is more than 69,000 hectares which is only 11.05% of potential area for horticulture. Therefore, the scope and potential for expanding the activities under horticulture is enormous.
  • 43.
    33Chapter 3 |Horticulture Scenario in North East Region Mizoram state produces grapes mainly in the off season and productivity of grapes in the state is found higher (12.95 MT/ha) as compared to national (11.08 MT/ha) and NER (11.68 MT/ha) productivity level. Productivity of grapes in Maharashtra which is the main production cluster of grapes in the country is also found lower (9 MT/ha) as compared to Mizoram. Besides grapes, crops like mandarin orange, passion fruit, pineapple, papaya, tomato, brinjal, bird’s eye chillies, ginger, turmeric are also grown and have tremendous potential for marketing outside the State. Most of the vegetables produced in the state are off season vegetables and hence will fetch a higher price if dispatched to the main land markets. Mizoram is characterised by mountainous and hilly track, divided into three agro-climaticˆˆ zones and has the potential to become next major hub for off season vegetables. Major fruit crops are Khasi mandarin, grapes, passion fruit and lime lemon.ˆˆ Major consolidation point for Mizo products are Silchar and Karimganj.ˆˆ Unique system of direct marketing is practiced in Mizoram that farmers sell theirˆˆ produce directly to the consumers in the weekly market, having dual benefit – remunerative price to the farmers and low cost of produce to the consumer. Good quantity of turmeric is produced in the region which is being procured by the stateˆˆ government as seed for the distribution in the whole state through the government channel. Marketing infrastructure is poor and underutilised.ˆˆ Existing fruits and vegetable processing units are running far below their capacity, noˆˆ strong tie-ups to market the product even in NER resulting in heavy loss. Huge opportunity of trade with Bangladesh and Myanmar is still untapped due to lawˆˆ and order situation. Salient Features of Horticulture in Mizoram Nagaland Agro-Climatic Zones Potential Crops Grown The state has two distinct agro-climatic zones. The distribution of horticultural crops among these zones is as follows: Agro-Climatic Zones Potential Horticultural Crops Grown Districts/Areas Subtropical Hill Zone Orange, Pineapple, Passion Fruit, Vegetables, Potato, Chow Chow Dimapur, Kohima, Mokok Chong, Mon, Tuenchang, Phek Mild Tropical Hill Zone Pineapple, Citrus, Banana, Papaya, Pear, Peach Vegetables (Ginger) Kohima, Zunheboto Source: “An In-depth Market Study and Impact Assessment Report” Table 20: Agro-Climatic Zones in Nagaland
  • 44.
    34 Value ChainAnalysis of Select Crops in North Eastern States Horticulture Scenario The total area covered by horticulture crops has been estimated at 27,473 ha (2010-11) which represents about 8% of the gross cropped area, with nearly 2.51 lakh MT of horticulture produce. The state produces 1.41 lakh MT of fruits, 0.79 lakh MT of vegetables and 0.30 lakh MT of spices. Productivity of fruits in the state is found to be higher as compared to NER (8.57 MT/ha) but it lags behind the national productivity level (11.73 MT/ha). Overall productivity of horticultural crops is lower in comparison to national and NER productivity levels. Horticulture area in the state represents fruits (49.70%), vegetables (38.95%) and spices (11.36%). In terms of horticulture production, fruits contribute 56.24%, vegetables 31.62% and spices 12.14%. Important among the vegetable crops grown are potato, cassava, colocasia, cabbage, cauliflower, peas and cucumber while ginger, chillies, cardamom, garlic, black pepper make up the major spice crops. Amongst the plantation crops, areca, coconut, tea and rubber offer the best potential for cultivation on a commercial scale. Among the fruit crops, pineapple, mandarin orange and passion fruit are already being produced on a commercial scale. Table 21: Area, Production and Productivity of Horticultural Crops in Nagaland (2010-11) Crops Nagaland NER India Area (ha) Production (MT) Productivity (MT/ha) Productivity (MT/ha) Productivity (MT/ha) Fruits 13,653 141,250 10.35 8.57 11.73 Vegetables 10,700 79,400 7.42 10.13 17.25 Spices 3,120 30,495 9.77 5.28 1.82 Grand Total 27,473 251,145 9.14 9.11 12.73 Source: NHB Figure 38: Share in Area Production of Horticulture Crops (2010-11) Area 49.70% 38.95% 11.36% 56.24% 31.62% 12.14% Production Fruits Vegetables Spices Source: ISAP Analysis NHB Figure 39: Fruit-wise Share in Area (2010-11) Figure 40: Fruit-wise Share in Production (2010-11) Source: ISAP Analysis NHB Banana 20% Other Fruits 7% Papaya 5% Citrus 41% Pineapple 27% Banana 42% Citrus 12% Papaya 4% Pineapple 41% Other Fruits 1%
  • 45.
    35Chapter 3 |Horticulture Scenario in North East Region Table 22: Crop-wise Area, Production and Productivity of Horticultural Crops in Nagaland (2010-11) Sl. No. Crops Nagaland NER India Area (ha) Production (MT) Productivity (MT/ha) Productivity (MT/ha) Productivity (MT/ha) A Fruits 1 Banana 2,700 59,000 21.85 12.46 35.86 2 Papaya 670 5,600 8.36 15.71 39.75 3 Citrus 5,650 17,030 3.01 5.30 8.82 4 Pineapple 3,700 57,500 15.54 11.93 15.95 5 Other Fruits 9,33 2,120 2.27 Total Fruits 13,653 141,250 10.35 8.57 11.73 B Vegetables 1 Brinjal 100 2,200 22.00* 14.02 17.49 2 Cabbage 300 3,000 10.00 18.47 21.55 3 Okra 300 1,200 4.00 10.99 11.61 4 Peas 100 1,000 10.00* 2.64 9.51 5 Potato 1,500 10,000 6.67 8.77 22.72 6 Tomato 700 4,000 5.71 19.83 19.45 7 Other Veg. 7,700 58,000 7.53 7.50 Total Veg. 10,700 79,400 7.42 10.13 17.25 C Spices 1 Ginger 3,000 30,000 10.00 2 Turmeric 120 495 4.13 Total Spices 3,120 30,495 9.77 5.28 1.82 Grand Total 27,473 251,145 9.14 9.11 12.73 * Productivity is greater than NER and national average productivity Source: NHB In Nagaland, citrus is grown on 41% of total area under fruits followed by pineapple (27%), banana (20%), other fruits (7%) and papaya (5%) while in terms of production banana is the largest crop and shares 42% in total fruit production followed by pineapple (41%), citrus (12%), papaya (4%) and other fruits (1%). Figure 41: Vegetable-wise Share in Area (2010-11) Figure 42: Vegetable-wise Share in Production (2010-11) Source: ISAP Analysis NHB Peas 1% Brinjal 1% Cabbage 3% Okra 3% Potato 14% Tomato 6% Other Veg. 72% Okra 1% Peas 1% Tomato 5% Potato 13% Other Veg. 73% Cabbage 4%Brinjal 3% In terms of area under vegetables, other vegetables share 72% of total area followed by potato (14%), tomato (6%), okra and cabbage (3% each), peas and brinjal (1% each). While in terms of production, other vegetables contribute 73% followed by potato (13%), tomato (5%), cabbage (4%), brinjal (3%), peas and okra (1% each).
  • 46.
    36 Value ChainAnalysis of Select Crops in North Eastern States The state is divided into two agro-climatic zones – subtropical hilly and mild tropical hilly.ˆˆ Fruit production contributes more than 50 percent of total horticulture production,ˆˆ major fruits being pineapple and banana. Initiative taken by NHB and local institute Central Institute of Horticulture (CIH) toˆˆ market the Nagaland pineapple to distant markets of Delhi and Bangalore has opened new vistas of organised distant markets. The ginger produced in Nagaland is one of the best quality, the productivity is relativelyˆˆ higher; five-fingered with low fibre content which makes it suitable for processing. General apprehension of law and order to outside traders who are interested inˆˆ purchasing products like pineapple, ginger etc. Naga chilli is an ethnic product of Nagaland which sells at a premium, although theˆˆ volumes are low. Charges levied by various insurgent groups on transportation and trade are not onlyˆˆ restricting the trade but also adding to the cost. Salient Features of Horticulture in Nagaland Figure 43: Seasonality of Major Crops in Nagaland Crops Jan Feb Mar Apr May Jun Jul Aug Sep Oct Nov Dec Banana                         Jackfruit                         Pineapple                         Mandarin                         Chillies                         Litchi                         Mango                         Potato                         Turmeric                         Ginger                         K. Vegetables                         R. Vegetables                                             Beginning Peak Lean Source: “An In-depth Market Study and Impact Assessment Report” Based on the elevation, both subtropical fruits such as pineapple, banana, citrus, guava, etc. and temperate fruits such as plum, peach, pear, passion fruit and various nuts have potential for exploitation. In case of pineapple, productivity status of state (15.54 MT/ha) is almost equivalent to national level (15.956 MT/ha) and more as compared to NER (11.93 MT/ha). Productivity of banana in the state is also more than NER. In case of vegetables, the productivity of brinjal and peas in the state is higher (22 10 MT/ha) as compared to national (17.49 9.51 MT/ha) and NER (14.02 2.64 MT/ha) productivity levels. However, the requirement of crops such as potato, leafy vegetables, peas, brinjal, okra, apple, papaya and several other fruits and vegetables for domestic consumption, exceeds the existing production and to meet the consumption demand leads to increased dependence on other states.
  • 47.
    37Chapter 3 |Horticulture Scenario in North East Region Sikkim Agro-Climatic Zones Potential Crops Grown The distribution of horticultural crops among zones based on rainfall is as follows: Horticulture Scenario The state is endowed with varied agro-climatic conditions suitable for the cultivation of large number of subtropical and temperate horticultural crops but mainly due economic viability, mandarin and passion fruit are being commercially cultivated. In the state, the vegetables are grown mainly in three seasons viz. kharif, rabi and off season. Ginger, large cardamom, turmeric, off season vegetables, floriculture etc. can be commercially cultivated to enhance income per unit area. The small size holdings of the farmers could be utilised efficiently with family labour thereby generating both employment and additional income. Rainfall Potential Horticulture Crops Air temperature Altitude 300 cm Very heavy rainfall zone Ginger, Vegetables, Potatoes, Large Cardamom 12-16°C in the southern parts of North District and 15-18°C whole of East District from north-western parts to south-eastern parts 1000-2000 300 to  200 cm Heavy rainfall zone Ginger, Vegetables, Potatoes, Large Cardamom, Oranges, Citrus, Banana, Papaya 13-17°C in the northern parts of South and West Districts; 16-19°C in the central parts of South West Districts and over the valleys between East and South Districts and South and West Districts; and 20°C in the southern most parts of East, South and West Districts and over the valleys between East and South Districts and South and West Districts. Less than 1000 m to 2000 m 200 to 100 cm Moderate rainfall zone Seed-Potato, Cabbage, Peas, Radish, Other winter vegetables, Off season cabbage 7-9°C 2000-3000 m 100 cm Low rainfall zone Cultivable land is not available above 4000 m. Vegetation is mainly herbs or medicinal herbs. 6.5°C Above 3000 m Source: “An In-depth Market Study and Impact Assessment Report” Table 23: Agro-Climatic Regions in Sikkim Crops Sikkim NER India Area (ha) Production (MT) Productivity (MT/ha) Productivity (MT/ha) Productivity (MT/ha) Fruits 11,340 17,900 1.58 8.57 11.73 Vegetables 23,855 120,900 5.07 10.13 17.25 Spices 9,180 49,490 5.39 5.28 1.82 Grand Total 44,375 188,290 4.24 9.11 12.73 Source: NHB Table 24: Area, Production and Productivity of Horticultural Crops in Sikkim (2010-11)
  • 48.
    38 Value ChainAnalysis of Select Crops in North Eastern States During the year 2010-11, the state recorded 44,375 (ha) land under horticultural crops cultivation accounting for 188000 MT in production. The overall productivity level of horticultural crops in the state is observed to be low, to the tune of 4.24 MT/ha which is far below national and NER productivity levels. Commodity-wise area under vegetable cultivation found maximum (53.76%) followed by fruits (25.55%) and spices (20.69%). Though area under fruit cultivation is significant, but production is observed very low (9.51%), on the contrary contribution of vegetables (64.21%) and spices (26.28%) to the production basket of the state is observed to be significant. Citrus shares 74% in total area under cultivation, followed by banana (15%) and other fruits (11%) while in production, citrus are 80% of total fruits produced followed by banana (19%). and other fruits (1%). Potato shares 39% area under vegetable cultivation followed by other vegetables (34%), peas (8%), cabbage and okra (5% each), tomato (4%) and cauliflower (3%). Production-wise potato shares 38% of the total vegetable production, followed by other vegetables (31%), tomato and peas (7% each), okra and cabbage (6% each) and cauliflower (3%). Figure 44: Share in Area Production of Horticulture Crops (2010-11) Area 25.55% 53.76% 20.69% 9.51% 64.21% 26.28% Production Fruits Vegetables Spices Source: ISAP Analysis NHB Figure 45: Fruit-wise Share in Area (2010-11) Figure 46: Fruit-wise Share in Production (2010-11) Source: ISAP Analysis NHB Banana 15%Fruits 11% Citrus 74% Banana 19% Citrus 80% Other Fruits 1%
  • 49.
    39Chapter 3 |Horticulture Scenario in North East Region Table 25: Crop-wise Area, Production and Productivity of Horticultural Crops in Sikkim (2010-11) Sl. No. Crop Sikkim NER India Area (ha) Production (MT) Productivity (MT/ha) Productivity (MT/ha) Productivity (MT/ha) A Fruits 1 Banana 1,730 3,350 1.94 12.46 35.86 2 Citrus 8,330 14,420 1.73 5.30 8.82 3 Other Fruits 1,280 130 0.10 Total Fruits 11,340 17,900 1.58 8.57 11.73 B Vegetables 1 Brinjal 250 1,590 6.36 14.02 17.49 2 Cabbage 1,180 6,900 5.85 18.47 21.55 3 Cauliflower 740 3,900 5.27 15.72 18.29 4 Okra 1,100 7,170 6.52 10.99 11.61 5 Onion 300 1,600 5.33 3.15 14.21 6 Peas 1,950 8,550 4.38 2.64 9.51 7 Potato 9,400 45,700 4.86 8.77 22.72 8 Tomato 940 8,050 8.56 19.83 19.45 9 Other Veg. 7,995 37,440 4.68 7.50 Total Vegetables 23,855 120,900 5.07 10.13 17.25 C Spices 1 Ginger 8,510 45,890 5.39 2 Turmeric 670 3,600 5.37 Total Spices 9,180 49,490 5.39 5.28 1.82 Grand Total 44,375 188,290 4.24 9.11 12.73 Source: NHB Figure 47: Vegetable-wise Share in Area (2010-11) Figure 48: Vegetable-wise Share in Production (2010-11) Source: ISAP Analysis NHB Cabbage 5% Cauliflower 3% Okra 5% Onion 1% Peas 8% Potato 39% Tomato 4% Other Veg. 34% Brinjal 1% Cabbage 6% Cauliflower 3% Okra 6% Onion 1% Peas 7% Potato 38% Tomato 7% Other Veg. 31% Brinjal 1%
  • 50.
    40 Value ChainAnalysis of Select Crops in North Eastern States Sikkim has four agro-climatic zones based on the altitude and rainfall.ˆˆ Horticultural scenario is characterised by very low productivity. Two-third of horticultureˆˆ production comprises of vegetables, while fruits contribute less than 10 percent to the total horticultural production. Seasonality of mandarin is same as the Bhutan mandarin but it is unable to competeˆˆ with the Bhutanese mandarin at the market because of high per unit logistic cost, thus slowly Sikkim mandarin is being replaced by Bhutan mandarin for export to Bangladesh. Sikkim ginger is one of the major crops and contributes one-fourth to the totalˆˆ horticultural production. During season, there is a situation of glut in the market. Government agencies such as SIMFED NERAMAC are procuring ginger and transporting it to Gangtok and Siliguri market. However, these two agencies are profit making bodies and do not support farmers in case of glut. Sikkim produces more than 90 percent of the total large cardamom produced in India,ˆˆ various market-led interventions such as auctioning system have led to high price realisation by the farmers. Salient Features of Horticulture in Sikkim Crops Jan Feb Mar Apr May Jun Jul Aug Sep Oct Nov Dec Banana                         Passion Fruit                   Mandarin                         Cabbage             Cauliflower                     Peas                         Potato                         L. Cardamom                         Ginger                         Off Season Vegetables                                             Beginning Peak Lean Figure 49: Seasonality of Major Crops in Sikkim Source: “An In-depth Market Study and Impact Assessment Report” The horticultural crops of Sikkim such as mandarin and passion fruit are commercially cultivated and can be processed and marketed to distant markets, profitably. The state has made considerable improvement in vegetable production, but certain vegetables of subtropical and tropical region are being imported from other states. However, the off season vegetables grown in the high altitude areas are being exported to other states. In case of spices, the state is the largest producer of large cardamom. Also, floriculture has immense potential due to favourable climate and altitude.
  • 51.
    41Chapter 3 |Horticulture Scenario in North East Region Tripura Agro-Climatic Zones Potential Crops Grown The ICAR has categorised Tripura under agro-climatic zones of Humid Eastern Himalayan Region. The distribution of horticultural crops among districts is depicted below: Horticulture Scenario The state occupies about 66 thousand ha area under horticultural crops cultivation and produces 802 thousand MT of varied horticulture produce. The overall productivity of horticulture crops in the state analysed to be 11.98 (MT/ha) which is higher compared to NER productivity levels (9.11 MT/ha) but lower than national levels (12.73 MT/ha). The productivity of both fruits and vegetables in the state is found to be more than NER productivity levels. Sl. No. Potential Horticultural Crops Grown Districts/Areas 1 Pineapple All Districts of State but mainly North ( Nalkata, Kanchanchera, Nepaltila, Darchar, Betchera) and West (Kamramgatali, Sheelghati, Mohan Bhog, Jumerdhepa, Baidagi Bazar) districts 2 Jackfruit Litchi All Districts of State (South, West, Dhalai and North) 3 Orange North and Dhalai District 4 Banana West and South Districts 5 Potato South and West Districts 6 Tomato West District 7 Cauliflower and Cabbage West, South and North District 8 Ginger South and North District 9 Turmeric South District Source: “An In-depth Market Study and Impact Assessment Report” Table 26: Agro-Climatic Zones in Tripura Table 27: Area, Production and Productivity of Horticultural Crops in Tripura (2010-11) Crops Tripura NER India Area (ha) Production (MT) Productivity (MT/ha) Productivity (MT/ha) Productivity (MT/ha) Fruits 31,934 269,894 8.72 8.57 11.73 Vegetables 36,019 532,337 14.78 10.13 17.25 Grand Total 66,953 802,211 11.98 9.11 12.73 Source: NHB Amongst horticulture crops grown in the state, fruits occupy nearly 46.20% of the area and vegetables 53.80%. From the production point of view, fruits add about 33.64% and vegetables 66.36% to the production basket of the state. Most of the cultivators follow traditional methods of producing crops. The state government of Tripura has taken special steps to improve the agricultural growth of the region.
  • 52.
    42 Value ChainAnalysis of Select Crops in North Eastern States Figure 50: Share in Area Production of Horticulture Crops (2010-11) Area 46.20% 53.80% 33.64% 66.36% Production Fruits Vegetables Source: ISAP Analysis NHB Table 28: Crop-wise Area, Production and Productivity of Horticultural Crops in Tripura (2010-11) Sl. No. Crop Tripura NER India Area (ha) Production (MT) Productivity (MT/ha) Productivity (MT/ha) Productivity (MT/ha) A Fruits 1 Banana 7,800 12,500 1.60 12.46 35.86 2 Litchi 2,934 16,565 5.65 6.59 6.41 3 Mango 5,408 23,861 4.41 6.70 6.61 4 Papaya 1,541 22,578 14.65 15.71 39.75 5 Citrus 6,078 39,053 6.43 5.30 8.82 6 Pineapple 6,789 153,309 22.58* 11.93 15.95 7 Other Fruits 384 2,008 5.23 Total Fruits 31,934 269,894 8.72 8.57 11.73 B Vegetables 1 Brinjal 3,199 43,876 13.72 14.02 17.49 2 Cabbage 1,868 45,625 24.42 18.47 21.55 3 Cauliflower 1,843 33,752 18.31* 15.72 18.29 4 Okra 1,589 12,498 7.87 10.99 11.61 5 Potato 6,238 109,790 17.60 8.77 22.72 6 Tomato 1,382 30,152 21.82* 19.83 19.45 7 Other Veg. 19,900 256,644 12.90 7.50 Total Vegetables 36,019 532,337 14.78 10.13 17.25 Grand Total 66,953 802,211 11.98 9.11 12.73 * Productivity is higher than NER and national average productivity Source: NHB Figure 51: Fruit-wise Share in Area (2010-11) Figure 52: Fruit-wise Share in Production (2010-11) Source: ISAP Analysis NHB Banana 25% Litchi 10% Mango 17% Citrus 20% Papaya 5% Pineapple 22% Other Fruits 1% Banana 5% Litchi 6% Mango 9% Papaya 8% Citrus 14% Pineapple 57% Other Fruits 1%
  • 53.
    43Chapter 3 |Horticulture Scenario in North East Region In terms of fruit area, banana has 25% area under cultivation followed by pineapple (22%) citrus (20%), mango (17%), litchi (10%) and papaya (5%) while in terms of production pineapple shares 57% followed by citrus (14%), mango (9%), papaya (8%), litchi (6%) and banana (5%). Figure 53: Vegetable-wise Share in Area 2010-11 Figure 54: Vegetable-wise Share in Production (2010-11) Source: ISAP Analysis NHB Brinjal 9% Potato 17% Okra 5% Cabbage 5% Cauliflower 5% Tomato 4% Other Veg. 55% Brinjal 8% Cabbage 9% Cauliflower 6% Okra 2% Potato 21% Tomato 6% Other Veg. 48% In terms of area under vegetables, other vegetables have 55% area under cultivation, followed by potato (17%), brinjal (9%), cabbage, cauliflower and okra (5% each) and tomato (4%) while in terms of production, other vegetable have 48% share, followed by potato (21%), cabbage (9%), brinjal (8%), tomato and cauliflower (6% each) and okra (2%). Contribution of other vegetables in the state accounted for 32%. Over the years, the production of vegetables has also gained momentum in the state. Previously, vegetables from outside the state used to come to Tripura, whereas some vegetables such as ‘kakrol’, ‘chara kachu’ (mukhi), patol, radish, sweet gourd etc. are also reaching the markets of other states. The cultivation of vegetables, which was mainly confined to traditional areas, has now spread over to non-traditional areas. Also, introduction of hybrid vegetables has started a new era in vegetable cultivation in the state. Crops Jan Feb Mar Apr May Jun Jul Aug Sep Oct Nov Dec Banana                         Pineapple                         Orange                         Mango                         Potato                         Lemon                                             Beginning Peak Lean Figure 55: Seasonality of Major Crops in Tripura Source: “An In-depth Market Study and Impact Assessment Report”
  • 54.
    44 Value ChainAnalysis of Select Crops in North Eastern States Tripura has favourable climatic conditions which offer immense scope for cultivation of various kinds of horticultural crops including fruits, vegetables, spices, nuts and flowers. Agriculture is the backbone of the economy of Tripura. Most of the indigenous local inhabitants of the state are engaged in the traditional occupation of cultivating fruits and vegetables. Some of the important agricultural products of the state of Tripura are jackfruit, orange, pineapple, banana, mango, litchi, lemon, kharif vegetables, potato, rabi vegetables, cashewnut, coconut, areca nut, turmeric, ginger and chilly. The farmers of the state practice organic cultivation of fruits, vegetables and spices. Tripura has a distinctive advantage and potential in some of the horticulture commodities such as pineapple (22.58 MT/ha), cabbage (24.42 MT/ha), cauliflower (18.31 MT/ha) and tomato (21.82 MT/ha). The productivity levels of these crops in the state are found to be higher, compared to national and NER productivity levels. Based on the above discussion, it has emerged that there is a wide variety of horticulture produce/crops available in all the states of NER. However, all these crops do not qualify to meet the parameter of commercial threshold level to be projected as a potential crop; therefore an exercise is being carried out to select the potential crops for undertaking detailed value chain study. Vegetable produced constitute 2-3rd of the total horticulture crops, although fruitsˆˆ are only 1/3rd of the total crops. Pineapple is produced in large area, but there is a problem of abundance. Productivity of horticulture crops is better than or at par with entire NE Region.ˆˆ Major chunk of pineapple, jackfruit and vegetables are sent to Bangladesh throughˆˆ unofficial channels. Tripura has been notified as an AEZ for pineapple.ˆˆ The only conduit for pineapple is biweekly markets which present daily harvesting ofˆˆ produce hence quality degradation of the fields. Government initiatives have made farmers adopt staggering plants to extend theˆˆ availability of the produce. Salient Features of Horticulture in Tripura
  • 55.
    C hap te r Identification of Focus Crop Groups 4 With a view to identify the commercially potential crops, various crops have been rated on the basis of certain parameters, which have been devised keeping various production and market- related factors in mind. These parameters have helped in selecting the crops in a particular state as well as crop production clusters within a state, so that the crops for detailed value chain analysis may be decided. The key parameters adopted for the selection of focus crop groups and their production clusters are detailed below: Contribution of crops in the NER:™™ To assess the importance of each crop in the total crop basket of horticultural crops, percentage contribution has been calculated on the basis of volume and value, as these crops, due to high value or volume have the potential to achieve economy of scale and can make space in distant markets. Crops contributing significantly to this basket have been selected for the detailed value chain study. Economically important crops:™™ There are few high value crops in the region which can absorb the cost of logistics to compete in the distant markets with products arriving from various other production belts either domestically or internationally. Exclusive window of production:™™ Certain horticulture crops are produced only in some states of NER during times when there is no production in other parts of the country; such crops are transported to the other states during the times when there is no production and qualify for off season crops. Demand in distant market:™™ Certain crops which are produced in abundant quantity or such products which are ethnic in nature in NER and have a good demand in the distant markets have also been included in the list of Focussed Crop Groups for the purpose of study. Inherited advantage:™™ The agro-climatic conditions prevalent in a particular region are suitable for the production of certain crops. Such regions/states possess inherited advantage in the production of these crops. Contiguity of potential area:™™ The production clusters of a crop in a state are either contiguous or non-contiguous which determines the feasibility of consolidation of produce and its further movement to the markets. On the basis of the contiguity of production areas and taking into account the potential production areas, crops have been selected. Integration of activities for commercial uptake:™™ The availability of post-harvest, marketing and logistics infrastructure, processing and value addition facilities have been taken into account to arrive at the commercial viability of different crops.
  • 56.
    46 Value ChainAnalysis of Select Crops in North Eastern States Product-wiseContributionofStatesinNERProductionBasket(2010-11) Sl. No. State/CropArunachal Pradesh AssamManipurMeghalayaMizoramNagalandSikkimTripuraTotalNER Production (MT) %Sharein TotalNER Production%ShareinTotalNERProduction(Volume) 1Apple99.75%0.00%0.00%0.00%0.00%0.18%0.07%0.00%28,4330.96% 2Banana2.13%71.29%7.53%0.00%11.68%5.81%0.33%1.23%1,015,07534.41% 3Grapes0.00%0.00%0.00%0.00%99.51%0.49%0.00%0.00%20,5000.69% 4Guava0.00%94.42%0.00%0.00%2.18%1.36%0.09%1.95%103,0483.49% 5Litchi0.00%68.82%0.00%0.00%2.70%0.29%0.03%28.15%58,8451.99% 6Mango0.00%63.66%0.00%0.00%3.82%0.54%0.00%31.98%74,6112.53% 7Papaya0.00%76.31%0.00%3.86%3.83%3.18%0.00%12.82%176,1285.97% 8Citrus26.93%38.95%9.06%6.36%7.17%2.78%2.36%6.39%611,52120.73% 9Kiwi96.35%0.00%0.00%0.00%3.65%0.00%0.00%0.00%4,0790.14% 10PassionFruit0.00%0.00%92.47%0.00%7.53%0.00%0.00%0.00%78,4912.66% 11Pineapple9.22%31.22%15.65%12.17%1.92%8.13%0.00%21.69%706,87723.96% 12OtherFruits19.09%0.00%77.84%0.00%3.07%0.00%0.00%0.00%72,7202.46% FruitProduction(MT)297,6341,502,200371,601131,700218,169141,25017,900269,8742,950,328100.00% 13Ginger1.45%36.02%8.49%18.03%10.67%10.02%15.32%0.00%299,52512.42% 14Turmeric0.00%15.19%25.50%15.46%37.45%0.77%5.62%0.00%64,00210.77% 15Brinjal0.00%77.18%0.00%3.68%4.08%0.70%0.50%13.87%316,3984.67% 16Cabbage0.00%77.51%7.09%4.43%4.13%0.37%0.85%5.62%812,47212.91% 17Cauliflower0.00%76.73%5.35%8.23%0.86%0.05%0.91%7.87%428,5986.81% 18Okra0.00%76.48%0.00%3.04%9.68%0.62%3.71%6.47%193,2043.99% 19Onion0.00%80.55%0.00%11.23%2.37%0.00%5.84%0.00%27,3980.58% 20Peas0.00%22.61%56.91%5.98%2.55%1.25%10.69%0.00%79,9492.02% 21Potato0.00%69.08%0.00%15.21%0.21%0.94%4.28%10.28%1,067,77510.42% 22Tomato0.00%80.12%4.17%5.69%1.28%0.83%1.67%6.24%483,29910.71% 23Chilly0.00%0.00%56.31%0.00%43.69%0.00%0.00%0.00%109,51110.53% 24OtherVegetables0.79%41.69%5.15%7.10%9.49%5.88%3.81%26.10%983,48714.18% Veg.Production(MT)12,1073,043,088300,253420,404277,144109,895170,390532,3374,865,618100.00% Source:ISAPanalysis,NHBandSateHorticultureDepartments Table29:Product-wiseContributionofStatesinNERProductionBasket(2010-11)
  • 57.
    47Chapter 4 |Identification of Focus Crop Groups Product-wiseContributionofStatesinNERProductionValue(2010-11) Sl. No. State/CropArunachal Pradesh AssamManipurMeghalayaMizoramNagalandSikkimTripuraTotalNER Production (Valuein Cr) %Sharein TotalNER Production (Value) %ShareinTotalNERProduction(Value) 1Apple28.69%0.00%0.00%0.00%0.00%0.12%0.37%0.00%271.453.10% 2Banana7.93%55.06%26.22%0.00%51.80%53.18%22.65%5.92%3,516.9440.15% 3Grapes0.00%0.00%0.00%0.00%21.15%0.21%0.00%0.00%168.611.92% 4Guava0.00%2.14%0.00%0.00%0.28%0.36%0.18%0.27%103.051.18% 5Litchi0.00%5.58%0.00%0.00%1.26%0.28%0.24%14.21%369.404.22% 6Mango0.00%4.93%0.00%0.00%1.70%0.49%0.00%15.41%352.754.03% 7Papaya0.00%8.64%0.00%6.80%2.49%4.26%0.00%9.03%515.585.89% 8Citrus47.48%14.24%14.93%36.17%15.04%12.06%76.56%14.52%1,663.9018.99% 9Kiwi2.50%0.00%0.00%0.00%0.11%0.00%0.00%0.00%24.470.28% 10PassionFruit0.00%0.00%17.97%0.00%1.86%0.00%0.00%0.00%196.232.24% 11Pineapple13.40%9.40%21.25%57.02%3.32%29.02%0.00%40.64%1,371.4615.66% 12Fruit(value)5.15%0.00%19.62%0.00%0.98%0.00%0.00%0.00%254.522.91% TotalFruits943.734,552.931,009.65292.60793.32384.3751.25731.928,759.77100.00% 13Ginger61.64%8.84%7.91%25.69%10.44%50.16%44.61%0.00%1,292.1912.42% 14Turmeric0.00%3.23%20.59%19.09%31.76%3.36%14.20%0.00%1,120.0410.77% 15Brinjal0.00%7.12%0.00%1.97%1.50%1.31%0.55%8.51%485.614.67% 16Cabbage0.00%19.77%6.87%6.56%4.20%1.92%2.57%9.53%1,342.9112.91% 17Cauliflower0.00%10.32%2.73%6.43%0.46%0.13%1.45%7.05%708.426.81% 18Okra0.00%6.04%0.00%1.39%3.05%1.00%3.48%3.40%415.623.99% 19Onion0.00%0.92%0.00%0.75%0.11%0.00%0.79%0.00%60.220.58% 20Peas0.00%0.90%8.62%1.38%0.41%1.02%5.06%0.00%210.082.02% 21Potato0.00%14.22%0.00%18.18%0.17%3.93%10.46%14.09%1,084.1410.42% 22Tomato0.00%16.95%3.35%6.99%1.08%3.57%4.18%8.78%1,113.9310.71% 23Chilly0.00%0.00%44.45%0.00%36.23%0.00%0.00%0.00%1,095.1110.53% 24OtherVeg.38.36%11.68%5.47%11.56%10.60%33.60%12.65%48.65%1,475.2314.18% Veg.(value)30.375,264.981,387.12907.001,320.84258.03443.79791.3610,403.49100.00% Source:ISAPanalysis,NHBandSateHorticultureDepartments Table30:Product-wiseContributionofStatesinNERProductionValue(2010-11)
  • 58.
    48 Value ChainAnalysis of Select Crops in North Eastern States 1. Pineapple Sl.No. Criteria Ar.Pradesh Assam Meghalaya Manipur Mizoram Nagaland Sikkim Tripura Total 1 Contribution of crops in NER 1 2.9 1.5 1.2 0.1 0.8 0 2.5 10 2 Economically important crop/s 0 2 2 1.5 0 1.5 0 3 10 3 Exclusive window of production 1 1 1 1 1 2 0 3 10 4 Accessability 0.5 2.5 1.5 1.25 1.25 1.5 0 1.5 10 5 Contiguity of potential area 0.5 1 2 0.5 3 3 10 6 Integration of activities for commercial uptake 0.5 1.5 1.5 0.5 2 0 4 10 Total 3.5 10.9 9.5 5.95 2.35 10.8 0 17 2. Citrus Sl.No. Criteria Ar.Pradesh Assam Meghalaya Manipur Mizoram Nagaland Sikkim Tripura Total 1 Contribution of crops in NER 2.7 3.9 1 0.6 0.7 0.2 0.2 0.7 10 2 Economically important crop/s Same for all states 3 Exclusive window of production Same for all states 4 Accessability 0.5 2 1.5 1 1 1 2 1 10 5 Contiguity of potential area 1.5 2 2 0.5 0.5 0.5 2 1 10 6 Integration of activities for commercial uptake 0.5 2 1 3 1 1.5 1 10 Total 5.2 9.9 5.5 5.1 3.2 1.7 5.7 3.7 3. Ginger Sl.No. Criteria Ar.Pradesh Assam Meghalaya Manipur Mizoram Nagaland Sikkim Tripura Total1 Contribution of crops in NER 0.1 3.6 0.9 1.8 1 1 1.5 0.1 10 2 Inherited Advantage 1 1.5 1 1 1.5 2 1 1 10 3 Exclusive window of production Same for all states 4 Accessability 0.5 1.75 1.75 1 1 1.5 1.5 1 10 5 Contiguity of potential area 0.7 2 1.8 1.75 0.75 1.25 1.25 0.5 10 6 Integration of activities for commercial uptake 0 2.5 2 1 0.5 1 3 0 10 Total 2.3 11.35 6.95 6.55 4.75 6.75 8.25 2.6
  • 59.
    49Chapter 4 |Identification of Focus Crop Groups 4. Turmeric Sl.No. Criteria Ar.Pradesh Assam Meghalaya Manipur Mizoram Nagaland Sikkim Tripura Total 1 Contribution of crops in NER 0 1.5 2.5 1.5 3.7 0.1 0.6 0.1 10 2 Inherited Advantage Same for all states 3 Exclusive window of production Same for all states 4 Accessability 0.5 1.75 1.75 1 1 1.5 1.5 1 10 5 Contiguity of potential area 0.5 2.5 1 1.5 2 1 1 0.5 10 6 Integration of activities for commercial uptake 0.5 2.5 1 2 2 1 0.5 0.5 10 Total 1.5 8.25 6.25 6 8.7 3.6 3.6 2.1 Source: ISAP Analysis Identified Focus Crop Groups Based on the Parameters Identified for Selection Criteria Focus Crop Group Arunachal Pradesh Assam Manipur Meghalaya Mizoram Nagaland Sikkim Tripura Pineapple   √   √   √   √ Citrus   √ √  √     √   Ginger   √   √     √   Turmeric   √  √ √       Passion Fruit           √     Kiwi Fruit √               Naga Chilli           √     Large Cardamom             √   Vegetables   √   √         Source: ISAP Analysis Table 31: Identified Focus Crop Groups
  • 60.
    50 Value ChainAnalysis of Select Crops in North Eastern States Identified Production Clusters of FCGs* Crops Arunachal Pradesh Assam Manipur Meghalaya Mizoram Nagaland Sikkim Tripura Citrus Kamrup (R), Kamrup (M), Tinsukia, Karbi Anglong, N.C. Hills Tamenglong, Ukhrul, C.Cpur East Khasi Hills, West Khasi Hills, Jaintia Hills East, South, West Kiwi Tawang, West Kameng, Lower Subansiri Pineapple Cachar, Kamrup, Karbi Anglong, N.C. Hills Ri Bhoi, East Garo Hills, West Garo Hills Kohima, Wokha, Mokokchung, Dimapur, Peren South, West, Dhalai, North Passion Fruit Kohima, Wokha, Mokokchung Ginger N C Hills, Karbi Anglong, Golaghat, Sonitpur Ri Bhoi, East Garo Hills, West Garo Hills East, South, West Turmeric Kamrup, Barpeta, Sonitpur, Nagaon, Baksa, Golaghat, Lakhimpur, Karbi Anglong Jaintia Hills, West Garo Hills Saiha, Champhai, Mamit, Kolasib, Serchhip Naga Chilli Kohima, Dimapur, Peren Large Cardamom North, East Vegetables Darrang, Kamrup, Barpeta, Marigaon East Khasi Hills, Jaintia Hills, East Garo Hills, West Garo Hills * Detailed criteria of clusters selection in identified states are given in annexure Source: ISAP Analysis Table 32: Identified Production Clusters of FCGs
  • 61.
    51Chapter 4 |Identification of Focus Crop Groups A complex matrix of criteria described above was prepared for all the eight states of NER based on field experience and inputs from experts, which has led to shortlisting the focus crop groups which will be studied for a specific state. Weighted average method was adopted to select the state and for identification of cluster for study, major production cluster was taken into account. The score cards for each crop have been depicted below. As these score cards have been based on field observation and perception of experts, there are chances that opinion of people may differ from each other; however, an exercise has been done to compile these tables as practically as possible. Seasonality of Selected Fcgs In case of perishable produce, it is important to know the availability of the produce for marketing and getting better prices. In NE Region, vegetables banana are available throughout the year. Ginger is available mainly in the months of February and May. Pineapple is harvested twice in a year i.e. May to August and December to January. Mandarin is available from November to January. Turmeric is harvested from December to January. Passion fruit is harvested in the months between September and December. Cardamom is harvested twice in a year i.e. July–August and November–January. Therefore, it is important to understand that one or the other horticultural crops are available throughout the year from NER and due to varying altitude, the availability of each crop is possible for extended duration from different production clusters. On the basis of parameters followed for the selection of Focus Crop Groups, the major crops, seasonality and their production clusters have been mapped. A detailed product rank matrix has been developed to filter out the crops, which have potential and have been selected for detailed value chain mapping. Crops Jan Feb Mar Apr May Jun Jul Aug Sep Oct Nov Dec Kiwi                         Pineapple                         Mandarin                         Large Cardamom                         Turmeric                         Passion Fruit                         Ginger                         Vegetables                         Naga Chilli                         Beginning Lean Peak Figure 56: Availability of Horticultural Produce in NE Region Source: “An In-depth Market Study and Impact Assessment Report”
  • 63.
    C hap te r Value Chain Analysis 5 An extensive study of the production region of the crops was undertaken during the field visits to map the detailed value chain from production to post-harvest management and marketing. The stages covered during value chain study are production, pre-harvest, post- harvest and marketing. During the survey and analysis, various aspects of production such as sources of input material supply, production practices, level of input application, crop varieties, labour requirement, technology adoption, intercultural operations, harvesting time and methods, seasonality, logistics and marketing were covered. Detailed value chains of the following crops have been mapped: Pineapple – Assam, Meghalaya, Tripura, Nagaland™™ Citrus – Assam, Manipur, Meghalaya, Sikkim™™ Ginger – Assam, Meghalaya, Sikkim™™ Turmeric – Assam, Meghalaya, Mizoram™™ Kiwi – Arunachal Pradesh™™ Passion Fruit – Nagaland™™ Vegetables – Assam, Meghalaya™™ Naga Chilli – Nagaland™™ Large Cardamom – Sikkim™™ Pineapple All the eight North Eastern states produce pineapple. The advantageous position of NER in terms of fertile and organically rich soils, abundant rainfall, water resources and great agro- climatic diversity supports the cultivation of best quality pineapple in the region. The region produces more than 40 percent of pineapple produced in the country and almost 90-95 percent of the produce is organic. Pineapple produced in the region is qualitatively different and is said to be among the best in the world as they are sweet (high TSS) with less fibre. Pineapple is a perennial crop with an economic life of 5-7 years, however, in the North Eastern region; the farmers cultivate it beyond 12-15 years through crop manipulation and traditional agronomic practices. In many parts of North Tripura and in the Barak valley of Assam, even 20-25 year old plantations can be seen. Assam, Tripura, Meghalaya and Nagaland are major pineapple producing states. There are two popular varieties of pineapple cultivated in North East: Kew (also known as Smooth Cayenne) – Suitable for canning with an average fruit1. weight of 2-3 kg. Queen – Table fruit variety with an average fruit weight of 1-2 kg.2.
  • 64.
    54 Value ChainAnalysis of Select Crops in North Eastern States Assam In Assam, pineapple is cultivated in all districts, while the identified clusters for pineapple cultivation are Cachar, Kamrup, Sonitpur, Karbi Anglong and North Cachar Hills. Kew, Giant Kew and Queen are the major varieties grown in the state. Production Practices™™ Planting is done from April to October. About 30,000 to 40,000 plants are accommodated in one ha area. Propagation of pineapple is done through suckers which costs ` 3 per sucker. Flowering starts next year in March-April and June-July while fruiting starts five months after flowering. Pineapple is a perennial crop; hence cultivation lasts for four to seven years. The crop cycle of pineapple for optimum production is four years but farmers in Assam take the crop till the seventh year from planting. Productivity starts decreasing 4th year onwards. As per the FGDs held with the farmers, the cost of production of pineapple for the first five years is as follows: In the first year, the plantingv material cost is the major cost which accounts for about 70 percent of the total production cost. The other costs involved are the costs for irrigation, manures and fertilisers, insecticides and pesticides which remain almost constant during the first four years. The labour cost during first year is nearly 25 percent of the total cost which gradually increases to 40 percent in second year and 74 percent in the subsequent years. Labour in the first year is employed for farm operations such as land preparation and sowing while from the second year onwards it is employed for intercultural operations and harvesting. Around 200-250 mandays are required in the first year, while in the second year 50 mandays are employed and from the third year onwards 200-250 mandays are required for various farm operations such as application of manures, fertilisers, pesticides, weeding and harvesting. Year 1 Year 2 Year 3 Year 4 Year 5 Labour cost (Manday) 37500 7500 30000 30000 30000 Irrigation 1500 1500 1500 1500 1000 Insecticide/Pesticide 1000 1000 1000 1000 500 FERTILIZER 4000 4000 4000 4000 5000 FYM/VERMICOMPOST 4000 4000 4000 4000 4000 Planting Material Cost 105000 0 0 0 0 Total Cost 153000 18000 40500 40500 40500 0 20000 40000 60000 80000 100000 120000 140000 160000 180000 CostinINR Figure 57: Cost of Pineapple Production in Assam Source: ISAP Analysis from farmers’ interaction
  • 65.
    55Chapter 5 |Value Chain Analysis The above cost analysis has been carried out taking into account the cost of production for the first five years during which the fruit yield is optimum and cost of planting material dominating in the first year and labour being another predominant part of the value chain. Post-harvest Practices:™™ Harvestingƒƒ : The fruiting starts from the second year onwards, the fruit bearing is good till the fourth year of planting and reduces afterwards. However, the farmers take the crop till the seventh or eighth year. The fruits are harvested in May-August and November-December. Average weight of each pineapple is 1-1.5 kg and yield of Kew variety is 30-35 MT/ha. Average cost of production is approximately ` 3 per piece. The farm gate price per piece varies from ` 4 to ` 12 depending upon the production and market demand. During the lean season, the farmer gets ` 8-12 per piece while during the peak season, when there is abundant supply in the market, the farmer is able to sell it at ` 4-6 per piece. Value Addition at Farm Level:ƒƒ Before taking to the market, the farmers grade the produce as per size. Generally fruits of 1 to 1.5 kg weight are more acceptable. Marketing and Logistics:ƒƒ Marketing channels followed by the farmer are as depicted in the figure below: Farmers ` 0.5 per fruit ` 0.6 per fruit Local Market Aggregators Markets in Guwahati Markets in Guwahati/Kolkata At farm gate At farm gate Contractors Manuring Fertilisers Insecticides Pesticides Irrigation Labour Cost Planting Material Yr 1–70% Yr 2–0 Yr 3–0 Yr 4–0 Yr 5–0 Yr 1–2.6% Yr 2–22% Yr 3–10% Yr 4–10% Yr 5–10% Yr 1–3% Yr 2–22% Yr 3–9.88% Yr 4–9.88% Yr 5–9.88% Yr 1–1.0% Yr 2–5.0% Yr 3–3.0% Yr 4–3.0% Yr 5–2.0% Yr 1–1.0% Yr 2–8.0% Yr 3–4.0% Yr 4–4.0% Yr 5–4.0% Yr 1–25.0% Yr 2–42.0% Yr 3–74.0% Yr 4–74.0% Yr 5–74.0% Figure 58: Cost Analysis of Pineapple Value Chain in Assam Source: ISAP Analysis Figure 59: Marketing Channel of Pineapple in Assam
  • 66.
    56 Value ChainAnalysis of Select Crops in North Eastern States Case Study - Bongaon From villages in Bongaon and Boko, pineapple is transported to the nearest market in gunny bags/plastic bags in small quantity by farmers while when taking to distant markets such as Guwahati, the produce is carried in Tata ACE/mini trucks in loose form. As most of the farmers do not have large quantity of produce and therefore are not able to afford to transport to the Guwahati market, they sell their product at the farm gate only. Markets at sub-division/block level act as consolidation point and from there the produce moves to Guwahati. TataAceof2000-2500fruitscapacityischargedaroundaround`1200to1500dependingupon the distance. During transportation, wastages range from 4-5 percent. At the wholesalers and retailers level, due to handling and post-harvest losses, the wastages are nearly 2 percent. In Assam, there is issue of post-harvest losses in the field when it is glut in the market and farmers leave the produce in the field itself without harvesting. Most of the produce is consumed fresh and the opportunity of processing is also not being tapped. Tripura Production Practices™™ Pineapple is cultivated in the entire state; however, few clusters such as Kumbharghat and Nalkota are major production areas. North, South, West and Dhalai districts are major pineapple producing districts in the state. Both the varieties of pineapple - Queen and Kew are grown in Tripura during mid-May to mid-September. The variety used for processing i.e. Kew covers the maximum area. Nearly 25,000-30,000 plants are being plantedinonehectareofland.Theeconomic life of the crop is 5-7 years, although farmers in the region cultivate it up to 12-15 years through traditional agronomic practices. The plants do not require much care, the farmers generally clean the cultivation patches after harvesting and can get a healthy fruit crop the next year. Pineapple field in Tripura Price Build-up Amount (in `) Price Markup (` Per Piece) % contribution Farm gate price 8.00 8.00 34% Aggregator Margin @30% 2.40 10.40 10% Transportation 0.60 11.00 3% wastage@ 5% 0.55 11.55 2% Wholesaler (@30%) 3.47 15.02 15% wastage@ 2% 0.30 15.32 1% Retailer (50%) 7.66 22.97 33% wastage@ 2% 0.46 23.43 2% Source: ISAP analysis from various stakeholders’ interaction Table 33: Price Build-up-of Pineapple from Farm Gate in Bongaon to Guwahati (per piece)
  • 67.
    57Chapter 5 |Value Chain Analysis Case Study - Bishramganj In the district of Sipahijila (Bishramganj), the average land holding of farmers under pineapple cultivation is 0.5 to 1 hectare (3-6 kenis – local unit). Since 80 percent of the crop becomes ready for harvest within a short period of 2-3 months (May-June-July), there is a situation of glut in the market which forces the farmers to sell the produce at low prices. In order to overcome this problem, ICAR Research Centre at Agartala, Tripura has come up with the following solutions to produce the fruit for more than five months in a year: Use of different planting material1. Staggered planting chemical induction of flowering2. Genotypic diversification3. Various farmers have adopted these techniques due to which they are able to get regular yield of pineapple for more than five months in a year. Post-harvest Practices™™ Harvesting:ƒƒ The peak season for pineapple harvesting in the region is May to July. The yield is around 20,000 to 25,000 fruits per ha per season. Fruit size varies from 0.5 to 2 kg (average 1 kg/piece). Thus, the production is 20 to 25 MT per ha per season. Individual farmers are able to harvest around 300-500 fruits on a daily basis to be taken to the market, however, due to non-availability of regular markets, around 20 percent of the fruits are wasted at the field level itself. Value Addition at Farm Level:ƒƒ Farmers, generally do not carry out any kind of grading at the field level and all sizes of fruits are sold as one lot. However, some progressive farmers have started grading as per size. Marketing Logisticsƒƒ : The fruits are carried from the field (from Batsuli village) to the nearby market (Bishramganj market) in a jeep or auto. At Bishramganj, the trade of pineapple takes place during two days of the week only (Sunday Thursday). Transportation cost is approximately ` 30 per 100 fruits, which comes to approximately ` 0.30 per kg/per piece. There is no wastage during the transit. In the Bishramganj market, the fruit is generally procured by traders from Sonamara who then export it to Bangladesh through unofficial trade channels. Some produce is procured by traders from Agartala also. During early season, the wholesale price of the fruit remains at ` 10 per piece, however, during peak season, the rates drop to as low as ` 2 per piece. At times, when there is no market demand, the prices drop even further. The rate mainly depends upon the size of the fruit; large and same size fruits get better price in the market. The traders from Agartala transport the produce to Agartala market in vehicles such as Bolero, Commander etc. The transportation distance is around 60 km and the cost varies from ` 0.40-0.50 per piece. The price in Agartala market varies from ` 20-40 per fruit-based on the demand and supply.
  • 68.
    58 Value ChainAnalysis of Select Crops in North Eastern States Issues: At production level, although the farmers have started adopting practice of staggering,™™ However, general production practices are still not very advanced. Regular weeding or intercultural operations are not followed by the farmers and there is no use of scientific irrigation for pineapple crop. Yield of pinapple can be improved significantly if farmers are motivated to adopt the scientific package of practices for pineapple production in the state. The marketing of pineapple has been the biggest challenge for the farmers, as™™ during the peak season, the price goes very low and sometimes there are no buyers. Earlier, companies such as Dabur and NERAMAC (North Eastern Regional Agricultural Marketing Corporation Limited) used to buy pineapple for processing purpose, but now the NERAMAC plant has been closed down and Dabur does not buy due to high logistics cost. Market is organised twice in a week at Bishramganj (for this particular cluster) and™™ farmers do not have any other choice to bring the produce in the market, other than these two days. This leads to high level of product wastage at field level due to over- maturing. Farmers ` 0.30 per fruit ` 0.40-0.50 per fruit Trader (Bishramganj Market) Agartala Market Importer from Bangladesh Figure 60: Marketing Channel of Pineapple in Tripura Price Build-up Amount (in `) Price Markup (` Per Piece) % Contribution Farm gate price 7.00 7.00 34.04% Loading/unloading 0.20 7.20 0.97% Aggregator Margin @20% 1.40 8.60 6.81% Transportation to local market 0.30 8.90 1.46% wastage@ 0% 0.00 8.90 0.00% Transportation to main market 0.50 9.40 2.43% Wholesaler (@40%) 3.76 13.16 18.29% wastage@ 2% 0.28 13.44 1.36% Retailer (50%) 6.72 20.16 32.68% wastage@ 2% 0.40 20.56 1.96% Source: ISAP analysis from various stakeholders’ interaction Table 34: Price Build-up of Pineapple from Farm Gate in Bishramganj to Agartala Market (per piece)
  • 69.
    59Chapter 5 |Value Chain Analysis Meghalaya In Meghalaya, the pineapple cultivation is carried out on the slopes. Ri Bhoi, East Garo Hills and West Garo Hills are the main production clusters identified after the study. Both the varieties – Queen and Kew are cultivated in the state. Production Practices™™ The plantations are congested as the plant to plant spacing is very less. There are about 37,500-50,000 plants per ha. For new plantations, the farmers get the planting material i.e. either sucker or crown for ` 2-3 per piece. Sowing is carried out in the month of May-June. The farmers generally do not use FYM/Vermicompost, chemical fertilisers, insecticides/ pesticides or weedicides. No irrigation is applied and the crop is dependent on the monsoon for its water requirement. Weeding is mainly done manually by the farmers and his family members. The labour is employed for harvesting and other intercultural operations. Total mandays of 400-500 are required for carrying out farm operations but generally the hired labour is available for only 100-150 mandays. The pre-harvest fruit loss due to fruit drop, insect pest attack and diseases generally ranges from 3-5 percent at the field level. Post-harvest Practices:™™ Harvesting:ƒƒ The peak season for pineapple harvesting in Meghalaya is from May to July. The average yield in the region is nearly 12-15 MT per acre (25-30 MT/ha). Value Addition at Farm Level:ƒƒ At the field level, the farmers do manual grading of fruits based on sizes (small: upto 1 kg, medium: 1.5-2.5 kg, large: 3-4 kg). The uniform and bigger sized fruits get a better price in the market. Marketing Logistics:ƒƒ The fruits are packed in bamboo baskets which accommodate 40-50 big fruits or 60-70 small fruits. The cost of the bamboo basket is ` 60 per basket and the life is one year. The produce is sold on the basis of kuri (1 kuri = 20 pineapple pieces) or big bhar (1 big bhar =64 pieces) in the local market. Thus, one bamboo baskets accommodates 2 kuri (40 pineapple pieces). The farmers usually carry the produce as head loads to the nearest transport point and from there it is transported by jeep/maxi to the local market. The transportation cost for carrying the produce to local market is ` 20-25 per bamboo basket which translates into ` 0.50-0.60 per fruit. The transportation loss while taking the produce from field to local market is approximately 0.25 percent. The produce moves through the following marketing channels: In the local market, the farmer sells the produce to the middlemen/aggregator, who then transports to the main market in the same packaging by means of mini trucks or buses. The transportation cost by mini truck is ` 40-50 per bamboo basket (` 1-1.20 per fruit) and ` 30-35 per bamboo basket (` 0.75-0.875 per fruit). The transportation cost varies with the distance also. During the transportation from the local market to main market such as Bara Bazaar and Maowing market in Shillong, the loss is about 3 percent, while at the wholesaler’s and retailers’ level the post-harvest and handling losses are 2 percent each.
  • 70.
    60 Value ChainAnalysis of Select Crops in North Eastern States Nagaland In Nagaland, major production clusters are Dimapur, Peren, Kohima, Mokokchung and Wokha. Molvom (Jharnapani) is the pioneer village in pineapple cultivation in the state, where every farmer family in the village is growing pineapple. Almost 90 percent of the fields in the villages are covered with pineapple. In the entire state, pineapple variety Giant Kew is the most popular variety cultivated. It is larger than the normal variety and average weight of a single fruit is 1.5-2 kg. Production Practices™™ The planting of pineapple is carried out in the months of March-April. Earlier the farmers were carrying out single row planting due to which the fruits used to be oversized, which are less acceptable in the market and used to fetch lower price. However, now the Government is providing training and encouraging the farmers to plant in double rows. Double row planting leads to a smaller fruit size of 1 to 1.15 kg. Farmers ` 0.50-0.60 per fruit ` 1.50-1.80 per fruit ` 1-1.20 per fruit Local Market Main Market- Shillong Markets in Guwahati/Kolhata/Silchar Main Market- Shillong Markets in Guwahati/Kolhata/Silchar Contractors Figure 61: Marketing Channel of Pineapple in Meghalaya Particular Amount (in `) Price Markup (` Per Piece) % contribution Average Selling of Farmers 15 15 41.73% Loading/Unloading 0.2 15.2 0.56% Transportation to Local Market 0.5 15.7 1.39% Cost of wastage (@ 0.25% till local market) 0.04 15.74 0.11% Aggregator charges (20%) 3.14 18.88 8.76% Transport to Main Market 1 19.88 2.78% Cost of wastage (@ 3% till Main Market) 0.59 20.47 1.64% Wholesaler's margin (@25%) 5.11 25.59 14.24% Cost of wastage (@ 2% wholesale) 0.51 26.10 1.42% Retailer's Margin (@35%) 9.13 35.24 25.42% Cost of wastage (@ 2% Retail level) 0.7 35.94 1.95% Source: ISAP analysis from various stakeholders’ interaction Table 35: Price Build-up of Pineapple from Farm Gate to Shillong
  • 71.
    61Chapter 5 |Value Chain Analysis The average number of plants per ha is 30,000 to 35,000. Up to the fourth year of harvest, the fruit size and weight is uniform and fruit is of good quality but after the fourth year, the fruit weight and size starts declining. But the farmers usually take the crop till seventh year. Farmers do not apply any farm input like chemicals, pesticides etc. A limited number of farmers are applying vermicompost. The grass near the fields is cut and spread in the field which after decomposing provides the nutrition to the plants. No outside labour is hired by the farmers for carrying out farm operations. They work in each other’s field and carry out all the necessary farm operations. Average number of mandays required for carrying out field operation in a season varies from 250-300 per ha. The wastages during production and harvesting due to rodents and heart rot account for a loss of 8 to 10 percent. Post Harvest Practices™™ Harvestingƒƒ The fruits are harvested twice a year in summer and winter as below: The average yield per ha is 30-35 MT per ha which includes both summer and winter harvest. During the first year, the production is nearly 40 percent of the total yield (optimum yield), which goes up to 80 percent and 90 percent during the second and third years of harvest respectively. Value Addition at Farm Levelƒƒ Farmers do not carry out any kind of value addition at the farm level except size grading. The produce moves through the following marketing channels: Farmers ` 0.8-1.0 per fruit ` 0.6-0.8 per fruit ` 2-2.25 per fruit Aggregators Local Markets in Dimapur/Kohima Markets in Guwahati At farm gate At farm gate Contractors Figure 62: Marketing Channel of Pineapple in Nagaland Crop Flowering Harvesting Summer March-April July-August Winter July-September November-January
  • 72.
    62 Value ChainAnalysis of Select Crops in North Eastern States Farmers take the produce to local markets in Dimapur – Murgi Patti, New Market and Old Daily market, where they sell to the aggregators/wholesalers. Post-harvest loss during transit from field to market is around 1 percent. However, due to poor connectivity, limited transportation facility and less volumes, the farmers are sometimes bound to sell the produce to the aggregator who collects it from the farm gate. Marketing and Logistics™™ The transportation of fruits from Village to the markets in Dimapur or Guwahati is done through Tata ACE/minitruck, which can carry 2000-2500 fruits. The transportation cost from Molovom village to Dimapur is ` 1000-2000 (` 0.80-1.0 per fruit) and from Molovom to Guwahati is ` 4500-5000 (` 2-2.25 per fruit). The aggregator who collects the produce from farm gate usually takes it to distant markets such as Guwahati for better price realisation. The post-harvest losses during transit range 5-6 percent. During peak season, 10-20 mini trucks are loaded from Molovom on a daily basis. At the wholesaler’s and retailer’s level, average post-harvest and handling wastage accounts to 2 percent of the produce value. Price Build-up Amount (in `) Price Mark-up (` Per Piece) % Contribution Farm gate price 8.00 8.00 39% Aggregator Margin (@20%) 1.60 9.60 8% Loading/Unloading 0.20 9.80 1% Transportation 0.50 10.10 2% wastage@ 1% 0.10 10.20 0% Wholesaler (@30%) 3.06 13.26 15% wastage@ 2% 0.27 13.53 1% Retailer (50%) 6.76 20.29 33% wastage@ 2% 0.41 20.70 2% Source: ISAP analysis from various stakeholders’ interaction Table 36: Price Build-up of Pineapple from Farm Gate to Dimapur (per piece) Particular Amount (in `) Price Markup (` Per Piece) % Contribution Average selling price of farmers 8.00 8.00 34% Loading/Unloading 0.20 8.20 1% Transport to Guwahati 2.00 10.20 9% Cost of wastage (@ 5% till Main Market) 0.51 10.71 2% Wholesaler's Margin @40% 4.28 14.99 18% Wastage (@ 2% wholesale level) 0.30 15.29 1% Retailer's Margin (@50%) 7.65 22.94 33% Wastage (@ 2% retail level) 0.46 23.40 2% Source: ISAP analysis from various stakeholders’ interaction Table 37: Price Build-up of Pineapple from Farm Gate to Guwahati (per piece) However, there are times when the price in the market is so less, that the farmers are forced to leave their produce in the field. Pineapple is not being processed at commercial level in the state. At the time of field visit in end of February, as the season was coming to an end, the wholesale price was ` 20 per piece in the New Market and retail price was ` 25 per piece in the Old Daily Market.
  • 73.
    63Chapter 5 |Value Chain Analysis Conclusion Pineapple which is a very significant crop of the North East is also one of the traditional crops of the region and has abundant potential in terms of production and productivity. The key points which have emerged out of discussions with various value chain actors and field visits are as follows: Key Observations:™™ In most of the states, the farmers do not apply any farm inputs, so the produceƒƒ is organic by default and can be positioned as a premium product. However, in Assam, where the pineapple cultivation is carried out on plain area, the farmers are well-versed with the cultivation practices. They are applying fertilisers, insecticides, pesticides and irrigation as per their affordability. Farmers in Tripura have started adopting staggered planting which is leading toƒƒ the availability of pineapple for 5-6 months of the year. Strengths/USP:™™ In all the states and regions visited, except Assam, there are no expenses onƒƒ fertilisers and chemicals, making the produce largely organic. The cultivation practices are labour-intensive with labour employed for almost allƒƒ the activities from land preparation to harvesting. During the visit to Nagaland, a meeting was held with officials from ICCOA. ICCOA is directly procuring pineapple from the farmers as per the client’s demand for which they pay a premium of 20-30 percent above the market price. The produce is picked from the farmers’ field, packaged in CFB boxes by labourers and then transported to the railway station by means of a mini carrier of 2.5 MT capacities. This carriage costs around ` 1500 from farm gate to Dimapur railway station (30-35 km), thus the transportation cost comes to around ` 0.60 per kg (` 0.90 per fruit). From Dimapur to Kolkata, the produce is shipped via a goods train, which costs around ` 3.5 to 4 per kg. The wastages during rail transport range from 2-3 percent. During summer season last year (2011), ICCOA procured approximatelly 6 MT of pineapple from the farmers directly. ICCOA is implementing Organic Cluster Project (OCP) in Molvom (Dimapur) and Gaili (Peren) for pineapple. ICCOA is involved in training of farmers on organic farming of pineapple, ginger, turmeric, passion fruit and Naga chilli. It becomes easy to procure by making farmers’ group for a particular crop in a cluster. They are working to make farmers’ groups in the production cluster villages for potential crops. Along with government bodies they are working to improve the post-harvest practices and certification of organic farming. Their model of procurement of pineapple can be implemented in other places also by improving the cultivation, post-harvest and linkage practices. This will be helpful to directly procure from farmers and reduce the transaction cost and wastage. ICCOA - Direct Procurement from Farmers – A Case Study
  • 74.
    64 Value ChainAnalysis of Select Crops in North Eastern States Issues in Pineapple Cultivation:™™ The plantations are very congested and the plant to plant spacing is very less,ƒƒ which leads to low productivity. No technological intervention is carried out and the crop is cultivated in aƒƒ traditional method which costs a huge amount of labour and time. Mechanisation of cultivation practices, especially harvesting would save on the time and resources. Issues in Pineapple Marketing:™™ During the peak season, the markets are covered with big heaps of pineapple,ƒƒ which leads to a glut in the market. Of the total production, barely 67 percent of the fruit is processed, the rest being consumed in the fresh form, which leads to a very low price. There is no regular market in most of the production zones and a large quantityƒƒ of pineapple gets wasted in the field itself. No value addition is being undertaken by the farmers at the field level. The fruitƒƒ being perishable has a short shelf life. The absence of any kind of cold chain adds to the post-harvest wastages. Citrus The North Eastern Region where citrus is cultivated in valleys, sub-mountane areas and in low hills, has been identified as one of the major centres of diversity for citrus. The Khasi Mandarin is the most important commercial citrus crop being grown in the hilly regions of NER. Another important citrus crop is Assam lemon, which is a seedless variety of lemon and is under cultivation to a considerable extent in the region. Khasi mandarin is well-known for its quality, colour development, unique sugar acid blend and shelf life which makes it the most sought after and popular citrus cultivar in the North Eastern Region of the country. It covers the largest area in the region due to its commercial value. Assam and Meghalaya have the maximum area and production of Khasi mandarin. Assam lemon, developed from a chance seedling, is quite popular and is grown on a commercial scale in Assam and other states. In the state of Manipur, Kachai lemon – a very high yielding variety of rough lemon mainly cultivated in Kachai village of Ukhrul district is a popular variety. The value chain of lemon has been studied in detail in Assam while that of Khasi mandarin has been detailed in Assam, Arunachal Pradesh, Manipur, Meghalaya, Mizoram and Sikkim. Assam Khasi mandarin and Assam lemon are the major focus citrus crop groups identified in Assam. Kamrup, Tinsukia, Karbi Anglong and North Cachar Hills are leading production clusters of Khasi mandarin while Barpeta, Nalbari, Darrang, Kamrup have been identified as the major production clusters of Assam lemon.
  • 75.
    65Chapter 5 |Value Chain Analysis Khasi Mandarin Production Practices™™ The Khasi mandarin orchards are nearly 50-100 years old, which has led to low productivity of the fruits. One hectare orchard accommodates 300-400 trees. The fruit bearing per tree is nearly 300-400 fruits. The government is encouraging the farmers to use budded plants for planting new orchards and the rejuvenation of old orchards. However, the farmers are less interested in carrying out the rejuvenation of the orchards because they are getting produce from old orchards effortlessly while the new plantation will take time in fruiting. There is very limited input used in the orchards. Only few farmers who receive fertilisers and micronutrients from government department apply it to their fields. The planting of budded plants is carried out before the monsoons between May and August. As per the discussions held with the farmers, the cost of cultivation of Khasi mandarin was calculated as follows: 1 2 3 4 5 6 7 8 9 10 11 12 13 14 15 Labourcost(Rs./Manday) 4500 1200 1200 1200 1200 1200 1200 1200 1200 2250 2625 3000 3375 3750 4500 Irrigation 500 500 500 800 800 1000 1000 1000 1000 1200 1500 1500 1500 1500 1500 Staking 3000 Insecticide/Pesticide 200 300 300 300 300 300 300 300 300 450 450 450 600 600 600 FERTILIZER 400 800 1200 1600 2000 2400 2800 3200 3600 4000 4400 4800 5200 5600 6000 FYM/VERMICOMPOST 2000 4000 6000 8000 1000 1200 1400 1600 1800 2000 2200 2400 2600 2800 3000 0 10000 20000 30000 40000 50000 60000 70000 80000 90000 CostinINR Figure 63: Cost of Khasi Mandarin Production in Assam Source: ISAP analysis from farmers’ interaction Cultivation cost is worked out from planting till 15th year when the yield reaches its optimum level. Labour cost is the major cost in the first year of cultivation as labour is employed for land preparation, cleaning, planting and other farm operations. During the later years, the labour cost increases with the years as labour is generally employed for various intercultural operations and harvesting. The mandays requirement is 250-300 mandays per ha for fully grown orchard. The planting material cost in the first year is nearly 15 percent of the total cost, 5 percent during second year and 2 percent in the fifth year, which is mainly the cost of filling the gaps and replacing the mortal plants.
  • 76.
    66 Value ChainAnalysis of Select Crops in North Eastern States Thus, the cost of cultivation of per kg is estimated at ` 8.6, which has been calculated taking into consideration the fact that the trees start bearing fruits in the sixth year and optimum yield is obtained till the eleventh year of bearing. Post-harvest Practices:™™ Harvestingƒƒ The orchard starts bearing in the sixth year from planting, fruit bearing is around 50 fruits per tree in the sixth year which goes up to 150 fruits in the seventh year and 200-400 fruits in the subsequent years; per kg cost of production comes to around ` 8-9. However, at the production level, about 5-6 percent of the fruit is lost due to fruit drop and citrus decline. Harvesting starts in the month of November which extends up to February. The big farmers with 100 or more than 100 trees sell the fruit to the contractor before harvesting, at a pre- fixed price; the contractor does the harvesting to sell the fruit to the wholesaler in the main market. Value Addition at Farm Levelƒƒ Farmers do the manual grading of fruits in orchards only. They separate the damaged fruits and grade the fruits in three different sizes and pack them in gunny/plastic bag. When the orchard is sold to traders then all these activities are done by hired labour. Marketing and Logisticsƒƒ Following channels for the marketing of the produce are adopted in Assam: The farmers take the produce to the nearest market in plastic/gunny bags of capacity 30-35 kg. The produce is carried on the rooftop of a bus/jeep etc. which costs ` 10 per gunny bag. The farm gate price varies from ` 2-5 per piece (` 20 per kg). Per kg transportation cost is approximately ` 0.60. During transportation, the losses are up to 5 percent when transported from the village to Main market in Guwahati. At the wholesaler and retailer level, the losses are approximately 2 percent. Farmers ` 0.5 per fruit ` 0.6-0.10 per fruit Local Market Aggregators Markets in Guwahati Markets in Guwahati/Kolkata At farm gate At farm gate Contractors Figure 64: Marketing Channel of Khasi Mandarin in Assam
  • 77.
    67Chapter 5 |Value Chain Analysis One of the major constraints is that farmers are not able to access the markets in Guwahati and they sell their produce to the contractors/middlemen at the farm level. Either they are selling small quantity of citrus in local markets or orchards to the contractors; there is no organised procurement system which can help the farmers in realising better price. Price Build-up Amount (in `) Price Mark-up (` Per kg) % Contribution Farm gate price 20.00 20.00 39% Aggregator Margin @20% 4.00 24.00 8% Loading/unloading 0.20 24.20 0% Transportation 0.06 24.26 0% wastage@ 5% 1.21 25.47 2% Wholesaler (@30%) 7.64 33.11 15% wastage@ 2% 0.66 33.78 1% Retailer (50%) 16.89 50.67 33% wastage@ 2% 1.01 51.68 2% Source: ISAP analysis from various stakeholders’ interaction Table 38: Price Build-up of Khasi Mandarin from Farm Gate to End-consumer in Guwahati (per kg) Assam Lemon Assam lemon is a locally grown variety which is elongated in shape, unlike the North Indian lemon which is round in shape. Many farmers are growing it in the backyard of their houses but commercial level cultivation is also done to sell in the distant markets in Assam and neighbouring states. Production Practices™™ Farmers grow 10-20 plants in the backyard, for which they generally use their own planting material grown through stem cuttings and layering for propagation. The planting is carried out between the months of May and August before the onset of Monsoon. Nearly 800-900 plants are accommodated in one ha in a commercially managed orchard. During the first year, 300-400 mandays are required approximately for farm operations such as cleaning, land preparation, planting etc., while in the subsequent years, 200-250 labour mandays are required for various farm operations. Post-harvest Practices:™™ Harvesting:ƒƒ The plant starts bearing fruit in the second year, July to September is the peak time of harvesting. About 100-120 fruits are borne per tree under normal conditions. Fruit is borne during the entire year, off season fruit can be harvested in March. Nearly 8-10 percent of the fruit is lost at the field level due to insects, pests and diseases. Harvesting is done when the fruits gain full size. Value Addition at Farm Level:ƒƒ Only packing in gunny/plastic bags is done. Assam Lemon in Market in Assam
  • 78.
    68 Value ChainAnalysis of Select Crops in North Eastern States Lemon Village Coming up in Assam First tried out in Japan and Thailand, a concept village is coming up in a sleepy hamlet in Assam’s Nalbari district where thousands of lemon trees will be planted to improve local economy. Under the concept of ‘one village one product’, the North East Financial Development Corporation along with a leading NGO is setting up what it describes as a ‘lemon village’ at Arora, not very far from Guwahati. The institution’s chairman- cum-managing director, Kashi Nath Hazarika, says that the concept, which has been a success in Japan and Thailand, is being tried out for the first time in the Northeast with planting of nearly 10,000 lemon saplings. Hazarika says the yield, which will find a ready market among local population, will generate annual average revenue of ` 10 lakh per year. He exudes confidence that the climatic condition was suitable for the growth of lemon and the village will be able to generate its own market for the product. Hazarika during the recent launching of the scheme urged youth to set up plants for processing lemons from 2012 onwards after mass-scale production begins. Arora is an agrarian village with nearly 600 families most of whom are farmers. Initially, 250 farmers have been provided with lemon saplings. The NEDFI has facilitated one-time funding for initial requirement of manure and insecticide and has engaged a technician as mentor for the project. Hazarika hoped in the third year around 10,000 lemon plants will be grown in the village which will yield at least 10 lakh lemons. “The availability of such a large quantity of lemons from a single village will not only help the farmers, but also benefit the market.” Assam Lemon farmer in Arora village, Nalbari Marketing Logistics:ƒƒ The farmer generally transports the fruit in gunny bags to the nearby markets; one gunny bag accommodates about 50 kg of fruit. The transportation is through private vehicles such as bus/mini trucks which costs ` 10 per gunny bag. The post-harvest losses during transportation are nearly 3 percent, while at wholesaler and retailer level, the handling losses are about 2 percent. In the local market, the farmers sell the fruit to the aggregators who then further sell it to the wholesalers. Big farmers having more than 100 plants per orchard sell the orchard to the contractor who then gets the harvesting done and sells the fruit to the wholesaler or retailer directly.
  • 79.
    69Chapter 5 |Value Chain Analysis Manipur Tamenglong, Ukhrul and Chudachandpur are the major districts of citrus production in Manipur. Khasi Mandarin is the most important commercial citrus species grown up to an altitude of 1000 m above mean sea level and is the most popular cultivar in the region. Production Practices™™ On an average, there are 100-200 trees per family, out of which 60-70 percent are fruit- bearing trees. ICAR Research Centre at Imphal and KVKs are providing technical support for citrus cultivation in the state. The farmers buy the planting material (budded seedlings) from nurseries, the cost of which is around ` 10 per seedling. Approximately 300 seedlings of citrus are required for planting in one ha, planting is done at a distance of 5.5 X 5.5 m. Labour is employed for clearance of jungle and land development. After clearing the land, land preparation is done and digging and filling up of pits is carried out. All these operations are carried out by hired labour. After the filling up of the pits, the transplanting is carried out. For land preparation and planting operations, approximately 100-110 labourers are employed. The labour rates are ` 120 to ` 130 per manday. During the subsequent years, the farmers do not employ much labour and farm operations like weeding etc are done manually by family members only. The application of manures, fertilisers and pesticides is negligible. However, nowadays some farmers have started applying lime in the fields. The orchards are rain-fed with no irrigation facitilities during the growth years. Although, the package of practices has been developed by the research centre, farmers in the field are following traditional practices. Most of the citrus orchards in the state are very old and senile. Yield of existing orchards can be improved significantly by rejuvenation. The state government has received a huge fund from Central government for citrus rejuvenation; however, a very limited difference is being seen on ground. Post-harvest Practices:™™ Harvesting:ƒƒ A good bearing tree of 20 years can produce around 400-500 fruits (60-70 kg) per year. However, at the field level, due to not harvesting the fruit on time, the losses range from 10-20 percent. Price Build-up Amount (in `) Price Markup (` Per 80 Piece) % contribution Farm gate price 80.00 80.00 40% Aggregator Margin @20% 16.00 96.00 8% Loading/unloading 1.00 97.00 1% Transportation 5.00 102.00 3% wastage@ 3% 3.06 105.06 2% Wholesaler (@30%) 31.52 136.58 16% wastage@ 2% 2.73 139.31 1% Retailer (40%) 55.72 195.03 28% wastage@ 2% 3.90 198.93 2% Source: ISAP analysis from various stakeholders’ interaction Table 39: Price build-up of Assam lemon from Farm-gate in Boko to Guwahati (per 80 piece)
  • 80.
    70 Value ChainAnalysis of Select Crops in North Eastern States Marketing Logistics:ƒƒ The harvested fruit is generally packed in jute bags at the farm level for transportation; one bag accommodates on an average 200 pieces (30-35 kg). The farmers take the produce to the markets in Imphal or Tamenglong by jeep, depending upon the nearness to the market and sell it to the wholesalers. The transportation cost to Imphal (70-80 km) is ` 50 per bag of 200 pieces (30-35 kg), thus the per kg logistics cost is ` 1.50-1.80 per kg (` 0.25 per fruit). Occasionally the wholesalers buy the fruits from the farm gate itself and transport it to the market. In such cases, the transportation cost is borne by the wholesaler. Upto the point the produce reaches the retailers, the wastages during handling range from 4-5 percent, while at the retailers end, due to rejection by customers, the losses vary from 5 to 8 percent. The wholesale selling price of the fruit in Imphal is ` 250 per 100 pieces (15-17 kg) for good quality fruits, ` 120-150 per 100 pieces for average quality fruits and ` 70 per 100 pieces for poor quality fruits. The price also depends on seasonality and demand supply scenario. The retail price in the Imphal market is around ` 60-80 per kg (5-8 pieces). Financial Assistance: Manipur has got special financial package of™™ ` 218 crore from Prime Minister’s office for next five year for revival of citrus orchards in the state. In addition to the above,™™ ` 1.5 cr has been approved for setting-up of pack-houses and ` 21 crore for processing unit (from DoNER, SFAC MoFPI). Farmers ` 0.25 per fruit ` 0.25 per fruit Markets in Imphal/Tamenglong At farm gate Contractors Figure 66: Marketing Channel of Khasi Mandarin in Manipur Price Build-up Amount (in `) Price Markup (` Per kg) % Contribution Farm gate price 16.00 16.00 39% Aggregator Margin @20% 3.20 19.20 8% Loading/unloading 0.20 19.40 0% Transportation 0.06 19.46 0% wastage@ 5% 0.97 20.43 2% Wholesaler (@30%) 6.13 26.56 15% wastage@ 2% 0.53 27.09 1% Retailer (50%) 13.55 40.64 33% wastage@ 2% 0.81 41.45 2% Source: ISAP analysis from various stakeholders’ interaction Table 40: Price Build-up of Khasi Mandarin from Farm Gate to Imphal Market
  • 81.
    71Chapter 5 |Value Chain Analysis Issues and Challenges Currently, the citrus/mandarins of Manipur are losing their importance in the market due to various reasons; some of them are as follows: Lack of awareness amongst farmers about modern package of practices and inputs™™ usage. Major production area for Citrus is in Tamenglong district of Manipur and every year™™ Manipur Small Farmers’ Agri-business Consortium organises Orange Festival in the district. However, over a period of time, the focus of the festival has shifted from promoting Oranges to spending on Orange Queen (A Fashion Show organised as part of the Orange Festival). Citrus orchards in the state are very old (above 50 years) and have started decaying™™ due to lack of care and maintenance. Citrus decline has become a major threat to the orchards in the state due to improper™™ planting material, inadequate nutrition, poor management practices and damage caused by pests and diseases. Productivity has declined drastically over a period of time.™™ Accessibility to production area is the biggest challenge.™™ Although the quality of citrus is very good, however, marketing is a major issue.™™ Transportation cost in Manipur is very high, approximately four times as that in any™™ other part of the country and this makes any product of Manipur uncompetitive in the market and same is applicable for citrus. Marketing facilities infrastructure is non-existing in the state, specifically pack-™™ house, waxing facility, storage facilities etc. KVK has started training farmers on orchard maintenance – which includes plant™™ rejuvenation practices, application of fertiliser and pesticides, pruning and proper irrigation etc. Demonstration of these practices have been organised at KVK campus as well as™™ at farmers’ fields, however, there is still resistance to adoption of these practices amongst the farmers. Current political situation, issues of underground insurgency groups and lack of™™ seriousness at state government level for revival of citrus crop in the state are few factors, which have restricted the development of citrus in the state. Meghalaya The main citrus variety cultivated in Meghalaya is Khasi mandarin. Major production clusters of Khasi mandarin in Meghalaya are East Khasi Hills, West Khasi Hills and Jaintia Hills. Majority of the orchards are very old upto 80-150 years. Production Practices™™ Due to less plant to plant spacing, the plantations are congested. Number of trees per acre varies from 200 to 300 (500-750 per ha). For new plantations, the planting material costs ` 15-25 per plant. The sowing for new orchards is carried in the months of June-July. Most of the farmers apply FYM/Vermicompost to enhance the fertility of soil. The farmers are not using any kind of chemical fertiliser in the orchards. Use of insecticides and pesticides by
  • 82.
    72 Value ChainAnalysis of Select Crops in North Eastern States the farmers in the region is negligible. Approximately 10-15 percent of the fruit is lost in the field due to insect/pests (trunk borer, leaf miner, mealy bug white flies, fruit flies and sucking moth), diseases (citrus canker, gummosis, root rot and powdery mildew) and fruit drop. Only recently, for last 2-3 years few farmers have started using insecticides/pesticides. Weeding is mainly done manually by the farmers with few exceptions using weedicides (glysophate). Majority of crops in the region are monsoon-dependent. On an average 250-300 labour mandays per acre are engaged for doing various cultivation practices in citrus. The cost is around ` 200 per day for a male labourer while it is ` 100 per day for a female labourer: Post-harvest Practices™™ Harvesting:ƒƒ The plants start bearing fruit in November–December and the fruiting period continues up to February. Average yield in the region is nearly 15-20 MT/Acre. Value Addition at Farm Level:ƒƒ Manual grading of fruits based on sizes (large: 100-150 gms, medium: 80-100 gms, small: 40-50 gms) is carried out by the farmers. Marketing Logistics:ƒƒ The fruit is generally packed in bamboo baskets (small basket accommodates 55-60 kg and big basket accommodates 80-85 kg). The farmers carry the bamboo baskets on head loads to the nearest transportation point and from there it is transported by jeep/maxi which cost the farmers ` 20-25 per bamboo basket. Thus, the per kg transportation cost for local market comes to around ` 0.35 to 0.40 per kg. Farmers sell the produce to the aggregator who carries it to the main market by mini trucks or buses. Logistics cost for mini truck and bus is ` 40-50 per basket and ` 30-35 per basket respectively. However, this cost varies as per the distance from the main market. During transportation from farm gate to local market, the post-harvest losses are around 0.5 percent, while from local market to main market, the losses are upto 2 percent. The produce is sold on the basis of bhar (1 small bhar=32 pieces and 1 big bhar=64 pieces). Price of product varies with the sizes (small, medium and large). The marketing channels by which the produce moves in Meghalaya are: Farmers ` 0.35-0.40 per kg ` 1-1.25 per kg ` 0.70-0.80 per kg Local Market Contractors Main Market-Shillong Main Market-Shillong Markets in Guwahati/Kolkata/ Silchar Markets in Guwahati/Kolkata/ Silchar Figure 67: Marketing Channel of Khasi Mandarin in Meghalaya
  • 83.
    73Chapter 5 |Value Chain Analysis At the Wholesaler’s Level and Retailer’s Level, the losses are one percent each. Sikkim The only mandarin variety cultivated all over Sikkim is Khasi Mandarin which is also known as Sikkim Mandarin. Major production clusters are East, South and West districts. The orchards are around 60 years old. The rejuvenation of old orchards is very limited. One ha area accommodates 350-400 plants. Production Practices™™ Labour cost is one of the major cost in the first year as manpower is used for land preparation and planting. In the subsequent years, the labour requirement reduces lesser activities. Post-harvest Practices:™™ Harvesting:ƒƒ The fruits are harvested between October–February. At the field level, due to fruit drop, the crop loss in the production stage is 8-10 percent. The yield of the old orchards is nearly 200-250 fruits per plant. Value Addition at Farm Level.ƒƒ Marketing Logistics.ƒƒ The marketing channels followed by the farmers are: Farmer ------- Aggregator -------- Wholesaler (Gangtok) ------- Retailer ---------1. Consumers Farmer ------- Wholesaler (Gangtok) ------- Retailer -------- Consumers2. Farmer -------- Traders/Contractor (village level) ------- Wholesalers (Siliguri/Kolkata)3. ------- Retailers -------- Consumers The fruit is manually sorted and graded as per the size. The fruits are packed in gunny bags. In some cases, the farmers sell the produce to the aggregator at the village level, who then takes it to the wholesale market in Gangtok. The fruits in gunny bags are then carried on the rooftops of private vehicles to the market in Gangtok (20-30 km) and sold to the wholesaler. During transportation to Gangtok, the post-harvest losses due to handling are about 5 percent, while when carried to the distant markets of Siliguri and Kolkata, the post-harvest and handling losses are nearly 10 percent. Particular Amount (in `) Price Markup (` Per kg) % Contribution Average Selling of Farmers 32.00 32.00 56.82% Transportation to Local Market 0.70 32.70 1.24% Cost of wastage (@ 0.5% till local market) 0.16 32.86 0.29% Aggregator charges (10%) 3.29 36.15 5.84% Transport to Main Market 1.50 37.65 2.66% Cost of wastage (@ 2% till Main Market) 0.75 38.40 1.34% Wholesaler's margin (@15% ) 5.76 44.16 10.23% Cost of wastage (@ 1% wholesale) 0.44 44.60 0.78% Retailer's Margin (@25%) 11.15 55.76 19.80% Cost of wastage (@ 1% Retail level) 0.56 56.31 0.99% Source: ISAP analysis from various stakeholders’ interaction Table 41: Price Build-up of Citrus from Farm Gate to Consumers in Shillong
  • 84.
    74 Value ChainAnalysis of Select Crops in North Eastern States Another channel through which the produce reaches the market is through the trader/ contractor at the village level who buys the crop at a pre-fixed price before harvesting. He is responsible for the harvesting. Once the crop is harvested, the traders/contractors carry the fruits to the distant markets in Siliguri and Kolkata. NERAMAC and SIMFED are supporting to realise the better price but there is competition with Bhutan Mandarin in the markets of Siliguri and Bangladesh. During the end of the season (February/March), price at retail level reaches ` 100-120 for 12 pieces of orange. Conclusion Issues in Citrus Cultivation:™™ The overall productivity level of North East Region is lagging behind compared toƒƒ other states such as A.P., Karnataka, TN and MH. Majority of mandarin orchards are senile and need rejuvenation.ƒƒ Farmers use seeds from previous crops to raise the seedlings, which are grownƒƒ without any care which leads to poor quality of planting material and hence low productivity. Poor investment capability of the farmers has lead to dependency on govt. subsidyƒƒ for rejuvenation, inputs, equipments and nutrient requirements. Farmers practice traditional cultivation methods in the absence of technical know-ƒƒ how which has led to deterioration of the orchards due to various insect pests and diseases, specifically citrus decline. Majority of farmers sell their produce in the nearby local markets without anyƒƒ value addition. Price Build-up Amount (in `) Price Markup (` Per kg) % Contribution Farm gate price 20.00 20.00 40% Aggregator Margin @20% 4.00 24.00 8% Loading/unloading 0.20 24.20 0.4% Transportation 0.70 24.90 1.4% wastage@ 5% 1.25 26.15 3% Wholesaler (@30%) 7.84 33.99 16% wastage@ 2% 0.68 34.67 1% Retailer (40%) 13.87 48.54 28% wastage@ 2% 0.97 49.51 2% Source: ISAP analysis from various stakeholders’ interaction Table 42: Price Build-up of Mandarin from Farm Gate to Gangtok (per kg) Price Build-up Amount (in `) Price Markup (` Per kg) % Contribution Farm gate price 22.50 22.50 39% Loading/unloading 0.20 0.20 0.3% Transportation 1.50 24.00 2.6% wastage@ 10% 2.40 26.40 4% Contractor's Margin (@40%) 10.56 36.96 18% wastage@ 2% 0.74 37.70 1% Retailer (50%) 18.85 56.55 33% wastage@ 2% 1.13 57.68 2% Source: ISAP analysis from various stakeholders’ interaction Table 43: Price Build-up of Mandarin from Farm Gate to Siliguri (per kg)
  • 85.
    75Chapter 5 |Value Chain Analysis Though govt. regulated market are operational (catchment area of 100-200 km)ƒƒ still dependency of farmers on the intermediaries commission agents due to lack of proper FV handling infrastructure. Cash requirement of farmers forces them to distress sell in case of mandarin,ƒƒ ginger turmeric. Lack of proper logistics arrangements for fruits and vegetables adds higherƒƒ transportation cost, lack of fruit processing industry due to which the farmers have to sell the produce at throw away prices to the traders. Ginger Ginger is an important spice crop in the world. It is cultivated in almost all the states of the country; however, the North Eastern Region is one among the highest ginger productivity areas in the world. The agro-climatic conditions of North East India, characterised by warm and humid summers with abundant rainfall and cool winters are favourable for ginger cultivation. The North Eastern States of Arunachal Pradesh, Mizoram, Sikkim, Meghalaya, Manipur, Tripura and Nagaland account for 24.6% of area under ginger and 24.1% of India’s ginger production. The ginger produced in NER also has higher oil and oleoresin content, making it one of the best in quality. The traditional system of ginger cultivation in the North East is jhum system or shifting cultivation which is prevalent in all states except Sikkim. Assam Maran and Nadia are the most popular varieties of ginger grown in Assam. Major identified production clusters are Sonitpur, Udalguri, Golaghat, Tinsukia, Karbi Anglong and North Cachar Hills. Production Practices™™ Figure 68: Production Cost of Ginger in Assam Source: ISAP analysis from farmers’ interaction Ginger Labour 45000 Irrigation 2200 Fertilizers 2900 Manures 8000 Seed/Planting Materials 24000 Total 82100 0 10000 20000 30000 40000 50000 60000 70000 80000 90000 CostinINR
  • 86.
    76 Value ChainAnalysis of Select Crops in North Eastern States Approximately 1 to 1.2 MT seed ginger is used for planting one ha area. Planting is carried out in month of March-April. The farmers generally do not use much fertiliser; those who can afford the fertilisers do apply it in small quantity. Nearly 300 labour mandays are required for various farm operations such as land preparation, weeding and harvesting. At the field level, the losses are nearly 8-10 percent of the crop value due to pests and diseases. Post-harvest Practices:™™ Harvesting:ƒƒ Harvesting of the rhizomes starts in October which continues till January. Value Addition at Farm Level:ƒƒ The farmers do the cleaning, washing and packing of the rhizomes before taking it to the markets. The rhizomes are packed in gunny bags which accommodates 50 kg each. Marketing Logistics:ƒƒ The farmer usually sells the rhizome to the aggregator at the village level, who then takes it to the main market where it is sold to the wholesaler. The post-harvest and handling loss during transportation and at wholesaler’s and retailer’s level is about 2 percent each. The yield comes to 8-10 MT per ha. Thus, the production cost per kg comes to be ` 10 per kg. The average selling price of the farmer is ` 12-15, thus the farmer earns about ` 14000 per ha. Excluding the cost of family labour add to more profit. Most prevailing marketing channel of ginger in the region is as below: In most ginger growing districts except Karbi Anglong, farmers are not realising better price due to involvement of aggregators and farmers’ inability to sell the produce directly in the markets. Established ginger pack house is yet to be utilised so that farmers can supply directly to pack house. Farmers Aggregators At farm gate ` 0.8 per/kg Market in Guwahati Figure 69: Marketing Channel of Ginger in Assam Table 44: Price Build-up of Ginger from Farm Gate in Boko to Guwahati (per kg) Price Build-up Amount (in `) Price Markup (` Per kg) % Contribution Farm gate price 10.00 10.00 34% Aggregator Margin @30% 3.00 13.00 10% Loading/unloading 0.40 13.40 1% Transportation 0.80 14.20 3% wastage@ 2% 0.28 14.48 1% Wholesaler (@30%) 4.35 18.83 15% wastage@ 2% 0.38 19.21 1% Retailer (50%) 9.60 28.81 33% wastage@ 2% 0.58 29.38 2% Source: ISAP analysis from various stakeholders’ interaction
  • 87.
    77Chapter 5 |Value Chain Analysis Meghalaya In Meghalaya, ginger is cultivated on slopes. The most popular varieties under cultivation are Nadia and Vara in the identified major cluster of Ri Bhoi, East Garo Hills and West Garo Hills. Nadia is popular due to its low fibre content. Production Practices™™ Farmers generally use their own seeds (rhizomes) for cultivation purpose. The seed rate varies from 1 MT to 1.5 MT per ha. Sowing is mainly carried out in the month of April-May in the region and harvesting starts from November and goes on up to January. Farmers apply FYM/Vermicompost at the rate of 5-6 MT per ha. Use of chemical fertilisers, insecticides/ pesticides or weedicides is not practiced by the farmers in the region. The farmers usually spread the straw, grasses and other plant residues on the ginger beds immediately after planting. This acts as mulch which protects the seedlings from rain, prevents weed growth, keeps the soil moist and soft and accelerates plant growth. The crop is monsoon-dependent. Weeding is mainly done manually by the farmers. During the entire season from May to January, labour is employed for land preparation, intercultural operations and harvesting. The labour mandays used for ginger cultivation in 1 ha area range from 200 to 250. The rate of a male labour is ` 200 per day, while a female labourer charges ` 100 per day. In the field, the losses due to insects, pests and diseases range from 1-2 percent. Post-harvest Practices:™™ Harvesting:ƒƒ Ginger attains harvest maturity in 8-9 months. Hence, the peak harvest starts from November and extends till January. On an average, 8-10 MT of ginger is harvested from a hectare. Value Addition at Farm Level:ƒƒ Farmers carry out the manual grading of rhizomes based on size (small, medium and large). Price of rhizomes varies with size. Most of the farmers sell the produce to the middlemen or aggregator or the trader from the distant market in the village itself. The rhizomes are packed in gunny bags of size 50 kg which costs the farmers ` 15-20 per gunny bag. Marketing Logistics:ƒƒ The marketing channels followed by the farmers are as follows: Farmers ` 0.60/kg Aggregators Market in Shillong Contractor/ Trader Markets in Guwahati, Kolkata, Silchar etc. Figure 70: Marketing Channel of Ginger in Meghalaya
  • 88.
    78 Value ChainAnalysis of Select Crops in North Eastern States The farmers sell the ginger on the basis of rhizome size; small sized rhizomes for ` 5-6 per kg, medium sized for ` 8-10 per kg and large sized rhizomes for 12-15 per kg. The aggregator/middlemen then carry the produce to the main market where it is sold to the wholesaler who sells it further to the retailer. The traders from other states i.e, Guwahati, Kolkata and Silchar, who come to the farm gate to collect the produce, carry the ginger to their respective markets in the state to sell it to the wholesalers and retailers. The transportation cost of one gunny bag from the village to the main market by jeep/bus varies between ` 30-40 depending on the distance. At the wholesaler’s level and retailers’ level, the post-harvest losses vary from 0.5 to 1 percent due to handling. The table above shows net loss of ` 11,000-29,000 per hectare, this loss is mainly due to consideration of high labour cost, which is in most of the cases, farmer’s own family working Sl. No. Particular Amount (in `) 1 Planting Material (1-1.5 MT/ha) 60,000 2 Manures (5-6 MT/ha) 9,000 3 Fertilizers Pesticides 0 4 Irrigation 0 5 Labour (including family labour) 50,000 6 Total Production cost 1,19,000 7 Average production cost (` Per kg) 13.5 8 Yield (in MT/ha) 9 9 Average Selling price (` Per kg) 10-12 10 Total income per ha. (in `) 90,000-108,000 11 Net loss (` per ha.) 11, 000-29,000 Source: ISAP analysis from farmers’ interaction Table 45: Cost Economics of Ginger Cultivation in Meghalaya Particulars Amount (in `) Price Markup (` Per kg) % Contribution Production Cost 13.5 13.5* Average Selling price of Farmers 12 12 44.64% Loading/unloading 0.4 12.4 1.49% Carriage Cost (Gunny Bags ` 20 per 50 kg bag) 0.4 12.8 1.49% Middlemen/Aggregator charges (10-15%) 1.86 14.66 6.92% Transport to Main Market (` 30-40 per 50 kg gunny bag) 0.6 15.26 2.23% Wholesaler's margin (25-30%) 4.46 19.72 16.59% Cost of wastage (@ 0.5% wholesale) 0.1 19.82 0.37% Retailer's Margin (30-35%) 6.8 26.62 25.30% Cost of wastage (@ 1% Retail level) 0.26 26.88 0.97% * After reducing the family labour cost, cost of production comes below the farm gate price. Source: ISAP analysis from various stakeholders’ interaction Table 46: Cost Build-up of Ginger from Farm Gate to Consumers
  • 89.
    79Chapter 5 |Value Chain Analysis in the field. If own labour is deducted, cultivation of ginger turns profitable. Similarly, manure used by the farmers is also not purchased from the market, it is mainly dung collected from domestic animals. Sikkim Major production belts in all four districts of Sikkim are as below: North Sikkim: Lower Rongong, Lingdok, Nampatam, Nadey, Passingdong, Lum, Gor, Sangtok East Sikkim: Whole area South Sikkim: Poklok, Kamrang, Namchi, Singithang, Namthang, Rateypani, Melli, Barfung, Rangyang, Ynagyang, Temi, Namphing West Sikkim: Tikjyek, Lungik, Rathang, Tikpur, Ambotey, Lower Buriokhop Ginger is grown in all four districts upto 6000 mt. altitude hence production is less in North District which has higher altitudes. It is one of the major spice crops in the region which contributes 14 percent to the total ginger production on the North Eastern Region. Production Practices™™ Local varieties Bhaisey, Majaole and Gurubathaney etc. are used for cultivation. Farmers use the seed rhizomes preserved in the last season for the sowing purpose. The horticulture department also distributes seeds free of cost to the farmers but only a few farmers get the free seeds. In case, the farmer needs to buy the seed from the market, in the peak season, the cost reaches ` 1000 per 25 kg bag (` 40 per kg). The sowing of the seed rhizome is carried out in the February-end which extends up to April-end. Farmers do apply FYM in the fields. Some farmers who have their own vermicompost units built with the subsidy from the Government Department use vermicompost as per the availability. Sikkim has been declared as an Organic State, hence the use of chemicals and fertilisers is not allowed. A limited quantity of biofertilisers and biopesticides supplied by the govt. department are used, however, the farmers are reluctant to buy the organic fertilisers from the market. The crop is mainly rain-fed as irrigation facilities are limited in the state. Availability of labour for agriculture purpose is also a constraint. The labour requirement is 350-400 mandays which includes family labour. The manday cost is ` 150 per day plus one time food. No major insects, pests or diseases have been noticed in the area. However, sometimes there is damage due to soft rot. The losses during the production at the field level are about 5-6 percent. The Horticulture Department is now supplying seed rhizomes of improved varieties which have minimised the occurrence of the diseases and insects and pests. Post Harvest Practices:™™ Harvesting:ƒƒ The harvesting of rhizomes is carried out in October and continues up to January. The yield in one ha area is 5-6 MT of ginger rhizomes. Value Addition at Farm Level:ƒƒ The farmer carries out the cleaning and washing of the rhizomes at the field level which are then packed in gunny bags. A small gunny bag which accommodates 25 kg costs ` 10.
  • 90.
    80 Value ChainAnalysis of Select Crops in North Eastern States Marketing Logistics:ƒƒ The farmer either sells the produce to the aggregator at the village level or to the wholesaler or traderfromSiliguriorKolkata.Thepost-harvestlossesduringtransportationtoGangtokisabout 1 percent only, but when transported to distant markets of Siliguri and Kolkata, the handling loss ranges upto 2-3 percent. At the wholesalers and retailers level, this loss is 2 percent. Glut is also a major issue for ginger. Farmers have to leave the ginger in the field itself due to very low price offered and they use it as seed for the next season. Conclusion At production level:™™ Farmers are using their own seed, which becomes carrier of various seed borneƒƒ diseases such as rhizome rot (more than 70% farmers use their own seed saved from last seasons’ crop). At least 30% of the total ginger gets destroyed at farm level due to rhizome rot ofƒƒ ginger. Low yield due to poor production practices (flat bed method is used by theƒƒ farmers). Non-availability of labour is also a big problem at field level.ƒƒ Low level of yield leading to high production cost per kg thus making productƒƒ uncompetitive. At Market level:™™ Uneconomical quantity with each farmer, increasing cost of individual farmers toƒƒ take their produce to the market. Lack of infrastructure for primary cleaning, sorting grading to make the produceƒƒ marketable. Farmers have limited option of getting arbitrage.ƒƒ At processing level:™™ Absence of any kind of value addition at the farm or primary level.ƒƒ There is lack of entrepreneurship in society in general to take up ginger (or anyƒƒ other fruit) processing activities and establish the brand in the market. Price Build-up Amount (in `) Price Markup (` Per kg) % Contribution Farm gate price 12.00 12.00 38% Aggregator Margin @20% 2.40 14.40 8% Loading/unloading 0.40 14.80 1% Transportation 0.65 15.45 2% Wastage@ 1% 0.15 15.60 0% Wholesaler (@30%) 4.68 20.29 15% Wastage@ 2% 0.41 20.69 1% Retailer (50%) 10.35 31.04 33% Wastage@ 2% 0.62 31.66 2% Source: ISAP analysis from various stakeholders’ interaction Table 47: Price Build-up of Ginger from Farm Gate to Gangtok (per kg)
  • 91.
    81Chapter 5 |Value Chain Analysis Turmeric Turmeric is the dried rhizome of Curcuma Longa L. which is used as a condiment, flavouring and colouring agent, is a principal ingredient in the Indian kitchens as curry powder. The turmeric derives its taste, aroma and colour from its active ingredient ‘curcumin’ which is the principal phenol responsible for the yellow colour and medicinal characteristics of turmeric. The higher the curcumin content, the better the turmeric variety. Assam Kamrup, Barpeta, Sonitpur, Nagaon, Baksa, Golaghat, Lakhimpur and Karbi Anglong are major identified production clusters for Assam. Most of the farmers use locally grown varieties which are not recommended by the Agriculture Department but give good yield. Production Practices™™ Aamda and Lakadang are the identified varieties grown by the farmers. A seed rate of 12 quintals per ha is used for planting which costs the farmers ` 25 per kg seed. The sowing of the seeds is carried out in the months of March-April. Farmers either use their own seed preserved during the last season or buy the seed rhizome from the market. About 300 labour mandays are required for carrying out various farm operations. As per the discussions with the farmers during FGDs, the following cost of production has been estimated: Post-harvest Practices:™™ Harvesting:ƒƒ The harvesting begins in the month of November, which extends till January. The yield is 6 -7 MT of rhizome per ha. Figure 71: Production Cost of Turmeric in Assam Source: ISAP analysis from farmers’ interaction Turmeric Labour 45000 Irrigation 2200 Fertilizers 3700 Manures 6000 Seed/Planting Materials 30000 Total 86900 0 10000 20000 30000 40000 50000 60000 70000 80000 90000 100000 CostinINR
  • 92.
    82 Value ChainAnalysis of Select Crops in North Eastern States Value Addition at Farm Level:ƒƒ Few farmers sell rhizomes after curing it. Marketing Logistics.ƒƒ The farmers generally sell the rhizomes to the aggregator at the village level. The marketing channel followed by the farmers is: Farmers -------- Aggregators ---------- Wholesalers --------- Retailers -------- Consumers1. At the production level, due to insect pests and diseases, the crop loss is nearly 5 -6 percent while during transportation, the loss is 1-2 percent. Farmers sell the turmeric at field level to aggregators who further carry it to Guwahati market by mini trucks and sell to wholesalers. It is supplied to other markets in Assam also from Guwahati. Meghalaya The major production clusters that have been identified in Meghalaya are Jaintia Hills and West Garo Hills. Lakadang is main popular variety, which is a much sought after variety by the extraction industry due to its high curcumin content (5.5%). Production Practices™™ The sowing of turmeric is carried out on beds on slopes. Usually farmers use their own seeds (rhizomes) preserved from the previous season’s crop for cultivation purpose. The seed rate varies from 0.8 to 1 MT per ha. For sowing, both the mother rhizomes and fingers are used. Sowing in the region is carried out in the month of April-May. Farmers apply only FYM/ Vermicompost @5-8 MT per ha during the entire cropping season. No chemical fertilisers, insecticides/pesticides or weedicides are applied by the farmers in the region. The crop is monsoon-dependent. Weeding is mainly done manually by the farmers. Figure 72: Marketing Channel of Turmeric in Assam Farmers Aggregators At farm gate ` 0.8/kg Market in Guwahati Price Build-up Amount (in `) Price Markup (` Per kg) % Contribution Farm gate price 20.00 20.00 41% Aggregator Margin @25% 5.00 25.00 10% Loading/unloading 0.40 25.40 1% Transportation 0.80 26.20 2% Wastage@ 2% 0.52 26.72 1% Wholesaler (@30%) 8.02 34.74 16% Retailer (40%) 13.90 48.64 29% Source: ISAP analysis from various stakeholders’ interaction Table 48: Price Build-up from Farm Gate Boko to Guwahati
  • 93.
    83Chapter 5 |Value Chain Analysis About 200-250 labour mandays are required for the cultural operations from land preparation to harvesting. The charges for labour are ` 200 per day for men labour and ` 100 per day for women labour. Post Harvest Practices:™™ Harvesting:ƒƒ The harvesting starts in the month of December and extends till March. The average yield of green turmeric in the region is 6-8 MT/ha. The produce is packaged in 50 kg gunny bags. The cost of one gunny bag is ` 15-20 per bag. Value Addition at Farm Level:ƒƒ Some quantity is sold in fresh form while majority of the farmers carry out washing, drying and slicing of the rhizome. From 1 MT of fresh turmeric, only 150 to 200 kg of dry turmeric is obtained (recovery percentage – 15 to 20 percent). The selling price of fresh turmeric varies from ` 15-18 per kg, while dried rhizome sells at a price of ` 150-180 per kg. Marketing Logistics:ƒƒ The fresh rhizomes are sold to middlemen or aggregator at the village level itself while the dried and sliced rhizomes are sold to the processor in nearby villages. The aggregator/middlemen take the produce to the market; sell it to the wholesaler who further sells it to the retailer. The logistics cost for transporting one 50 kg bag from village to main market by jeep/bus varies from ` 30-40 depending upon the distance. For dried form, the processors carry out the grinding and the powdered spice is sold in the local market and distant markets of Guwahati, Silchar, Kolkata and Bangladesh (through illegal trade practices) at ` 250-300 per kg. There are negligible post-harvest losses due to the nature of the produce which is sold in the dried form. Farmers ` 0.60-0.80 per kg Aggregators Markets in Shillong Processors Markets in Shillong/ Kolkata/Guwahati/ Silchar Figure 73: Marketing Channel of Turmeric in Meghalaya
  • 94.
    84 Value ChainAnalysis of Select Crops in North Eastern States Sl. No. Particular Amount (in `) 1 Planting Material (0.8-1 MT/ha) 40,000 2 Manures (5-8 MT/ha) 12,000 3 Fertilisers Pesticides 0 4 Irrigation 0 5 Labour (including family labour) 50,000 6 Total Production cost 102,000 7 Average production cost (` Per kg) 12.75 8 Yield (in MT/ha) 8 9 Average Selling price (` Per kg) 15 -18 10 Total income per ha (in `) 120,000-144,000 11 Net gain (` per ha) 18, 000-42,000 Source: ISAP analysis from farmers’ interaction Table 49: Cost-economics of Turmeric Cultivation in Meghalaya Particular Amount (in `) Price Markup (` Per kg) % Contribution Production Cost 12.75 12.75 Average Selling of Farmers 18.00 18.00 45.45% Carriage Cost (Gunny Bags ` 20 per 50 kg bag) 0.40 18.40 1.01% Middlemen/Aggregator charges (10-15%) 2.76 21.16 6.97% Transport to Main Market (` 30-40 per 50 kg gunny bag) 0.60 21.76 1.52% Wholesaler's margin (30% ) 6.53 28.29 16.48% Retailer's Margin (40%) 11.32 39.60 28.57% Source: ISAP analysis from various stakeholders’ interaction Table 50: Cost Build-up of Turmeric (1 kg) from Farm Gate to Consumers Mizoram In Mizoram, Reiek village in Mamit district is very famous for turmeric cultivation. Mamit is the largest turmeric producing district in Mizoram. Other identified clusters are Saiha, Champhai, Kolasib and Serchhip. Production Practices™™ The varieties used are Lakadong and RCT-I. The Horticulture Department is supplying the RCT-I planting material (rhizomes) to few selected farmers. The seed rate used is 6-8 quintals per ha which yields around 4-5 MT of finished product. Sowing is done in the month of February and March. No fertiliser and other chemical use have been noticed. Labourers are mainly family members. About 150-200 mandays per ha are required for farm operations from field preparation to harvesting. The labour charges are ` 200/manday for hired labour. Post-harvest Practices:™™ Harvesting:ƒƒ The crop is harvested from December to April; December and January are the peak harvesting months. During the crop production and harvesting, the losses due to shoot borer are nearly 10 percent. The selling price of the fresh rhizomes is ` 15 per kg.
  • 95.
    85Chapter 5 |Value Chain Analysis Value Addition at Farm Level:ƒƒ Farmers do the cleaning, washing, curing and drying after harvesting and then pack the rhizomes in plastic bags. The plastic bags with small quantities of produce are carried on the roof of the passenger vehicles by the farmers to the nearby city or town. Marketing Logistics:ƒƒ The transportation cost for transporting to a distance of 3-40 km is ` 30 per 30-40 kg plastic bag. Aggregators and traders carry full truck loads of the cured and dried turmeric in Tata 407 which accommodates 2.5-3 MT, to Aizawl market and other neighbouring markets in Assam. The logistics cost till Aizawl market is ` 2500-3000 per truck load and up to Silchar it is ` 8000 per truck load. The losses during transit range from 1-2 percent when carrying to Aizawl market and 3-4 percent when carrying to Silchar market. The handling losses at the wholesaler’s and retailers’ level are approximately 1 percent. Marketing channels: Farmers-Middleman (village level)-Local wholesale markets in Mizoram-retailers-1. consumers Farmers-Local wholesale markets in Mizoram-retailers-consumers2. Farmers-Traders/contractors(fromneighbouringdistrictsofAssam,Silchar,Karimganj3. etc.)-wholesale markets-retailers-consumers Farmers ` 0.80-1.0 per kg ` 1 per kg ` 2.50-3 per kg Aggregators Local markets in Aizawl Contractors Markets in Silchar, Cachar etc. Figure 74: Marketing Channel of Turmeric in Mizoram Particular Amount (in `) Price Mark-up (` Per Piece) % Contribution Average selling price of farmers 15.00 15.00 42% Aggregator Margin (@20%) 3.00 18.00 8% Transport to Aizawl 1.00 19.00 3% Cost of wastage (@ 1% till Main Market) 0.19 19.19 1% Wholesaler's Margin @ 30% 5.76 24.95 16% Wastage (@ 1% wholesale level) 0.25 25.20 1% Retailer's Margin (@40%) 10.08 35.28 28% Wastage (@ 1% retail level) 0.35 35.63 1% Source: ISAP analysis from various stakeholders’ interaction Table 51: Price Build-up of Turmeric from Farm Gate to Aizawl Market (per piece)
  • 96.
    86 Value ChainAnalysis of Select Crops in North Eastern States Naga Chilli The Naga Chilli is the traditional food item of the Naga community. It is believed to have originated in Nagaland and the State Government has obtained GI rights for the product in 2008. It has a distinct taste and pungency and is used in many forms - fresh, dried, powdered and pickled. Major identified clusters are Kohima, Peren and Dimapur.  Nagaland Naga Chillii is also known as ‘Raja Merja’ at local level. The identified major production clusters are Kohima, Peren and Dimapur districts. Production Practices™™ The seed rate is 1 kg/ha. The farmers use the seeds preserved from the last season’s crop. It is grown as a rain-fed crop in all kind of soils from plains of Dimapur to the high hills. In plains, the sowing of the seed is carried out in August to October and transplanting is done in September–November. In the hills, the sowing time is February to March and transplanting of seedlings is carried out from March to May. About 200-250 mandays are required for carrying out the farm operations. Being a highly perishable product, the crop loss varies from about 5-10 percent at the field level. Post-harvest Management™™ Harvesting:ƒƒ The chilli is ready for harvest within 75-90 days after sowing. The yield per ha of fresh chilli is 2-2.5 MT. However, dry chilli fetches better price in the market than fresh chilli, so the farmers prefer to dry them before they sell it to the traders. Value Addition at Farm Level:ƒƒ Most of the farmers have installed indigenous drying units where the drying and bulk packaging of the chilli is carried out. Marketing Logistics:ƒƒ The following channels are followed for chilli marketing: Farmer-aggregator-Wholesaler-Retailer-Consumer (Local Market)1. Farmer/s-Trader/Contractor-Wholesaler (in Kolkata, Delhi, Mumbai, Bangalore etc.)-2. Retailer-Consumer (Dry Chilli) The farm gate price of dry chilli during lean season or during times of less production may go up to ` 1500 per kg. Fresh chilli sells for ` 1 to ` 5 per piece in the retail market, while a packet of five dry chilli pieces in a retail outlet in Dimapur was being sold at ` 50. Fresh chilli is sold locally while dried chilli can be transported to distant places such as Kolkata, Delhi, Mumbai and Bangalore. Manual Sorting Grading of Naga Chilli
  • 97.
    87Chapter 5 |Value Chain Analysis Farmers generally carry fresh chilli in very small quantities to local markets in the districts of Nagaland on rooftop of vehicles which costs them ` 0.50-1/kg. During transportation of the fresh produce, there are nearly 5 percent post-harvest losses during handling. Due to its highly perishable nature, fresh chilli is not transported to distant markets. At the wholesaler’s and retailer’s level, the handling wastages account for 2-3 percent of fruit loss. Dry chilli is transported in CFB to distant markets by traders like ICCOA and Shimla Hills for which the transportation cost is ` 25 to 100 per box depending upon the distance. The handling and transportation loss for dry chilli is nearly 2-3 percent. Farmers ` 0.60-0.80 per kg ` 0.50-1.0 per kg Dry Chilli Aggregators Markets in Dimapur/Kohima Traders/ Contractors Markets in Dimapur/Kohima Markets in Guwahati/ Kolkata/Delhi/Banglore /Mumbai Figure 75: Marketing Channel of Naga Chilli in Nagaland Particulars Amount (in `) Price Mark-up (` Per Piece) % Contribution Average selling price of farmers 120.00 120.00 63% Aggregator Margin (@5%) 6.00 126.00 3% Transport to Dimapur/Kohima 1.00 127.00 1% Cost of wastage (@ 5% till Main Market) 6.35 133.35 3% Wholesaler's Margin @10% 13.34 146.69 7% Wastage (@2% wholesale level) 2.93 149.62 2% Retailer's Margin (@25%) 37.40 187.02 20% Wastage (@ 2% retail level) 3.74 190.76 2% Source: ISAP analysis from various stakeholders’ interaction Table 52: Price Build-up of Fresh Naga Chilli from Farm Gate to Dimapur/Kohima (per kg) Fresh Naga Chilli cannot be transported to distant markets such as Delhi/Mumbai due to its high perishable nature. There is huge difference between farmer’s and consumer’s price in dry chilli. Passion Fruit Passion fruit is a high value and potentially a foreign exchange earning crop. It is a potential crop in Nagaland which is mainly cultivated from mid-hills to high-hills in the state. The fruit is grown to eat or for its juice, which is often added to other fruit juices to enhance aroma.
  • 98.
    88 Value ChainAnalysis of Select Crops in North Eastern States The fruit can be grown in all kinds of soils; however, soils rich in organic matter are most suitable for its cultivation. A temperature range of 16°C to 30°C is most suitable for its cultivation. There are two varieties - the purple passion fruit and yellow passion fruit. Both the varieties are cultivated in the region. Nagaland Kohima, Wokha and Mokokchung are major production clusters of passion fruit in Nagaland. Production Practices™™ The seed sowing for primary nursery is carried out during the month of September which is then transplanted in the secondary nursery after 30-45 days (October–November). The 8-10 month old seedlings are transplanted in the field in the months of May–June. 1600 to 1700 plants are grown in one ha area. Post Harvest Practices:™™ Harvesting:ƒƒ The harvesting starts 2 years after the transplanting in the main field. The fruit ripens in the months between August and December and March and May. At the farmers’ level, losses up to 5-6 percent are reported due to powdery mildew. The yield is around 10 MT/ha per year. Value Addition at Farm Level:ƒƒ Farmers do not carry any kind of value addition at their end. Marketing Logistics:ƒƒ Farmers generally carry the passion fruit on the rooftop of private vehicles to nearby markets, the transportation costs for which comes to ` 0.5 to 1 per kg. Average farmers’ selling price ranges from ` 10-15 per kg. However, in cases where processors directly procure from the farmers groups, the farmers get ` 10-12 per kg. For distant markets such as Guwahati and Kolkata, the cost is ` 2-2.50 and ` 3.5 to 4 per kg, respectively. During transportation, post-harvest losses range from to 2-5 percent, while at the retailer’s level, the handling losses are nearly 2 percent. Particular Amount (in `) Price Mark-up (` Per kg) % Contribution Average selling price of farmers 600.00 600.00 40% Packaging 10 610.00 1% Transportation to Dimapur 10 620.00 1% Wastage till Dimapur @ 1% 6.2 626.20 0% Transportation from Dimapur to Bangalore 100 726.20 7% Wastage till Bangalore @2% 14.52 740.72 1% Traders, Margin 250 990.72 17% Wholesalers, Margin 200 1190.72 13% Retailers, Margin 300 1490.72 20% Source: ISAP analysis from various stakeholders’ interaction Table 53: Price Build-up of Dry Naga Chilli from Farm Gate to Bangalore (per kg)
  • 99.
    89Chapter 5 |Value Chain Analysis Commercial level cultivation is not taking up further due to poor condition of processing plants, their linkages further with major processed product marketing organisations. Due to lesser demand sometime fruits go wasted at farm level so farmers are discouraged sometime to take the crop in future. Kiwi Fruit Kiwi fruit or Chinese gooseberry is one of the best known nutritious fruit among the soft fruits. It is being cultivated in some sizeable area in Arunachal Pradesh in North East, although the other NE states too have a vast potential for the cultivation of Kiwi fruit. The fruit is mainly consumed as a fresh fruit or combined with other fruits, in salads and desserts. The nutritive value and flavour are retained when the fruit is processed to jam, jelly or preserves. Farmers ` 1 per kg Aggregators Processors Markets in Dimapur/Kohima Processed products in markets Figure 76: Marketing Channel of Passion Fruit in Nagaland Particular Amount (in `) Price Mark-up (` Per Piece) % Contribution Average selling price of farmers 10.00 10.00 39% Aggregator Margin (@20%) 2.00 12.00 8% Loading/Unloading 0.40 12.40 2% Transport to Dimapur/Kohima 1.00 13.40 4% Cost of wastage (@ 2%) 0.27 13.67 1% Wholesaler's Margin @ 30% 4.10 17.77 16% Wastage (@2% wholesale level) 0.36 18.12 1% Retailer's Margin (@40%) 7.25 25.37 28% Wastage (@ 2% retail level) 0.51 25.88 2% Source: ISAP analysis from various stakeholders’ interaction Table 54: Price Build-up of Passion Fruit from Farm Gate to Dimapur/Kohima (per kg)
  • 100.
    90 Value ChainAnalysis of Select Crops in North Eastern States The plant needs a long growing season (at least 240 frost-free days), which will not be hampered by late winter or early autumn freeze. For high yield and quality fruits, it requires 700-800 chilling hours below 7°C to break dormancy period. It prefers somewhat acidic (pH 5 -6.5), well-drained soils that are rich in organic matter. The fruit grows on vines which require vigorous pruning. Fruit is borne on one-year old and older canes, but production declines with the ageing of the canes. Arunachal Pradesh In Arunachal Pradesh, the crop is grown on the sharp hilly terrains, with plantation carried out on slopes. Major growing districts are Tawang, West Kameng and Lower Subansiri. Production Practices™™ The most popular varieties grown are Alison and Harvard. The orchards are mixed with old plantations (which are almost 15-20 years old) and new plantations. However, the plantations are generally congested with less plant to plant spacing. During the crop cycle, the farmers do not apply any kind of chemical fertilisers, insecticides, pesticides and weedicides. Only FYM/Vermicompost are applied at the rate of 5-7 kg per plant. The weeding is carried out manually by the farmers. During discussions with farmers, it emerged that there are losses up to 5-10 percent due to insects and pests such as beetles etc. The orchards are mainly rain-fed; however, few progressive farmers have started using drip irrigation and water tankers also. Nearly 1200 to 1500 labour mandays are required for various farm operations; the farmers usually hires outside labour for the field operations. At the field level, due to fruit drop and insects, pests and diseases, the fruit loss is nearly 5-10 percent. Post-harvest Practices:™™ Harvesting:ƒƒ The fruiting period is two months i.e. October and November. The yield in the region is nearly 3-4 MT/ha. Value Addition at Farm Level:ƒƒ The farmers carry out the manual sorting and grading of the fresh produce on the basis of weight as follows: Marketing Logistics:ƒƒ The fruits are transported in mini trucks without any kind of packaging, or packed in gunny bags. The farmers either sell the fresh fruit directly to consumers at the local or main market, in case main market is situated close to the production area. The farmers carry the fruit on head loads to the nearest transport point and from there it is transported by jeep/maxi to the local market. The transportation cost per gunny bag comes to ` 20-50 depending upon the distance. During the transit from field to local market, the post-harvest losses during transportation are 0.5 percent. Grade Weight Market A Grade 90 gm and Above Exports B Grade 60-90 gm Domestic/Local C Grade 50-60 gm Domestic/Local D Grade 40-50 gm Processing
  • 101.
    91Chapter 5 |Value Chain Analysis From the local market, the produce moves through mini trucks which accommodates 5 MT due to modified body of the mini truck (the original capacity of the mini truck is 2-3 MT) and buses (bamboo baskets on the rooftop of the bus) to the main market. The logistics cost for transportation to the main market is around ` 3500-7000 per mini truck and ` 75-100 per bamboo basket. The post-harvest losses during transportation from local market to main market are nearly 8-10 percent due to the perishable nature of the fruit. The fruit is sold on the basis of grades. In most of the cases, the farmers sell the whole orchard to the contractor before harvesting at a pre-fixed price. However, some farmers do sell the produce to the middlemen/aggregators/ traders from outside places such as Guwahati, Silchar, Kolkata and Delhi. At the wholesaler and retailer’s level, the post-harvest losses are to the tune of 3-5 percent due to handling losses. Grade Weight Farmers Selling Price Market Market Price A Grade 90 gms and Above ` 100/kg Exports ` 150-200/kg B Grade 60-90 gms ` 65/kg Domestic ` 100-125/kg C Grade 50-60 gms ` 50/kg Local ` 75-100/kg D Grade 40-50 gms ` 35/kg Processing Farmers At farm gate Contractor/ Aggregator Markets in Guwahati/Silchar/Kolkata/ Delhi Export Figure 77: Marketing Channel of Kiwi Fruit in Arunachal Pradesh Particular Amount (in `) Price Markup (` Per kg) % Contribution Average Selling of Farmers 65.00 65.00 52.11% Aggregator charges (15-20%) 13.00 78.00 10.42% Transport to Main Market including loading and unloading 2.00 80.00 1.60% Cost of wastage (8-10% till Main Market) 8.00 88.00 6.41% Wholesaler's/Retailer's margin (30-35%) 30.80 118.80 24.69% Cost of wastage (3-5%) 5.94 124.74 4.76% Source: ISAP analysis from various stakeholders’ interaction Table 55: Price Build-up of Kiwi (per kg) from Farm Gate to Consumers in Itanagar
  • 102.
    92 Value ChainAnalysis of Select Crops in North Eastern States Large Cardamom Large cardamom is a perennial herbaceous plant with subterranean rhizomes that give rise to leafy shoot and panicles. It is believed to be the native crop of Sikkim. The cardamom capsules are categorised as high value spice crops in the country and have multiple domestic uses. India is the largest producer of large cardamom with almost 54 percent share in world production and out of this Sikkim contributes up to 88 percent of India’s production. Large cardamom grows well under the shade of forest trees at altitudes ranging from 1000-2000 metres with rainfall ranging from 3000-3500 mm per annum. Sikkim Large cardamom is the main cash crop of Sikkim, being cultivated in an area of 15,020 ha (Directorate of Horticulture, 2010-11) in all the four districts of the state. Two major producing clusters are North and East Sikkim. Production Practices™™ There are five popular cultivars being grown in Sikkim i.e, Ramsey, Sawney, Golsey, Varlangey and Seremna. The propagation of large cardamom is through seeds and suckers. Seeds are generally sown in September-October. However, the existing cardamom orchards in the state are very old thus affecting the yield of the capsules. Viral diseases such as chirkey and foorkey are very common in the old plantations which destroy large number of fields in the region and cause heavy losses to the farmers. The State Horticulture Department is preparing tissue cultured plants to be supplied to the farmers. These plants would be resistant to viral and bacterial diseases. The fully grown cardamom plantations require 150-200 mandays per ha for various farm operations such as intercultural operations and harvesting. Post Harvest Practices:™™ Harvesting:ƒƒ The yield of the plants is approximately 1.5 to 2.5 MT per ha. Value Addition at Farm level.ƒƒ Marketing Logistics.ƒƒ The main marketing channel being followed by the farmers is as follows: Farmers ----- Aggregators ------- Wholesalers ------- Retailers ------- Consumers1. Farmers ------ Contractors ------- Wholesalers ------- Retailers ------- Consumers2. Farmers ------- Bidders ------ Wholesalers ------ Retailers ------- Consumers3. The losses in the field vary from 5 to 10 percent which may go up to 80 percent in case of viral diseases.
  • 103.
    93Chapter 5 |Value Chain Analysis Average selling price of the farmer ranges from 550-900 depending upon the marketing channel. NERAMAC provides a platform for farmers and bidders from time to time. NERAMAC has an auction centre and warehouse at Rong-Po. Warehouse service is free of cost for farmers. There is direct interaction between farmers and traders and farmers have the option not to sell even to the highest bidder and keep their produce in the warehouse for next auction. During the auction, good quality cardamom fetches ` 800-900 per kg to the farmers. Vegetables In the North Eastern Region, vegetables are grown mainly in three seasons – rabi, kharif and off season. The vegetables produced in the hills during the summer months of March to June when the production is less in the plains, constitute the off season vegetables. These vegetables are supplied to the plains and fetch good prices. The NE states of Assam, Meghalaya have a huge potential to supply off season vegetables. Farmers ` 1-3/Kg At farm gate Contractor/ Bidder Aggregator Markets in Silliguri/Kolkata/ Delhi/Mumbai Markets in Silliguri/Gangtok Figure 78: Marketing Channel of Large Cardamom in Sikkim Particulars Amount (in `) Price Markup (` Per Piece) % Contribution Farm gate price 600.00 600.00 60% Aggregator Margin @10% 60.00 660.00 6% Transportation 2.00 662.00 0% wastage@1% 6.62 668.62 1% Wholesaler (@20%) 133.72 802.34 13% Retailer (25%) 200.59 1002.93 20% Source: ISAP analysis from various stakeholders’ interaction Table 56: Price Build-up of Large Cardamom from Farm Gate to Siliguri Market (per kg) Farmer Interaction with NERAMAC
  • 104.
    94 Value ChainAnalysis of Select Crops in North Eastern States Assam In Assam, the major vegetables cultivated are cabbage, cauliflower, knol-khol, tomato, brinjal, potato, pea, carrot, French bean, cucumber, okra, ridge gourd, cowpea, sponge gourd, spine gourd, pointed gourd and bottle gourd. The four districts of Kamrup, Nalbari, Darrang and Morigaon are the major vegetable clusters in the state. Sl. No. Name of Vegetables Popular Varieties Primary (Major) 1 Potato 1. Kufri Chandra Mukhi 2. Kufri Jyoti 3. Kufri Sindhuri 2 Cabbage Early maturity : Golden Acre1. Pride of India2. Pusa Mukta (Sel-8)3. Late maturity : Drum Head1. Eclipse Drum Head2. 3 Cauliflower Early: Early kunwari1. Pusa katki2. Pusa Deepali3. Mid : Improved Japanese1. Pusa Synthetic2. Pusa Snowball3. Main Crop Patna4. Late : Snowball-161. Pusa Snowball2. K-13. Hissar 14. 4 Radish Early : Pusa Deshi1. Pusa Chetki2. Pusa Himani3. Late : Japanese White1. Jaunpuri2. Bombay Red3. 5 Carrot Nantes1. Pusa Kesar2. Chantenay3. 6 Peas T-1361. Table 57: Popular Varieties of Vegetables Cultivated in Assam
  • 105.
    95Chapter 5 |Value Chain Analysis Sl. No. Name of Vegetables Popular Varieties 7 French Beans Pusa Parvaty1. Contender2. UPF-2033. UPF-1914. 8 Tomato Punjab Chhuhara1. S-122. Punjab Kesri3. Pusa Early Dwarf4. Sioux5. Pusa Ruby6. VC-48-17. Arka Abha (BWR-1)8. Arka Alok (BWR-5)9. BT-110. Bilahi-111. Bilahi-212. 9 Ash Gourd Selected local varieties 10 Lettuce Great Lakes1. Chinese Yellow2. Slow Bolt3. Secondary (Minor) 11 Capsicum (Green) California Wonder1. Elephant Trunkm2. Arka Mohini3. Arka Gaurav4. Selection 165. 12 Broccoli Early : Early Danish Giant1. De Cicco Green Bud2. Sparton Ealy3. Coastal4. Atlantic5. Mid : Green sprouting medium1. Late: Waltham 291. Green Mountain2. Coastal3. Atlantic4. Hybrid : Southern Comet1. Premium Crop2. Clipper3. Laser (extra early and early)4. 13 Coriander Bold seeded : UD 211. GAUI2. CSI3. CIMPO 334. Small seeded : UP 411. Pusa 3602. Local selection3.
  • 106.
    96 Value ChainAnalysis of Select Crops in North Eastern States Sl. No. Name of Vegetables Popular Varieties 14 Pumpkin Arka Suryamukhi1. Arka Chandan2. Selected Local cultivar3. 15 Cucumber Chinese Green1. Pusa Sanyog2. Poinsette3. AAUC-14. AAUC-25. AAUC-36. AAUC-47. 16 Knol Khol Early maturity: White Vienna1. Late maturity : Purple Vienna1. 17 Brinjal Long: Cluster1. Borbengena2. JC-13. Kuchia4. BWR-345. Pusa Kranti6. Pusa Purple Long7. Pusa Purple8. Round : Pusa Purple Round1. Pusa Vairab2. JC-23. BWR-124. Oblong : BB-71. Pant Samrat2. 18 Ladies Finger Pusa Sawani1. Arka Anamika2. Parbhdani Kranti3. Red Wonder (Hill Zone)4. Panchasira (North Brahmaputra Valley Zone)5. 19 Bottle Gourd Pusa Summer Prolific1. Pusa Summer Prolific Round2. Pusa Meghdoot3. Pusa Manjiri4. Keyari Lsao5. 20 Onion (Green Leaf) Pusa Red1. Pusa Ratnar2. Pusa White (Round)3. Pusa White (Flat)4. N-535. Agrifound Light Red6. Punjab Red Round7. Pusa Madhuri8. Arka Niketan9.
  • 107.
    97Chapter 5 |Value Chain Analysis Sl. No. Name of Vegetables Popular Varieties 24 Bitter Gourd For spring season : Earliest of All1. Long Green2. Extra Long3. Pusa Do Mausmi4. For summer season : Monsoon Monarch1. Long Green Monsoon2. Coimbatore Long3. 25 Ridge Gourd Pusa Nasdar1. AAUJ-12. AAUJ-23. AAUJ-34. Source: Discussion with stakeholders, KVKs, District Agriculture Offices Farmers in most of the vegetable production clusters around Guwahati use hybrid/HYV seeds and also use other inputs for increasing yield and production. However, the production practices for vegetable are non-scientific and therefore there is a huge scope for intensification of vegetable production. Table 58: Cost of Production of Selected Vegetables in Assam Cost of Production of Selected Vegetable Crops (in `) Total cost Sl. No. Crop Name Seed Cost Pesticide Cost Fertilizer Cost Irrigation Cost Labour Cost (During Season) Any Other Cost 1 Ash Gourd 4500 900 5328 2000 3000 1000 16728 2 Brinjal 4800 3750 3300 2000 3000 1000 17850 3 Cabbage 10000 3750 5000 2000 2500 1000 24250 4 Carrot 500 500 2000 2500 3000 1000 9500 5 Cauliflower 10000 3750 5000 2000 2500 1000 24250 6 Cowpea 5000 400 2432 2000 3000 1000 13832 7 Cucumber 3000 2000 3000 3500 2000 1000 14500 8 French- bean 8400 0 15000 1200 6000 2000 32600 9 Knol –Khol 1500 1500 4220 2000 3000 1000 13220 10 Okra 4500 3000 15000 2500 2000 1000 28000 11 Potato 25000 2500 5270 2000 3000 1000 38770 12 Pumpkin 10000 3500 4000 3000 3000 2000 25500 13 Radish 3000 1000 4800 2000 3000 1000 14800 14 Ridge Gourd 10000 4500 2295 2000 3000 1000 22795 15 Tomato 20000 1000 7000 2000 3000 1000 34000 Source: Primary Survey by ISAP
  • 108.
    98 Value ChainAnalysis of Select Crops in North Eastern States The per ha cost of production of potato is highest followed by tomato, French beans and okra. The farmers use hybrid seeds for sowing, thus the cost of seed is one of the major component. The other major cost in vegetable production is fertiliser cost. It is important to note that the cost of irrigation is minimal in total production cost due to rain-fed cultivation of vegetables. Looking at the cost of production of per kg vegetable, production cost of cowpea (` 4.60 per kg) is highest, followed by French bean (` 3.84 per kg), potato (` 3.23 per kg) and cauliflower (` 2.85 per kg). Figure 79: Estimated per ha Cost of Production of Vegetables (in `) 0 5000 10000 15000 20000 25000 30000 35000 40000 45000 AshGourd Brinjal Cabbage Carrot Cauliflower Cowpea Cucumber Frenchbean KnolKhol Okra Potato Pumpkin Radish RidgeGourd Tomato Cost of Production Seed Cost Cost of Production Pesticide Cost Cost of Production Fertilizer cost Cost of Production Irrigation cost Cost of Production Labour Cost (during season) Cost of Production Any other cost Source: ISAP analysis of primary survey Figure 80: Estimated per kg Cost of Production for Select Vegetables (`/kg) 0.67 2.83 2.61 2.71 2.85 4.61 0.62 3.84 0.71 2.77 3.23 0.85 1.74 1.90 2.43 0 1 2 3 4 5 Cost of production (`/kg) AshGourd Brinjal Cabbage Carrot Cauliflower Cowpea Cucumber Frenchbean KnolKhol Okra Potato Pumpkin Radish RidgeGourd Tomato Source: ISAP analysis of primary survey
  • 109.
    99Chapter 5 |Value Chain Analysis Farmers harvest the vegetables in the evening of the first day so that they can reach the market early morning the next day. Farmers either sell their products to local consolidators or take it to the nearest market. In case farmers are taking their products to the market, transportation cost is being paid by the farmers themselves. Mostly vegetables are packed in gunny bags (jute and plastic bags, empty bags of cement, fertiliser, wheat, sugar etc.) and in baskets. Bags are chosen for relatively longer distance and baskets for local selling of products. Farmers carry their vegetables to the markets in bullock carts, autos, small trucks and matadors etc. Means of transport depends on distance and quantity of vegetables to be carried to the market. Farmers also hire transport vehicles on sharing basis, specifically in production areas such as Kharupetia. There are various channels by which vegetables are being brought from farm gate to the markets in Guwahati. Some of these channels, as identified during the primary survey are described as below: Farmers – Consumers1. Farmers – Commission Agents - Wholesalers (Machkhowa market) – Retailers -2. Consumers Farmers – Aggregators/consolidators/local traders – Commission Agents - Wholesalers3. (Machkhowa market) – Retailers - Consumers Farmers – Aggregators/consolidators/local traders – Wholesalers at Transit markets –4. Commission Agents (Machkhowa market) – Wholesalers (Machkhowa market) – Retailers - Consumers Channels 2 3 contribute approximately 80-85% of total vegetables’ arrival in the Machkhowa market of Guwahati. Almost 95% of the total vegetables that arrive in Guwahati, comes through organised channel of consolidating, wholesaling and retailing and only 5% of vegetables are being brought directly by the farmers. Though the distances of production centre and market is not much, there are multiple players involved in the supply chain and that adds to the cost of vegetables to consumers. Cost components in the supply chain, at the market level, includes margin of local consolidators: Market fee at primary market level™™ Margin of wholesaler in primary market/commission of commission agent at primary™™ market Transportation cost to secondary market™™ Market fee at secondary market level™™ Commission of commission agents™™ Margin of wholesalers™™ Local transportation cost for transporting it to retail store™™ Margin of retailers™™ Wastage at various levels™™
  • 110.
    100 Value ChainAnalysis of Select Crops in North Eastern States Table 59: Price Build-up for Vegetables from Farm Gate to Consumers Particular Amount (in `) Price Markup (in `) % Contribution Average selling price of farmers 7.00 7.00 29.9% Packaging cost 0.50 7.50 2.1% Local transportation to primary market 0.60 8.10 2.6% Cost of wastage (@ 6% till primary market) 0.49 8.59 2.1% Mandi fee at primary market (@1%) 0.09 8.67 0.4% Margin of consolidators/aggregators 0.25 8.92 1.1% Labour cost for material handling 0.10 9.02 0.4% Transportation from Primary market to Guwahati 0.60 9.62 2.6% Margin of CA/wholesaler of primary market (@ 25%) 2.41 12.03 10.3% Commission charges from Sellers (@ 5%) 0.60 12.63 2.6% Commission charges from Buyers (@ ` 13 per kg) 0.13 12.75 0.5% Cost of wastage (@ 10%) 1.28 14.03 5.5% Wholesaler's margin (@15%) 1.91 15.94 8.2% Transportation cost 0.60 16.54 2.6% Cost of wastage (@ 7% till Retail) 1.16 17.70 5.0% Packaging cost (plastic retail pack) 1.00 18.70 4.3% Retailer's Margin (@25%) 4.68 23.38 20.0% Source: ISAP analysis of primary survey Cost build-up from farm gate to wholesale market: Average price spread from farm gate to retail market worked out to be ` 7.00 per kg to ` 23.40 per kg of vegetables on an average in the region. Farmers get only about 30% share of the consumer price in Guwahati. The margins of wholesalers and retailers depend on the produce, perishability, season, demand and supply factors. In case of wholesalers, the margin varies from 15-25% and in case of retailers from 25-35%.
  • 111.
    101Chapter 5 |Value Chain Analysis Figure 81: Average Price Markup in the Supply Chain of Major Vegetables to Guwahati 29.9% 2.1% 2.6% 2.1% 0.4% 1.1% 0.4% 2.6% 10.3% 2.6% 0.5% 5.5% 8.2% 2.6% 5.0% 4.3% 20.0% 0.0% 5.0% 10.0% 15.0% 20.0% 25.0% 30.0% 35.0% - 5.00 10.00 15.00 20.00 25.00 %Contribution Amountin` Price Mark-up % Contribution Averagesellingpriceoffarmers Packagingcost Localtransportationtoprimarymarket Costofwastage(@6%tillprimarymarket Mandifeeatprimarymarket(@1%) Marginofconsolidators/aggregators Labourcostformaterialhandling TransportationfromPrimarymarkettoGuwahati MarginofCA/wholesalerofprimarymarket(@25%) CommissionchargesfromSellers(@5%) CommissionchargesfromBuyers(@`13perkg) Costofwastage(@10%) Wholesaler’smargin(@15%) Transportationcost Costofwastage(@7%tillRetail) Packagingcost(plasticretailpack) Retailer’sMargin(@25%) Source: ISAP analysis of primary survey Level of wastages for major vegetable products at field level (post-harvest), wholesale level and till it reaches the consumers has been depicted in Table 60. Range of wastage is 4-10% at farmers’ level, 2-15% at wholesale level and 2-10% at the retail level. The quantum of wastage for different products also depends on the nature of product. Wastages in whole supply chain of vegetables for Guwahati vary from 9% for some crops to as high as over 32% for crops like pea.
  • 112.
    102 Value ChainAnalysis of Select Crops in North Eastern States Estimated Wastages of Vegetables in Supply Chain Vegetable Name Farmers Level Wholesale Level Retail Level Knol-Khol 5% 5% 5% Potato 5% 2% 2% Radish 5% 5% 5% Ridge Gourd 5% 5% 5% Cow Pea 5% 5% 5% Bhindi 5% 5% 5% Ash Gourd 5% 5% 5% Cucumber 10% 5% 5% Cabbage 10% 8% 8% Cauliflower 10% 10% 10% Tomato 7% 5% 4% Carrot 6% 2% 2% Brinjal 5% 6% 6% Spine gourd 5% 6% 6% French-bean 5% 7% 7% Onion 15% 5% Chilli 5% 15% 5% Pointed gourd 5% 15% 7% Sweet gourd 5% 15% 7% Pea 10% 15% 7% Pumpkin 5% 15% 5% Bitter gourd 5% 15% 5% Bottle gourd 4% 15% 5% Garlic 7% 15% 5% Ginger 5% 15% 5% Capsicum 5% 15% 8% Source: Primary survey of farmers, wholesalers and retailers by ISAP Table 60: Estimated Wastages of Vegetables in Supply Chain Figure 82: Estimated Percentage Wastage of Vegetables in Supply Chain for Guwahati 0% 5% 10% 15% 20% 25% 30% 35% KnolKhol Potato Radish RidgeGourd CowPea Bhindi AshGourd Cucumber Cabbage Cauliflower Tomato Carrot Brinjal Spinegourd French-bean Onion Chilli Pointedgourd Sweetgourd Pea Pumpkin Bittergourd Bottlegourd Garlic Ginger Capsicum Farmers level Wholesale level Retail level Source: Primary survey of farmers, wholesalers and retailers by ISAP
  • 113.
    103Chapter 5 |Value Chain Analysis Issues Related to Vegetable Marketing Vegetable marketing in the Kamrup region is not organised due to lack of adequate infrastructure and basic facilities. Farmers don’t have any alternate channel than to sell the fresh produce through intermediaries. Two major and adjacent wholesale-cum-retail markets, Machkhowa and Fancy Bazaar have the following situation and concerns: Machkhowa Market:1. Located 9 kms from the National Highway and 3 kms from the railway station, it is the largest vegetable market in the region but it doesn’t have the basic facilities to handle the produce and quality management. Market is in an open area, operates in a congested area and unhygienic conditions and there is no shed for protection from sun and rain. This market is under the administration of Guwahati Municipal Corporation (GMC). Fancy Bazaar Vegetable Market:2. One of the oldest fresh produce markets in Kamrup it is less than 500 mts. from Machkhowa market and 9 kms from NH-37 and 2 kms from Guwahati railway station. Fancy Bazaar also deals in other commodities such as fruits, betel nut and flowers etc. It is also under the administration of GMC and traders pay the rent. Both of the markets are lacking the following basic infrastructure, which is required for fresh fruits and vegetable market: Cold store™™ Sorting/grading machines™™ Auction platforms™™ Electronic display™™ Weigh bridges™™ Garbage disposal system™™ Water and sewerage system, etc.™™ Other vegetable markets in Guwahati city are Paltan Bazaar, Ganeshguri Subzi Bazaar and Basistha Chariali vegetable market. All of these markets are lacking basic infrastructure. Rural3. Haats and Mandis: At block level, small towns and rural markets, vegetable mandis and haats are operational. Most of the vegetable markets at block and village level are under gram panchayats or are private. Rural markets are very much preferred by the farmers due to proximity to production cluster, less transportation cost and absence of trader’s cartel. Rural markets also lack infrastructure such as covered sheds, platforms, plastic crates, sorting/grading machines etc., which are imperative to handle fresh produce. Meghalaya East Khasi hills are the major vegetable production cluster identified in Meghalaya. The major vegetables cultivated in this region are potato, cabbage, cauliflower, radish, carrot, peas, French beans, tomato, squash, lettuce and mustard (leaf). However, apart from these, farmers cultivate other minor vegetables such as capsicum, broccoli, coriander, beet root, pumpkin, cucumber, turnip, knol khol, brinjal, okra, onion (green) bitter gourd, bottle gourd and ridge gourd. The protected cultivation of the following crops is undertaken: capsicum, tomato, broccoli, pea, cucumber and mustard leaves.
  • 114.
    104 Value ChainAnalysis of Select Crops in North Eastern States The agro-climatic conditions in the region favour the cultivation of vegetables round the year. During the summer season, when no vegetable is produced in the neighbouring states of Assam, Nagaland, Tripura, Mizoram and Manipur, the produce from Meghalaya is regularly sent to these markets as off season vegetables and fetch good prices. Crop-wise, per ha cost of production has been observed to be highest in case of potato (` 41,500 per ha) due to higher seed cost, followed by tomato (` 39,700 per ha), beans (` 36,900 per ha), cauliflower (` 35,700 per ha), cabbage (` 32,200 per ha), pea (` 31,000 per ha), carrot (` 29,900) and radish (` 24,800 per ha). Contribution of hybrid seeds to the cost of cultivation is observed to be maximum in all the crops except for tomato and beans in which pesticide cost is found to be maximum. Due to rain-fed vegetable cultivation, irrigation cost is observed to be minimum. Sl. No. Name of Vegetables Popular Varieties Primary (Major) 1 Potato Kufri Jyoti, Kufri Megha, Giri Raj 2 Cabbage Mahyco 139, Sultan, NS25, 10-15% O.P.V. 3 Cauliflower Snow Ball (hybrids less than 20%), O.P.V. 4 Radish 100% O.P.V. 5 Carrot Kuroda (US Agri), New Kuroda (NunHems), 15-20% O.P.V. 6 Peas Sultan, Azad, 40% O.P.V. 7 French Beans Sultan, Selection 9, Anupam, 20-30% O.P.V. 8 Tomato Avinash, 017, NS52 (Namdhari) 9 Squash 100% O.P.V. 10 Lettuce ICE Berg, General, 50% O.P.V. 11 Mustard (Leaf) 100% O.P.V. Secondary (Minor) 12 Capsicum (Green) California Wonder 13 Broccoli Pushpa Aishwarya 14 Coriander Italian Beauty, US Agri, Namdhari 15 Beet Root Ruby Queen 16 Pumpkin 100% O.P.V. 17 Cucumber Malini, 50% O.P.V. 18 Turnip 100% O.P.V. 19 Knol Khol Purple Top, Early White Viena (100% Hybrid) 20 Brinjal Puple Long, 50% O.P.V. 21 Ladies Finger 100% O.P.V. 22 Bottle Gourd 100% O.P.V. 23 Onion (Green Leaf) N53, Pusa Nashik Red 24 Bitter Gourd 70% O.P.V. 30% Hybrid 25 Ridge Gourd 100% O.P.V. Source: Discussion with stakeholders, KVKs, District Agriculture Offices Table 61: Popular Varieties of Vegetables in Meghalaya
  • 115.
    105Chapter 5 |Value Chain Analysis Mostly traditional practices are followed for post-harvest handling of vegetables and only washing is carried out by few farmers in case of potato, radish. Few farmers also revealed adoption of sorting activity in case of potato, cabbage, cauliflower, tomato. The farmers generally harvest the produce in the evening of the previous day to be taken to the market the next day. After harvesting, the vegetables are kept in gunny/jute bags (potato/ radish) and bamboo baskets (cabbage, cauliflower, tomato, French beans etc. ), which are carried to the market the next day. There are no separate storage facilities for vegetables at the field level. The movement of produce to urban markets is through bus/mini trucks/jeeps in the region. The head loads are carried to a distance of 1-5 kilometres on an average, to reach the rural market or a point from where motor transport is available for transporting the produce to Shillong markets. Farmers travel upto 50-60 kms to Shillong to dispose off their produce. The cost of transportation varies for: Tata 407/truck™™ ` 0.50 to ` 1 per kg. Bus:™™ ` 1 to ` 1.20 per kg. Figure 83: Estimated per ha Cost of Production of Vegetables in Meghalaya 0 5000 10000 15000 20000 25000 30000 35000 40000 45000 Potato Cabbage Tomato Beans Carrot Pea Cauliflower Radish Seed Cost Pesticides Cost Fertilizer Cost Irrigation Cost Labour Cost Total Cost Source: Primary survey of farmers by ISAP Vegetable Market in Meghalaya
  • 116.
    106 Value ChainAnalysis of Select Crops in North Eastern States The packaging of the vegetable crops at the farm level is conventional and suffers from quality deterioration and transit loss. Mostly vegetables are packed in gunny/jute bags (potato/radish) and bamboo baskets (cabbage, cauliflower, tomato, French beans etc.) for transporting to the market. The cost of packaging varies for: Gunny bag -™™ ` 20-30 per bag, jute bag Jute bag -™™ ` 10-20 per bag Bamboo basket -™™ ` 40-60 per basket. Average post-harvest loss at the farm gate is estimated around 5%. Farmers revealed higher post-harvest losses in case of tomato, beans, leafy vegetables, brinjal, carrot and gourds. Transportation of their produce to the nearest urban markets for sale at remunerative prices is a major problem faced by farmers. Harvested vegetables are transported to markets either manually, by bus or autos as per convenience and distance. The following marketing channels are followed by the farmers: Farmers – Consumers:1. Most of the farmers prefer to sell their produce in the rural market (held periodically) or nearest urban market which are largely unorganised directly to consumers or agents of traders. The farmers also feel convenient to dispose off their produce at the village as it saves their time and energy in transporting the produce to the urban markets. Farmers – Village level aggregators (agents/big farmers/SHG/farmer Club/producer2. organisation) or Agents of traders – Consumers: It is also observed that a large number of farmers sell their vegetable produce to the village level aggregators or agents of the traders who collect it either from their conventional storage at home or from the field and sell produce to consumers. Farmers – Wholesalers – Retailers – Consumers:3. Farmers of nearby production clusters visit the nearest market and sell their produce to the wholesaler who offers maximum price for it. Wholesaler in turn sells the produce to retailers as well as consumers. Farmers – Agents/Traders/wholesalers (from Assam, Tripura, Mizoram, Manipur,4. Nagaland) – Traders at respective local markets – Wholesalers – Retailers – Consumers: It has also been found agents of traders from nearby states (Assam, Tripura, Mizoram, Manipur and Nagaland) procure the vegetables at the village. The farmers sell their produce to the available channels in the village (farm gate) at comparatively lower prices than the urban markets in order to avoid the problems of transport. Secondly, in case of urban market, trading cost of transportation is higher and the farmer is more dependent on the wholesaler. Wholesalers adopt unfair trade practices in the procurement and raise issues on quality to pay less to the farmers. Thirdly, in few cases, the wholesalers/traders purchase vegetable produce against the money advanced to the farmer for operations. Under such circumstances, the farmer is at a disadvantage as he has to compromise for the lower pre-harvest price and adjust more volume of the produce towards the interest of the debt availed.
  • 117.
    107Chapter 5 |Value Chain Analysis Post-harvest losses of fresh vegetables in the region at wholesalers’ level are estimated to range from 3% for peas to 15% in tomato crop, with an overall average loss of 8% at wholesaler’s level. Losses at the retail levels are estimated to be 4% in the region, as volumes handled by retailers are small for day to day consumer demand. Majority of this wastage is due to sorting and daily surplus, which needs to be discarded at the end of day. Conclusion The above discussed value chains are truncated value chains.™™ Around 20–30% of the produce gets wasted at field level.™™ Entire produce is not sold at market level.™™ Due to low volume, farmers sell directly to consumers also at village level or at nearby™™ markets. Marketing and post-harvest infrastructure is yet to be scaled-up to improve the overall™™ value chain. Existing markets are not very supportive to the farmers due to traditional system of™™ procurement. Markets are found to be lacking in basic facilities.™™ In most of the states either there is no regulated market or most of the trade is being™™ practiced in non-regulated/traditional markets.
  • 119.
    Benchmarking with ExistingBest Practices C hap t e r 6 To improve the cultivation practices, technological interventions, supply chain and marketing, it is essential to map out the best practices in the region and disseminate the same in identified clusters. There are locations in the North East itself which have success stories of higher production, better marketing linkages and good income from the venture. These success stories would be helpful to improve the value chain of potential horticulture in the clusters as well as in other production areas. Benchmarking study of the identified crops is as below: Pineapple Productivity of pineapple in the identified states for study State Productivity (MT/ha) Arunachal Pradesh 5.7 Assam 15.8 Meghalaya 8.9 Nagaland 15.5 Tripura 22.6 Source: NHB and State Horticulture Departments From the productivity point of view, Tripura, Assam and Nagaland are the top three states. Average farm gate prices are also lesser in Tripura (` 7), Assam (` 10) and Nagaland (` 8) than Arunachal Pradesh (` 15) and Meghalaya (` 15). For a pineapple of 1-1.5 kg, ` 8 is modal price for the farmers. When the farm gate price goes down below ` 8, it creates stress among the farmers. Molvom in Dimapur (Nagaland) will be an ideal village for benchmarking study. Average yield is 30-35 MT per hectare. Farmers have started applying improved production technologies after training from Horticulture Department and Central Institute of Horticulture (CIH). Cost of production is low due to group farming where farmers work in one another’s field and they don’t have to pay for labour. Farmers havegoodincomefrompineapplefields dueto direct linkages withtraders. Guwahati is the nearest main market for the pineapple produced in Molvom. Traders from Guwahati contacts directly to the farmers groups and visit the farms for procurement and transports the produce to Guwahati. Most of the crop is sold at farm gate only so farmers don’t have any burden of loading, packaging, transportation and logistics etc. Farmers’ group use the collection centre constructed in the village when there is big order either from Guwahati traders or when they have to supply to Delhi, Bangalore etc. Harvesting of pineapple is done at different stages of green colour based on the distance of markets and farm gate. Farmers in Molvom are well aware about the harvesting stages.
  • 120.
    110 Value ChainAnalysis of Select Crops in North Eastern States Packing of pineapple is done at farm gate level for distant markets. Labour charges are provided by the traders to the farmers. Pineapples are wrapped in paper and kept the crown downside in CFBs which reduces the chance of damage due to jerk during transportation. It is carried in open, only by keeping crown downside, in mini trucks to Guwahati. Thus, the Molvom village model can be implemented to other pineapple farming clusters in North East for better marketing linkages and to improve the overall value chain. Guwahati can be identified as focus market for the pineapple produced in Nagaland and in nearby districts in Assam (Kamrup and Karbi Anglong) and Silchar for the pineapple produced in Tripura and North Cachar Hills and Cachar districts of Assam. Products can be moved easily to other parts of country from Assam due to better connectivity. Mandarin Productivity of mandarin in the identified states for study State Productivity (MT/ha) Arunachal Pradesh 4.3 Assam 10.59 Manipur 5.89 Meghalaya 3.99 Mizoram 3.2 Sikkim 1.73 Tripura 7.03 Source: NHB and State Horticulture Departments Assam, Tripura and Manipur have higher productivity of Khasi mandarin. In Assam it is 10.59 MT/ha. Farmers in Kamrup (rural) district, especially in Boko sub-division are reaping the profit from mandarin orchards. Although most of the orchards are very old, however, due to appropriate plant management practices, they are getting a satisfactory yield of 7-8 MT/ha. Traders from Guwahati approach them directly and procure produce from the farm gate. During the time of peak demand in major markets, these farmers are able to get a farm gate price as high as ` 5 per piece. The connectivity from Boko to Guwahati is also good which provides an extra edge as the produce can be taken to the market quickly. The Govt. has provided a small pack house for common use so that some farmers can sell fruits of different grades to the traders at good rates instead of selling the whole orchard as per pre-decided low rates. Khasi mandarin produced in Tinsukia, which is better known as Tinsukia variety, is of good quality. Area under mandarin was reduced in past due to diversification towards tea cultivation but due to Agriculture Department’s intervention and assistance under NHB Scheme for rejuvenation, it has started resuming and now farmers are benefitting from it. Farmers are being trained by KVK and Agriculture Department for application of protection chemicals, nutrients and weed management. They have been given training on ‘Prophylactic Rejuvenation’ also which prevents the shoot borer attack. Tinsukia mandarin is in demand in the major markets in Assam. Now farmers are getting 25,000-50,000 oranges per ha of orange orchard. Mandarin reaches directly from farm gates to the markets in Guwahati, Dibrugarh, Golaghat and Jorhat etc.
  • 121.
    111Chapter 6 |Benchmarking with Existing Best Practices Farmers in the other North Eastern region can also get the good returns by direct contact with traders, availability of market at farm gate and by establishing the common facility centre for sorting and grading. Ginger Productivity of ginger in the identified states for study State Productivity (MT/ha) Arunachal Pradesh 5.5 Assam 6.88 Manipur 11.57 Meghalaya 5.79 Mizoram 4.92 Nagaland 6.9 Sikkim 5.39 Source: NHB and State Horticulture Departments Ginger is widely grown spice all over North Eastern Region and supplied to other major markets in the country. Assam is the largest producer and trader of ginger from NER. Ginger productivity in Assam is better than other states also. One of the two hill districts of Assam, Karbi Anglong has set new dimensions in ginger production and trading. A group of more than 1500 small and marginal tribal farmers are the part of Ginger Growers’ Co-operative Marketing Federation (Gin-Fed), an initiative of Rashtriya Sam Vikas Yojana. Gin-Fed supplies directly to Azadpur Mandi, New Delhi. Farmers through middlemen were getting as low as ` 3-4 per kg but Gin-Fed minimised the distress selling and facilitated fair price. Farmer price ranges from ` 6-35/kg comparable to National mandis. It also arranges the procurement, primary processing, marketing information, obtaining order and shipment. Farmers under Gin-Fed have been provided ‘G-card’ who doesn’t sell the produce anywhere else except Gin-Fed (but they are not bound to sell only to Gin-Fed). G-card assists in credit facility from public sector banks. Gin-Fed charges only for handling at ` 1.50 per kg and administrative cost at ` 0.30-1.00 per kg. Whatever extra profit is earned from the business goes to the shareholders’ (farmers) pocket. Gin-Fed has tie-ups with major traders in India such as ITC, Sresta Bio Products, NAFED, Stacon, RayFarm and Ace Agro. They are approached by leading firms in Japan and South Korea for organic ginger export as it has more oil content. Though ginger is grown in naturally organic condition but Gin-Fed is in the process of certification of the fields to facilitate direct export to European countries. Railway has provided one parcel van facility to Gin-Fed to transport directly to New Delhi with charges as low as 50 paisa per kg. While transporting a 20 MT load by truck, costs ` 4-5 per kg (` 45,000-50,000 transportation cost plus other illegal taxes). Turmeric Productivity of turmeric in the identified states for study State Productivity (MT/ha) Assam 0.7 Manipur 11.34 Meghalaya 5.06 Mizoram 5.1 Sikkim 5.37 Source: NHB and State Horticulture Departments
  • 122.
    112 Value ChainAnalysis of Select Crops in North Eastern States Turmeric is the second major spice crop in NER which is also grown in all eight NE States. In Mizoram, Mamit District is largest turmeric producer. Area under turmeric is more than any other spice crop. Reiek village in Reiek block of Mamit (12 km from Aizawl) is famous for turmeric cultivation. In Reiek, they have ‘Turmeric growing farmers’ society’ which sells turmeric rhizome to State Horticulture Department and the Department further supplies the rhizome all over state as seed material to farmers. Farmers generally grow Megha and Lakadong varieties. Local turmeric rhizome productivity is 10 MT/ha. Turmeric grown here is organic by nature as farmers don’t use any chemical input. Farmers are very laborious and cultivate as per training provided by the District Horticulture Department. Farmers in the Reiek village sell rhizomes, cured ginger and ginger powder as well. Traders from Aizawl and outside Mizoram visit the village for procurement of spices such as ginger, turmeric and Bird’s Eye chilli. There is small scale grinding machine where a group of farmers do the grinding. By forming the growers’ society, farmers of the village have acquired the ability to negotiate the price with traders. Turmeric rhizome is procured by Horticulture Department at ` 20-25 per kg, while cured turmeric is sold by the farmers at ` 60-80 per kg and powder at ` 100-150 per kg. Traders from Assam (mainly from Cachar and Karimganj) buy from here and sell to markets in Assam. But more than 50% of produced turmeric is procured by the Horticulture Department.
  • 123.
    C hap te r Conclusion Recommendations 7 The value chain study has been carried out to examine the supply and demand dimensions of identified FCGs from North East Region, which can be sold in raw or processed form along with certain specialty crops such as passion fruit, kiwi, naga chilli, large cardamom etc. which are grown only in this region of the country have considerable domestic and international market potential which is yet to be exploited. The value chain study has analysed the stages that these crops pass through, (FCGs) from production to end-consumer, identify the gaps and devise strategies to overcome these shortcomings.Ithasalsobeenobservedthattheaverageproductivity,production,technology, logistics, post-harvest and marketing infrastructure need to be upgraded for identified FCGs so that the potential of the region can be fully realised. The major concerns that have emerged of the value chain study are: Land Tenure and Ownership System Land ownership and laws are uneven and unclear in the entire NE Region. The entire system falls under the following three broad categories: Land owned collectively by the villagers™™ Land owned by the tribal chiefs, who allot land among the individual households for™™ shifting cultivation purposes, and Individually-owned land.™™ Most of the horticultural crops have elongated conception periods and preliminary cost of establishment of orchard or plantation is high, which makes it almost impractical for the small and marginal farmers to go for such propositions without taking long-term credits from financial institutions such as banks. However, banks do not find it a very encouraging venture and are not sure about the recovery of loans because of the peculiar land tenure system, particularly in the tribal belts. Apart from this, the small farmers are not tuned to the idea of commercial horticulture cultivation and are not familiar with the formalities of acquiring bank loans. Poor Cultivation Practices and Low Productivity Small land holdings, poor investment capacity, general neglect and non-adoption of scientific cultivation practices are the major constraints for poor return from most of the horticultural crops in the NE Region and despite the favourable agro-climatic conditions, the rate of production and growth of all horticultural crops is far below the all India average.
  • 124.
    114 Value ChainAnalysis of Select Crops in North Eastern States In most of the cases, the fruit orchards are very old and senile and the yields are very low. The high capital cost involved in establishing orchard/plantation and setting up of required infrastructure is a serious constraint in the expansion of area under fruit crops in the NE Region. Due to high altitudes, water runoff is rapid and therefore the region lacks water during the winter season despite having abundant rainfall in summer. Therefore, lack of irrigation facilities and the absence of water retention practices severely limits possibilities of multiple cropping, resulting in low land productivity. In case of vegetables, by planting HYVs which take nearly 3.5 to 4 months from sowing to harvesting, instead of the traditional crops, which take nearly 5 to 6 months, it is possible to increase crop intensity without changing the irrigation facilities. However, these crops require large investments in terms of fertilisers, seeds and pesticides, which poor farmers (due to the small land holdings) are not able to afford. Shifting cultivation (jhum) is widely prevalent in NE Region of India. Though the cycle has now been shortened to 2-3 years because of increased population pressure on land and decrease in productivity, leading to utilisation of more area under jhuming. This system has caused large-scale deforestation, soil degradation/erosion (it removes nutrient-rich top soil) and depletion of resource base. Poor and Weak Extension System Despite high potential, difficult terrain with poor connectivity, lack of trained dedicated human resources and poor coordination among departments are some of the key factors responsible for ineffective and poor extension programme in the NE Region as compared to other states of India where the extension services are very efficient. However, the NE Region is lagging far behind in this aspect. Due to an inadequacy in the extension support staff and information dissemination system at the grass root level, farmers remained unaware of the latest technologies, govt. schemes and programmes pertaining to horticulture cultivation and promotion. Poor Logistics and Connectivity Poor infrastructure in terms of roads and railways are the main constraints in the development of NE Region. From the trade point of view, existing rail infrastructure is mainly limited to Assam (broad gauge track). Due to hilly terrain, most of the farmers transport their saleables on head loads (in case of periodic markets), as the public transport in the region is expensive and mostly inaccessible from the production zones or villages. The head loads are carried to a distance of 1-5 kilometres on an average to reach the primary or rural markets or a point from where the motor transport is available for transporting the produce to the main markets. The movement of produce to main (urban) markets is through buses/mini trucks/jeeps that add up transportation costs. The estimated transportation loss from production zone to distant markets is approximately 15-20 percent and the farmer is able to get the price only for better quality produce. Transportation of perishable produce is perhaps the most serious constraint in the development of horticulture in this region.
  • 125.
    115Chapter 7 |Conclusion Recommendations Poor Marketing and Post-harvest Infrastructure Due to lack of organised and alternative marketing structure in the region, farmers are getting low return compared to the other parts of India, whereas the middlemen get the profit at their expense. Farmers in the existing market are cheated by middlemen (wholesalers/ retailers) and the share (margin) which the farmers should be getting ends up with these middlemen. Except the organised tea industry, producers of almost all the commodities including specialised products such as kiwi and passion fruit, face considerable marketing problems. Due to poor markets and the perishable nature of the products the farmers sell their produce at a throwaway prices to the middlemen without even getting the opportunity to display them in the open market. Rural markets are much preferred by the farmers due to proximity to production cluster, less transportation cost and absence of trader’s cartel. However, rural markets lack the infrastructure such as covered sheds, platforms, plastic crates, sorting/grading machines etc., which is crucial to handle fresh produce. Lack of primary processing, logistics, marketing and post-harvest infrastructure across various levels of the value chain, are the major factors for quality detoriation and value loss of the perishable produce in the region. For e.g., in case of pineapple, due to lack of assured market in NER, about 20-30 percent of the produce gets wasted and during the period of glut, when abundant produce is being taken to the markets, the farmers are not even able to recover the logistics cost and are forced to distress sell as they do not have any other option. In the absence of plastic crates, farmers use gunny/jute bags, bamboo baskets for packaging of fresh produce which leads to post-harvest losses due to physical injury to the vegetables. Also, the shelf life of packaging material is very less and farmers need to spend frequently to purchase packaging material. Lack of Processing Industries For NE Region, the success of growing perishables is closely linked to the success of fruit processing units. The processing industry can help in sorting out the problem of proper disposal of perishable commodities. To date, there are hardly any cold storage facilities available; few processing units exist and those too are not functioning up to the desired capacity. Use of appropriate pre and post-harvest practices is vital for the success of the crops and to provide good return to the growers. Unfortunately, this is a major lacuna in the entire region. Value addition should be given top priority for crops such as pineapple, citrus, chilli, ginger and turmeric. From the value chain analysis, it seems that the farmers are getting around 50 percent of the consumers’ price but in reality they get this price only for the high quality produce which fetches premium price in the market and the produce which reaches the market; so although farmers are getting good returns per unit produce, but the actual returns per unit area are very low. About 20-30 percent of the produce gets wasted at the farm level for which the farmers get nothing.
  • 126.
    116 Value ChainAnalysis of Select Crops in North Eastern States Recommendations Pineapple StateProduction Practices HarvestingPost-harvestMarketing Systems Market infrastructure Any Other Assam, Meghalaya, Tripuraand Nagaland Trainingofa. farmerstofollow cleancultivation practices.By followingthe scientificpackage ofpractices, theyieldscan besignificantly improved. Farmersneedto betrainedabout theeconomic lifeofthecrop andtheneedto replantthecrop whentheplants becomeveryold whichreducesthe yieldsignificantly. Trainingcapacityb. buildingof farmersforbetter fieldmanagement practicesincluding diseasepest management. Appropriatec. application ofFYMand vermicompost. Exposurevisitd. offarmersto progressive farmers’field withinoroutside thestate. Trainingfarmers’a. intimingthe harvestatthe appropriate maturitylevel andadditionto goodharvesting practices. Identificationb. ofcolour development toschedulethe harvestingfor targetedmarkets (basedon distance). Schedulingofc. harvestingasper marketdemand byfollowing thetechnique ofstaggered planting. Promotionofsizea. gradingpractices atfarmlevel. Farmersandb. traderstraining onpost-harvest management especially handlingduring loading/unloading, logisticsand supplychain. Keepingthec. crowndownside duringloose transportationby vehiclestoavoid physicaldamage tothefruit. Useofscientificallyd. developed packagingmaterial fordistant transport. State-specific Nagaland: Exposurevisita. offarmersto Molvomvillage tobecomeaware abouthandling andpackagingof fruits. Tradelinkagesa. withtradersin MarketsinAssam andWB. Promotinglocalb. entrepreneurs toparticipate inthetradeof horticultural products. Farmerstrainingc. onmarketing, logisticsandprice negotiationforthe marketsinNER. Networkingwithd. theprocessors intheregion tosupplythem directlyfromfarm gate. State-specific Meghalaya: Formationofa. farmersgroup tosupplyinbulk toGuwahatiand Kolkata. Trainingofa. farmersonquality management, pricenegotiation andmarketingtie ups. Setupofb. collectioncentres atthefarmgateof majorproduction belts. Settingupc. ofpineapple processingunits nearmajor production clusterstoavoid wastageduring glutsothatunsold fruitscanbeused forvalueadded products. Upgradationd. ofexisting processingunits andstrong marketing linkages. Developmentofaa. modelpineapple villageforbulk productionand supply. Creationofb. entrepreneurship interestsandskill development ofyouthforthe employmentin pineappleindustry fromproduction tomarketing. Pineapplefromc. theNEregionis organicbydefault asthefarmers donotapplyany kindofchemicals, theproducecan bepositionedas organicandsold atapremium. Scopeexistsford. exportingthe organicpineapple tovariousother countries.
  • 127.
    117Chapter 7 |Conclusion Recommendations StateProduction Practices HarvestingPost-harvestMarketing Systems Market infrastructure Any Other State-specific AssamMeghalaya: Trainingofthea. farmerstoadopt thetechnique ofstaggered planting,asbeing followedinthe stateofTripura. Nagaland: Farmerstraininga. ondoublerow plantingandavoid singlerowplanting whereveritis noticed. Avoidtheb. productionof oversizedfruits whichfetchesa comparativelylow price. Tripura: Thereisaneeda. tosetupformal tie-upswith Bangladesh. Promotionofb. Tripurapineapple asabrandin horticulture exhibitionand tradeshows,pan Indiabasis. Nagaland: Promotionofa. marketingin NewDelhiand Kolkatamarketas thereisdirectrail connectivityfrom Dimapur. State-specific Tripura: Regularmarketsa. shouldbe organisedforthe farmerstosellthe produceinthe market.
  • 128.
    118 Value ChainAnalysis of Select Crops in North Eastern States StatesProduction Practices HarvestingPost-harvestMarketing Systems Market infrastructure Any Other Assam, Manipur, Meghalaya andSikkim Rejuvenationofa. oldorchardsby trainingfarmers. Promotionofb. qualityrootstock planting. Optimumandc. recommendeduse ofinputs. Trainingcapacityd. buildingoffarmers forbetterorchard management practicesincluding diseasepest management. Promotionofe. biopesticidesand insecticidesas thereissignificant lossduetoinsect andpest. Identificationoff. fewprogressive farmerswho canestablish smallscaleplant propagationunits withgovtsupport andsupplygood qualityplanting material. Trainingfarmers’a. intimingthe harvestatthe appropriate maturitylevel andadditionto goodharvesting practices. Schedulingofb. harvestingasper marketdemand. Groupformationc. offarmersfor aggregation ofproduce andcollective marketing. State-specific Sikkim: Harvestingata. propertime targetingthe distantmarkets ofSiliguri,Kolkata andBangladesh. Promotionofa. primarygrading sortingpracticesat farmlevel. Sortinggradingb. offruitsaspersize colour. Distributionandc. promotionof plasticcrates insteadofbamboo baskets. Establishmentofd. collectioncentres withwaxingfacility intheproduction zones. Establishmente. ofsmallcitrus packhouses fordispatchto markets. Minimumpricea. fixationduringthe timeofglut/peak production. Strengtheningb. offorward linkagesby encouragingretail chainsfordirect procurementand distribution. Facilitationofc. buyers-sellers meet,before harvestingseason toensurequality, supplyandprice. Promotinglocald. entrepreneurs toparticipate inthetradeof horticultural productsin generalandcitrus inspecific. State-specific Manipur: Promotionofa. fruitcollection nearfarmgate toaccessdistant marketsdirectly fromfield(asof nowcitrusisnot goingtomarkets outofManipur, althoughthereis gooddemand). Betterlogistica. infrastructure. Promotionb. throughNERAMAC outlets. Establishmentofc. govt.promoted outletsinmajor fruitsvegetable markets. Developingcitrusd. collectioncum packagingcum waxingcentre nearproduction clustersfor targetingdistant marketsinstead ofrestricting movementof citrusonlyto nearbymarkets. State-specific Sikkim: Implementationa. ofproposed packhouse projectswithout delay. Assam: Thoughcitrusa. isgrownin everydistrict butmajorityof productionis concentratedin 4-5districtsonly. Productionshould bepromotedto otherdistricts alsowhichhave suitableclimate. Manipur: Thereisneedtoa. makeManipur citruscompetitive inthemarketand thatcanbedone onlybydoingtwo keythings, one–byimproving productivity ofcitrusand secondly byreducing transportation cost(which havebeen keptartificially veryhighby transportersin Manipurcompare toanyotherpart ofthecountry). Citrus
  • 129.
    119Chapter 7 |Conclusion Recommendations StatesProduction Practices HarvestingPost-harvestMarketing Systems Market infrastructure Any Other Fieldg. demonstration ofintegrated cultivationpackage includingnutrient managementby extensionworkers inthefarmers orchard. Facilitatingtradeb. withtradersfrom distantmarkets suchasGuwahati, Kolkataandfrom Myanmarby introductionto producersand organisingbuyer- sellermeets. Meghalaya: Formationofa. farmers’groups andtie-upswith tradersinmarkets ofShillongand Guwahati. Sikkim: Betterpoliciesa. topromote exporttradewith Bangladeshand toplaceproduce competitively againstBhutan Mandarin price-wise. Introductionofb. awidenumber offarmerswith SIMFEDand NERAMACfor directselling andbetterprice realisation. Strengthentheb. marketingdivision ofDirectorate ofHorticulture andCashCrop Development departmentto improvethe horticulture marketingfrom farmgateto markets. Involvinglocalb. youthand entrepreneurs inbusinessof horticultural trade,asoutsiders havealotof apprehensionin doingbusiness inManipurdue tolawandorder situation. Meghalaya: Setupoffarmgatea. logisticservices willbehelpfulto collectthefruits fromscattered orchardsasitis timeconsuming tocarrythehead loadsfromfieldto connectingroad andthentolocal marketsandfinally mainmarkets. Sikkim: Formationofmorea. farmersgroupsto availtheexisting subsidyprovided bystategovt. totransportin Siliguri/Kolkata markets.
  • 130.
    120 Value ChainAnalysis of Select Crops in North Eastern States StateProduction Practices HarvestingPostHarvestMarketing Systems Market infrastructure Any Other Assam, Meghalaya andSikkim KVKa. recommended packageof practicesshould befollowed especiallyforseed rateandnutrient requirement. Improvedseedb. varietiestobe used. Certificationofc. purelyorganic fields. State-specific Sikkim: Selectionofa. farmersforseed distributionshould notbepolitically influenced. Weedb. management shouldbedone duringthecritical stages. Gingershoulda. beharvestedas perrequirement/ targetoffreshand drygingerand harvestingshould notbedelayed. Propercleaninga. andwashing. Dryinginhygienicb. condition. Trainingonpost-c. harvesthandling andpackaging. Useofcoldd. storeswherever available. Interventionofa. govt.agencies isnecessaryto minimisethe involvement ofvarious stakeholder bydirect procurementfrom farmers/farmers’ groups. Effortshouldbeb. madesothat farmerscanget agreaterpieof profitcompared tovarious stakeholders involvedinginger trading. Ensurethec. availabilityof logisticservicesat farmgatesothat farmerscancome directlytomain markets. Exposureofd. farmerstoGIN- FEDinKarbi Anglongfor improvement intrading marketing. Gingerfarmerse. shouldbe supportedduring steepfallof pricebygovt. Interference. Indigenousa. cleaningand washingfacilities attheproduction clusters. Co-operativeb. modellikeGIN- FEDshouldbe implementedin otherclusters alsoforbetter marketing linkages. State-specific Assam: Alreadya. established integratedginger packhousein Kamrupshould runsmoothly. Meghalaya: Efficientutilisationa. ofexisting processingunits. Settingupofb. procurement centresinthe clustersduring harvestingseason. GIN-FEDmodela. shouldbestudied astheyare supplyingdirectly toAzadpurmandi inNewDelhi. Promotionofb. ginger-based bakeryproducts canbedoneby useoforganic gingerandthe productscanbe soldwithorganic brandinginmajor cities. State-specific Sikkim: Gingergrowinga. farmerswho arenotrealising satisfactoryprofit fromtheventure maybetrainedin floriculturewhich isverypromising inSikkimcurrently. Ginger
  • 131.
    121Chapter 7 |Conclusion Recommendations StateProduction Practices HarvestingPostHarvestMarketing Systems Market infrastructure Any Other Marketinglinkagesf. withprocessors tosupplyforoil extraction. State-specific Meghalaya: Marketlinkagesa. offarmers’group withtradersin Shillongand Guwahatito realisebetter shareofconsumer price. Betterb. procurement systemby attachment withNERAMAC ProcessingCentre atRiBhoiand organisations tradinginspices nationwide. Sikkim: GIN-FEDlikea. modelcanbe implemented tointegratethe production,supply chain,marketing tie-upasginger shares1/4th of totalhorticulture productionin region. Sikkim: Gingerpackhousea. builtinBirdang shouldbeused efficiently. Simfedshouldb. promotethe valueadded gingerproducts manufactured atBirdangpack housebytargeting themajorcities andexport markets. Certifiedorganicc. gingershouldbe promotedinretail outletsinmajor citiesbybusiness tie-ups.
  • 132.
    122 Value ChainAnalysis of Select Crops in North Eastern States StateProduction Practices HarvestingPost-harvestMarketing Systems Market infrastructure Any Other Assam, Meghalaya andMizoram Properapplicationa. ofpackageof practicesto improvethe overallyieldinthe state. Treatmentofb. rhizomesbefore sowingtoavoid rhizome-borne diseases. State-specific Assam: Improvetheseeda. rateupto2MT/ha Exposurevisitofb. turmericfarmers toleadingbelts inSouthIndia/ Mizoram. Meghalaya: Useofhealthya. rhizomesof Lakadongvariety asplanting material. Mizoram: Increasethea. productionareain Aizawldistrict. Implementationb. ofReiekmodelof farmersgroupin otherproducing belts. Turmericshoulda. notbeleftin thefieldfora longtimeafter maturityasit affectsthequality. Hence,itshould bedoneatproper timeofmaturity. Propertraininga. shouldbe impartedin washing,grading, slicinganddrying tomatchthe qualityinnational markets. Largelevelcuringb. atthefarmers placeshould bepromoted forbetterprice realisationof finishedproduct. Valueadditionc. activitiessuchas powder-making andcurcumin extractionshould bepromoted underagro-based industry. Farmersshoulda. beencouraged tosellfinished turmeric. Directb. procurement systemshould beimplemented through NERAMACand renownedprivate organisations. Linkageofc. farmersgroups withtradersinthe cities. State-specific Meghalaya: Marketinga. linkagewith nationalaswell asinternational processorswhere Lakadongvariety isindemanddue tohighcurcumin content. Brandingofb. Lakadong turmericsuchas Erode. Mizoram: Marketinga. linkageswithspice industryinstead ofmiddlemen forbetterprice realisation. Setupofa. scientific/ indigenous slicing,dryingand grindingunitat majorproduction belts. Setupofvalueb. addition processingunitto procuredirectly fromfarmersand marketfurtherto majorlocations. Commonc. procurement infrastructureto sellinthemarkets outsidethestate. Formationofa. turmericvillagein majorproduction districtsand trainingon scientific cultivationto improvethe productivity. Directlinkageb. withregionaland distantmarkets. StateSpecific Meghalaya: G.I.registrationofa. Lakadongvariety. Mizoram: Exposurevisitofa. lowproduction districtstoMamit toadoptbetter production andmarketing practices. Turmeric
  • 133.
    123Chapter 7 |Conclusion Recommendations Vegetables StateProduction Practices HarvestingPost-harvestMarketing Systems Market infrastructure Assamand Meghalaya Vegetablefarmersshoulda. betrainedproperlyfor systematiccultivation techniques. Availabilityofgoodb. qualityseedsshouldbe ensured. Seedsandotherinputc. materialshouldbe procuredeasilyby farmers. VisitofVLEWstod. vegetablefarmersat regularintervals. State-specific Meghalaya: Promotionofexotica. vegetablescanbedone atcommerciallevel astheagro-climatic conditionisfavourable. Organisedcultivationofb. offseasonvegetables. Trainingofa. farmerson harvesting practices,seasons andasper marketdemandis essential. State-specific Meghalaya: Harvestinga. ofoffseason vegetablesshould bemanagedas perthedemand inotherstates whereitistobe supplied. Properhandlinga. ofvegetablesafter harvestingandduring loadingandunloading isnecessary. Useofcratesduringb. longdistance transportation toavoidphysical damage. Packagingofc. vegetablesasper marketrequirement andtoavoiddamage duringtransportation shouldbefollowed. Useofexistingcoldd. storesforvegetable storagecanbe promotedtoavoid wastageandto facilitateefficient utilisationofcold stores. Trainingoffarmersa. onmarketingof vegetablesisnecessary astheyarenotable tonegotiatewith theaggregators/ consolidators. Involvementofvariousb. stakeholdersshould beminimisedby establishingorganised procurementsystem. Groupoffarmersc. canbeintroducedto wholesalersinthe mainmarketsfordirect supply. State-specific Meghalaya: Networkingoffarmersa. groupsdirectlywith thetradersindistant markettoimprovethe shareofprofitshould beencouraged. Vegetablesshouldb. benotifiedinthe regulatedmarketsfor organisedtrading. Establishmentofvegetablea. packhouseisdoneon urgentbasis. Infrastructureintheb. regulatedmarketsshould beupgraded. Formationofcollectionc. centresatmajor productionbeltsis necessary. Logisticsystemfromfarmd. gatetoconsumermarkets shouldbestrengthen. Basicfacilitiessuchase. office,sheds,hygienicity, toilets,weighingfacilities, gradingandcoldstores shouldbeprovidedinthe wholesalemarkets. Wastageshouldbef. minimizedbyuseof propermethods,toolsand facilitiesfromproduction tillendconsumers.
  • 134.
    124 Value ChainAnalysis of Select Crops in North Eastern States StateProduction Practices HarvestingPost-harvestMarketing Systems NagalandSeedavailabilityshouldbea. ensured. Organisedfarmingbymakingb. farmers’group. FieldexposuretoJalukiec. (Peren)forimproved cultivationpractices. NoneProperpackagingoffresha. anddrychillitoavoidquality degradation. Bigchilliescanbegradedandb. soldathigherpriceasthey sellonaperpiecebasisinthe retailmarkets. Drychillicanbesoldonaa. panIndiabasisthroughspice traders. Brandcanbepromotedb. throughagri-fairs/trade exhibitionsandotherevents. StateProduction Practices HarvestingPost-harvestMarketing systems Marketing Infrastructures NagalandIntegrateda. managementof orchardsespecially nutrientanddisease/ pestsmanagement. Certificationofb. organicallymanaged orchards. Forcommerciala. use,fruitshouldbe harvestedwhenitis 90%yellowand10% green. Fruitshouldbepickedb. fromvineratherthan beingallowedtofallon theground. Secateurs/sharpknifec. shouldbeusedto preventwaterlossand developmentoffungus. Useofcratesatfieldd. leveltocollectthe fruits. Forcedairpre-cooling,a. washing,sortingand gradingshouldbedone torealiseagoodprice. Timebetweenb. harvestingandpacking shouldbekeptata minimumtoavoid waterloss. Plasticbagpackingc. shouldbeavoided whichcausesskin shrinking. Packinginoneord. twolayercellpacks orpunnetsshould bedonetomarket indistantaswellas exportmarkets. Fruitsofuniformsizee. andstageofripeness shouldbepacked together. Directcontactsofa. orchardistswith processorsinNagaland andotherstates. Linkageoffarmersb. groupsorlocal traderwithtraders inGuwahati,Kolkata, NewDelhiandother promisingmarketswill helptrade. Organiseda. procurementsystem shouldbeformed duringharvesting season. Availabilityoflogisticb. facilityinproduction clusterstoreducethe timebetweenfarm gatesandconsumer markets. Efficientutilisationofc. existingprocessing unitsinNagalandand promotionofvalue addedproductsin domesticandexport markets. NagaChilli PassionFruit
  • 135.
    125Chapter 7 |Conclusion Recommendations KiwiFruit LargeCardamom StateProduction Practices HarvestingPost-harvestMarketing Systems Marketing Infrastructure Arunachal Pradesh Integrateddiseasea. andpestmanagement especiallypassionvine hopper. Pruningshouldb. bedoneatproper intervals. Verydenseplantingc. shouldbeavoided (6X6sqftis acceptable). Oldtreesshouldbed. replacedwithnew plants. Certificationofe. organicallymanaged orchards. Hardberriesshouldbea. harvestedfortargeted distantmarkets. Secateurs/sharpknifeb. shouldbeusedfor harvesting. Useofcratesatfieldc. leveltocollectthe fruits. Thefruitscanbestoreda. foraboutonemonth atroomtemperature and4-5monthsinthe coldstorageat10°Cto extendthemarketing period. Glutcanbeavoidedbyb. keepingincoldstorage forthetime-being. Attractivepackagingc. tofetchbetterpricein primemarketsofmajor citiesofIndiaaswellas exportmarkets. Cratesshouldbeusedd. fortransportation insteadoflooseor gunnybagpackagingto avoidphysicaldamage. Formationofkiwia. farmers’groupsfor efficientmarketing practicesandprice negotiation. Marketingthroughb. organisedchannelby directprocurement fromfarmgateby NERAMACandother corporategroups involvedinfruitsand vegetableventures. Logisticsystemshoulda. beupgradedtoaccess themajormarketsin Indiaasitisseenthat kiwifromNewZealand canaccesstheIndian marketseasilybutkiwi producedinArunachal Pradeshisfacing difficultiesinreaching themarkets. Integratedpackhouseb. shouldbeinstalledto gradehighqualitykiwi totargettheexport marketsandprime Indianmarkets. StateProduction Practices HarvestPost-harvestMarketing systems Marketing Infrastructures SikkimUseofhealthyanda. micro-propagated plantingmaterials. Replacementofoldb. plantswithnew onestoincreasethe productivity. Properweedc. managementinthe fields. Fieldsshouldbea. cleanedofdriedplants, leavesandstubbles. Harvestingisdoneb. whentopcapsulesof thespikeattaindark greycolour. Pseudostemsshouldc. beremovedduring harvesting. Harvestedspikesa. shouldnotbeleft forlongerduration becauseitishighly perishable. Fuelpipesystemb. shouldbeadopted insteadofopenBHATTI tomaintainthecolour andflavourand avoidtheburningof capsules. Awidenumbera. offarmerscanbe encouragedtosell throughNERAMAC- organisedauctioning system. Logisticsupportshoulda. beprovidedtofarmers livingatdistanceplaces toreachtheauction centreatRongPo.
  • 136.
    126 Value ChainAnalysis of Select Crops in North Eastern States Annexure1 IdentificationofProductionClustersintheStatesfortheSelectedFCGs Inordertoidentifytheproductionclustersinthestatesforidentifiedcrops,district-wiseproductiondatahasbeenanalysed. Duetonon-availabilityofcurrentyeardata(2010-11)withfewstatedepartments,previousyeardatahasbeenused. Sl. No. Crops/ Districts ArunachalPradesh(2010-11) Tawang West Kameng East Kameng Papum Pare Lower Subansiri Upper Subansiri Kurung Valley WestSiang EastSiang Upper Siang Dibang Valley Roing Lohit Anjaw Changlang Tirap Total Production (MT) AFruits 1Apple9.21%84.93%0.00%0.00%1.76%0.00%0.00%0.00%0.00%0.00%3.89%0.00%0.00%0.21%0.00%0.00%28,363 2Walnut11.33%88.67%0.00%0.00%0.00%0.00%0.00%0.00%0.00%0.00%0.00%0.00%0.00%0.00%0.00%0.00%609 3Kiwi7.51%60.31%0.00%0.00%24.33%0.00%0.00%1.17%0.00%0.00%3.82%0.89%0.00%1.98%0.00%0.00%3,930 4Citrus0.01%0.35%0.71%1.63%1.27%3.60%1.21%13.85%12.70%15.11%0.49%16.46%28.53%2.13%1.26%0.68%164,673 5Pineapple0.00%0.00%5.37%7.21%5.06%5.98%1.67%19.98%21.33%6.44%0.44%9.17%8.13%1.84%4.45%2.92%65,180 6Banana0.00%0.00%6.02%8.33%8.24%6.94%5.51%8.80%8.56%8.29%1.85%6.85%10.65%0.00%10.15%9.81%21,603 7OtherFruits1.49%10.43%3.48%2.94%5.95%7.23%6.78%6.85%7.81%7.27%3.39%7.71%7.53%7.50%7.45%6.18%13,276 TotalFruits1.07%9.73%2.16%3.22%3.16%4.13%1.74%13.00%12.66%10.70%1.08%11.97%18.68%1.96%2.74%2.00%297,634 BVegetables0.00%30.89%0.00%17.27%0.00%0.00%0.00%0.00%0.00%0.00%0.00%22.11%29.73%0.00%0.00%0.00%7,087 CMAPs11.31%13.46%4.50%3.46%6.98%4.23%4.02%8.10%10.62%11.00%3.37%3.29%5.17%4.19%3.11%3.18%108,108 DSpices 1L.Cardamom0.00%0.00%3.09%3.53%9.85%9.12%3.97%7.35%8.82%6.18%2.06%6.03%5.44%20.29%8.53%5.74%680 2Ginger0.00%0.00%0.00%0.00%12.90%0.00%0.00%3.23%8.06%5.99%0.00%31.68%19.01%12.90%6.22%0.00%4,340 TotalSpices0.00%0.00%0.42%0.48%12.49%1.24%0.54%3.78%8.17%6.02%0.28%28.21%17.17%13.90%6.53%0.78%5,020 GrandTotal3.69%10.94%2.71%3.48%4.21%4.05%2.29%11.40%11.87%10.54%1.64%10.09%15.35%2.65%2.83%2.26%417,849
  • 137.
    127Annexure 1 Sl. No. Crops /Districts Assam(2009-10) CacharHaila- kandi Karim- ganj GoalparaDhubriKokra- jhar Bongaig- aon Kamrup (R) NalbariBarpetaDarrangSonitpurNagaonMoriga- on AFruits 1Banana6.02%3.34%2.39%6.77%2.10%3.23%1.28%5.32%2.96%5.63%3.20%7.22%7.17%2.51% 2Pineapple11.35%4.76%1.82%1.95%0.27%2.16%2.21%14.62%0.48%1.88%0.95%5.56%3.17%0.51% 3Jackfruit6.35%1.62%4.79%7.39%2.17%2.75%3.29%3.65%4.43%3.74%6.80%4.64%8.48%3.26% 4Citrus2.61%1.44%1.27%2.65%0.85%1.69%1.26%10.99%1.53%1.57%1.43%2.45%3.17%1.90% 5Papaya2.76%1.29%0.78%3.42%0.98%4.59%1.96%5.35%3.27%4.70%1.47%3.78%5.57%1.38% 6OtherFruits5.48%2.79%3.91%3.73%3.69%3.60%4.03%3.59%3.75%3.65%4.76%5.52%4.12%4.71% TotalFruits5.98%2.84%2.50%4.96%1.79%2.97%2.03%6.97%2.72%4.01%3.12%5.54%5.71%2.43% BVegetables 1Cabbage5.86%1.52%2.60%1.85%6.88%3.16%2.78%2.28%5.07%14.61%3.03%2.50%7.36%1.28% 2Potato2.55%0.66%1.30%1.51%4.87%5.55%3.28%6.23%2.27%6.69%6.33%12.72%4.72%1.09% 3Tomato5.82%1.50%1.56%2.55%7.17%2.24%3.16%3.82%4.76%5.31%4.21%3.95%8.38%4.88% 4Cauliflower3.49%1.16%5.04%2.24%6.69%3.70%2.21%6.37%3.65%7.22%2.92%2.86%9.16%1.83% 5Brinjal4.86%1.75%2.53%7.20%5.37%4.32%4.73%3.79%3.13%3.97%3.78%6.18%5.39%3.15% 6Radish4.33%1.01%1.59%2.14%44.23%2.14%1.89%4.64%2.64%2.55%2.72%1.34%4.54%0.98% 7Okra5.96%1.96%2.10%2.90%7.83%3.41%3.05%6.28%1.99%5.49%5.13%3.27%8.10%2.39% 8Ginger1.35%1.01%0.79%2.71%0.79%2.08%0.98%2.64%1.07%3.13%2.47%5.77%4.56%1.81% 9Turmeric5.20%1.08%1.41%2.12%2.50%4.40%1.47%6.44%3.00%8.45%3.29%7.89%11.59%1.78% 10OtherVeg.1.40%3.53%3.45%3.64%2.34%3.24%3.78%3.86%2.06%5.38%4.95%8.87%5.87%1.93% TotalVeg.2.91%2.40%2.88%3.04%5.37%3.37%3.36%4.20%2.80%6.58%4.55%7.22%6.31%2.00% Sl. No. Crops/ Districts Assam(2009-10) BaksaChirangKamrup (M) UdalguriJorhatGolaghatSivasa- gar Lakhim- pur DhemajiDibru- garh TinsukiaK. Anglong N.C.HillsTotal Prod. (MT) AFruits 1Banana4.08%1.16%1.07%1.15%5.32%6.59%3.24%3.56%3.24%1.14%4.09%4.39%1.84%621,747 2Pineapple1.46%3.22%1.69%4.42%0.78%1.28%1.17%2.57%1.06%0.51%2.19%14.18%13.77%210,241 3Jackfruit2.54%2.68%4.65%0.45%4.14%1.32%3.23%3.93%2.31%2.25%3.22%3.51%2.42%178,076 4Citrus2.67%3.45%6.74%4.35%2.69%2.87%1.09%2.17%1.31%2.26%9.21%6.73%19.65%215,365 5Papaya3.83%2.29%0.57%4.71%3.79%3.15%1.80%2.64%0.81%1.10%2.15%6.68%25.19%122,445 6OtherFruits1.95%2.42%3.61%3.17%3.56%4.32%3.86%3.08%4.31%2.67%3.14%2.98%3.60%194,240 TotalFruits3.06%2.18%2.64%2.50%3.85%4.18%2.62%3.14%2.51%1.53%4.17%5.96%8.10%154,2114 BVegetables 1Cabbage3.50%2.95%2.33%2.49%3.56%4.35%3.09%4.17%2.48%2.76%4.47%1.18%1.90%605,515 2Potato4.67%3.02%0.57%8.41%1.26%3.58%0.96%4.66%4.16%0.87%1.38%1.53%5.17%600,153 3Tomato3.67%4.32%5.56%4.05%3.23%3.85%4.60%1.52%3.39%1.26%1.52%2.17%1.52%375,417 4Cauliflower2.15%2.99%7.72%2.86%2.86%6.18%1.97%3.26%2.65%2.61%3.10%1.37%1.74%347,678 5Brinjal3.59%3.64%3.30%2.45%2.63%3.94%1.23%5.81%2.20%3.35%4.29%2.22%1.19%219,787 6Radish2.25%3.85%2.64%1.74%1.11%1.31%1.78%2.28%0.84%1.46%1.94%1.54%0.53%167,551 7Okra4.43%6.73%4.46%4.29%1.75%2.76%2.47%2.89%1.54%1.92%3.16%2.42%1.30%137,139 8Ginger3.51%1.37%0.56%5.65%1.20%7.29%1.03%2.98%3.06%0.08%5.66%16.17%20.26%107,893 9Turmeric5.60%2.09%1.03%3.81%2.44%6.92%2.02%5.77%0.00%0.61%1.45%6.02%1.63%97,19 10OtherVeg2.95%4.18%2.89%4.01%3.42%2.94%3.28%4.78%2.39%4.57%4.07%2.71%3.54%252,3318 TotalVeg.3.24%3.80%3.10%4.17%2.94%3.57%2.80%4.25%2.65%3.23%3.50%2.42%3.32%503,7720
  • 138.
    128 Value ChainAnalysis of Select Crops in North Eastern States Sl. No. Crops/ Districts Manipur(2010-11) Imphal(E)Imphal(W)BishunupurThoubalTameng- long SenapatiUkhrulChandelC.CpurTotalProd. (MT) AFruits 1Pineapple8.59%4.16%12.23%19.60%6.66%25.24%1.55%6.08%15.89%110,598 2Banana11.59%11.54%11.11%9.32%15.31%8.78%7.07%11.37%13.91%76,422 3Lime/Lemon3.60%3.91%4.37%6.04%5.89%9.63%32.82%10.24%23.50%29,405 4Orange0.00%0.00%0.00%0.00%62.42%2.85%6.54%3.50%24.69%25,990 5PassionFruit1.28%1.24%1.88%1.02%7.73%36.65%20.13%5.79%24.28%72,581 6OtherFruits6.34%5.00%13.99%13.16%13.48%9.92%10.80%13.84%13.46%56,605 TotalFruits6.44%4.92%8.77%10.43%13.53%18.95%10.55%8.44%17.97%371,601 BVegetables 1Cauliflower20.85%18.00%20.29%22.67%2.18%4.46%2.30%3.54%5.72%22,935 2Cabbage17.19%14.93%17.73%17.06%3.65%12.52%8.59%4.34%3.99%57,624 3Tomato21.43%12.62%23.42%18.49%3.24%4.66%3.84%4.61%7.69%20,156 4Peas17.83%16.79%16.17%15.85%4.34%7.51%9.53%5.08%6.91%45,502 5OtherVeg.15.21%14.38%10.30%18.04%8.11%7.36%9.39%8.63%8.58%46,738 TotalVeg.17.74%15.36%16.46%17.83%4.68%8.31%7.76%5.48%6.38%192,955 CSpices 1Chillies17.76%13.32%10.15%15.35%7.61%11.71%3.45%5.12%15.53%61,661 2Ginger9.24%7.53%8.47%6.32%6.50%6.29%4.54%8.47%42.65%25,443 3Turmeric10.87%11.55%9.54%9.20%5.75%12.94%10.54%7.12%22.47%16,323 4Others Spices 11.62%13.38%12.94%13.51%11.31%6.43%9.07%11.00%10.72%3,871 TotalSpices14.47%11.68%9.76%12.21%7.20%10.42%4.99%6.43%22.84%107,298 GrandTotal10.97%9.00%11.14%12.84%9.97%14.53%8.86%7.27%15.42%671,854
  • 139.
    129 Sl. No. Crops/ Districts Meghalaya(2009-10) Ri-BhoiEastKhasiHillsWestKhasi Hills JaintiaHillsEastGaroHillsWestGaro Hills SouthGaro Hills TotalProd. (MT) AFruits 1Pineapple38.89%6.01%3.96%0.54%19.93%23.48%7.17%103,432 2Banana18.74%10.14%5.25%2.28%29.95%28.98%4.66%78,822 3Citrus4.39%51.65%12.67%13.63%6.48%9.70%1.46%39,070 4Papaya25.26%14.07%4.07%0.90%28.08%25.66%1.96%4,541 TotalFruits25.62%15.51%5.92%3.42%21.26%23.06%5.21%225,865 BVegetables 1Potato0.10%68.07%27.88%0.56%0.62%2.50%0.27%162,445 2Cabbage0.44%76.77%2.92%3.00%10.24%5.38%1.25%36,022 3Cauliflower0.46%54.02%1.67%35.27%2.68%4.64%1.26%35,271 4Tomato5.77%24.77%1.38%49.39%4.84%10.24%3.61%27,522 5Pumpkin1.12%7.92%14.59%3.58%41.16%11.75%19.88%12,191 6Brinjal1.31%5.97%1.18%2.10%50.55%30.99%7.91%11,641 7Peas6.15%24.58%4.94%10.38%18.62%31.90%3.43%4,780 8Onion17.71%12.93%7.24%1.17%18.16%31.35%11.44%3,078 9OtherVeg.6.24%22.49%10.92%8.08%21.99%21.45%8.84%106,307 TotalVeg.4.28%37.60%4.23%16.35%16.16%14.87%6.52%399,257 CSpices 1Ginger14.16%6.64%3.67%5.49%40.78%27.08%2.19%54,009 2TurmericGreen3.97%4.97%2.87%59.46%5.66%19.44%3.62%9,895 3ChilliesGreen10.47%15.35%3.30%2.80%14.42%42.04%11.62%1,394 4BlackPepper18.87%22.78%14.75%3.47%3.47%32.10%4.56%461 TotalSpices12.58%6.69%3.62%13.54%34.67%26.28%2.62%65,759 Annexure 1
  • 140.
    130 Value ChainAnalysis of Select Crops in North Eastern States Sl. No. Crops/ Districts Mizoram(2010-11) AizawlLungleiSaihaChamphaiMamitKolasibSerchhipLawngtaiTotalProd. (MT) AFruits 1Mandarin17.44%9.85%6.30%13.35%15.56%16.20%18.27%3.04%19,701 2Banana24.85%9.62%4.97%6.76%6.01%6.18%37.31%4.28%118,600 3Lime/Lemon13.32%11.96%9.32%9.75%14.91%13.62%14.83%12.30%24,150 4Pineapple12.55%11.17%9.95%10.55%9.71%19.09%17.95%9.04%13,590 5Grape8.02%5.79%4.74%55.09%4.10%5.04%11.53%5.69%20,400 6PassionFruit18.82%6.53%1.03%61.88%1.12%5.94%2.31%2.37%5,910 7Papaya21.30%2.85%1.75%7.86%57.73%3.16%2.75%2.60%6,750 8Mango19.75%10.70%9.05%13.61%15.02%11.23%12.56%8.07%2,850 9OtherFruits19.88%12.20%8.56%14.79%12.69%11.97%12.77%7.14%6,219 TotalFruits20.08%9.43%5.81%14.29%9.69%8.74%26.45%5.51%218,170 BVegetables 1Brinjal25.33%8.63%3.42%19.45%1.23%13.67%21.93%6.35%12,108 2BitterGourd16.94%13.11%12.77%12.83%3.07%15.18%16.51%9.59%16,889 3Cabbage30.25%8.42%3.82%7.04%9.57%9.57%27.30%4.04%33,569 4Chayote36.70%12.07%4.95%7.71%8.23%7.38%15.64%7.32%56,849 5Bean34.58%11.50%6.91%6.03%11.57%7.38%16.73%5.29%4,956 6Okra19.91%8.86%9.60%9.95%12.91%13.43%19.16%6.18%18,710 7Cucumber21.08%7.76%6.76%7.62%1.78%14.01%32.95%8.03%3,651 8Tomato54.90%13.60%2.08%4.72%9.92%9.92%3.85%1.00%6,180 9Pea32.07%15.60%6.78%7.76%1.55%9.11%20.43%6.70%1,933 10OtherVeg.26.97%13.09%8.41%16.97%5.81%12.78%10.90%5.06%14,064 TotalVeg.30.17%10.92%6.21%9.79%7.74%10.42%18.52%6.23%168,909 CSpices 1BlackPepper33.98%0.00%0.00%0.00%0.00%66.02%0.00%0.00%88 2Ginger16.33%5.07%6.63%15.55%14.92%16.02%17.27%8.20%31,950 3Turmeric5.36%5.77%11.20%11.61%31.22%12.45%15.37%7.02%23,970 4BirdEyeChilli12.13%15.52%9.77%14.37%13.22%11.72%11.67%11.61%47,850 TotalSpices11.88%10.04%9.12%14.08%17.89%13.26%14.24%9.49%103,858
  • 141.
    131 Sl. No. Crops/ Districts Nagaland(2008-09) KohimaWokhaMokokc- hung Zunhe- boto Tuenn- sang PhekMonDimapurKiphereLonglengPerenTotal Prod.(MT) AFruits 1Banana10.00%11.67%10.83%8.33%8.33%8.33%8.33%8.33%8.33%8.33%9.17%60,000 2Pineapple10.43%10.43%10.43%5.22%5.22%6.09%5.22%20.87%5.22%3.48%17.39%57,500 3Citrus13.66%17.69%23.83%3.23%6.55%6.46%3.23%5.05%9.80%3.23%7.27%30,970 4PassionFruit15.87%15.87%12.70%9.52%9.52%9.52%6.35%0.00%6.35%6.35%7.94%6,300 5Papaya13.79%13.79%13.79%5.17%6.90%5.17%6.90%6.90%6.90%6.90%13.79%5,800 6Guava10.20%10.20%10.20%8.16%6.80%6.80%12.59%6.46%8.16%6.80%13.61%1,470 7OtherFruits12.76%11.57%13.85%6.53%8.51%6.82%5.93%9.00%8.51%7.02%9.50%5,055 TotalFruits11.27%12.58%13.36%6.19%6.92%7.09%6.16%11.68%7.41%5.54%11.81%167,095 BMAPs9.09%9.09%9.09%0.00%9.09%0.00%10.91%21.82%9.09%0.00%21.82%550 CVegetables 1Ginger10.00%10.00%10.00%10.00%10.00%6.67%10.00%3.33%6.67%6.67%16.67%30,000 2Chillies13.04%13.04%8.70%8.70%8.70%8.70%8.70%4.35%8.70%8.70%8.70%23,000 3Colocasia15.00%15.00%7.50%7.50%10.00%12.50%12.50%5.00%5.00%5.00%5.00%20,000 4Cabbage8.55%8.55%8.55%4.27%4.27%42.74%4.27%8.55%4.27%4.27%1.71%11,700 5Chowchow12.05%12.05%12.05%8.43%8.43%15.66%10.84%0.00%7.23%7.23%6.02%8,300 6Bean8.86%8.86%8.86%5.70%35.44%5.70%4.43%8.86%4.43%4.43%4.43%7,900 7Tapioca11.67%11.67%16.67%10.00%10.00%10.00%6.67%6.67%6.67%6.67%3.33%6,000 8LeafyVeg.10.00%10.00%10.00%10.00%10.00%10.00%10.00%10.00%5.00%5.00%10.00%5,000 9Tomato18.75%7.50%7.50%7.50%10.00%7.50%5.00%6.25%7.50%10.00%12.50%4,000 10OtherVeg.12.07%12.03%10.89%7.03%6.70%7.40%6.99%11.99%6.22%6.34%12.35%12,305 TotalVeg.11.81%11.45%9.63%8.12%10.39%12.14%8.74%5.71%6.37%6.46%9.18%128,205 Annexure 1
  • 142.
    132 Value ChainAnalysis of Select Crops in North Eastern States Sl. No. Crops/ Districts Sikkim(2006-07) NorthEastSouthWestTotalProd.(MT) AFruits 1Orange0.81%46.18%18.87%34.14%9,300 2PassionFruit7.11%44.66%22.92%25.30%2,53 3OtherFruits2.71%37.56%24.40%35.33%3,946 TotalFruits1.48%43.63%20.56%34.32%13,499 BVegetables 1KharifVeg.10.51%32.52%31.93%25.04%14,199 2RabiVeg.5.99%32.52%34.91%26.58%17,101 3OffseasonVeg.9.41%30.16%32.39%28.05%12,900 TotalVeg.8.44%31.83%33.22%26.52%44,200 CTotalRootTuberCrops6.70%27.97%26.62%38.70%36,598 DSpices 1L.Cardamom31.93%30.61%19.89%17.57%3,182 2Ginger1.82%34.08%36.54%27.57%36,001 3Turmeric4.55%25.64%47.03%22.77%2,020 TotalSpices4.28%33.40%35.76%26.56%41,203 Sl. No. Crops/ Districts Tripura(2009-10) SouthWestDhalaiNorthTotalProd.(MT) AFruits 1Jackfruit30.01%28.37%22.10%19.52%251,569.00 2Pineapple23.41%24.47%18.11%34.00%117,531.00 3Banana18.59%53.83%13.37%14.21%105,615.00 4Orange7.76%0.19%11.13%80.91%22,230.00 5Papaya27.19%24.73%22.17%25.91%18,455.00 6Litchi38.52%20.72%16.59%24.17%16,972.00 7Mango51.07%25.98%7.68%15.28%13,170.00 8Lime/Lemon26.23%39.48%23.32%10.98%11,716.00 9OtherFruits22.77%35.06%13.10%29.07%16,567.00 TotalFruits26.05%31.19%18.53%24.23%573,825.00 BVegetables 1Potato45.12%26.63%10.69%17.56%99,416.00 2Tomato32.55%43.04%9.47%14.94%29,550.00 3Brinjal22.53%63.18%6.01%8.27%22,651.00 4Radish22.02%55.81%3.73%18.44%19,068.00 5Colacasia24.01%30.82%4.87%40.30%18,426.00 6OtherVegetables24.10%49.86%10.82%15.22%133,886.70 TotalVegetables25.91%49.54%8.63%15.92%347,527.70 CSpices 1Ginger61.01%11.30%12.42%15.28%7,932.00 2Turmeric40.49%28.80%6.82%23.89%5,965.00 3Chilly52.86%30.47%7.10%9.57%3,042.00 4BlackPepper16.04%41.51%2.83%39.62%106.00 5TotalSpices52.45%21.18%8.83%17.54%16,929.40
  • 143.
    133 Annexure 2 Agriculture Marketingand Post-Harvest Infrastructure Arunachal Pradesh Scenario of Agricultural Marketing in Arunachal Pradesh The Government of Arunachal Pradesh has enacted the Arunachal Pradesh Marketing (Regulation) Act, 1989 to provide for a legal mechanism to establish and regulate markets in Arunachal Pradesh with a view to remove the handicaps from which a farmer was suffering. This will be done by ensuring fair and remunerative prices of their produce by rationalising/ standardising various activities and practices in the markets through legislation. In accordance with the provision of the said Act, 14 agricultural produce marketing committees have been established to facilitate and regulate transaction of agricultural and allied produces. So far 14 Agricultural Produce Marketing Committees are functioning in the state. The Arunachal Pradesh Agriculture Marketing Board is to oversee the functioning of Agricultural Produce Marketing Committees and to provide necessary assistance in establishment of infrastructural facilities such as market sheds, storage, godowns out of the grants released by the state government. The efforts of the state government and Agricultural Produce Marketing Board (APAMB) have been supplemented to some extent by the Directorate of Marketing and Inspection, Government of India, under Mini Mission III of the Technology Mission for Development of Horticulture in the North East and Macro Management Programme. The facilities created under various financial supports at different locations are given in Table A, B and C. In order to promote better marketing access to the enterprising farmers, Arunachal Pradesh Agriculture Marketing (Regulation) Act, 1989 was amended during 2006, by incorporating contract farming and establishment of private market yards to facilitate private investment in agricultural marketing. This amendment will encourage the entrepreneurs in establishment of private market and facilitate the farmers to sell their products to the purchasers, which will considerably enhance the farmers’ income. Table ‘A’: Statement Showing the Marketing Infrastructure Created in the Different APMCs under Marketing Board Against Grant-in-Aid Sl. No. Name of APMC Infrastructure Created Location 1 Khonsa Fish Market (12 seated Platform) Khonsa Meat Market (6 seated Platform Two Shoes Market One store for fish traders Slaughter House One Market shed Rangluas Extension of Market Khonsa Market shed with CGI roofing Deomali OBT shed for Fish Market Deomali MIBT double unit cloth shed Deomali Repairing/Renovation of Market shed Longding MIBT single unit Market shed (3 ) Longding Open platform CC flooring Longding 5 room transit camp at Tinsukia Tinsukia SPT type Market shed (2) Khonsa Construction of Cattle Market shed Kanubari Annexure 2
  • 144.
    134 Value ChainAnalysis of Select Crops in North Eastern States Sl. No. Name of APMC Infrastructure Created Location 2 Miao Godown Miao Auction Platform Miao Shop Miao/Kharsang Cont. of check gate Bordumsa Cont. of check gate Diyun 3 Tezu Establishment of one closed Market yard Tezu One Small SPT store (10 MT capacity) Tezu Guest House (2 rooms) Tezu Cont. Check post and rest camp Tezu 4 Roing Two hectares of land allotted to APMC, Roing for market yard (security fencing with barbed wire) Jia Two unit barrack type Quarter Jia Two Market sheds Jia One Market Godown Jia One weekly Market shed Jia 5 Pasighat 3 Unit Bachelor Barrack Pasighat 16 Unit Fish Market shed Pasighat Open Market shed Nari 12 Unit Vegetable Market shed Pasighat Cont. of Godown Jampani 6 Along Cont. of Primary Market shed Mechuka 7 Ziro One Market shed Yechuli One Market shed Koloriang Improvement of Gandhi Market Hapoli 8 Papum Pare Market Godwon (Cap. 125 MT) Balijan Market yard at Gohpur Tinali and Chandan Nagar Gohpur and Chandan Nagar One Truck for transportation of Agri/Horti.Produces Yupia Construction of Boundary Kimin Renovation of SGL Naharlagun Cont.of Market shed Lower Subansiri Cont. of Office-cum-sale counter Tarasso Cont. of Market shed Nirjuli 9 Bombdila One sale counter (RCC) Bombdila 0.7 Room SPT type Market shed Rupa 9 Room RCC Market shed Bombdila Garage with Timber/CGI Sheet roofing Bombdila Installation of 63 KVA power station of cold storage Tippi 10 Tawang Daily Market shed Near Bus Stand Repairing of Potato Godown Lemberdung Construction of Potato Godown Seru 11 Seppa Cont. Market shed Sejiosa 12 Daporijo Cont. of Market sheds Daporijo, Siyung, Taliha Radding 13 Yingkiong Cont. of Market sheds Yingkiong
  • 145.
    135 Sl. No. ParticularsQuantity District/Location 1 Establishment of Primary Market 3 1. Singchung, West Kameng District 2. Neri, East Siang Distict 3. Aalo, West Siang District 2 Establishment of Primary Marketa. 6 1. Raga, L/Subansiri Distict 2. Ziro, L/Subansiri District 3. Longding, Tirap District. 4. Mirmir, East Siang District 5. Ganga Market, Papumpare District 6. Nari/Pam, East Siang District. Establishment of Secondary Marketb. 6 1. Tenga, West Kameng District Tata Truck – 709c. 6 1. Roing, L/Dibang valley District. 3 Establishment of Primary Marketa. 3 1. Yazali, L/Subansiri District 2. Hija, L/Subansiri District. 3. Nyapin, Kurung Kumey District Rice Houllerb. 15 4. Pasighat, East Siang District - 6 5. Aalo, West Siang District - 4 6. Papumre District - 2. 7. Kurung Kumey District - 1 8. Lohit District - 2. Tata Truck – 709c. 2 1. Aalo, West Siang District - 1. 2. Kurung Kumey District - 1 4 Mustard Oil Milla. 4 1. East Siang District - 1 2. Lohit District -1 3. L/Dibang valley District - 1 4. Changlang District - 1 Spices grading unitb. 3 1. Changlang District - 1 2. West Siang District - 1 3. West Kameng District - 1 Cattle food production unitc. 1 1. Papumpare District - 1. Rice Milld. 10 1. East Siang District - 3 2. West Siang District - 3 3. East Kameng District - 1 4. Tirap District - 1 5. Upper Siang District - 2 Gur Making Machinee. 2 Nos 1. Tirap District - 1 2. Upper Subansiri District - 1. Tata Truck-709f. 1 1. Lower Subansiri District -1 Construction of Transit Godowng. 1 1. Tirap Distict -1 5 Establishement of Primary Marketa. 2 Bordumsa, Changlang District -1 Dolungmukh,L/Subansiri District - 1 Mini Rice Millb. 10 1. East Siang District -2 2. West Siang District - 2 3. Lower District -2 4. Changlang District - 2. 5. Ziro, L/Subansiri District - 2 Table ‘B’: Statement Showing the Infrastructure Creation Under Macro Management Scheme at different Location/District Annexure 2
  • 146.
    136 Value ChainAnalysis of Select Crops in North Eastern States Table ‘C’: Statement Showing the Marketing Infrastructure Created in the Different APMCs under Technology Mission of Mini Mission - III Wholesale Markets - 6 Rural Primary Markets - 24 State Grading Laboratories - 2 Sl. No. Name of APMC Infrastructure Created Location 1 Khonsa One Rural Primary Market Kanubari 2 Miao One Rural Primary Market Miao 3 Tezu One Wholesale Market Tezu 5 nos. Rural Primary Market Tezu/Chowkham/Hayuliang/ Lathao/and Piyong 4 Roing One whole sale Market Roing 2. One Rural Primary Market Roing 5 Pasighat One Wholesale Market Pasighat 5 nos. Rural Primary Market Koyu/Bolong/Nari/Koreng/Mebo State Grading Laboratory Pasighat 6 Along One Rural Primary Market Likabali 7 Ziro One Wholesale Market Hapoli Two Rural Primary Market Hapoli/Boushimla 8 Papum Pare One Wholesale Market at Gohpur Tinali Itanagar 3 Rural Primary Market Chandan Nagar/Sagalee/Kimin State Grading Laboratory Naharlagun 9 Bomdila One Wholesale Market Tenga 5 Rural Primary Market Lui Kalaktang/Dirang/Kaspi/ Thrizino Bhalukpogn Till 2010-11, Arunachal Pradesh Agriculture Marketing Board (APAMB) under Dept. of Agriculture was responsible for establishment of infrastructure and promotion of marketing activities. For the purpose, 3 cold storages in the region (West Kameng, Passighat and Lohit) are established but have remained unoperational/unutilised till date, 6 regulated markets (West Kameng, Papum Pare, Ziro, Passighat, Roing, Khonsa) are established by the Arunachal Pradesh Agriculture Marketing Board but due to lack of proper infrastructure facilities in the markets such as sheds, storages, boundary walls, weigh bridges, auction platforms etc. traders and farmers are not interested to operate and utilise the same. Horticulture perspectives and future Policy From the point of view of horticulture produce (perishables), the infrastructural facilities created so far are inadequate and traders farmers are not keen on utilising the markets because of lack of basic infrastructure such as auction sheds, cold storages, boundary walls, weigh bridges, auction platforms, electricity, water, rest rooms and also due to location disadvantages. Therefore, there is a need for creation of market infrastructure facilities within the reasonable limit enabling traders and farmers to utilise the same. The following infrastructural facilities are to be created: Adequate marketing infrastructure at village/circle/district and state level such as™™ rural primary market, storage godowns, grading, sorting and packing facilities. Transport facilities to be strengthened.™™
  • 147.
    137 APMCs are tobe equipped with modern amenities.™™ Appropriate linkage between producers and sellers.™™ Wholesale and terminal market.™™ Pre-cooling and cold storage facilities.™™ Availability of manpower with proper market orientation.™™ Credit support.™™ Market intelligence.™™ Processing and value addition.™™ Rural road connectivity.™™ Conclusion In spite of all the efforts taken by the Dept. of Agriculture, Government of Arunachal Pradesh, the desired result could not be achieved with regard to agricultural marketing. This may be possibly due to dependence of marketing activities with the existing paraphernalia of the department as well as inadequate fund position. In order to boost marketing of horticulture produce in the state, a separate Horticulture Marketing Board was established in 2011, under the Directorate of Horticulture which is solely responsible for horticulture produce marketing activities for speedy development and regulation but due to lack of funds, it is yet to take up these activities. Therefore, in view of the vast potential and resources in horticulture sector including aromatic and medicinal plants in the state, there is an urgent need for adequate infrastructural support as per suitability to streamline the Horticulture Marketing in the state to attract private investors and sponsor for contract farming. Assam Post-harvest and marketing infrastructure status in Assam Market yards are a long felt need of the farming community of Assam as they go a long way in ensuring optimum if not higher remuneration to them through proper weighing, cleaning, grading and better price realisation of their produce. The farmers look forward to a regulated market yard as a dependable infrastructure for furtherance of their economic goal. The advantages of a regulated market yard system are immense and wherever such a system exists, it has been widely appreciated. Today, the farmers consider it a boon to be in a place where they can confidently sell their produce and get an appropriate return for the quantity and quality they produce year after year. The state has 20 Regulated Market Committees, 20 Primary Market Yards and 206 Secondary Market Yards. Markets established under Technology Mission Uparhali Market™™ under Guwahati Sub-Divisional Market Committee in Kamrup district. Gauripur Market™™ under Gauripur Regulated Market Committee in Dhubri district. Mandia Market™™ under Baharihat Regulated Market Committee in Barpeta district. Annexure 2
  • 148.
    138 Value ChainAnalysis of Select Crops in North Eastern States Hojai Market™™ under Lanka Regulated Market Committee in Nagaon district. Dhubri Market™™ under Gauripur Regulated Market Committee in Dhubri district. Markets established under NEC Scheme of 10th Five Year Plan Singimari market™™ under Guwahati Sub-Divisional Market Committee in Kamrup district. Darrangiri market™™ under Goalpara District Regulated Market Committee in Goalpara district. Sapekhati market™™ under Sibsagar District Regulated Market Committee in Sibsagar district. Gamariguri market™™ under Golaghat District Regulated Market Committee in Golaghat district. Nagabat market™™ under Jorhat District Regulated Market Committee in Jorhat district. Details of Infrastructure under the Regulated Market Committees RMC No. of Auction Plat- form/ Retailer Shed No. of Godown No. of Selling Com- plex/ Trader's Shop No. of Cattle Market Shed No. of Drying Platform No. of Health Care Unit No. of Guest House/ Krishak Bhawan No. of Cold Storage Others (Bank/ Canteen Bldg. etc.) Baharihat RMC 4 2 2 Bongaigaon DRMC 6 1 Cachar DRMC 8 6 1 Darrang DRMC 36 3 2 1 1 Dhemaji DRMC 6 2 1 2 1 Dhing RMC 33 5 1 Dhubri DRMC 35 13 2 4 1 1 1 Dibrugarh DRMC 13 1 1 Goalpara DRMC 19 2 Golaghat RMC 35 3 3 3 4 GSMC 51 6 3 3 6 1 2 1 Hailakandi DRMC 6 1 Howly RMC 14 2 1 Jorhat DRMC 60 4 2 4 2 1 Karimganj DRMC 2 1 1 Kokrajhar DRMC 21 1 1 Lanka RMC 13 1 3 1 1 Morigaon DRMC 15 2 N/Lakhimpur RMC 16 1 Nalbari DRMC 11 1 3 2 1 3 Rangia SDRMC 5 1 Sivasagar DRMC 16 1 1 Sonitpur DRMC 9 1 1 Tinsukia DRMC 11 2 Total 445 48 12 22 33 6 10 3 2 Source: http://asamb.in/html/?u=infra
  • 149.
    139 Guwahati Sub-Divisional MarketCommittee (Kamrup) This is the one of the oldest market committees in the state and has total 8 market yards. In the following tables important features of each market have been discussed: Sl. No. Name of the Market Yards Features 1 Bijoynagar Market Daily primary market, total arrival of green vegetables about 1000 Tons™™ per annum and 70% of this is sent to Guwahati, not qualified market related infrastructure. 2 Boko Market Weekly market but not a FV market™™ 3 Chhayagaon Market Biweekly market but not a FV market™™ 4 Fancy Bazar One of the oldest market in the heart of the city for fruits, vegetable™™ and spices 5 Hahim Market Biweekly market™™ 6 Machkhowa market Machkhowa daily vegetable wholesale mandi was established in 1989™™ and located at 9 kms. From NH-37 in Guwahati. It is one of the largest vegetable markets in Assam, spread over two bigha area. Almost all the vegetables are traded in this market. Produces arrives from the markets as near as Singimari (16 kms) and as far as from Karbi Anglang (350 kms). There are 25 traders, 85 commission agents (commodity wise), 145 Faria and 60 hamal (Coolie) involved in this wholesale mandi. Produce is sent to Greater Guwahati and Shillong from Machkhowa mandi. Activities such as cleaning, filling, weighing, grading and standardisation™™ is done manually in the market. Though Machkhowa is major vegetable mandi in Guwahati but it is lacking in basic facilities and post-harvest infrastructure. This mandi does not even have the facility of a board to display market price. It is lacking in post-harvest facilities such as sorting grading, washing, packaging and cold storage. It also does not have office building, auction platform, drying platform, godown, drinking water, sanitation and parking. Garbage disposal is very poor and the place is very much congested. Internal road in the market is very narrow. Due to lack of above facilities, condition of Machkhowa market is™™ very poor and traders have to sell their produce on a daily basis. By providing post-harvest infrastructure wastage can be checked to a major extent. Sorting, grading facilities, cold store and godowns should be availed to improve the market condition and for business of quality product. 7 Nagabera Market Weekly market but not a vegetable market™™ 8 Singimari Market Daily market and annual arrival of vegetables is about 700 tons and act™™ as a feeder market for Machkhowa market. Annexure 2
  • 150.
    140 Value ChainAnalysis of Select Crops in North Eastern States Manipur Post-harvest and marketing infrastructure status in Manipur Proposed/upcoming processing projects in Manipur Sl. No. Proposed Project Production Capacity 1 Fruits vegetables processing 80 MT/Day 2 Ginger dehydration and oleoresin 33 MT/Day 3 Spices processing plant 5 MT/Day 4 Integrated mushroom processing plant 15 MT/Day 5 Lime Ginger (RTS) Plant 100 lakh bottles of 200 ml per annum 6 Agri export zone for passion fruit 2 MT/Hour 7 Manipuri traditional liquor plant (distillery) 9 lakh lt./annum 8 Integrated pineapple concentration plant 50 MT/day Sl. No. Processing Unit Sector Type Capacity MT/Annum Type of Products 1 MAGFRUIT Hort. Soil Conservation, Govt. of Manipur SSI Unit 240 Canned fruits and vegetables, fruit syrups, pickles, jam jellies, RTS (Lime- ginger) cordials, squashes, candies, etc. 2 HEIRANG Co-operative SSI Unit 240 Canned fruits and vegetables, fruit syrups, pickles, jam jellies, RTS (Lime- ginger) cordials, squashes, candies, etc. 3 WAIFRU N.G.O. SSI Unit 240 Canned fruits and vegetables, fruit syrups, pickles, jam jellies, RTS (Lime- ginger) cordials, squashes, candies, etc. 4 RATNA FRUITS PRIVATE Cottage Scale 50 Squashes, jam 5 LIKLA PRIVATE Cottage Scale 50 Squashes, RTS, jam, jelly (Fruit based) 6 SANA PRIVATE Cottage Scale 50 Squashes, pickle, jelly, jam 7 MANIFRU PRIVATE Cottage Scale 50 Squashes, pickle, jelly, jam 8 HILL FRUITS PRIVATE Cottage Scale 50 Squashes, jam, etc.
  • 151.
    141 Sl. No. Name of ProcessingUnit with Address Crops Processed Production Capacity Remarks 1 Fruit Preservation Centre, Fruit Garden, Shillong Orange, Pineapple, Lemon, Sohiong, Carambola, Plum, Guava, Litchi, Chilli, Passion fruit and some indigenous fruits of the state. 60 MT Public sector 2 Fruit Preservation Centre, Dainadubi, East Garo Hills. Orange, Pineapple, Lemon, Litchi, Carambola, Mango, Passion fruit, Amla, Chilli, 40 MT -Do- 3 M/s Mansan Fruit Products, Umiam,Ri-Bhoi District Orange, Pineapple, Lemon, Sohiong, Carambola, Plum, Strawberry, Passion Fruit and some indigenous fruits of the state. 400 MT Private sector 4 M/s Megha Cashew, Byrnihat, Ri-Bhoi District Cashewnuts 1200 MT -Do- 5 M/s Kara Fruit Processing, Pokseh, Shillong Orange, Pineapple, Lemon, Sohiong, Carambola, Plum, Guava, Litchi, chilli, passion fruit and some indigenous fruits 10-15 MT -Do- 6 Wahkdait Pashun Ropeway transport fruit, vegetable and livestock Co-operative Society, Wahkdait, Pynursla Block, East Khasi hills Orange, Pineapple, Lemon, Sohiong, Carambola, Plum, Guava, Litchi, Chilli, Passion fruit and some indigenous fruits 60-80 MT -Do- 7 NERAMAC Ginger Processing Unit, Byrnihat, Ri-Bhoi District Ginger 5 MT/Day (Seasonal) Public sector 8 M/s K.D. Agro Chibinang, West Garo hills Pineapple, tomato etc. 7 MT/Day (Seasonal) Private sector 9 M/s B.R. Industries Phulbari, West Garo Hills Cashewnuts 380 MT/Year -Do- 10 Meghalaya Ginning Mill Phulbari, West Garo Hills -do- 145 MT/Year -Do- 11 M/s O. Sangma Sansanggiri, West Garo Hills -do- 175 MT/Year -Do- 12 M/s Aminul Islam Phulbari, West Garo Hills -do- 110 MT/Year -Do- 13 M/s Binay Ghosh Phulbari, West Garo Hills -do- 165 MT/Year -Do- 14 M/s Pradip Saha Phulbari, West Garo Hills -do- 195 MT/Year -Do- 15 M/s Uttam Kothari Monabari, West Garo Hills -do- 196 MT/Year -Do- 16 M/s Kazi Zaman Bhaitbari, West Garo Hills -do- 170 MT/Year -Do- 17 M/s Khalil Miya Bhaitbari, West Garo Hills -do- 355 MT/Year -Do- 18 M/s Hunbit Spices Shangpung, Jaintia Hills Turmeric, Black pepper and other spices 150 MT/Year -Do- 19 M/s Dkhiah Processing unit Khliehriat, Jaintia Hills -do- 50-80 MT/Year -Do- 20 M/s Three Leaves Consumer Products Pvt. Ltd. Baridua, Ri-Bhoi District -do- 0.15 MT/Day -Do- Meghalaya Post-harvest and marketing infrastructure status in Meghalaya Existing horticulture processing units in Meghalaya Annexure 2
  • 152.
    142 Value ChainAnalysis of Select Crops in North Eastern States Marketing Infrastructure in Meghalaya Regulated Markets:1. Two regulated markets in Meghalaya viz. Mawoing Regulated Market in East Khasi Hills and Garobadha Regulated Market in West Garo Hills. Only potatoes and ginger are notified in fruits and vegetables for trading. One cold storage in each market has been established but remained unoperational till date. Both markets lack basic marketing infrastructure such as auction platforms, weigh bridges, covered sheds, electricity, water, toilets, sorting grading machines, poor roads. Infrastructural Development Mawiong Wholesale Regulated Market 1000 MT capacity godowns - 21. Auction platform – 12. Grading assorting shed - 13. Farmers’ rest house - 14. Traders’ store - 515. Office building of the Market Committee - No6. Internal roads7. Compound Fencing8. Drainage facility9. Electricity10. Water supply sanitary arrangement11. Garobadha Wholesale Regulated Market 1000 MT capacity godowns – 21. Auction platform - 12. Grading sorting shed - 13. Open trading sheds - 84. Piggery and Goat sheds - 25. Water supply sanitary arrangement Electricity6. Internal roads7. Iewduh -Bara Bazaar (Non-regulated): To cater to the vegetable needs of the population of Shillong city, Iewduh-Bara Bazaar (non-regulated) market is the major market. Located within the Shillong city; Iewduh market is the only preferred market for trading all kinds of vegetable produce in the region (due to absence of regulated market for vegetables in the region distance). Farmers of nearby production belts/blocks (within 60 kms radius of Shillong city) used to sell their produce in the market. In the market, approximately 300-400 small and big traders are operating. Discussions with the traders in the market revealed, that on an average 500-800 quintal of vegetable produce arrives daily in the market. Besides vegetables, other commodities such as fish, spices, general grocery items are also traded in the same market place.
  • 153.
    143 The market servesboth wholesale and retailing point for trading of vegetable produce. Farmers from nearby production belts bring their produce in wooden baskets/jute bags and sell it to traders who offer the maximum price. Traders in turn sell their produce to retailers as well as to consumers. The market operates in a very congested area and unhygienic conditions and lacks basic infrastructure amenities for vegetable trading such as parking, even roads, clean and regular supplyofwater,irregularelectricity,auctionplatforms/sheds,weighbridges,sortinggrading machines, cold stores, godowns, market information system, garbage disposal system etc. Iewduh is run and managed by the Syiem of Mylliem, head of the traditional democratic institution of Syiemship. The most distinctive feature of this ancient market is the total domination of its retail trade by the Khasi women, who are everywhere, all over Iewduh. Though the market is non-regulated, but discussions with the traders and farmers revealed payment of money to person deputed on behalf of the King for provision of facilities in the market such as sanitation, parking etc. By and large, trading in horticulture produce is done in markets yet to be ‘regulated’. In fact, there is a resistance to transactions taking place in APMCs yards and the trading associations have moved the Hon’ble High Court for redressal of this matter. In the interest of the future growth of the city, the need of the hour is to shift the Iewduh (Bara Bazaar) to Farmers Market at Upper Shillong (under construction) which has hygienic conditions, sufficient parking space, pucca roads, auction platforms, sorting, grading and packing machines, electronic display system, ripening chamber multipurpose cold storage facility in addition to small godowns etc. Farmers Market at Upper Shillong (Under Construction):1. To provide marketing facility forthesefarmers,toenablethemtomarkettheirproduce,theGovernmentofMeghalaya through the State Agricultural Marketing Board set out to establish a farmers’ market under ACA (Additional Central Assistance) at a cost of ` 47,18,731.00. The construction of this farmers’ market has been completed and it is likely to be inaugurated soon. The main objectives of establishing the farmers’ market is (a) to provide a place which is equipped with infrastructure and facilities for the farmers to sell their produce in a transparent and fair manner to buyers and sellers alike, (b) to enable farmers to come together and manage the facility, (c) to provide a platform to farmers for exchanging information and for the Department of Agriculture to meet with farmers with a view to providing technical information and advisories, (d) to facilitate direct seller and trader interaction and trading between farmers and traders which eliminates the operation of superfluous middlemen to a great extent. Infrastructural details of the Upper Shillong – Farmers’ Market TheUpperShillongFarmers’MarketisbuiltonlandbelongingtotheStateAgricultureDepartment at 5th Mile Upper Shillong, on the road to Shillong peak. It consists of the structures as shown in the table given on page 144. Collection and Forwarding Centre: To improve the marketability and add value to the produce brought by the farmers to the market, the State Government has proposed to set up a Collection and Forwarding Centre at Upper-Shillong adjacent to the farmers’ market. At the Collection and Forwarding Centre, the produce will be properly graded stored and packed, before being transported to the larger markets outside Shillong and even outside the state. This will provide a better market and better price for their marketable surplus produce and enable the farmers to enhance their income from their cultivation. Annexure 2
  • 154.
    144 Value ChainAnalysis of Select Crops in North Eastern States The intended purpose and activity of the Collection and Forwarding Centre is meant to be as follows: Fresh harvested vegetables and fruits are brought to the centre for: Cleaning, sorting, grading and packing in appropriate packets.1. To enhance shelf life of fresh produce by pre-cooling.2. To keep the produce in cold rooms for short term, prior to dispatch to markets.3. The facility which should be created should be able to handle 20 Metric Tons of fruits vegetables arriving daily in 10 working hours per day. The proposed building of the facility will have the following components: Main building size L30 x W18 x H5 m. The building shall be constructed as a civil structure, with a standard shed with 1 mtr raised platform with steel structure and roof profile sheeting – end coverings etc and shall be divided so as to cater to definite purpose as follows: 2 cold stores of 10 MT storage capacity each and 1 pre-cooling chamber of capacityi. 3MT/batch will be provided along the width side of the main building. The technical specification of the cold store and pre-cooler will be as per revised specification as i) ii) given above except for generator size/MCC should be suitable common to both. Work Hall size L20 x W18 x H4.5 m will be at the centre portion, the 2 side walls alongii. the length of the work hall will be of 40 mm thick PUF sandwich panels and will also have a false ceiling of 40 mm thick PUF sandwich panels. 2 sliding doors of size 2 x 2 shall be provided for movement of fresh arrivals and despatch of packed produce. On both side walls high level fixed glazed windows of size 500 x 1000 mm shall be provided, along with 6 exhaust fans of 300 mm diameter. Sl. No. Infrastructure Size (in m) Area/Unit Specifications 1 Open stall – 6 3.65 x 3.00 10.95m2 With tabular trusses C.G.I. sheet 2 Auction platform – 1 20.00 x 8.00 160.00 m2 3 Go-down – 1 15.00 x 5.00 75.00 m2 4 Grading Sorting Hall – 1 8.00 x 6.00 48.00 m2 5 Farmers Meeting Hall – 1 8.00 x 4.00 32.00 m2 6 Septic Tank – 1 50 users 7 Approach Road L = 125.00 Rm 768.50 m2 Black Topped 8 Foot path from motorable road L = 53.24 Rm 106.48 m2 Cement concrete 9 Garbage disposal/Dustbin 2.00 x 2.00 x 1.2 4.80 m2 10 Toilet 3.00 x 1.50 4.50 m2 11 Deep tube well 12 Over head RCC staging 13 Footpath drain a) Drain b) Footpath 346.00 Rm 23.93 Rm Cement concrete 14 Electrification
  • 155.
    145 The remaining sideof the building will house supervisor’s office size L4 x W4 x H3 m,iii. Laboratory L4 x W3 x H3 m, ladies and gents toilets each L4 x W4 x H3 m with a middle corridor of size L4 x W2 x H3 m. This portion of the building will have all end walls and partition walls of brick plaster finished and painted. False ceiling either with wood or acoustic tiles shall be provided in this area. Toilets shall be fitted with WC/urinal/wash basin fittings appropriate for use by 40 persons. Suitable septic tank shall be provided for the toilet waste disposal. The lean to portion of the building will be a covered veranda to enable truck unloading/iv. loading and at the cold store end will be separated with brick wall (6 x 6 m area) for the utility equipment such as water filtration plant, EPT, DG set, electrical panels etc. Electrification of the building shall be as follows: lighting 2 in cold store, 10 in thev. work hall, 2 each in office, lab and toilets. 15 amp power sockets-12 in the work hall, 4 at the office, 2 in each toilet. Sufficient external lighting is to be provided as required. Two compost pits of size L6 x W6 x D3 m are to be provided at least 100 m away fromvi. the building for disposal of vegetable waste. Plant and Machinery Refrigeration equipment for cold stores and pre-cooler and the specs of PUF insulatedi. panels, cold store doors etc will be same as given in the revised specs given as item i and ii above. Sorting and grading tables size 1 x 2 m, qty. 10, SS304 sheet covered top, G.I. frameii. and legs. 4 trolleys with raised handle for moving plastic crates, painted MS construction withiii. 200 mm diameter rubber wheels, size 1 x 2 m. 4 pallets trucks-hydraulic hand-operated, to move PVC pallets of size 1.2 x 1 m andiv. weight carrying capacity of 1,000 kg. 500 perforated plastic crates size 600 x 400 x 300 mm.v. 2 hand tools for strapping cartons.vi. 6 electronic table top weighing scales of 0-30 kg range.vii. 10 fly/insect killer for wall mounting/hanger type.viii. One platform type electronic weighing scale range upto 1,000 kg.ix. One silent diesel generator 85 KVA, 415V/3ph, 50 Hz. Complete with 500 Litre dieselx. tank, accessory electrical switch gear and monitoring panel. One water filtration to produce clean water at the rate of 1mxi. 3 /hr complete with 5000 Litre storage tank. Rural Markets (Non-Regulated):2. Besides Bara Bazar (Iewduh Market), Mawiong (East Khasi Hills) and Garobadha (West Garo Hills) Regulated Market, each district has traditional non-regulated rural markets established at the block level. The periodicity of these markets is bi-weekly and ownership of management is mainly by local authorities. The small and marginal farmers of nearby villages mainly sell their produce in the local markets at block level. Being traditional establishments, all rural markets lack basic infrastructure facilities to handle fresh produce. Annexure 2
  • 156.
    146 Value ChainAnalysis of Select Crops in North Eastern States Block Markets Amlarem Dawki Baghmara Emangiri   Sibbari Betasing Ampati Chokpot Chokpot Dadenggiri Dadenggiri   Romagal Dalu Dalu   Purakhasia Dambo Rongjeng Rongjeng Jirang Jirang   Patharkhmah Kharkuta Adokgiri   Kharkutta Khliehriat Khliehriat   Umkiang Laitkroh Laitlyngkot Laskein Raliang   Shangpung Mairang Kynshi   Mairang Mawkyrwat Mawkyrwat Mawphlang Mawngap   Sohiong Mawryngkneng Mawryngkneng   Smit Mawshynrut Riangdo   Shallang Mawsynram Mawsynram   Tyrsad Mylliem Iewduh(Shillong)   Mawiong Regulated Market Nongstoin Nongstoin   Rambrai Pynursla Pynursla Ranikor Balat Resubelpara Bajengdoba   Mendipathar Ronggara Maheshkhola   Ronggara Rongram Rongram   Tura Samanda Rongsak   Samanda Samanda Williamnagar Selsella Garobadha Regulated Market Shella-Bholaganj Shella Block-wise Listing of Markets in the State
  • 157.
    147 Post-harvest and MarketingInfrastructure Status in Mizoram Food Processing Plant, Sairang, Aizawl1. Input Annual Input Capacity (Quintals) Product Pineapple 1200 Squash Orange 2500 Squash Passion Fruit 2300 Squash Bamboo Shoots 2000 Canned Others 1200 Tidbits, RTS, beverages Total 9200 Fruit Juice Concentrate Plant, Chhingchhip2. Input Annual Input Capacity (TPA) Pineapple 250 Orange 400 Passion Fruit 1120 Total 1770 Both of the above facilities are underperforming currently, they are underutilised and in huge monetary loss. They are not able to pay the farmers in full for the procured raw materials. Multipurpose Pack house at Horticulture Complex3. Cold store (40MT)™™ Sorting grading (2.5 MT/hr)™™ Washing, crushing, waxing and packaging facility™™ This was constructed last year and has been now leased out to Shimla Hills Pvt. Ltd. @ a rent of ` 50,000 per month. Block Markets Songsak Songsak Thadlaskein Jowai   Khanduli Thadlaskein Nartiang   Wahiajer Tikrikilla Raksamgiri   Tikrikilla Umling 20th Mile   Byrnihat Umling Nongpoh   Umden Umsning Umroi   Umsning Zikzak Kalaichar   Mahendraganj Annexure 2
  • 158.
    148 Value ChainAnalysis of Select Crops in North Eastern States Small cold storage at4. Champhai™™ Serchhip™™ Aizawl™™ These cold stores are meant for spice storage but are not being used optimally. Wholesale and rural primary markets5. There are 10 wholesale and 85 rural primary markets constructed by MAMCO. MAMCO charges nominal rent from the tenants. Wholesale Markets Sl. No. Name of the Wholesale Market Location with District 1 Variengte Vairengte, Kolasib District 2 Kanhmun Kanhmun, Mamit District 3 Bairabi Bairabi, Kolasib District 4 Champhai Champhai, Champhai District 5 Hunthar Aizawl, Aizawl District 6 Ngaizel Ngaizel, Aizawl District 7 New Market Dawrpui Dawrpui, Aizawl District 8 Mission Vengthlang Mission Vengthlang, Aizawl District 9 Zemabawk North Zemabawk, Aizawl District 10 Farkawn Farkawn, Champhai District Rural Primary Markets Sl. No. Name of the Rural Primary Market Location with District 1 Khumtung Khumtung, Serchhip 2 Chhingchhip Chhingchhip, Aizawl District 3 Tlungvel Tlungvel, Aizawl District 4 Saitual Saitul, Aizawl District 5 Zawlnuam Zawlnuam, Mamit District 6 Khawzawl Dinthar Khawzawl, Champhai District 7 Kamalanagar Kamalanagar, Lunglei District 8 Khawzawl Hermon Khawzawl, Champhai District 9 Mamit Mamit, Mamit Dist. 10 Tlabung Tlabung, Aizawl Dist. 11 Khanpui Khanpui, Aizawl Dist. 12 Darlawn Darlawn, Aizawl Dist. 13 Bilkhawthlir Bilkhawthlir, Kolasib Dist. 14 Serchhip Serchhip, Serchhip Dist. 15 Saiha Saiha, Saiha Dist. 16 Lawngtlai Lawngtlai, Lawngtlai Dist. 17 Zokhawthar Zokhawthar, Champhai Dist. 18 Bukpui Bukpui, Kolasib Dist.
  • 159.
    149 Sl. No. Nameof the Rural Primary Market Location with District 19 Baktawng Vengpui Baktawng, Serchhip Dist. 20 Seling Seling, Aizawl Dist. 21 Zanlawn Zanlawn, Aizawl Dist. 22 Sairang Sairang, Aizawl Dist. 23 Kawnpui Kawnpui 'N' Kolasib Dist. 24 Luangmual Luangmual, Aizawl Dist. 25 Aibawk Aibawk, Aizawl Dist. 26 Khabung 'S’ Khaaabung 'S' Chamhai Dist. 27 Chawlhhmun Chawlhhmun, Aizawl Dist. 28 Pukpui Pukpui (Lunglei ) 29 Haulawng Haulawng, Lunglie 30 Kawlkulh Kawlkulh, Champhai Dist. 31 West Phaileng W. Phaileng, Mamit Dist. 32 Thenzawl Thenzawl, Serchhip Dist. 33 Khuangleng Khuangleng, Champhai Dist. 34 Keifang Keifang, Aizawl Dist. 35 Tuikual 'N' Tuikual 'N', Aizawl Dist. 36 Tuipang Tuipang, Saiha Dist. 37 Bualpui 'NG' Bualpui 'NG', Lawntlati Dist. 38 Pangzawl Pangzawl, Lunglei Dist. 39 Chawngtlai Chawngtlai, Champhai Dist. 40 Durtlang Durtlang, Aizawl Dist. 41 Sihphir Vengthar Shiphir Vengthar, Aizawl Dist. 42 Durtlang Durtlang, Aizawl Dist. 43 Sialhawk Sialhawk, Champhai Dist. 44 N.Vanlaiphai N.Vanlaiphai, Serchhip Dist. 45 Darlak Darlak, Mamit Dist. 46 Tlangsam Tlangsam, Champhai Dist. 47 Tawipui 'S' Tawipui 'S', Lunglei Dist. 48 Sawleng Sawleng, Aizawl Dist. 49 Sangau Sangau, Lawntlai Dist. 50 Reiek Reiek, Mamit Dist. 51 Zotlang Zotlang, Aizawl Dist. 52 Nursery Veng Nursery, Aizawl Dist. 53 Republic Veng Republic, Aizawl Dist. 54 Chawnpui Veng Chawnpui veng, Aizawl Dist. 55 Dinthar Dinthar, Aizwla Dist. 56 Khawruhlian Khawruhlian, Aizawl Dist. 57 Zobawk Zobawk, Lunglei Dist. 58 Hrangchalkawn Hrangchalkawn, Lunglei Dist. 59 Thualthu Thualthu, Lunglei Dist. 60 Thingsai Thingsai, Lunglei Dist. 61 S. Vanlaiphai S.Vanlaiphai, Lunglei District 62 Lungsen Lungsen Lunglei Dist. 63 Diltlang 'S' Diltlang 'S', Lawngtlai Dist. Annexure 2
  • 160.
    150 Value ChainAnalysis of Select Crops in North Eastern States Turmeric processing facility in Khopai village, Saiha District: 400 kg turmeric per month is6. being processed here. Farmers are not getting the full benefit due to poor market accessibility. Transportation facilities are also limited and there are difficulties due to hilly terrain. It takes longer duration to reach the destination. Transportation costs are also very high. Connectivity with the major markets like Guwahati and Kolkata is also limited. Farmers are getting a larger pie of good purchasing power parity of people in Aizawl town. Traders and contractors from Cachar, Silchar and Karinganj in Assam visit the farmers and negotiate with them to buy the produce. Farmers don’t have control on the price offered to them. Most of the farmers grow ginger but in the current season, prices went as low as ` 5/ kg for them and they are in a difficult situation. There is no growers’ group as such for the major crops such as mandarin, pineapple, banana, grape, passion fruit etc. MIFCO has no forward linkage with renowned groups such as Coca-Cola, Pepsi or Dabur etc. so that they can supply the finished products to them. Marketing strategy and promotional activities of MIFCO are very poor. Due to this their produce keeps lying at the store for long duration and they are not able to pay the farmers. Sl. No. Name of the Rural Primary Market Location with District 64 M.Kawnpui M.Kawnpui, Lawngtlai Dist. 65 Ngopa Ngopa, Champhai Dist. 66 Vaphai Vaphai, Champhai Dist. 67 Hnahlan Hnahlan, Champhai Dist. 68 Biate Biate, Champhai Dist. 69 Khawhai Khawhai, Champhai Dist. 70 N.E. Khawdungsei N.E Khawdungsei, Champhai Dist. 71 Keitum Keitum, Serchhip Dist. 72 Khawlailung, Khawlailung, Serchhip, Dist. 73 Sihhmui, Sairang Sihhmui Sairang, Aizawl Dist. 74 Muallungthu Muallungthu, Aizawl Dist. 75 Sateek Sateek, Aizawl Dist. 76 Ratu Ratu, Aizawl Dist. 77 Buarpui Buarpui, Lunglei Dist. 78 Vanhne Vanhne, Lunglei Dist. 79 Zawngling Zawngling, Saiha Dist. 80 Kawlchaw 'W' Kawlchaw 'W' Laungttai Dist. 81 Rawpuichhip Rawpuichhip, Mamit Dist. 82 Mualkawi Mualkawi, Champhai Dist. 83 Chhawruit Chhawrtui, Champhai Dist. 84 Suangpuilawn Suangpuilawn, Aizawl Dist. 85 Bilkhawthir 'W' Bilkhawthir 'W' Kolasib Dist. 86 Dulte Dulte, Champhai Dist. 87 Bungtlang Bungtlang, Serchhip Dist.
  • 161.
    151 Nagaland Post-harvest and MarketingInfrastructure Status in Nagaland The total cold storage capacity is 6150 MT with two multipurpose cold storages in Nagaland, one co-operative and the other privately owned. Following are the details: Marcofed Cold Storage in Dimapur – Capacity 1150 MT1. Private Cold Storage in Dimapur- Capacity 5000 MT2. Since pineapple is a major crop of the region, a collection centre to collect the fruit from nearby villages has been set up by the Government at Jharnapani (in Dimapur). There are two pineapple processing units which carry out pineapple slicing and canning and sell in the nearby markets: Naandi foundation has one pineapple processing centre in Medziphema run by™™ women members of SHGs. Zhimoni food processing centre in Dimapur.™™ List of Existing Markets in Nagaland Annexure 2 WSM: Wholesale Market RPM: Rural Primary Market AM: Apni Mandi
  • 162.
    152 Value ChainAnalysis of Select Crops in North Eastern States APMC Wholesale Markets in Nagaland Dimapur NSAMB Market Complex Facilities available: Godowns – 61. Traders Chambers – 62. Auctions plat forms with tin roofing – 1 unit3. Shops – 2 units4. Canteen – 1 unit5. Market Yard 15,000 sq ft (Cemented)6. Bath room cum latrine – for publics – 4 units7. Conference room, 30 x 60 ft fully air condition – 18. Office complex separate9. Spices drying unit – 110. Animal feed block making – 1 unit11. Waste disposal unit – 10 x 60 x 8 ft – 1 unit12. Electronic Weight bridge – 20 MT capacity – 1 unit13. Water supply available14. Electricity available15. Wokha APMC Market complex Facilities available: Godown – 3 (20 x 30) capacity1. Drying Yard – 42. Auctions platforms with tin roofing – 1 unit3. Trader chamber – 14. Vehicle parking yard available5. Electronic weight bridge – 20 MT capacity available6. Spices drying machine – available7. Office complex separate8. Conference room available9. Electricity available10. Public latrine – available11. Water facilities available12. Mokokchung APMC Complex Facilities available: Godown – 31. Auction Yard – 12. Drying Yard – 23. Trader chamber 24.
  • 163.
    153 Shops – 2units5. Vehicle parking yard available6. Water facilities available7. Conference room available8. Spices drying machine – available9. Electronic weight bridge – 20 MT capacity - 1 available10. Electricity available.11. Mon APMC Complex Facilities available: Godown – 31. Conference room available2. Traders chamber – 23. Auction Yard available4. Drying Yard – 25. Vehicle parking yard available6. Public sanitation available7. Electricity available.8. Spices drying unit – 19. Office complex separate.10. Tuensang APMC Complex Facilities available: Godown – 21. Traders chambers – 12. Drying Yard – 23. Auction Yard – 14. Electronic Weight Bridge – 20 MT capacity- 15. Public sanitation available6. Water facilities available7. Vehicle parking yard available8. Conference room available9. Spices drying machine – available10. Office complex separate11. Kohobuto APMC Complex, Dimapur Facilities available Godown – 21. Conference room available2. Drying Yard – 23. Auction platform – 14. Annexure 2
  • 164.
    154 Value ChainAnalysis of Select Crops in North Eastern States Electronic Weight Bridge – 20 MT capacity available5. Conference room available6. Vehicle parking yard available7. Public sanitation available8. Water facilities available9. Traders’ chambers – 210. Spices drying machine – available11. Waste disposal facility – available12. Rural Primary Market Yards in Nagaland Rural Primary Market Yards are there in each district of Nagaland. Following facilities are available in Rural Primary Market Yards in Nagaland: Office-cum-Godown1. Drying Yard2. Public sanitation facilities3. List of Rural Primary Market Yards are as below: i. Kohima District Chedema1. Tsemenyu2. Chiphobouzo3. Thongsu4. Tesophenyu5. Botsa6. Khonoma7. Khuzama8. Zhadima9. Peducha10. ii. Dimapur District Khubuto1. Nuiland2. Kacharigaon3. Zutovi4. Shikito5. Aqhuhuto6. Alosa7. Suhoi8. Domokhia9. Bade10.
  • 165.
    155 iii. Peren District Punglwa1. Samzuiram2. NewJaluki3. Mhainmanth4. iv. Wokha District Merapani1. Ralan2. Longtsung3. Yamhon4. Baghty5. Bhandari6. Pangti7. Lotsu8. Yikhum9. Yimpang10. Yanthamo11. Lakhuti12. Changsu Old13. N. Longidang14. Okotso15. Liphi16. Liphanyan17. v. Phek District Meluri1. Chozuba2. Porba3. Seidzu4. Zukitsa5. Chizami6. Chetheba7. Dzulhami8. Khuza9. Dupazhu10. Pholami11. Tsupfume12. Annexure 2
  • 166.
    156 Value ChainAnalysis of Select Crops in North Eastern States vi. Zunhebuto District Saptiga1. Ighanomi2. Hebolumi3. Kitsakita4. Asukhomi5. Kitami6. Akaito7. Mudutsughu8. Sapotomi9. vii. Kiphiri District Kiphiri Town1. Amahator2. viii. Longleng District Pungo1. ix. Mokokchung District Asangma1. Longjang2. Tsutsung3. Longkhum4. Aliba (New camp)5. Tuli6. Mokokchung village7. Sungkumen8. Tsurang valley9. Waromong10. Chungtia11. Merangkong12. Mopongchukit13. Chuchuyimpang14. x. Mon District Aboi1. Tobu2. Wakching3. Yongkong4. Tanhai5. xi. Tuensang District Mangakhi1. Shamator2.
  • 167.
    157 Chesore3. Panso4. Yakhur5. Apni Mandi inNagaland i. Kohima District Mountain View College Colony1. Lerie colony2. Kigwema Village3. Viswema Village4. Kezikia (Kohima Town)5. ii. Dimapur District Pughato1. Piphema2. Tsuma3. Chekiye4. Aghunaqa5. Nikhekhu6. iii. Peren District Peren Town1. iv. Wokha District Mungya1. Rachan2. Sanis Town3. Sungro4. Wozhuro5. Yanpha6. Longpvu7. Dotang8. Helipad9. Pyochu bridge point10. Molonsu11. Wokha Village12. v. Phek District Phek Town1. Sekruzu2. Losami junction3. Sakraba4. Annexure 2
  • 168.
    158 Value ChainAnalysis of Select Crops in North Eastern States vi. Zunhebuto District Naghutomi1. Naltoqa2. Zaphu3. Doyang bridge Mkg. Road4. Surohuto5. vii. Longleng District Longlen Town1. Tamlu Town2. viii. Mokokchung District Puniboto1. Alichen2. Changtongya3. Yajang4. Yisemyong5. Chuchuyimlang6. ix. Mon District Ukha junction1. Naganimora2. x. Tuensang District Noklak Town1. Longkhim Town2. Post-harvest and Marketing infrastructure Status in Sikkim Following post-harvest infrastructure facilities are available in Sikkim Ginger Pack house at Birdang, West Sikkim1. Capacity: 7.5 MT/day™™ Washing, draying, grading and waxing facilities™™ Ginger crushing, separation of cake liquid/drying and powder-making™™ Ginger oil extraction™™ Government Fruit Preservation Factory, Singtam, East Sikkim2. Established in 1956, manufactures orange squash, lemon squash, passion fruit squash, tomato ketchup, tomato puree, orange, marmalade, mixed fruit jam, synthetic vinegar, mango pickle, Dallae chilly (hot balls) pickle, Dallae chilly with bamboo shoot pickle, mixed pickle, pineapple squash, orange juice, mango juice, pineapple juice, litchi juice, guava juice and canned fruits and jams under the brand name of ‘Sikkim Supreme’. Installed plant and machineries are very old and need overhauling. It is not a very profit- making venture. Marketing linkages are not very strong. NERAMAC sold GFPF products under its outlets all over NER.
  • 169.
    159 Apart from these,there is one cold store in Rong Po, used for potato storage, flowers pack houses and agriculture check posts (Rong Po Melli) to record the inflow and outflow of produce. Agriculture marketing is not regulated in the states so the marketing of fruits and vegetables are also unorganised. Largest fruits and vegetable market in Kanchanjungha Complex in Gangtok is occupied by wholesalers/retailers. NERAMAC, SIMFED and few farmers’ groups and individuals have outlets in the complex. There is no other facility available as per the APMC guideline. Government made effort to organise horticulture trade by locating it under one regulated market in East Sikkim but due to non-interest of traders it could not be implemented. Post-harvest and Marketing Infrastructure Status in Tripura The state lacks post-harvest infrastructure for handling, however, there is sufficient cold storage capacity in the state. Total of 14 cold storages are there in Tripura with total capacity of 31,450 MT. District-wise Cold Storage Capacity in Tripura District No. of Cold Storage Capacity Remark North Tripura 3 5200 Multipurpose West Tripura 7 16250 Multipurpose Dhalai 1 2000 Multipurpose South Tripura 3 8000 Multipurpose Total 14 31450   Source: Directorate of Marketing and Inspection, MoA, GoI Out of total cold storage capacity, approximately 9750 MT of capacity has been created by private sector and 2000 MT by cooperatives, rest cold storage capacity has been developed by the public sector. Most of the capacity is used for storage of potato. At present, there are 21 regulated markets in Tripura, of which 9 are in West Tripura district, 6 in South Tripura and 3 each in Dhalai and North districts. Sl. No. District No. of Regulated Markets Locations 1 West 9 Mohanpur, Bishalgarh, Champaknagar, Teliamura, Bechaibari, Melagar, Sonamura, Kalyanpur, Jumpuijala 2 South 6 Garjee, Santirbazar, Barpathari, Kalashi, Nutanbazar, Silachari 3 Dhalai 3 Chawmanu, Gandachara, Kulai 4 North 3 Dasda, Pabiachhara, Panisagar Although a sufficient number of regulated markets are present in Tripura, these markets are not functioning properly due to the various shortcomings like inefficient management systems, lack of infrastructure for the perishable products in the market etc. In addition to the regulated markets, there is large number of non-regulated markets in the state. Theregulatedmarketsinthestatedonothavespecificinfrastructureforhandlinghorticultural products. In addition to these regulated markets, there are 554 listed rural primary markets and 84 wholesale assembling markets. Annexure 2
  • 170.
    160 Value ChainAnalysis of Select Crops in North Eastern States For fruits and vegetables, biggest wholesale markets in the state are Golbazar and Battala markets in Agartala. Both of these markets are non-regulated markets. These two markets serve to Agartala as well as distribution centre for whole of Tripura for products coming from other states. There are around 30-35 commission agents and wholesalers in the Golbazar market and around 15 Traders in Battala market. Stakeholders Met During the Field Visits Arunachal Pradesh Director Horticulture, Itanagar™™ Deputy Director Horticulture (HQ), Itanagar™™ Asst. Director Horticulture (RD), Itanagar™™ Horticulture Marketing Officers, Itanagar™™ Director, AP Agriculture Marketing Board (APAMB), Itanagar™™ District Horticulture Officer, Papum Pare District™™ Horticulture Development Officers, Yupia, Papum Pare District™™ District Horticulture Officer, Lower Subansiri District™™ Horticulture Development Officers, Lower Subansiri District™™ Wholesaler’s/Retailer’s (10), Papum Pare Regulated Market, Itanagar™™ Farmers’ FGDs (2) at Yupia (Papum Pare) Ziro- Lower Subansiri™™ Assam Director – Horticulture and Food Processing™™ Deputy Director – Horticulture and Food Processing™™ K K Choudhary – Superintendent Engineer, Agriculture Engineering Department™™ Horticulture Statistics Inspector – Directorate of Horticulture™™ Ashok Kr. Sharma – Executive Engineer – Cold Storage, Agriculture Engineering™™ Department G. Baishya – Packhouse Division, Assam Industrial Development Corporation™™ Dilip Bora, District Agriculture Officer, Kamrup™™ Agriculture Development Officers of Boko, Khetri, Bongaon, Goroimari and Rani™™ Agriculture Information Officer, Kamrup™™ Secretary, APMC Bijoynagar, Kamrup™™ Wholesalers, retailers and commission agents (15), Machkhowa and Fancy Bazar,™™ Guwahati Farmers’ FGD (2) in Bongaon and Boko (Kamrup)™™ Meghalaya Director Horticulture, Shillong™™ Deputy Director Horticulture, Shillong™™ Horticulture Development Officer (Marketing), Shillong™™ Secretary, Meg. State Agriculture Marketing Board, Shillong™™ District Horticulture Officer, East Khasi Hills™™ Asst. Director of Horticulture (Fruit Preservation Unit), Shillong™™
  • 171.
    161 Supervisor (Fruit PreservationUnit), Shillong™™ Block Development Officer (Horticulture), Sohara Block, East Khasi Hills™™ Horticulture Development Officer, Sohara Block, East Khasi Hills™™ Block Development Officer (Horticulture), Pynursala Block, East Khasi Hills™™ Asst. Director Horticulture, Jaintia Hills™™ Horticulture Development Officer, Jaintia Hills™™ District Horticulture Officer, Ri Bhoi District™™ Horticulture Development Officer, Ri Bhoi District™™ Traders (5), Mawoing Regulated Market, Shillong™™ Wholesaler’s/Retailer’s (10), Bara Bazar (Iewduh), Shillong™™ Farmers’ FGDs (5) at Sohara Pynursala (East Khasi Hills), Jowai (Jaintia Hills) and™™ Ri Bhoi Manipur Mr. K. Ngaciken, Director – Horticulture, Government of Manipur (Mb. 09436021887)™™ Mr. Ratan Kumar – Head, Horticulture Technology Mission, Manipur™™ Mr. Kipchen (Joint Director Incharge NVI, Government of Manipur) (for further™™ information – Mr. Iboton PA to joint director – 09436603076) Dr. Suresh Kumar Methi – KVK Programme Coordinator, Tamenglong (Mb. 09206176715)™™ Tawa Fruits – Lemon processors™™ Mrs. Rehma – KVK Programme Coordinator, Imphal™™ Mr. R. K. Darendrajit Singh (Superintendent – Custom Preventive Force LCS, Moreh) –™™ (Landline 038722 264238, Mb. 09436025417) Mr. Holichand, Inspector, LCS Moreh (Mb. 09402757179)™™ Dr. S. S. Roy, Horticulture expert, KVK, Imphal (09436891040)™™ Nagaland Sl. No. Name Post Address Contact No. 1 Dr. N. Benjong Aier Joint Director Kohima 9436002381 2 Mr. Pawan Kumar Deputy Director - Planning Kohima 9436437806 3 Ms. Mesetuonuo Deputy Director Kohima 9856162465 4 Mr. Jerry Patton Divisional Horticulture Officer Kohima 9436009026 5 Mr. Engyol Divisional Horticulture Officer Dimapur 9856051130  6 Mr. Temsu Longkumer Area Horticulture Officer Dimapur 9436004486 7 Mr. Mishento Divisional Horticulture Officer Peren 9436422004 8 Dr. Akali Sema Director - CIH Medziphema 03862-247707 9 Mr. Prabin Kumar Marketing Officer - CIH Medziphema 03862-247707 10 Mr. Gimzie Secretary-APMC Jalukie, Peren 9436018340 11 Mr. Loanry Horticulture Extension Officer Gaili, Peren 9856537260 12 Mr. Kishor Marketing Officer - ICCOA Dimapur 9401169719 13 Ms. Abea Mero MD, Naga Spices Pvt. Ltd. Dimapur 9856125529 14 Mr. Duolo Director - Kuda Cold Storage Dimapur 9436008303 15 Mr. Velsete Manager - Kuda Cold Storage Dimapur 9612836651 16 Wholesalers and retailers (10) at wholesale and retail markets in Dimapur 17 FGD with farmers at Molvom, Dimapur (1); Kohima (1) and Gaili, Peren (1) Annexure 2
  • 172.
    162 Value ChainAnalysis of Select Crops in North Eastern States Mizoram Sl. No. Name Post Address Contact No. 1 Mr. Samuel Rosanglura Principal Director Aizawl 9436140587 2 Mr. R Zotawna Joint Director Aizawl 9436149232 3 Mr. T. Llankunga  HDO HMNEH Deputy Director - Planning Aizawl 9436151320  4 Mr. Moantya Divisional Horticulture Officer Aizawl 9436144012 5 B. Lalchariliana AHEO Aizawl 8575567779 6 H. Lalpiaumama HDO Aizawl 8014529618 7 Mana Samto Field Consultant Aizawl 9856681789 8 Sangzuala Manager-Project Aizawl 2322180 9 Wholesellers/retailers (8) in Aizawl 10 FGD with farmers (1) at Thiak village in Aizawl Sikkim Principle Director, Horticulture Cash Crop Development Department, Sikkim™™ Deputy Director (Projects), Horticulture Cash Crop Development Department,™™ Sikkim Deputy Director (Project ME), Horticulture Cash Crop Development Department,™™ Sikkim Deputy Director (Plasticulture Mrktg.), Horticulture Cash Crop Development™™ Department, Sikkim Pack-House Incharge, Tadong, Gangtok™™ District Government official (East District South District)™™ SIMFED, Gangtok™™ NERAMAC, Gangtok™™ Wholesalers and retailers in Gangtok™™ Farmers FGD (2) in East and South Districts™™ Tripura Mr. P. B. Jamatia, Joint Director, Department of Horticulture, GoT (Mb. 09436455259)™™ Dr. S. P. Das, In-charge-Horticulture, ICAR Research Complex, Agartala™™ Mr. N. S. Das, Agriculture Section Officer, Bishanganj Agri Sector (Mb. 09436126731)™™ Mr. Chandra Mohan Deb, Agriculture Inspector, Bishanganj Agri Sector (Mb. 9612283641)™™ Mr. R. P. Malik, Managing Director, Tripura Horticulture Corporation Ltd.™™ Dr. Deepak Vaidya, Superintendent of Horticulture, South Tripura Food™™ Technologist Mr. M. L. Devnath, President, Tripura Chamber of Commerce and Industries™™ Mr. Gautam Roy, Export-Import business™™ Farmers meeting at field (Bastuli ADC village)™™ Wholsalers and retailers meeting at Agartala™™
  • 173.
    Literature Reviewed Vision 2020ADB’s Trade Investment Strategy – and how to create spillover from™™ India’s NorthEast Achievements Future Direction; Hans Peter Brunner, Senior Economist, ADB, 2008 Preparing the North Eastern States Trade Investment Creation Initiative; prepared™™ fro ADB by Global Development Solutions Prospectus for setting up rural business hubs in North East by Access Development™™ Services Agriculture – Annual Report 2010-11 by Ministry of Agriculture™™ Agriculture Value Chain Finance Strategy and Design by FAO™™ ASAMB Five Year Plan 07-12 by Assam State Agriculture Marketing Board™™ An Indepth Study and Impact Assessment Report by SFAC™™ Mizoram: Export Potential and Prospectus by EXIM Bank™™ Sikkim: Export Potential and Prospectus by EXIM Bank™™ Diversity of Ginger Cultivation in India by Indian Society for Spices™™ Traditional practices of ginger cultivation in Northeast India by ICAR Research Complex™™ for NEH Region, Gangtok Ginger by Agri Exchange, APEDA™™ ICCOA Project in Nagaland™™ North East Region: Vision 2020 by MoDoNER NEC™™ North East – Harnessing Agribusiness Potential: YES Bank Report for MoDoNER™™  Report on North East India: Dorabji Tata Trust™™ Annual Report – 2009-10: Spice Board of India™™  Imparting skill development training to the Lakadong turmeric farmers of the Jaintia™™ Hills of Meghalaya by by Prof. Debjani Roy and Dr. Jayashree Kurup Vision – 2025 by Indian Institute of Horticulture Research, Banglore™™ Package of Organic Practices from Assam, Manipur, Meghalaya Nagaland for™™ Arecanut, Ginger, Large Cardamom, Passion Fruit and Pineapple; North Eastern Region Community Resource Management Project for Upland Areas (NERCORMP) (IFAD GOI/DoNER/NEC) Shillong, September 2006 North East India Local Economic Development and Global Markets™™
  • 175.
    Editorial Team Pravesh Sharma™™ D.Bhuyan™™ M.J. Das™™ Case Study Preparation Alok Kumar Srivastava, Team Leader™™ Sunil Kumar™™ Gaurav Vats™™ Om Prakash™™ This document is a public resource and may be freely quoted and excerpted. However, any form of commercial exploitation is prohibited. NOT FOR SALE © Small Farmers’ Agribusiness Consortium (SFAC), New Delhi, 2012. Design and Print: Macro Graphics Pvt. Ltd. www.macrographics.com Note for Readers This study has been conducted on behalf of SFAC by Indian Society of Agribusiness Professionals (ISAP). Due diligence has been exercised by the consultant to obtain authentic secondary data and conduct field studies and interviews in a professional manner. The analysis and conclusions drawn are also made in an objective and fair manner. All original records related to the study are available with ISAP. SFAC encourages all readers to bring any factual errors in this publication to our attention.