The document analyzes real estate data from San Francisco over a 3 year period. It shows that from Q4 2008 to Q4 2011, the median sale price of homes decreased by 7% while the median list price decreased by 18%. The number of homes sold in Q4 2011 increased by 36% compared to Q4 2008.
The median sold price of homes in San Francisco decreased 15% from Q3 2008 to Q3 2011, from $820,000 to $701,000. Both the median price of for-sale properties and the median price of sold properties also decreased 15% over this period. Additionally, the number of homes sold decreased slightly from 619 in Q3 2008 to 603 in Q3 2011, a 3% decline.
San Francisco Residential Data Q2 2009 - Q2 2011Ronny Budiutama
The document summarizes real estate data for San Francisco over a 3 year period from Q2 2009 to Q2 2012. It shows that:
- The median sold price of homes increased 4% from $750,000 in Q2 2009 to $777,500 in Q2 2012.
- The number of homes sold increased 29% from 557 in Q2 2009 to 718 in Q2 2012.
- The number of homes under contract increased 8% from 665 in Q2 2009 to 719 in Q2 2012.
- The number of new homes on the market decreased 16% from 927 in Q2 2009 to 781 in Q2 2012.
San Francisco Residential Data Q2 2007 - Q2 2010Ronny Budiutama
The document summarizes real estate data for San Francisco over a 3-year period from Q2 2007 to Q2 2010. It shows that:
- The median sold price is down 16% from Q2 2007 to Q2 2010, decreasing from $926,500 to $777,000.
- The median price of for-sale properties is down 10% over this period, while the median price of sold properties is down 16%.
- The number of sold properties decreased slightly, down 1% from 670 properties in Q2 2007 to 662 in Q2 2010.
- The number of under-contract properties increased slightly, up 1% from 686 properties in Q2 2007 to
CR2 had a strong first half of 2008 with total launches of R$217.6 million, up 319% year-over-year. The focus remained on the low-income segment, making up 79% of launched PSV. Contracted sales totaled R$221 million, up 158% year-over-year. The sales speed for launches in 1H08 was 72.3%. Results to be recognized were R$98.2 million with a margin of 29.6%. The land bank contained over 10,000 units with a focus on Rio de Janeiro and Sao Paulo metropolitan areas.
- Housing market activity increased in February 2011 compared to February 2010 with dollar volume up 17.98%, units sold up 12.5%, and new listings down 11.43%.
- Average and median sold prices rose 4.87% and 3.72% respectively while days on market increased 134.21%.
- Inventory levels rose with 60 active listings, up 39.53% from the previous year, and 52 total pending sales, down 24.64%.
This slidecast shows a short overview of the quarterly results of Philips:
* The activities
* The sales
* The sales by sector
* The sales costs
* The net income
* The cash flow from operating activities
The document provides an overview of BI&P's 3rd quarter 2012 results. Key highlights include:
- Expanded credit portfolio grew 6.5% quarter-over-quarter to R$3 billion, with higher quality loans.
- Non-performing loans declined and coverage ratios increased.
- Revenue from services grew 40% year-over-year.
- Net profit increased 29% over the previous quarter to R$3.1 million.
- The bank continues improving portfolio quality while expanding in targeted industry niches.
The document discusses the retail management industry in India. It notes that organized retail makes up only 5% of the retail sector currently, but is growing rapidly due to increases in disposable income and purchasing power. It projects that organized retail will reach a 28% share of the total retail market by 2017. It also discusses the transformation of the Indian retail environment and compares India's growth in organized retail to other countries, noting India is expected to reach a 17% share within 5 years, much faster growth than other nations.
Sf Residential Real Estate Market Report Jan 2010 - Jan 2012Ronny Budiutama
- The median sold price of homes in San Francisco in January 2012 was $619,500, down 12% from January 2010 when it was $705,000.
- Both the median price of homes for sale ($659,000) and the median price of homes sold ($619,500) in January 2012 were down 12% from January 2010 levels.
- The number of homes sold was 124 in January 2012, down from 121 in January 2010.
The document discusses California's new law protecting homeowners from personal liability for deficiencies arising from short sales of residential property. The law prohibits lenders from collecting deficiencies or obtaining deficiency judgments on loans secured by one-to-four unit residential properties. It applies to first trust deeds, second trust deeds, and other junior liens. The purpose is to encourage short sales as an alternative to foreclosure and mitigate the foreclosure crisis.
- Housing market activity in San Francisco increased in October 2014 compared to the previous year. The median sales price for single family homes rose 34.4% and condos rose 10%.
- New listings were down for both single family (-16.2%) and condos (-3.4%) compared to the previous year. Pending sales increased for single family homes by 8.2% but decreased for condos by 12.6%.
- Inventory levels decreased for both single family homes and condos compared to the previous year.
This document provides a monthly snapshot of residential real estate activity in San Francisco County for September 2014. It finds that the median sales price for single family homes increased 11.7% compared to the previous year, while the median sales price for condos increased 11.4%. Overall real estate markets appear to be continuing their recovery, with new construction reaching six-year highs and rising inventory providing more options for buyers. However, factors like student debt and wage growth are slowing the transition to homeownership for some.
The document provides a monthly snapshot of residential real estate activity in San Francisco for January 2015. Key metrics are presented for single family homes and condos/co-ops. The median sales price increased 5.4% for single family homes but decreased 2.4% for condos/co-ops compared to January 2014. New listings and pending sales declined year-over-year for both categories in January 2015. The months supply of inventory decreased for both single family homes and condos/co-ops compared to the previous year.
Residential real estate activity in San Francisco saw increases in median sales prices in May 2015 compared to the previous year. The median sales price for single family homes rose 28.4% to $1,400,000, while the median price for condos rose 19.7% to $1,125,000. New listings and pending sales declined compared to the previous year, falling 22.9% and 4.2% respectively for single family homes.
Sales of existing homes in California increased 2.3% year-to-date in March 2015 compared to the same period in 2014. The median home price in California was $468,550 in March 2015, up 9.2% from the previous month and 7.2% from March 2014. Inventory levels improved slightly from the previous year with 3.8 months of supply in March 2015 compared to 4 months in March 2014.
San Francisco Residential Real Estate Market Data November 2012Ronny Budiutama
The document provides data on median home sale prices in San Francisco over a two year period from November 2010 to November 2012. It shows that the median sale price increased from $755,000 in November 2010 to $830,000 in November 2012, a 10% increase. Additionally, the number of homes sold increased 43% from 184 in November 2010 to 263 in November 2012. Finally, the number of homes under contract also rose 12% over this period.
This document is a summary of a webinar on short sale deficiencies presented by C.A.R. attorneys. The webinar provided an overview of new California law that prohibits lenders from pursuing borrowers for deficiencies or deficiency judgments after a short sale. It discussed the applicability of the law, exceptions, examples of its protections, a comparison to foreclosure, and the agent's role in advising clients and listing short sales. The presentation concluded with an opportunity for questions.
Regular-Sale, Short-Sale dan Bank-Owned properties di Amerika memberikan opsi berbeda bagi pembeli untuk membeli rumah. Presentasi menjelaskan prosedur dan perbedaan dalam membeli ketiga jenis properti tersebut, termasuk waktu yang dibutuhkan dan hal-hal yang perlu diperhatikan.
This webinar presentation compares short sales and foreclosures. It discusses personal liability, tax implications, credit impact, and other considerations for homeowners facing default. The presentation examines these issues through examples and outlines the key differences between short sales and foreclosures in each area. It also reviews Fannie Mae guidelines on reestablishing credit after a short sale or foreclosure and the policy against strategic default. The presentation concludes with an opportunity for questions.
San Francisco Real Estate Market Report August 2014Ronny Budiutama
- Residential real estate activity in San Francisco saw a 4.4% increase in the median sales price for single family homes and a 14.8% increase for condos from the previous year in August 2014.
- New listings were down 28.3% for single family homes and 36.7% for condos compared to August 2013, while pending sales decreased 14.4% and 14.2% respectively.
- Sustained job growth, lower mortgage rates, and a slow rise in home inventory have helped drive increased housing demand despite some monthly fluctuations in the market.
The document is a monthly real estate snapshot for San Francisco County that provides key metrics and year-over-year changes for November 2014. It shows that median sales prices increased 20.2% for single family homes and 24.1% for condos from November 2013 to November 2014. New listings decreased 35.7% for single family homes and 22.5% for condos compared to the previous year. Pending sales were down 7.6% for single family homes and 20.8% for condos.
Residential real estate activity in San Francisco saw increases in median sales prices and pending sales in March 2015 compared to the previous year. The median sales price for single family homes rose 27.6% to $1,250,000, while the median price for condos increased 14% to $1,100,000. Pending sales for single family homes were up 6%, though pending sales for condos fell slightly by 0.7%. New listings declined for both single family homes and condos. Overall the real estate market in San Francisco remained strong with higher prices and sales activity despite reductions in inventory.
- Housing prices in San Francisco increased substantially in 2014, with median sales prices rising 14% for single family homes and 25% for condos.
- While the market saw rising prices and stable inventory in 2014, price gains were less robust than in 2013 as the market shifted from being undersupplied to approaching equilibrium.
- Key metrics to watch in 2015 like days on market, percent of list price received, and absorption rates can provide insights into the future direction of the housing market.
The Oswell Company provides business leadership development programs and hands-on assistance to help companies focus on their main mission. Located in Collierville, Tennessee, The Oswell Company serves businesses nationwide and can be contacted at 901-861-3262 or maurice@theoswellcompany.com.
The document discusses the evolution of morphological agreement. It begins by defining agreement and its key components. It then examines theories about the origins of morphology, with some arguing it evolved simultaneously with syntax from protolanguage, while others see it as an independent system. The document also explores proposed stages of development from protolanguage to modern languages, with agreement marking argued to emerge at a late stage. Additionally, it is noted that the functions of agreement may have evolved for reasons like disambiguating syntactic relations or marking constituents. Overall, the document analyzes debates around the evolutionary origins and development of morphological agreement.
The document compares real estate data from the second quarter of 2009 to the second quarter of 2012 in San Francisco. It finds that the median sold price increased 4% over this period, rising from $750,000 to $777,500. However, the median price of properties for sale decreased 4%, from $799,000 to $768,000. Additionally, the number of properties sold increased 29% between the two quarters, from 557 units to 718 units.
Toronto Real Estate Statistics september 2011John Helfrich
The document summarizes real estate sales data for the Greater Toronto area in September 2011. It reports that home sales increased 25% compared to September 2010, with 7,658 transactions. For the first three quarters of 2011, sales increased 2.6% compared to the same period in 2010. The average selling price continued to grow by close to 10% year-over-year in September. Market conditions were tighter as annual growth in sales outpaced annual growth in new listings.
San francisco Real Estate Market June 2010 - June 2012Ronny Budiutama
The document compares median home sale prices in San Francisco from June 2010 to June 2012, finding that the median sale price has remained the same at $800,000 over that period. However, the median list price has risen 11% from $749,000 to $829,000. The report also provides monthly median sale and list prices as well as inventory levels and average days on market over 24 months.
The document summarizes rental market statistics for the second quarter of 2012 in the Greater Toronto area. It finds that apartment rentals increased 3% year-over-year while listings grew 15%. The average rent for a two-bedroom apartment was $2,088, up 4% from the second year. Strong condo development added to investor-held units on the rental market but demand remained high, keeping vacancy rates low and rents increasing above inflation.
Realogy Corporation reported financial results for the first quarter of 2008. Net revenue totaled $1.05 billion, EBITDA was $4 million, and net loss was $132 million due mainly to interest expense of $164 million. Home sale transaction sides declined 25% at RFG and 27% at NRT compared to the first quarter of 2007. However, Realogy remained in compliance with debt covenants as its senior secured leverage ratio of 4.2x was well below the allowable ratio of 5.6x. Realogy also highlighted strategic accomplishments including franchise sales growth and retention of sales associates.
Realogy Corporation reported financial results for the first quarter of 2008. Net revenue totaled $1.05 billion, EBITDA was $4 million, and net loss was $132 million due mainly to interest expense of $164 million. Home sale transaction sides declined 25% at Realogy Franchise Group and 27% at NRT compared to the first quarter of 2007. Realogy's senior secured leverage ratio was 4.2 to 1, well within the maximum allowable ratio of 5.6 to 1 under its credit agreement, demonstrating strong covenant compliance.
The net lease market report for Q1 2011 found:
1) Cap rates compressed across retail, office, and industrial markets while investment sales activity remained strong.
2) Demand was concentrated in the bank and drug store sectors and more conservative investments like ground leases.
3) Supply was driven by motivated sellers taking advantage of increased property values, though uncertainty remains about whether cap rate compression can continue.
San Francisco Residential Market July 2010 - July 2012Ronny Budiutama
The document provides data on median home sale prices in San Francisco from July 2010 to July 2012. It shows that the median sale price increased from $775,000 in July 2010 to $791,000 in July 2012, a 2% rise. Additionally, the number of homes sold increased slightly from 199 in July 2010 to 205 in July 2012, a 3% increase. Finally, the number of homes under contract increased more substantially over this period, rising 23% from 202 properties in July 2010 to 248 properties in July 2012.
Here are the most recent reports from the Toronto Real Estate Board about the activity in the Condominium resale market...Not to be confused with the New Condo Market which is mostly direct through the builder.
- The document provides operational and financial highlights for PDG Realty for 3Q08 and 9M08.
- In 3Q08, PDG Realty launched R$704 million in new projects and contracted sales totaled R$448 million, with 48.3% of launched units already sold.
- For 9M08, contracted sales totaled R$1.39 billion and launched projects reached R$1.87 billion, representing 69.4% of the company's full year guidance.
The net lease market report for Q2 2011 found that asking capitalization rates rose across most property sectors as lower quality assets were added to the market. However, cap rates for properties with investment grade tenants and long-term leases continued to compress due to high demand and limited supply. Cap rates for core assets like McDonald's properties compressed despite overall retail rates rising. A lack of new development is causing supply constraints for quality single-tenant properties through 2012, keeping cap rates low for these assets. The national single-tenant net lease market remains active but concentrated in core assets, and cap rate spreads between these and other properties are widening.
Industry analysis of the real estate sectorArunav Nayak
This document provides an industry analysis of the real estate sector in India. It discusses the current scenario and key drivers of growth in the Indian real estate market. It analyzes the different segments of real estate including residential, commercial, retail and hospitality. It also discusses the major players, market performance, global trends, and applies Porter's 5 forces model to understand the profitability of the Indian real estate sector. While there are challenges, the analysis concludes that with demand for real estate growing at 19% annually, prospects remain bright for the industry.
Toronto real estate statistics august 2011John Helfrich
Toronto Real Estate Market Statistics for August 2011. Focus on East End Toronto Homes and East End Toronto Real Estate. The Beaches, Riverdale, Leslieville, Danforth Village, East Danforth, Danforth Mosaic
The condominium apartment market in the Greater Toronto Area saw a decline in the fourth quarter of 2012 compared to the same period in 2011. Sales fell 23% to 3,830 units and the average price dipped 1% to $332,410. Strong completions in 2011 and early 2012 led to more listings and moderated price growth as buyers had more options. The rental market saw a rise in transactions and listings, with average rents up year-over-year for one and two bedroom units.
Here is the most recent 4th quarter reports from the Toronto Real Estate Board provided by Richard Silver. Here are the sales and listings of Condominiums or Condos in the Greater Toronto Area. This would include houses, apartments and townhouses...
Toronto real estate statistics july 2011John Helfrich
Toronto Real Estate Market Statistics for July 2011. Focus on East End Toronto Homes and East End Toronto Real Estate. The Beaches, Riverdale, Leslieville, Danforth Village, East Danforth, Danforth Mosaic
Condominium apartment sales in the Greater Toronto area increased 10.5% in the fourth quarter of 2011 compared to the same period in 2010. The average selling price rose 7% to $336,748. Over 70% of sales occurred in the City of Toronto, where the average price was $361,488, up 7% from 2010. The number of new listings rose 14% compared to fourth quarter 2010, but market conditions remained tight, contributing to price increases.
Realogy Corporation reported financial results for the second quarter of 2008. Net revenue was $1.4 billion and EBITDA was $161 million, while the company reported a net loss of $27 million. Home sale transaction sides declined by 21% at RFG and 19% at NRT compared to the prior year. The company launched the Better Homes and Gardens Real Estate franchise and remained in compliance with credit agreement leverage ratios, with a senior secured leverage ratio of 4.9x. Realogy will hold an investor webcast on August 14th to further discuss second quarter results.
- Realogy Corporation reported financial results for the second quarter of 2008, with net revenue of $1.4 billion, EBITDA of $161 million, and a net loss of $27 million.
- Home sale transaction sides declined 21% at RFG and 19% at NRT compared to the prior year, reflecting the difficult housing market. Average home prices also decreased.
- Realogy remains in compliance with debt covenants, with a senior secured leverage ratio of 4.9x versus the allowable 5.6x ratio. The company is focused on reducing costs.
Similar to Sf Residential Real Estate Market Report q42008 q42011 (20)
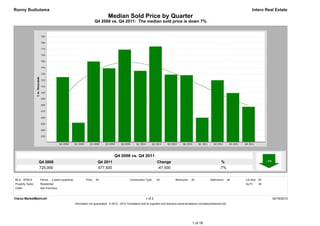
The document provides a monthly snapshot of real estate activity in San Francisco for January 2024. It summarizes that median home sale prices increased 15.2% year-over-year for single family homes and 8.7% for condos. Pending home sales increased 32.2% for single family homes and 47.2% for condos. Inventory decreased for single family homes but increased for condos compared to the previous year.
The document provides housing market statistics for San Francisco County for December 2023. It shows that existing home sales in the US rose slightly from the previous month but were down 7.3% from the same period last year. In San Francisco, new listings were down 37.5% for single family homes and 3.8% for condos from the previous year. The median sales price fell 5.7% for single family homes but rose 4.9% for condos compared to December 2022. Inventory remained low overall amid continued affordability challenges for buyers.
- New listings were down 35.9% for single family homes and 1.3% for condo/TIC/Coop properties in November 2023 compared to the previous year.
- The median sales price increased 2.3% to $1,535,000 for single family homes but remained flat at $1,125,000 for condo/TIC/Coop properties in November 2023 year-over-year.
- Inventory remains at historically low levels nationwide, keeping pressure on home prices which have continued to rise despite a slowdown in home sales.
The document provides an annual report on the San Francisco County housing market in 2023. It summarizes that pending home sales decreased 25.6% while sold listings decreased 27.4% compared to 2022. Housing inventory declined 19.7% and median home prices fell 9.1% year-over-year. The report reviews housing market statistics by property type, bedroom count, square footage, and area of San Francisco County.
October 2023 Report: San Francisco Real Estate Market InsightsRonny Budiutama
Residential real estate activity in San Francisco declined in October 2023 compared to the previous year. The median sales price for single family homes fell 1.2% year-over-year to $1,650,000, while the median price for condos dropped 1.3% to $1,185,000. New listings were down for both single family (-1.6%) and condos (-17.2%), while pending sales rose for single family homes (+16.9%) but fell for condos (-4.1%). Inventory remained low, rising 2.7% from the prior month but falling 8.1% from a year ago.
CA Weekly MLS Market Data Report - August 2023Ronny Budiutama
This Power BI report contains various charts and graphs analyzing real estate market trends in different regions of California from 2020 to 2023. It shows metrics for existing single family home closed sales, pending sales, median listing prices, and sales by price segment. Closed sales are broken down by week, year, region and price point with year-over-year comparisons. Pending sales and listings are also shown at the state level and by region and price point. The report provides high-level insights into housing demand, pricing, and sales volume trends over time for existing single family homes in California.
- Residential real estate activity in San Francisco saw declines in July 2023, with new listings down 23.2% for single family homes and 37.7% for condos from the previous year. Pending sales also decreased nearly 20% and 18.5% respectively.
- The median sales price dropped 13% for single family homes to $1,450,000, and 3.1% for condos to $1,159,500 compared to July 2022. Months of inventory increased over 6% for single family and nearly 16% for condos.
- Higher mortgage rates have limited buyer activity while also discouraging homeowners from listing due to not wanting to give up their lower rates, contributing to
- Existing home sales fell 3.4% nationwide in May 2023 compared to the previous month and were down 23% from May 2022 as higher mortgage rates reduced buyer affordability.
- New listings were down 9.0% for single family homes and 36.8% for condos from May 2022 levels, while pending sales decreased 12.0% and 27.7% respectively.
- Median sales prices declined sharply, falling 17.8% for single family homes to $1,650,000 and 7.7% for condos to $1,121,500 compared to May 2022.
- Residential real estate activity in San Francisco County saw declines across key metrics in June 2023 compared to the previous year. The median sales price for single family homes declined 14.6% year-over-year to $1,605,000, while the median price for condos fell 8.9% to $1,130,000. New listings dropped 32.6% for single family homes and 29.5% for condos. Pending sales rose slightly for single family but declined 9.2% for condos. Months of inventory increased for both property types. Nationwide, housing inventory rose 3.8% but remained low while median home prices fell 3.1% annually.
- Residential real estate activity in San Francisco saw declines across key metrics in March 2023 compared to the previous year. New listings were down 29.5% for single family homes and 41.6% for condos. Pending sales decreased 36.9% and 36.4% respectively. The median sales price dropped 15.1% and 10.5% respectively.
- Residential real estate activity in San Francisco saw significant declines in February 2023 compared to the previous year. New listings were down 40.3% for single family homes and 40.7% for condos. Pending sales decreased 39.5% and 25.8% respectively. The median sales price dropped 25.4% for single family homes and 6.3% for condos.
- Residential real estate activity in San Francisco decreased significantly in January 2023 compared to January 2022. New listings and pending sales were down 28.5% and 33.1% respectively for single family homes, and down 28.6% and 40.6% for condo/co-op properties. Median sales prices decreased as well, down 16% for single family homes and 6.5% for condo/co-op properties.
Annual Report on the San Francisco County Housing Market.pdfRonny Budiutama
This annual report summarizes housing market trends in San Francisco County in 2022. Some key points:
- Home sales and new listings declined significantly (over 25%) in 2022 from record highs in 2021, as mortgage rates rose sharply reducing affordability.
- Median home prices increased slightly (0.8%) countywide to $1,450,000, though prices decreased for single family homes and condos.
- Inventory remained very low, with only 653 active listings at the end of the year despite a 28.6% decline in new listings.
- The hot housing market that defined 2021 cooled considerably in 2022 as affordability challenges took hold, though demand remained robust in more
San Francisco Market Report December 2022.pdfRonny Budiutama
In 2022, rising inflation, interest rates, and home prices slowed the US housing market. Pending and existing home sales declined significantly year-over-year in December. In San Francisco, median home prices fell 7.5% for single family homes and 26.5% for condos from December 2021 to December 2022, as higher mortgage rates reduced buyer demand and purchasing power. New listings, pending sales, and closed sales all declined substantially from 2021 levels. Economists predict further price softening and slowing sales in 2023 if inventory remains limited and rates stay high.
San Francisco Market Report November 2022.pdfRonny Budiutama
Residential real estate activity in San Francisco saw declines in November 2022 compared to the previous year. The median sales price for single-family homes decreased 20.2% year-over-year to $1,500,000, while the median price for condos fell 8.9% to $1,148,000. New listings were down 12.3% for single-family properties and 41.9% for condos. Pending sales declined 31.7% for single-family homes and 49.2% for condos. With mortgage rates over double what they were a year ago, housing affordability remains a challenge and fewer buyers and sellers are participating in the market.
- Residential real estate activity in San Francisco declined in October 2022, with new listings, pending sales, and sold listings all decreasing between 24-39% year-over-year for both single family homes and condos.
- The median sales price decreased 7.2% for single family homes to $1,675,000 and 3.8% for condos to $1,200,000 compared to October 2021.
- Months supply of inventory increased over last year for both property types, up 15.8% for single family and 5.7% for condos, as high mortgage rates and inflation dampened homebuyer demand.
San Francisco Market Report September 2022.pdfRonny Budiutama
The real estate market in San Francisco continues to slow in September 2022 as interest rates rise and homebuyer budgets are squeezed. Key metrics show a year-over-year decrease for both single family homes and condos, including new listings down 13.2% and 19.8%, pending sales down 38.2% and 28.8%, and median sales prices down 5.7% and 2.5% respectively. Inventory remains lower than normal but is expected to rise as the market shifts in the coming months.
- Real estate activity in San Francisco County declined in August 2022 compared to the previous year according to the report. Key metrics such as new listings, pending sales, and median sales prices decreased for both single family homes and condo/co-op properties.
- New listings were down 13.7% for single family homes and 20.4% for condos. Pending sales decreased 25.2% and 29.1% respectively. Median sales prices declined 12.0% for single family homes and 14.1% for condos.
- Higher interest rates, inflation, and recession fears have discouraged buyers and sellers, leading to fewer transactions and declining prices compared to the strong market in previous years.
How MJ Global Leads the Packaging Industry.pdfMJ Global
MJ Global's success in staying ahead of the curve in the packaging industry is a testament to its dedication to innovation, sustainability, and customer-centricity. By embracing technological advancements, leading in eco-friendly solutions, collaborating with industry leaders, and adapting to evolving consumer preferences, MJ Global continues to set new standards in the packaging sector.
HOW TO START UP A COMPANY A STEP-BY-STEP GUIDE.pdf46adnanshahzad
How to Start Up a Company: A Step-by-Step Guide Starting a company is an exciting adventure that combines creativity, strategy, and hard work. It can seem overwhelming at first, but with the right guidance, anyone can transform a great idea into a successful business. Let's dive into how to start up a company, from the initial spark of an idea to securing funding and launching your startup.
Introduction
Have you ever dreamed of turning your innovative idea into a thriving business? Starting a company involves numerous steps and decisions, but don't worry—we're here to help. Whether you're exploring how to start a startup company or wondering how to start up a small business, this guide will walk you through the process, step by step.
𝐔𝐧𝐯𝐞𝐢𝐥 𝐭𝐡𝐞 𝐅𝐮𝐭𝐮𝐫𝐞 𝐨𝐟 𝐄𝐧𝐞𝐫𝐠𝐲 𝐄𝐟𝐟𝐢𝐜𝐢𝐞𝐧𝐜𝐲 𝐰𝐢𝐭𝐡 𝐍𝐄𝐖𝐍𝐓𝐈𝐃𝐄’𝐬 𝐋𝐚𝐭𝐞𝐬𝐭 𝐎𝐟𝐟𝐞𝐫𝐢𝐧𝐠𝐬
Explore the details in our newly released product manual, which showcases NEWNTIDE's advanced heat pump technologies. Delve into our energy-efficient and eco-friendly solutions tailored for diverse global markets.
Anny Serafina Love - Letter of Recommendation by Kellen Harkins, MS.AnnySerafinaLove
This letter, written by Kellen Harkins, Course Director at Full Sail University, commends Anny Love's exemplary performance in the Video Sharing Platforms class. It highlights her dedication, willingness to challenge herself, and exceptional skills in production, editing, and marketing across various video platforms like YouTube, TikTok, and Instagram.
Top 10 Free Accounting and Bookkeeping Apps for Small BusinessesYourLegal Accounting
Maintaining a proper record of your money is important for any business whether it is small or large. It helps you stay one step ahead in the financial race and be aware of your earnings and any tax obligations.
However, managing finances without an entire accounting staff can be challenging for small businesses.
Accounting apps can help with that! They resemble your private money manager.
They organize all of your transactions automatically as soon as you link them to your corporate bank account. Additionally, they are compatible with your phone, allowing you to monitor your finances from anywhere. Cool, right?
Thus, we’ll be looking at several fantastic accounting apps in this blog that will help you develop your business and save time.
Taurus Zodiac Sign: Unveiling the Traits, Dates, and Horoscope Insights of th...my Pandit
Dive into the steadfast world of the Taurus Zodiac Sign. Discover the grounded, stable, and logical nature of Taurus individuals, and explore their key personality traits, important dates, and horoscope insights. Learn how the determination and patience of the Taurus sign make them the rock-steady achievers and anchors of the zodiac.
Best practices for project execution and deliveryCLIVE MINCHIN
A select set of project management best practices to keep your project on-track, on-cost and aligned to scope. Many firms have don't have the necessary skills, diligence, methods and oversight of their projects; this leads to slippage, higher costs and longer timeframes. Often firms have a history of projects that simply failed to move the needle. These best practices will help your firm avoid these pitfalls but they require fortitude to apply.
The Most Inspiring Entrepreneurs to Follow in 2024.pdfthesiliconleaders
In a world where the potential of youth innovation remains vastly untouched, there emerges a guiding light in the form of Norm Goldstein, the Founder and CEO of EduNetwork Partners. His dedication to this cause has earned him recognition as a Congressional Leadership Award recipient.
Unveiling the Dynamic Personalities, Key Dates, and Horoscope Insights: Gemin...my Pandit
Explore the fascinating world of the Gemini Zodiac Sign. Discover the unique personality traits, key dates, and horoscope insights of Gemini individuals. Learn how their sociable, communicative nature and boundless curiosity make them the dynamic explorers of the zodiac. Dive into the duality of the Gemini sign and understand their intellectual and adventurous spirit.
Brian Fitzsimmons on the Business Strategy and Content Flywheel of Barstool S...Neil Horowitz
On episode 272 of the Digital and Social Media Sports Podcast, Neil chatted with Brian Fitzsimmons, Director of Licensing and Business Development for Barstool Sports.
What follows is a collection of snippets from the podcast. To hear the full interview and more, check out the podcast on all podcast platforms and at www.dsmsports.net
Storytelling is an incredibly valuable tool to share data and information. To get the most impact from stories there are a number of key ingredients. These are based on science and human nature. Using these elements in a story you can deliver information impactfully, ensure action and drive change.
❼❷⓿❺❻❷❽❷❼❽ Dpboss Matka Result Satta Matka Guessing Satta Fix jodi Kalyan Final ank Satta Matka Dpbos Final ank Satta Matta Matka 143 Kalyan Matka Guessing Final Matka Final ank Today Matka 420 Satta Batta Satta 143 Kalyan Chart Main Bazar Chart vip Matka Guessing Dpboss 143 Guessing Kalyan night