The ability of current statistical classifications to separateservices and manufacturing

This paper explores the performance of current statistical classification systems in classifying firms and, in particular, their ability to distinguish between firms that provide services and firms that provide manufacturing. We find that a large share of firms, almost 20%, are not classified as expected based on a comparison of their statements of activities with the assigned industry codes. This result is robust to analyses on different levels of aggregation and is validated in an additional survey. It is well known from earlier literature that industry classification systems are not perfect. This paper provides a quantification of the flaws in classifications of firms. Moreover, it is explained why the classifications of firms are imprecise. The increasing complexity of production, inertia in changes to statistical systems and the increasing integration of manufacturing products and services are some of the primary and interrelated explanations for this lack of precision. We emphasise, however, that such classification problems are not resolved using a ‘technical fix’. Any statistical classification method involves a number of tradeoffs.

Recommended
Recommended
More Related Content
What's hot
What's hot (10)
Viewers also liked
Viewers also liked (20)
Similar to The ability of current statistical classifications to separateservices and manufacturing
Similar to The ability of current statistical classifications to separateservices and manufacturing (20)
More from Ian McCarthy
More from Ian McCarthy (20)
Recently uploaded
Recently uploaded (20)
The ability of current statistical classifications to separateservices and manufacturing
- 1. Structural Change and Economic Dynamics 26 (2013) 47–60 Contents lists available at SciVerse ScienceDirect Structural Change and Economic Dynamics journal homepage: www.elsevier.com/locate/sced The ability of current statistical classifications to separate services and manufacturing Jesper Lindgaard Christensen∗ Aalborg University, Department of Business and Management, Fibigerstraede 11, 9220 Aalborg OE, Denmark a r t i c l e i n f o Article history: Received July 2010 Received in revised form May 2013 Accepted June 2013 Available online xxx JEL classification: C81 L10 L80 E01 Keywords: Industry classification Services Industrial dynamics a b s t r a c t This paper explores the performance of current statistical classification systems in classify- ing firms and, in particular, their ability to distinguish between firms that provide services and firms that provide manufacturing. We find that a large share of firms, almost 20%, are not classified as expected based on a comparison of their statements of activities with the assigned industry codes. This result is robust to analyses on different levels of aggregation and is validated in an additional survey. It is well known from earlier literature that industry classification systems are not perfect. This paper provides a quantification of the flaws in classifications of firms. Moreover, it is explained why the classifications of firms are impre- cise. The increasing complexity of production, inertia in changes to statistical systems and the increasing integration of manufacturing products and services are some of the primary and interrelated explanations for this lack of precision. We emphasise, however, that such classification problems are not resolved using a ‘technical fix’. Any statistical classification method involves a number of tradeoffs. © 2013 Elsevier B.V. All rights reserved. 1. Introduction Statistical classification systems are useful for identi- fying specific features of firms, certain segments of the economy, and the dynamics and structures of the economy. These classifications have been developed over hundreds of years, and they are used by multiple organisations for busi- ness, policies, planning, and research purposes. Therefore, the design and accuracy of industry classifications is impor- tant to our understanding of the structure and dynamics of the economy. In turn, the data used for prediction and pol- icy are influenced by these classifications. However, both the design of classification systems and their accuracy have been questioned (Jacobs and O’Neil, 2003; Clarke, 1989; Kahle and Walkling, 1996; Bhojraj et al., 2003; McKelvey, 1982; Hicks, 2011). There are relatively few previous stud- ies on this subject, but they have generally identified a ∗ Tel.: +45 99408261; fax: +45 98156013. E-mail address: jlc@business.aau.dk number of problems with the current statistical classifi- cations. The present paper follows these earlier contributions, by showing that industry codes do not precisely describe the activities of firms. Some of this lack of precision is because the nature of economic activities crosses the classi- fications of statistical systems. For example, firms classified as service firms do not generate their turnover only from service activities, and a considerable proportion of man- ufacturing firms conduct a substantial amount of service activities. Other, frequently overlooked, explanations for this lack of precision in the statistical classifications are explored later in this paper. The paper provides the first quantification of this phenomenon. In a sense, this paper extends a well-known statement by J.M. Keynes: ‘It may be better to be roughly right than exactly wrong.’ This paper considers exactly how ‘roughly right’ the current statistical classifications are. Previous studies have primarily used case studies to conclude that firms that are classified as manufacturing firms also provide services. Services and manufacturing 0954-349X/$ – see front matter © 2013 Elsevier B.V. All rights reserved. http://dx.doi.org/10.1016/j.strueco.2013.06.002
- 2. 48 J.L. Christensen / Structural Change and Economic Dynamics 26 (2013) 47–60 products are increasingly interwoven and are difficult to separate statistically. With the exception of a few studies that have used input–output data to demon- strate the services embodied in manufacturing products (e.g., Pilat and Wölfl, 2005; McCarthy and Anagnostou, 2004), few quantitative studies examine the severity of this measurement problem. Earlier studies have primarily investigated specific sub-industries rather than the whole economy. This paper incorporates all industries in the pri- vate sector but concentrates primarily on the distinction between services and manufacturing, because this discus- sion has been an important and recurrent issue in academic debates. An examination of the extent to which the present statistics place firms in the correct ‘box’ is at the heart of this research as are explanations why this may not be the case. Furthermore, we examine whether it is possible to distin- guish between services and manufacturing in a meaningful way. There may be anecdotal evidence that manufactur- ing products and services are linked, but the extent of this effect requires further investigation (Guerriere and Meliciani, 2005). We note that the inadequate precision of statistical classifications is not only a question of tech- nicalities and resources, but it also involves fundamental choices regarding the criteria for classification and the limitations of separating complex economic activities into pre-determined boxes. On a more general level, this paper is also concerned with the fundamental premise in the classical writings on classifications (e.g., McKelvey, 1982): to classify organi- sations in homogeneous sub-populations, it is necessary to develop an understanding of diversity so that unifor- mities across organisations can be understood. This paper will not examine the science of classification and the clas- sification of classifications (Good, 1965), which has been thoroughly discussed in biology, especially from the 1960s to the early 1980s.1 However, we will address the fun- damental question of the criteria for drawing boundaries between industries. This paper begins by reviewing existing classification criteria and subsequently discusses the basic problems, as they are described in the literature. We then empiri- cally explore potential problems with misclassification and indicate the industries in which these problems may be particularly severe. This discussion is followed by a review of three possible explanations for misclassification. First, we suggest that firm activities may not only be difficult to classify, but they may also be interwoven, further compli- cating precise classifications. Second, the flaws in technical assignation are assessed. Third, we test whether the find- ings are robust to introducing more than one industry code for a firm. Although these three possible explana- tions are interlinked, they are presented separately for expository reasons. The last section sums up our conclu- sions and discusses both the direct implications and the broader issues regarding the criteria for the classification of firms. 1 See McCarthy (1995) for an overview. 2. Criteria for classifications Sector and industry breakdowns and the size distribu- tion of firms are two of the most important and widely used segmentations of the industrial structure. Other classifica- tions that are frequently used in industrial economics and innovation studies include Pavitt’s taxonomy of sectoral technological regimes, the specialisation patterns of indus- tries or trade, and high vs. low-tech industries. Peneder (2003) provides an overview of some industry taxonomies that are focused upon technology and their techniques but does not mention the lack of precision in these classifica- tions stemming from incorrect industry codes. McCarthy (1995) explains the vocabulary behind the classifications and indicates why classifications are useful. The objective of grouping firms into different classes is to compile groups of firms that are similar in key dimen- sions. Statistical classifications strive to provide exhaustive coverage of the observed universe. Classifications therefore involve mutually exclusive categories and use methodolo- gies that allow for the consistent allocation of the entities observed. Industrial classifications look for similarity in labour and raw material inputs, production processes, and the services and products produced. If these activities are integrated into the same statistical unit, the combination is regarded as one activity (Eurostat, 2008). A fundamental point of departure for these classification systems is their criteria for classification. Some classifica- tions use the product range of the industries as a point of departure, whereas others find technology to be a more appropriate classification criterion. Despite attempts to introduce consistency to industrial classification systems and to classify firms by their type of economic activity, a lack of precision persists in the principles of classification. Therefore, substantial variance exists in the classification of firms by their end products, activities, end use, raw materials or market (U.S. Department of Labor, 2001). Each criterion could be argued to be correct, but it is difficult to argue that the system is consistent if all of these criteria are used simultaneously. As will become evident from Section 3, the literature has pointed to the difficulties and lack of precision in the industry classifications using existing classification crite- ria. The next question is, of course, what are alternative classification criteria? Hicks (2011) review both a production oriented (NAICS) and a demand oriented classification system (Global Indus- try Classification Standard – GICS) and finds that neither of them performs satisfactory. Although recognizing that classification systems cannot precisely reflect reality per- fectly it is argued that the current schemes could be improved and that a new generation of classifications should avoid the mistakes entailed in the present system. It is maintained in a paper by Dalziel (2007) that the challenges facing classification systems are much larger today due to more complex products and services, and increasing interfirm relations. A demand-based system would in her opinion better capture these phenomenon. An alternative method of classifying firms is to consider their relationships rather than focusing on their charac- teristics and the goods or services they produce. Thus, an
- 3. J.L. Christensen / Structural Change and Economic Dynamics 26 (2013) 47–60 49 industry would be, for example, a set of interdependent firms, in Cubbin’s (2001) view. Proponents of this approach argue that classification based on processes rather than products exhibits greater continuity because processes are generally more generic and have lower turnover than prod- ucts. Carroll et al. (2000) and Peneder (2003) focuses upon taxonomies often used in empirical studies of the techno- logical content of industries and point to the heterogeneity often hidden within the categories used. Although an integrated approach would be desirable, separate classifi- cations for manufacturing and services could be considered because of their huge differences in technology and market environments. 3. The efficacy of industry classification systems and the boundaries between industries in previous literature Two closely interrelated issues dominate the discussion on the precision of industrial classifications. The first issue is the extent to which it is possible and meaningful to sep- arate the manufacturing and service industries. Another issue is the technical precision related to assigning indus- try codes to firms. These issues are addressed here with an emphasis on the boundaries between manufacturing and services and the criteria for the classification systems. The issue of technical assignation is kept brief here and elaborated later in the paper. 3.1. Precision of the classification of firms Debates continue over whether the current statistical classifications adequately capture an accurate and relevant segmentation of firms. This debate was noted as early as 1975 (Fertuck, 1975), but relatively few contributions in the literature have addressed this issue. Clarke (1989) exam- ined whether industry codes are useful for grouping firms into homogeneous segments. He concluded that firms with similar characteristics are not easily identified when using only industry codes, especially 1- or 2-digit codes, as classi- fication devices. Dahlstedt et al. (1994) found in their study that industry classifications differed to an extent that could render comparisons between industries misleading. Kahle and Walkling (1996) compared two databases and found that at the two-digit level, there was a 36% difference in the classification of firms, which increased to 80% at the four- digit level. Bhojraj et al. (2003) compared NAICS (North American Industry Classification System), and GICS (Global Industry Classifications Standard) classifications and found that GICS performed better in classifying firms based on financial data and may be a better choice for financial ana- lysts. The literature points to numerous examples of inac- curate industry classifications. Livesey (2006, p. 8) noted that software delivered on CD-ROMs or disks is classified as manufacturing, but the same software is classified as a service if it is delivered through the Internet. Timber meant for furniture may be classified as manufacturing, but it is classified as construction if it is used to build houses. Dalziel (2007) listed several examples in which firms are classified without obvious logic. For example, the eight leading com- munication equipment manufacturers are classified into four different industries and two different sectors. A few cases of inconsistent allocation would not pose problems for the analysis of industries, but if this phenomenon is pervasive, misleading perceptions of the industry structure and dynamics may result. Generally, tests of the efficacy of classification schemes have used an ‘internal benchmarking’ approach that compares across different classification schemes if these schemes group firms consistently. In some cases, these studies apply one or more validation variables, such as financial ratios (e.g., Guenther and Rosman, 1994; Bhojraj et al., 2003; Hicks, 2011). Although this is a valid exercise that may illuminate some of the necessary choices between classification schemes, it does not solve the fundamental conceptual issue of expedient criteria for classification. Hicks (2011) noted that classification systems differ in their ability to precisely classify firms, and she main- tained that the categories of the current statistical system are inadequate to describe the modern economy. New industries emerge at a pace that significantly exceeds the changes in statistical systems (Graham et al., 2007). Moreover, there is an unbalanced structure in the system because some industries with little weight in the economy have fine-grained categories that differentiate between sub-industries, whereas other industries with much larger economic weight are pooled into broad categories (Hicks, 2011). The examples of inaccurate classifications mentioned above might be partly explained as a technical problem related to the assignment of industry codes. However, other phenomena may distort the precise allocation of types of activities in the economy. Such phenomena include blurred boundaries between industries due to multiple activities, the convergence of industries, and inter-related activi- ties. In contrast, some features of the current organisation of production contribute to clearer boundaries between industries. 3.2. Multiple types of activities in firms Firms are often understood to belong to a certain indus- try and to perform activities typical of that industry. In reality, most firms perform a range of activities that can be assigned to industries other than the one indicated by their primary industry code. Services may be attributed to the service sector of the economy when they are performed by specialised service firms; however, the service function and service products may be generated in all firms in an economy regardless of their statistical classification. These activities may span traditional statistical classifications. It is difficult to quantitatively study these activities at an aggre- gated level because firms are usually grouped according to the product in their product portfolio that produces the highest revenue. As a result, the phrase ‘growth of the service economy’ (Fuchs, 1965; Greenfield, 1966; Gershuny and Miles, 1983) may have dual meanings. This phrase encompasses not only the growth of the service industry as a group of specialised service providers but also the fact that services,
- 4. 50 J.L. Christensen / Structural Change and Economic Dynamics 26 (2013) 47–60 as a function, may have increased in the economy as a whole. Many functions are generic, which means that activities that are strictly industry related are reduced to a smaller share of the total activities of the firm. The trend towards more complex and cross-disciplinary production processes means that both the knowledge bases and the pure activities of the firm span a range of different types of processes, thereby complicating the design of a classifi- cation system that reflects the industry structure (Dalziel, 2007). Consequently, it may be necessary to relax the sharp distinction between industries (e.g., manufacturing and services) because of the widespread presence of service activities in non-service sectors (Nählinder, 2005) and because empirical findings suggest a similarity between some types of service industries and manufacturing industries (Preissl, 2000). 3.3. Convergence of industries Related to the discussion above, some studies have noted a convergence between services and manufactur- ing (Coombs and Miles, 2000; Gallouj and Weinstein, 1997; Pilat et al., 2006). The manufacturing sector adopts charac- teristics of service firms and has a growing share of revenue from services. Moreover, the service sector has an increas- ing impact on other sectors. The similarity of production modes in manufacturing and services suggest that manu- facturing and service are becoming similar. Some firms that are classified as manufacturing generate large amounts of their turnover by selling services, as illustrated by Howells (2004), who reports that firms such as IBM and Siemens derive more than 50% of their turnover from service activ- ities. AEGIS (2002) found that services are essential inputs for all modern manufacturing, often accounting for 60–75% of input costs. Pilat and Wölfl (2005) confirmed this find- ing, observing that workers in firms in the manufacturing industry are increasingly occupied with service activities. In some countries, up to half of these workers are engaged in services. Consequently, the statistical classifications of firms and industries into either manufacturing or services makes it difficult to statistically aggregate activities, and indeed this problem is enhanced when service and manufactur- ing activities are intertwined. Related, Howells relates the increasing focus on service activities in manufacturing to a change in the perception of consumption, with a growing tendency to perceive consumption as a continuing pro- cess involving long-term customer contact through service delivery rather than as a one-off contact through a product sale. Howells argues that the shift in selling and consump- tion may increase firms’ concerns about reliability and ease of servicing because these firms may eventually have to bear the costs of these activities. 3.4. Interwoven products and services In the same way that manufacturing companies increas- ingly link services to their production, service firms have become more engaged in delivering physical products as part of a service package or support for a service, and provides firms with a competitive edge (Nordås and Kim, 2013). There is a significant amount of interdependence between the two sectors because many products com- prise both a tangible product and services (such as training, maintenance), that are sold in packages delivery (Howells, 2004; Sundbo, 2001). Examples of the complementari- ties between tangible and service products include the increased tendency to sell all-coverage insurance together with electronics or the service programme and the (differ- entiated) guarantee offered with a new car. In the latter example, a range of services may be offered, such as financing and maintenance services. Manufacturing firms have increasingly integrated products and services as part of their strategy, which contribute to removing barriers between industries (AEGIS, 2002). In some cases it may even be difficult to distinguish between products and ser- vices that are packaged together. A mobile telephone sold with a subscription could be seen as both a product with a service and a service with a product. The price structure of the product/service in this example is not very helpful in determining how it should be classified because the price is often advertised as a skewed distribution; for example, the phone may cost 1 Euro, with the subscription garnering all of the revenue for the seller. 3.5. More focus – clearer boundaries? Another trend in the organisation of production is moving in the opposite direction by providing clearer boundaries between industries. Following a period in the 1970s and 1980s in which leading firms engaged in ver- tical integration and ‘big is beautiful’ was the mantra, there has been an increasing tendency to outsource and focus on core capabilities (Carlsson, 1989; McCarthy and Anagnostou, 2004). Instead of firms attempting to acquire control over more parts of the value chain through owner- ship by vertical integration, strategic sourcing (Venkatesan, 1992) has become popular. In addition to a cost-reduction element, surveys among outsourcing firms generally men- tion a “focus on core activities” as a motive for outsourcing, in line with the strategic sourcing trend. Whereas out- sourcing was once primarily confined to low-skill activities, it has recently become prevalent in knowledge-intensive activities. This change points to a clearer division of labour between firms in the value chain as well as the possibility of a clearer statistical separation between manufacturing and service activities. Some of the growth of the service sector may thus be ascribed to the statistical separation and re-grouping of activities that have not necessarily increased in quan- tity (OECD, 1999). However, according to Schettkat and Yocarini (2006), this effect is not very significant. Although outsourcing increased service employment, it explains lit- tle of the shift from manufacturing to service employment. It is possible. However, that this clearer separation between activities is only legal in nature. The activities are separated to a greater extent in different entities, but, at the same time, these same entities interact and trade intensively and in complex ways, and they may even have cross- ownership. Moreover, some of this clearer separation of activities occurs between different establishments within the same firm and in conglomerates of firms.
- 5. J.L. Christensen / Structural Change and Economic Dynamics 26 (2013) 47–60 51 Clearer boundaries may also stem from a trend towards ‘down-sizing.’ In some firms, there has been a counter- reaction to mergers and larger entities. To ensure an entrepreneurial culture in the firm, some firms attempt to keep the size of units down, in some cases, even splitting divisions as soon as they exceed a certain threshold size. Modularisation is another trend that may spur a clearer separation of different parts of the value chain. Finally, as production becomes increasingly specialised, the division of labour increases, which may produce a clearer separa- tion between activity types. Thus, a growing body of evidence suggests increas- ingly blurred boundaries between industries, whereas other trends point in the direction of a clearer separation between manufacturing and services. Although the struc- ture and divisions between industries may be difficult to determine when coupled with problems with the assign- ment of individual firms to industries, this difficulty is often compounded by insufficient studies on the dynamics of industries. Service researchers have argued that the extent of service activities, such as new forms of organisation, new types of customer relations and delivery, and new package solutions, has not been adequately measured in existing empirical studies. Furthermore, these researchers suggest that studying the dynamics of services is distinctly differ- ent from studying manufacturing innovation (Sundbo and Gallouj, 1998; Coombs and Miles, 2000; Djellal and Gallouj, 2001). Based on the above discussion, the borders between service and manufacturing activities appear to be diffi- cult to determine using existing statistics. Furthermore, the extent to which it is meaningful to separate manu- facturing and services is questionable. These two sectors may converge due to an increased focus on selling solu- tions rather than products (Vandermerwe and Rada, 1988; Coombs and Miles, 2000; Gallouj and Weinstein, 1997), and the two main sectors have similar dynamics (Howells, 2006). Therefore, more precise knowledge on the extent of this problem is desirable. 4. Empirical study of classifications of firms 4.1. Classification criteria Based on survey data from Denmark, this section explores the extent of the blurred boundaries between industries and the ability of a statistical system to ade- quately describe the type of activity in firms. To classify firms this investigation uses information obtained directly from interviews with firms on their share of activities classified as respectively services, and the production of tangible products. Hence, our classification criteria in the survey are the firms’ self-perception of what they do; and how much of their activities should be grouped in two types of activities: production and services. This information is compared to firms’ official industry codes according to the NACE (European Classification of Economic Activities) clas- sification system. In the NACE system, the value added is the primary crite- rion when industry codes are assigned. Firms with activities covering several parts of the value chain or firms with horizontal integration should be classified according to the part that contributes the most to the total value added rather than according to the end-product. This method is straightforward when an activity represents more than 50% of the value added. In cases where a unit performs more than two activities in more than two NACE categories and none of these exceeds half of the value added, the ‘top- down’ method is used to identify the primary activity (see, e.g., Eurostat, 2008). 4.2. The data The main information on firms’ activities was drawn from telephone interviews with representative panel of managers of 1007 private firms in Denmark. This data col- lection was part of a survey on the business cycle but included a few questions on the nature of firms’ activ- ities. These questions were specifically designed for the purposes of the present paper. Respondents were asked to characterise and quantify the activities of the firm into ser- vices, production of tangibles, and other activities. In turn, these data were compared with the firms’ official industry codes. Firms throughout the entire private sector with at least 5 employees were selected. Within this segment, the samp- ling was random. The data were subsequently weighted by size (employment) and industry. Comparing the realised sample with the population by size and industry groups revealed that the realised sample closely reflected the pop- ulation, with deviations up to 4%. The composition of the panel was regularly adjusted to ensure representativeness, and it was possible to dynamically adjust the interviews according to possible skewness. The take-up rate was sat- isfactory, and the interviewed firms represented more than 20% of employment. In summary, the data were balanced and representative for the purposes of this study. Respondents should be able to provide valid answers to interview questions. Although there may be differences between firms in the perception of products and services, two points indicate that this was not a significant issue in this study. First, as shown in Table 1, only 2% of the respon- dents answered ‘Do not know/other’. Second, debriefing with the interviewers revealed that respondents had no problems in understanding or categorisation. 4.3. Industry classification and firms’ own views of their activities Tables 1 and 2 list the share of firms that assigned a percentage of their activities to ‘services’ and ‘production’, respectively (the residual ‘other’ was listed by very few firms). These statements were compared with the assigned industry codes following the NACE classification system. The data were grouped into the firms within an industry or size group with no services, 1–49% services, 50–99% ser- vices, and 100% services. A similar grouping was applied for production. This method allowed us to compare the data to the “officially” assigned industry codes. The results are displayed in Table 1 (services) and Table 2 (production). The two tables show that 32% of the firms had both service and production activities. This result indicates that
- 6. 52 J.L. Christensen / Structural Change and Economic Dynamics 26 (2013) 47–60 Table 1 Share of activities listed as services, by industries and size groups. Sector affiliation of the responding firm No service 1–49% 50–99% 100% Don’t know/other Number of cases Agriculture, fisheries, raw materials 46 20 15 18 43 Industry 41 35 14 10 1 226 Building and construction 7 18 30 41 4 153 Trade and restaurants 7 10 17 65 1 326 Transport and telecommunications 1 5 94 59 Finance, business services 3 6 16 72 2 200 5–10 employees 11 10 19 58 2 401 10–19 employees 13 17 19 49 2 279 20–49 employees 18 23 14 46 177 50–100 employees 31 22 11 33 2 91 >101 employees 38 26 9 24 3 34 Total 15 15 17 51 2 1007 a classification system based upon distinguishing between services and manufacturing will have difficulty consis- tently allocating a third of the firms in the economy. In the area of Industry, half of the firms had both types of activities. Table 1 shows that half of the firms in the survey (51%) are classified as pure service firms, and two-thirds (68%) listed the majority of their activities as services. Fur- thermore, 18% of the firms in Agriculture, Fisheries, and Raw materials and 10% of the firms classified as Industry characterised all of their activities as services. Many firms in areas that are usually regarded as production-intensive sectors listed service as 50% or more of their total activities. Thus, a large share of firms – 33%, 24% and 71% in Agricul- ture, Fisheries, and Raw Materials, Industry, and Building and Construction, respectively, claimed that at least half of their activities were services rather than production. Accordingly, these firms should be classified as services if the term “activities”, as reported by the firms, is used as the sole criterion for classification. The propensity to list activities as pure services decreases with firm size, which may be explained by the fact that many large firms are multi-product firms that include either different and complementary products or more than one link in the value chain. The larger share of service activities in large firms may also indicate that these firms are more complex organisations that must engage in auxiliary activities, such as human resource management. Large firms may also have internal functions that would otherwise be acquired from external providers, such as IT, building and machinery maintenance. Finally, the size effect may be explained by the fact that service firms are generally smaller and are therefore more likely to fall into this group. We now consider firms’ propensity to list production as the main activity. Table 2 mirrors Table 1, to some extent, it also supplements the insights of Table 1. The first result worth noting is that there is a remarkable difference between the share of firms with no produc- tion (53%) and those with no services (15%). The most obvious explanation for this difference is that manu- facturing firms are dependent on a number of service activities that are integrated through in-house production. In addition to the examples mentioned above, infor- mation processing is another such service activity. This finding may also be interpreted in line with the find- ings in Pilat and Wölfl (2005), which suggest that the service sector is more independent of other industries than the manufacturing sector. This may be because service firms often source inputs to their activities from the sector itself, whereas manufacturing industries are dependent upon inputs from other industries, including service industries, and act as providers of intermediate inputs. As expected, the table shows that firms in Industry and in Agriculture, Fisheries and Raw Materials list produc- tion more frequently than do firms in other industries. However, even within these industries, 18% and 11% of firms, respectively, list ‘no production’ corresponding to the shares listed in Table 1 (18% and 10% under ‘100% service’). Furthermore, in these two sectors, 25% and 19% of firms, respectively, characterise more than half of their activities as outside manufacturing. Again, Building and Construction appears to be dominated by activities that are not considered manufacturing by the firms themselves. In 65% of the firms in Building and Construction, a minimum of 50% of the activities are primarily outside production. Probably maintenance and repairs are considered services by the firms, whereas the construction of houses, for exam- ple, is seen as production because it involves the creation of new, tangible goods. As also expected, production by firm size produces results opposite those of the accounts of ser- vices: smaller firms are less ‘manufacturing intensive’. This finding is consistent with the fact that service firms are usually relatively small. This discussion has indicated the shares of firms in dif- ferent industries by categories of activities and has allowed us to specify the share of firms that are classified in industries that intuitively do not correspond to their self- reported, dominant activities. In addition to categories of activities, we are interested in the precise share of eco- nomic activity ascribed to services and manufacturing. The mean values for the share of activities characterised by the firms as services (Table 3) show that two-thirds of the eco- nomic activity in the private sector involves services. This result corresponds to the findings of Pilat and Wölfl (2005), who contend that approximately 70% of all employment is workers who are employed in the service sector, and 66% of employment is required to meet the final demand for
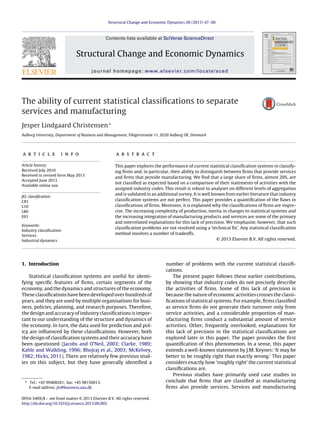
- 7. J.L. Christensen / Structural Change and Economic Dynamics 26 (2013) 47–60 53 Table 2 Share of activities listed as production, by industries and size groups. Sector affiliation of the responding firm No production 1–49% 50–99% 100% Don’t know/other Number of cases Agriculture, fisheries, raw materials 18 7 29 46 43 Industry 11 8 40 41 1 226 Building and construction 46 19 24 7 4 153 Trade and restaurants 67 11 14 6 1 326 Transport and telecommunications 96 3 1 59 Finance, business services 73 8 14 3 2 200 5–10 employees 59 11 17 10 2 401 10–19 employees 53 10 23 12 2 279 20–49 employees 47 9 25 18 177 50–100 employees 32 8 26 31 2 91 101–199 employees 24 6 29 38 3 34 Total 53 11 21 14 2 1007 Table 3 Means of the share of activities listed as services, by industries and size groups. Sector affiliation of the responding firm Mean Number of cases Agriculture, fisheries, raw materials 30 43 Industry 23 226 Building and construction 65 153 Trade and restaurants 79 326 Transport and telecommunications 99 59 Finance, business services 84 200 5–10 employees 72 401 10–19 employees 65 279 20–49 employees 59 177 50–100 employees 44 91 >101 employees 33 34 Total 66 1007 services.2 An industry breakdown shows results in line with those discussed above. For example, firms in Industry claim that one-fourth of their activities are services,3 and Building and Construction firms characterise two-thirds of their activities as services. These results indicate that there is substantial sectoral heterogeneity, especially in the two ‘production’ sectors. This heterogeneity becomes particularly visible when we plot the firms’ responses against their designated industry codes (Fig. 1). If we interpret Industry and Agriculture, Fish- eries and Raw Materials as manufacturing industries, then the dotted vertical line separates manufacturing and ser- vices. The y-axis to the left of the line includes firms with NACE codes 11–39, with the remainder of the firms to the right. A total of 181 firms in the top left quadrant and the bottom right quadrant are classified in industries that we 2 Similar figures for the manufacturing industries in their study are 18% and 22%. Their numbers are for France, but the authors claim that simi- lar numbers are found in all countries for which there are input–output tables. 3 A somewhat comparable study in four OECD countries (Finland, Sweden, Japan, New Zealand) found that the share of service activity in manufacturing is increasing (Pilat and Wölfl, 2005). Another OECD study (Pilat et al., 2006) found that in the manufacturing sector in 13 Euro- pean countries, only 60% of workers were engaged in production in 2002. Using employment data, that study also found an increase in the share of employment in service-related occupations since 1995, although a decline was noted in a few countries. This increase may be even higher over a long-term perspective. typically do not relate to what they claim are their main activity. Thus, the manufacturing firms have over half of their activities in services and the service firms have less than 50% of their activities in service. Hence, although the term ‘misclassified’ may be too strong, the total share of misclassified firms is 18% (181/1007). Fig. 1 illustrates that there are differences across indus- tries in how many firms are classified outside their main activity (in the following these firms are for simplicity termed ‘misclassified’, even if this indicates that the NACE classification is unable to correctly classify firms). The Transport and Telecommunications and Finance and Busi- ness Services industries have the greatest number of firms that are assigned the correct industry codes. One-fourth or more of the firms in the Agriculture, Fisheries and Raw Materials, Industry and Building and Construction sectors were ‘misclassified’. This intra-industry heterogeneity is potentially important because it may indicate that ‘mis- classification’ problems are confined to specific segments or types of firms.4 Further fine-grained analyses of the data may reveal whether specific firms within these broad cat- egories are ‘misclassified’ particularly often. The high level of aggregation of this analysis may poten- tially obscure the fact that some of the 181 apparently ‘misclassified’ firms may be in industries that would cor- respond to the activities, as stated by the firms, at a more detailed level of aggregation. For example, the three two- digit industries Building and Construction, Agriculture, and Industry all include sub-industries that can be expected to be dominated by service activities, such as machin- ery rentals, maintenance and repair, and branch-specific consultancy.5 To control for this possible source of error, the 181 firms that were apparently misclassified were ana- lysed further using their 6-digit industry codes. An analysis of industry differences based upon the NACE 6-digit level 4 According to Statistics Denmark, small firms are categorised into the wrong industry group more often than large firms. Therefore, the share of turnover or employment in the economy classified in the wrong industry is smaller than the share of firms. Comparing the average size of firms in the ‘181/misclassified’ group with the rest of the firms reveals that the misclassified firms are indeed smaller. 5 A communication with Statistics Denmark indicated that quality checks have revealed a marked effect from the aggregation level of anal- ysis on the number of firms that are placed in the wrong group.
- 8. 54 J.L. Christensen / Structural Change and Economic Dynamics 26 (2013) 47–60 Fig. 1. Plot of share of service activities against NACE codes. of aggregation reveals that a broad variety of firms shows to be ‘misclassified’. Omitting Building and Construction, which was mentioned above as an industry that could be regarded as belonging to either manufacturing or services, then industries such as Bakeries, Publishing/Printing, and Machine processing pop up as some of the most frequently ‘misclassified’ firms. The firms’ responses regarding the share of service activities were compared to the industry code and were manually assessed to determine whether their industry codes corresponded to their responses about the type of their activities. After removing 10 firms that lacked a 6-digit industry code and 6 firms with invalid answers, we identified 16 firms that could be considered misclassified by a 2-digit industry code, but perhaps not at a more detailed level. These firms were agricultural contrac- tors, engine repair, landscape gardening (1 firm), pre-press work (1 firm), software (which could be classified in either group) (3 firms), and non-financial holding companies (not specified; could be classified in either group) (4 firms). Thus, we identified at least 149 (181 − 32) misclassified firms at the more detailed level. Vice versa it may be that some of the firms that were found to be correctly classified in the 2-digit analysis were, in fact, misclassified. Therefore, the rest of the sample was analysed using the 6-digit codes. Omitting firms without 6-digit codes or invalid percentages of service activities, an additional 50 firms were found to be misclassified, rendering a total of 199 misclassified firms. Because the denominator was reduced to 893 due to the subtraction of missing or invalid values, we found that 22% of the firms were misclassified. As mentioned above, the Build- ing and Construction industry may be a grey area in which firms could be perceived as either production or services. Removing Building and Construction from the analysis resulted in 151 misclassified firms out of 785 (19%). Thus, this robustness analysis suggests that the results do not change significantly with the use of more detailed indus- try codes. Slightly less than one in five firms claim that the majority of their activities are services even if they are clas- sified as manufacturing or that their activities are primarily production even if they are officially listed as service firms. An additional validation was performed using a similar sur- vey of another segment of firms. This analysis is reported in Annex B. We have established that a substantial share of firms were misclassified. The analysis was based upon a compar- ison of the primary NACE codes from the business register and the firms’ claims regarding their activities. In Section 5, we examine this result further with a view to try out plausible explanations. 5. Discussion: possible explanations of misclassifications The literature indicates that there are currently many interwoven activities in production and suggests that this situation presents a challenge to any classification sys- tem, particularly when the primary classification criterion involves production. Another possible explanation is that the assignation of industry codes is not precise. A third pos- sible explanation is that firms may have more than one industry code; in this case, analysing all of the codes rather than only the primary code could potentially change the results regarding the classifications. Even if these explanations are presented separately they are fundamentally inter-linked and reflect the general dif- ficulty in separating what firms do in well-defined boxes. These difficulties emanate at different levels and perspec- tives, such as at the level of the single product and the level of the firm. Likewise, both the firm and statistical offices have difficulties assigning the activities of the firm to the correct ‘boxes’. 5.1. Interwoven activities The integration of products and services complicates a statistical separation of the two. It is problematic at two levels of aggregation; on a product level the bundling and integration of products and services contributes to blur- ring boundaries between statistical groups; and on a firm
- 9. J.L. Christensen / Structural Change and Economic Dynamics 26 (2013) 47–60 55 level the fact that many firms do both also means that it is increasingly difficult to assign firms to specific industries. The servitizationdebate(Vandermerweand Rada, 1988; Baines et al., 2009; Santamaría et al., 2012; Lodefalk, 2013) may be evidence on the tight coupling of services and man- ufacturing. This debate got momentum in the late 1980s, especially with the Vandermerwe and Rada 1988-paper that defined the concept in the title: adding value (to prod- ucts) be adding services. Thus, the literature focuses on how product offerings are often sold together with ser- vices, which partly reflects an increasing complexity in consumer demands, but indeed also is created by firms who engage in maintaining competitive advantage through offering complex product-services (Nordås and Kim, 2013). The interwoven product-services hence pose challenges to firms’ strategic orientation, as they are no longer solely pro- ducers but also service providers. As part of a strategy an intertwined product-service may be a way to enhance cos- tumer loyalty and differentiate products. Moreover, it has been said to be a way to sustain growth in mature industries (Santamaría et al., 2012), and it has caused many manufac- turing firms to move massively into services (Baines et al., 2009). Among several researchers, Sundbo (2001) notes that services may be sold as part of a package that involves both pure services and tangibles. To investigate if this phenomenon is also present in the Danish context, we conducted a survey of knowledge-intensive services in Denmark, as described in Annex B. The survey asked respondents in these firms whether products and services were developed and delivered in the form of a package. The results show that 37% of the knowledge-intensive service firms that developed new services also developed services that were delivered as part of a product package including tangible products. Most often, the service firm itself supplied the product package that combined ser- vices and physical products, but in more than one out of four cases, another firm supplied the product package.6 A similar survey found that 24% of all Danish manufactur- ing firms developed one or more new services in relation to their product development (Christensen et al., 2004). A survey of 640 firms in the Agriculture, Fisheries and Forestry sector in Denmark found that 32% of these firms (240 firms) developed one or more new services that were delivered together with products (Christensen et al., 2011). This finding indicates that in a large share of the firms, the boundaries between production and services are obscured to such a degree that innovative activities combine tangible and intangible products. The empirical evidence referred to here suggests that it is a pervasive phenomenon that holds across size groups and sub-groups of the industry and in different industries. It should be noted that the question posed in the surveys only asked about new services. It is 6 A similar question was posed in the Danish Community Innovation Survey. The results of this survey show that 31% of innovative knowledge- intensive service firms introduced both new services and products in 2004–2006, and 26% claimed to have only introduced new products. Among manufacturing firms, 28% introduced both new products and ser- vices. An additional 6% of the manufacturing firms introduced only new services. likely that if the question were not limited to innovation, then the share of firms with combinations and packages would be much higher. This survey cannot indicate with certainty the extent of total revenues represented by these packages; we can only determine how many firms provided this type of packaged service or production. It is difficult to determine the extent of this source of misclassification, but our findings suggest that the interweaving of activities is a prevalent phenomenon and call into question the ratio- nale for maintaining a distinct separation of services and manufacturing. As discussed above, the tendency to outsource and focus on core activities has created a clearer distinction between manufacturing and services, whereas the trend towards selling solutions and complementary products rather than stand-alone, specific products tends to dissolve the bound- aries between industries. We are unable to distinguish between these two effects in the data or to assess the pos- sible development of these trends over time.7 However, we have identified solid evidence that the statistical clas- sification of firms and their activities do not necessarily correspond. 5.2. Assignation – a failure to capture industry characteristics? Difficulty in assigning industry codes is also related to the ever-increasing speed of change in industry structures and the upsurge of new products that may resist classifica- tion into existing statistical categories (Hicks, 2011). This is a recurrent problem faced by statistical bureaus. Fur- thermore, the industry code assigned to a firm may not be changed when the product range of the firm changes. Firms are not primarily concerned with verifying whether the industry codes in statistical accounts precisely reflect their changes in activities. Even if firms do change their primary or secondary industry codes, the codes are not always changed at a more detailed level. A study by Kahle and Walkling (1996) reported that changes in 4-digit codes occurred in only 24% of firms during a 20-year period.8 Bhojraj et al. (2003) found that in each of the years between 1994 and 2001, only 2.8% of Standard & Poor’s 1500 firms changed their industry codes. Industry codes may inade- quately reflect contemporary activity types, which makes it difficult to assign correct codes at a four-digit level, as demonstrated by Hicks (2011). Industry codes are primarily self-assigned by firms. Although some firms may seek advice in assigning the cor- rect industry code, one study has shown that many firms do not expend significant time or effort to calculate the correct code or to determine whether the available codes adequately describe the activities of the firm (Jacobs and 7 As mentioned above, a study in four OECD countries found that the share of service activity in manufacturing is increasing (Pilat and Wölfl, 2005). A number of earlier studies (see Mathe and Shapiro, 1993, for an overview) and, more recently, Pilat et al. (2006) have found that the amount of services included in manufacturing goods has risen over time. 8 Statistics Denmark has found that firms’ perceptions of their relevant classification do not always correspond with the criteria used by statistical bureaus.
- 10. 56 J.L. Christensen / Structural Change and Economic Dynamics 26 (2013) 47–60 Table 4 Secondary industry codes by industries’ share of firms listing minimum of 2 NACE codes. Percentages horizontally Secondary industry Primary industry Agricul F&B Iron Elec Other B&C Trade Transp. Finance Total Agriculture, fisheries, raw materials 26.07 0.29 1.50 0.16 0.86 15.87 10.53 1.50 43.21 5128 Food and beverages 2.79 35.41 1.93 0.43 51.93 0.43 7.08 466 Iron and metal 6.55 0.13 35.86 3.69 5.91 7.25 29.24 0.51 10.87 1573 Electronics 1.74 10.00 19.57 5.43 3.91 42.61 0.22 16.52 460 Other industry 3.70 0.77 3.10 .03 37.28 2.93 31.64 0.69 18.85 2323 Building and construction 12.54 0.03 3.67 0.95 2.42 33.66 17.12 2.80 26.80 3675 Trade and restaurants 4.33 0.89 2.05 0.80 3.36 3.09 57.74 2.16 25.58 10,259 Transport and telecommunications 9.20 0.21 0.90 0.48 0.83 6.85 27.46 25.31 28.77 1446 Finance, business services 6.56 0.15 0.64 0.41 3.70 4.23 22.13 1.95 60.23 14,427 Total 8.88 0.80 3.04 0.91 5.07 8.25 30.98 2.71 39.36 39,757 O’Neil, 2003). Consequently, industry codes do not change often, even if there are substantial changes in the orga- nisation of economic activities. Given the rapid change in industrial and economic structures and in the configuration of firms, industry codes should change frequently. As illus- trated above, however, this is not the case in practise. Again, it should also be re-iterated that there are inherent difficul- ties in separating manufacturing and service activities. In periods of rapid technological change fitting a product range to a category may prove difficult. Large con- glomerates and diversified companies, which may have substantial revenues in diverse product groups, often report only a few industry codes. According to Leiponen and Drejer (2007), very few firms diversify across 2-digit industries; even at more detailed levels of aggregation, only a minority of large firms are diversified. The ownership structure may also distort the interpretation of the data. As mentioned above, the financial sector may be registered as the owner of a significant amount of industrial activ- ity, as noted in the above discussion on outsourcing and the changing boundaries between manufacturing and ser- vices. For example, large manufacturing companies now have financial services, and they may provide a full range of services by bundling products and services. This process complicates the assignment of industry codes that reflect the true nature of these firms’ activities. Industry codes may differ according to the level of aggregation (Clarke, 1989; Kahle and Walkling, 1996). Clarke (1989, p. 21) presents an example of a 3-product firm to indicate the importance of the level of aggregation at which the match between industry codes and activities is analysed. He describes a firm with revenues stemming from three products, one from SIC 3211 (40%), one from SIC 2842 (30%) and one from SIC 2845 (30%). In this example, the correct four-digit industry code is 3211, the three-digit code is 321, and the two-digit code is 32, even though the majority of the firm’s revenues stem from SIC 284/28; firms are assigned codes in the primary activity, which is the one that generates the largest value added. How- ever, Clarke’s example is only relevant if the ‘bottom-up approach’ is used. The usual method of assignation is cur- rently the ‘top-down approach’, in which the contributions of related activities are added at a higher level of aggrega- tion in a hierarchical procedure. Using this approach would render the classification code 28 in the example above. However, this method is not without flaws. Fully diversified firms may not be assigned the most appropriate indus- try code. The method may result in higher-level industry codes that differ from the main activity of the firm. Even at a detailed level of aggregation, classification according to the top-down method may result in the assignment of a 4-digit code that differs from the largest 4-digit-level activity because of the need for consistency between assig- nations at different levels. Additionally, it is important to consider the level of units that are analysed. Generally, at the enterprise level, many details may be overlooked becausearangeofdifferentdivisionsmay encompassactiv- ities across different activity types.9 5.3. Are economic activities better reflected by several NACE codes? The majority of industry analyses are limited to only the primary industry code, and it is often the only information available to users of data. The use of the primary industry code only may potentially obscure an accurate understand- ing of firms’ economic activities. On the other hand, there may be cases where firms reported the industry codes for all of their major types of activities rather than only the pri- mary code, allowing us to take this source of information into account. Thus, one possible explanation for misclassifi- cations may be that the firms correctly report their diverse activities by reporting several industry codes, but we rarely include more than one industry code in an analysis. To look into this potential error we obtained infor- mation on the number of Danish firms that list multiple industry codes to determine whether firms report indus- try codes for all of their main activities. The overall result was that 577,612 (94%) of 617,369 firms assigned only one NACE code (at any level). Most of the other cases con- tained information on 2 NACE codes, and less than 1% (4500 firms = 0.75%) included more than two NACE codes. Given the discussion above on multiple activities, it seems at first glance surprising that such a high share of firms identify 9 A 5-country OECD project in a collaboration between statistical offices investigated micro-level data on manufacturing and services and found that the data for Denmark were very similar at the enterprise and estab- lishment levels (Pilat and Wölfl, 2005). A 5-country OECD project in a collaboration between statistical offices investigated micro-level data on manufacturing and services and found that the data for Denmark were very similar at the enterprise and establishment levels (Pilat and Wölfl, 2005).
- 11. J.L. Christensen / Structural Change and Economic Dynamics 26 (2013) 47–60 57 only one industry code. But as noted in the literature (e.g., Bhojraj et al., 2003), the low share illustrates that firms are generally not concerned with their industry classification. In particular, firms do not consider a second industry code important. Moreover, there may be conceptual problems related to classification, as noted in Section 2. For example, it may be easier for firms to consider the different segments of customers and needs addressed by their activities than it is to understand when they should have additional industry codes in a production-oriented classification system. Of the analysed firms, 3% were classified into two indus- tries within the same sector, 1% listed Finance as their secondary sector, 1% listed Trade as their secondary sec- tor, and 1% listed another secondary sector, cf. Table 4. Firms in Industry were most likely to identify an addi- tional industry code; on average, these firms identified 1.25 industry codes, compared to an average of 1.05. Table 4 shows how the 39,757 firms that assigned more than 1 NACE code listed their secondary NACE codes, allowing us to further analyse how industries are ‘connected’ by indus- try codes from presumably related industries. Firms in the industries listed in the first column are ordered by their primary industry code, and the industry of their secondary code is listed horizontally. The diagonal shows the share of firms with secondary industrial codes within their primary industry. A small share of firms have a secondary NACE code, and half of these firms (48.4%) list secondary codes within their main industry. Three other results stand out. First, Finance/Business Services was frequently used as the sec- ondary code. This finding may be explained by the legal structure of some firms; a substantial number of firms are organised as holding companies or may have service activ- ities and financial and/or business services related to their primary activity. Second, the category of Trade and Restau- rants was listed as the secondary industry by 31% of firms. This may be because some trading activities are allocated to a specific department that engages in wholesale trading beyond the narrow needs of the company. Third, Building and Construction seems to be related to Agriculture, Fish- eries, and Raw Materials. A relatively large share of Building and Construction firms list Agriculture, Fisheries, and Raw Materials as their secondary industry (12.5%), and a large share (15.9%) of Agriculture, Fisheries, and Raw Materi- als firms list Building and Construction as their secondary industry. The most plausible explanation is that the raw materials part of the industry is related to the Building and Construction industry in vertical organisations. Although there may be some justification for the hypothesis that some firms assign more than one industry code, this cannot be the primary reason for misclassifica- tions because the vast majority of firms identify only one code. Of the firms with two or more codes, the majority list a secondary code within their own industry or within finance/business services or trade/restaurants. 6. Conclusions The purpose of the present paper is to deepen our under- standing of one of the fundamentals of industry analysis: whether and to what degree we can rely on industry codes to characterise industrial structures. There is a debate about the appropriateness of industry codes as descriptions of firms’ activities. As a contribution to this debate, the cur- rent paper demonstrates the extent to which firms that are categorised as belonging to one main sector in the econ- omy conduct activities that, according to a strict distinction between manufacturing and services, actually “belong” to another main sector. The analysis shows that two-thirds of the economic activity in the private sector involves services. These activi- ties, however, do not only occur in firms classified as service firms by industry codes. Service firms do not generate their turnover only from service activities; conversely, a consid- erable proportion of manufacturing firms conduct service activities. We have shown that the statistical classification of firms (using the NACE classification codes, in this case) does not reflect all of these firms’ self-reported activities. Although this information is not new, this analysis con- tributes to a quantification of this phenomenon as well as possible explanations. At a 2-digit level of aggregation, 18% of ‘misclassifica- tions’ were identified across industries. In three industries, Building and Construction, Agriculture, Fisheries and Raw Materials, and Industry, a large share of activities are clas- sified by the firms as services; 33%, 25% and 24% of the firms in these industries, respectively, claim that the bulk of their activities are services rather than production. There is heterogeneity both among and within industries. Some firms fully belong to their assigned industry, whereas oth- ers seem to perform large parts of their activities in other areas. Findings were robust when considering that some firms may have more than one industry code. The results did not change when the analyses were performed at a more detailed level of aggregation or when the Building and Construction industry was omitted. The results were also roughly similar in a complementary survey that asked more specific questions about the revenues from end-products rather than broad questions about activities. Any classification system involves benefits and draw- backs. The basic criterion for a classification technique has a major impact on how firms are grouped. Thus, we should not expect any classification system to be perfect. In fact, there are limits to how precisely we are able to make our statistics, even if we pour in more resources. As Einstein noted, ‘Not everything that counts can be counted, and not everything that can be counted counts.’ Different explanations have been provided for why the statistical classification of firms based on the current sys- tem does not correspond to the activities reported by firms. One challenge in the current classification systems relates to the nature of firms’ activities. Because firms perform multiple activities that are largely and increas- ingly interwoven, it is difficult to obtain an adequate and aggregated picture of the share of different types of activities in the economy. Thus, service activities in the economy are not limited to the activities of service firms. Additional explanations note difficulties in classification stemming from trends such as outsourcing, captive compa- nies and the inertia in changes to categories in the statistical system.
- 12. 58 J.L. Christensen / Structural Change and Economic Dynamics 26 (2013) 47–60 Livesey (2006) contends that a revision of the statistical system is needed and notes that an obvious opportu- nity to perform this revision was the so-called Allsopp review (2004) of the use of the statistical system for policy making. This review provided an opportunity for radical changes and supplementary modifications to the exist- ing statistical system. However, the author claims that there is inherent resistance to such changes. The result- ing recommendations in the Allsopp review were modest, proposing the addition of codes to capture emerging indus- tries and to provide greater regional disaggregation. The resistance to change in classification systems is explained by a basic dilemma. On the one hand, it is necessary to adjust classifications to changes in the economic, tech- nological and organisational methods of production. New products emerge, and the importance of existing products changes; likewise, the organisation of industry undergoes substantial changes. In a dynamic economy, the statisti- cal system must be a work in progress. On the other hand, continuity is necessary to maintain long-range data and a corresponding outlook. Moreover, changing statistical classifications is not a simple process. Basically, one could pursue the avenue of increasing detail and the categories in the statistical sys- tem, or some of the categories could be lumped together. Both strategies could be defended, however, currently there seem to be an inexpedient skewed distribution in the coverage of economic activities. Generally, the service industry is not described at a detailed level, but also within manufacturing there are areas that are detailed in the statistics although not very important in real life (Hicks, 2011; Graham et al., 2007). Apparently this is eas- ily resolved. However, request for historical continuity in our data is one hindrance to this process. Another is the fact that, at least in Europe, the classification system is under EU legislation, which complicates agreement and implemen- tation of changes. Any extensive recoding of classifications would also involve substantial costs. Although such modi- fications may enhance the precision of the current system, they would not eliminate the basic problems in assigning industry codes, nor would they address the fundamental question raised in this paper and in the literature regarding the criteria for classification. Two fundamental questions raised by this study are at what point in the value chain the statistical system should measure activities and whether the system should measure only marketable products and services or activ- ities in a broad sense. Another fundamental issue is that statistical classification systems are designed to group firms in roughly homogeneous classes, but with the exten- sive international division of labour and specialisation, many firms’ products and services are increasingly het- erogeneous. Seemingly simple products, including raw materials, are increasingly specific. In the extreme case, this makes each firm unique and complicates the sta- tistical grouping of firms. Dalziel (2007) shows that a purely activity-based statistical classification system may be inadequate. She proposes a system that considers the needs to which firms respond rather than their activi- ties alone. A demand-oriented classification system such as GICS (Global Industry Classification Standard) would, however, entail a number of other difficulties and chal- lenges similar to those indicated here. A number of actors, such as researchers and statistical bureaus, extensively utilise industry statistics. Economet- ric and statistical analyses of industry structures may be technically sophisticated and include high levels of statis- tical significance, but if the basis of these analyses (i.e., the way data are organised) is not precise, there is a risk of over-interpreting the results. Despite the potential bias in results from the way data are produced this is rarely in the radar of economists. In particular, classification issues are close to absent in economic papers; the available data and their classifications are taken for granted. The problems pointed to here and in other studies are, of course, well known at statistical offices. An ad-hoc sur- vey with simple techniques apparently reveals a number of deviations between the self-perception of firms regarding their activities and the statistical coding of these firms. Aside from explanations above it may be hypothesised that the perception of ‘activities’ in the survey is understood among respondents as not only related to production and value added but a broader range of activities including for example marketing and distribution. There is, however, no certain knowledge on whether there are differences in the perceptions with respondents in official statistics and ad- hoc surveys as in this case. Another explanation relates to the above-mentioned delay (and absence) in changes of industry codes. To ensure that the statistical classifica- tion system is ‘on track’ regular quality checks should be performed, and the overarching reluctance to change clas- sifications because of the need for historical time series should not be exaggerated. The main finding of the present study is not that indus- try classifications are completely misleading and should be discarded; rather, these classifications inevitably involve tradeoffs regarding their categorisation of firms. We must be aware of the potential flaws and limitations in the pre- cision of the data if analyses or policies involve activities that span sectors and firms. Finally, there is a clear need to supplement industry classifications with more in-depth studies of the true range of activities of the firms that oper- ate within these industries. According to McCarthy (1995), a classification system should ideally be accurate, stable, timeless and general. Although this is an ideal, probably unrealistic, state of affairs, there seems to be room for mov- ing further towards that situation. Future research on this issue could extend the cover- age of countries beyond Denmark to obtain more precise knowledge on the performance of statistical systems in other countries. Acknowledgements Comments on earlier drafts of this paper are grate- fully acknowledged from Ina Drejer, Dept. of Business Studies, Aalborg University; Jon Sundbo, Roskilde Uni- versity; Brian Wixted, Simon Fraser University, Canada; Margaret Dalziel, Telfer School of Management, University of Ottawa; Andre Lorentz, Max Planck Inst. of Economics; Michaela Trippl, Vienna University of Economics and Busi- ness Administration; Ron Boschma, Utrecht University;
- 13. J.L. Christensen / Structural Change and Economic Dynamics 26 (2013) 47–60 59 Nicola Wall, Manchester Business School; Ole Berner, Statistics Denmark; and Søren Schiønning Andersen, Statis- tics Denmark. Responsibility for any errors rests solely with the author. Annex A. Statistical classification systems Industry codes, such as the NAICS (North American Industry Classification System), ISIC (United Nations Inter- national Standard Industrial Classification of Economic Activities), NACE, and GICS, are used in most industry stud- ies for research and the design of policy programmes as well as within private businesses (e.g., marketing compa- nies). The NAICS was established in the late 1990s to replace the SIC as a reaction to the inexpedient inconsistencies in the previous classification system (Clarke, 1989; Kahle and Walkling, 1996; Bhojraj et al., 2003). The SIC was widely used prior to its replacement by the NAICS/NACE, even after problems related to the SIC had been recognised. Thus, Bhojraj et al. (2003) found that more than 90% of the studies in leading academic journals used SIC codes. The statistical classification system has evolved over time.10 The NACE system is used by more than 150 countries. Because of its wide use and its inclusion in the empirical section of this paper, the NACE system will be explained in more detail (for a more detailed explanation, see, e.g., Eurostat, 2008). In 1961, NACE (initially called NICE) was implemented. It included only manufacturing, construction and energy- producing companies, but it was subsequently extended to cover more types of firms. By 1970, all economic activ- ities were covered. To ensure comparability with other classification systems, a convergence towards the ISIC was instituted and implemented in 1990. After a minor revision in 2002, a major international revision of NACE (rev.2) was implemented in 2007 based upon work to revise the ISIC since 2000 (rev.4). NACE is based upon ISIC in that it is iden- tical at the higher level of aggregation, but NACE is more detailed at lower levels of aggregation. The purpose of the revision was to adjust the statistical system to the current economies, specifically to include and denominate new industries and to enhance harmonisation across statistical classification systems, such as NACE, ISIC, and NAICS, without losing the ability to review data historically. The revised version of NACE attaches greater importance to the 10 The census of manufacturers in the U.S. was implemented in 1810 after several limited versions in the preceding two decades. By the mid-1850s, statistical systems had begun to emerge in several western countries. In Denmark, the case country in this paper, the production of statistics was confined to population counts in 1769, 1787 and 1801. An organisation for producing statistics was established in 1797, but it was dismantled in 1819. In the 1830s and 1840s, there was an increas- ing demand in Western Europe for statistics on public finances (the term ‘statistics’ was then commonly used for facts about the state), and an office for compiling statistics was established in 1833. After several years with no statistics, the statistical office ‘Statistics Denmark’ was established in 1850. The industrial development in the second part of the century accen- tuated the need for industrial statistics. However, these statistics were nearly non-existent in Denmark until the end of the century (Statistics Denmark, 2000). production process in defining the individual classes. At a higher level of aggregation (groups and divisions), the character of the goods and services produced is more important. Thus, the criteria for categorisation include the character and use of the goods and services and the inputs and technologies used. The relative importance of these criteria varies by the industry category and type of production (Eurostat, 2008). Annex B. Additional robustness analysis A further robustness check uses a disaggregated case, that of knowledge-intensive business services. In an addi- tional survey of the total population of Danish firms with at least 10 employees, respondents were asked about the nature of their activities. In this survey, 732 firms par- ticipated, rendering a 53% response rate. We calculated the percentage of the turnover in the firms identified as knowledge-intensive service firms (based on NACE codes), which was generated from the sale of services. One out of five firms (19%) characterised as service firms in the offi- cial industry classifications generated less than half of their turnover from the sales of services. On these grounds, these firms may be misclassified. The results show that even though this complementary survey asked specific ques- tions about the turnover from end-products or services rather than broad questions about activities, the overall numbers of firms that fall outside of the expected classi- fication code are comparable across both surveys. At this more disaggregated industry level, there are marked dif- ferences between sub-sectors. Especially within IT services, 30% of the firms ascribe less than 50% of their turnover to the sales of services, and only half of these firms generate 76–100% of their turnover from services. This may be due to the combination of IT services with different types of hardware, illustrating the issue of interwoven activities. References AEGIS, 2002. Selling Solutions: Emerging Patterns of Product-Service Linkage in the Australian Economy. Australian Expert Group in Indus- try Studies, University of Western Sydney, Sydney, Australia (Jane Marceau, Nicole Cook, Bronwen Dalton, Brian Wixted). Allsopp, C., 2004. Review of Statistics for Economic Policy Making. HMT, London. Baines, T.S., Lightfoot, H.W., Benedettini, O., Kay, J.M., 2009. The servitiza- tion of manufacturing. A review of literature and reflection on future challenges. J. Manuf. Tech. Manag. 20 (5), 547–567. Bhojraj, S., Lee, C.M.C., Oler, D.K., 2003. What’s my line? A comparison of industry classification schemes for capital market research. J. Account- ing Res. 41 (December (5)), 745–774. Carlsson, B., 1989. The evolution of manufacturing technology and its impact on industrial structure: an international study. Small Bus. Econ. 1, 21–38. Carroll, P., Pol, E., Robertson, P.L., 2000. Classification of industries by level of technology: an appraisal and some implications. Prometheus 18 (4), 417–436. Christensen, J.L., Drejer, I., Vinding, A., 2004. Produktudvikling I dansk fremstillingsindustri. ACE Notat nr. 8, Aalborg Universitet, Aalborg, Denmark. Christensen, J.L., Dahl, M.S., Eliasen, S., Nielsen, R.N., Østergaard, C.R., 2011. Patterns and collaborators of innovation in the primary sector: a study of the danish agriculture, forestry and fishery industries. Ind. Innov. 18 (2), 203–225. Clarke, R.N., 1989. SICs as delineators of economic markets. J. Bus. 62 (1), 17–31.
- 14. 60 J.L. Christensen / Structural Change and Economic Dynamics 26 (2013) 47–60 Coombs, R., Miles, I., 2000. Innovation, measurement and services: the new problematique. In: Metcalfe, J.S., Miles, I. (Eds.), Innovation Sys- tems in the Service Economy. Measurement and Case Study Analysis. Kluwer, Boston, pp. 85–103. Cubbin, J.S., 2001. Market structure and performance. In: Lesourne, J., Son- nenschein, H. (Eds.), Industrial Economics I. Foundations of Pure and Applied Economics. Routledge, London. Dahlstedt, R., Salmi, T., Luoma, M., Laakkonen, A., 1994. On the usefulness of standard industrial classifications in comparative financial state- ment analysis. Eur. J. Oper. Res. 79, 230–238. Dalziel, M., 2007. A systems-based approach to industry classification. Res. Policy 36 (10), 1559–1574. Djellal, F., Gallouj, F., 2001. Patterns of innovation organisation in service firms: portal survey results and theoretical models. Sci. Public Policy 28, 57–67. Eurostat, 2008. NACE Rev.2. Statistical classification of economic activities in the European Community. Methodologies and Working Papers. EC. Fertuck, L., 1975. A test of industry indices based on SIC codes. J. Financ. Quant. Anal. 10 (5), 837–848. Fuchs, V.R., 1965. The growing importance of the service industries. J. Bus. 38, 344–373. Gallouj, F., Weinstein, O., 1997. Innovation in services. Res. Policy 26, 537–556. Gershuny, J., Miles, I.D., 1983. The New Service Economy. The Transfor- mation of Employment in Industrial Societies. Francis Pinter, London. Good, I.J., 1965. Categorisation of Classification. Mathematics and Com- puter Science in Medicine and Biology. HMSO, London, pp. 115–128. Graham, J.M., Davis, S., Lippoldt, D., Mann, C.L., Triplett, J., 2007. The Mea- sure of a Nation: Quantifying Innovative Strength through Improved Service Sector Metrics. NBR Special Report 11. National Bureau of Asian Research, Seattle, Washington. Greenfield, H.I., 1966. Manpower and the Growth of Producer Services. Columbia University Press, New York and London. Guerriere, P., Meliciani, V., 2005. Technology and international competi- tiveness: the interdependence between manufacturing and producer services. Struct. Change Econ. Dynam. 16, 489–502. Guenther, D., Rosman, A.J., 1994. Differences between COMPUSTAT and CRSP SIC codes and related effects on research. J. Account. Econ. 18 (1), 115–128. Hicks, D., 2011. Structural change and industrial classification. Struct. Change Econ. Dynam. 22, 93–105. Howells, J., 2006. Where to from here for services innovation? Paper for KISA Conference, Sydney, March. Howells, J., 2004. Innovation, consumption and services: encapsulation and the combinatorial role of services. Serv. Ind. J. 24, 19–36. Jacobs, G., O’Neil, C., 2003. On the reliability (or otherwise) of SIC codes. Eur. Bus. Rev. 15 (3), 164–169. Kahle, K.M., Walkling, R.A., 1996. The impact of industry classifications on financial research. J. Financ. Quant. Anal. 31, 309–335. Leiponen, A., Drejer, I., 2007. What exactly are technological regimes? Intra-industry heterogeneity in the organization of innovation activ- ities. Res. Policy 36, 1221–1238. Livesey, F., 2006. Defining High Value Manufacturing. IfM, University of Cambridge, Cambridge, U.K. Lodefalk, M., 2013. Servicification of manufacturing – evidence from Sweden. Int. J. Econ. Bus. Res. 6 (forthcoming). Mathe, H., Shapiro, R.D., 1993. Integrating Service Strategy into the Man- ufacturing Company. Chapman & Hall, London. McCarthy, I., Anagnostou, A., 2004. The impact of outsourcing on the trans- action costs and boundaries of manufacturing. Int. J. Prod. Econ. 88, 61–71. McCarthy, I., 1995. Manufacturing classification: lessons from organiza- tional systematics and biological taxonomy. Integr. Manuf. Syst. 6 (6), 37–48. McKelvey, B., 1982. Organizational Systematics: Taxonomy, Evolution, Classification. University of California Press, Berkeley. Nählinder, J., 2005. Innovation and Employment in Services. The Case of Knowledge Intensive Business Services in Sweden. Linköping Studies in Arts and Sciences, Linköping University (Ph.D. Thesis). Nordås, H.K., Kim, Y., 2013. The role of services for competitiveness in manufacturing. In: OECD Trade Policy Papers No. 148. OECD Publish- ing. OECD, 1999. Business and Industry Policy Forum on the Service Economy. OECD, Paris. Peneder, M., 2003. Industry classifications: aim, scope and techniques. J. Ind. Compet. Trade 3 (1/2), 109–129. Pilat, D., Wölfl, A., 2005. Measuring the interaction between manufactur- ing and services. In: OECD Science, Technology and Industry Working Papers, 2005/5. OECD Publishing. Pilat, D., Cimper, A., Olsen, K.B., Webb, C., 2006. The changing nature of manufacturing in OECD economies. In: OECD Science, Technology and Industry Working Papers 2006/9. OECD Publishing. Preissl, B., 2000. Service innovation: what makes it different? Empirical evidence from Germany. In: Metcalfe, J.S., Miles, I. (Eds.), Innovation Systems in the Service Economy. Measurement and Case Study Anal- ysis. Kluwer, Boston, pp. 125–148. Santamaría, L., Nieto, M.J., Miles, I., 2012. Service innovation in manufacturing firms: evidence from Spain. Technovation 32, 144–155. Schettkat, R., Yocarini, L., 2006. The shift to services employment: a review of the literature. Struct. Change Econ. Dynam. 17 (2), 127–147. Statistics Denmark, 2000. Dansk Statistik 1850–2000 (Danish Statistics 1850–2000) (Copenhagen). Sundbo, J., 2001. The Strategic Management of Innovation: A Sociological and Economic Theory. Edward Elgar, Cheltenham, UK. Sundbo, J., Gallouj, F., 1998. Innovation in Services. SI4S Synthesis Papers S2. STEP, Oslo. U.S. Department of Labor, 2001. Report on the American Workforce. Vandermerwe, S., Rada, J., 1988. Servitization of business: adding value by adding services. Eur. Manag. J. 6 (4), 314–324. Venkatesan, R., 1992. Strategic sourcing: to make or not to make. Harv. Bus. Rev. 70, 98–107.