
![C budget
ΔC= Σij Aij [ΔCijLB + ΔCijDOM + ΔCijSOILS] / Tij
ΔC = net C stock change [ton C/yr]
Aij = Area under land use i that changes to j [ha]
ΔCijLB = change in C stock in the living biomass of land
use i that changes into land use j, [ton C/ha]
ΔCijDOM = change in C stock in dead plant [ton C/ha]
ΔCijSOILS = change in soil C stock [ton C/ha]
Tij = time scale](https://image.slidesharecdn.com/session-2-1-fahmuddin-agus-reducing-ghg-emissions-from-land-use-change-for-oil-palm-development-1465-121008224033-phpapp02/85/Session-2-1-fahmuddin-agus-reducing-ghg-emissions-from-land-use-change-for-oil-palm-development-1465-7-320.jpg)
![Emission from burning
Above ground:
Under forest: Partial emission of plant biomass
Under clear felling: Speed up biomass
oxidation, but AG biomass also oxidized in
various ways within 2 years.
Below ground
Peatland area burning ≠ peat burning
If peat is burned, then
∆C= Vol. of burned peat [m3] * BD [t m-3] * Corg [t t-1] *3.67
but high uncertainty in prediction.](https://image.slidesharecdn.com/session-2-1-fahmuddin-agus-reducing-ghg-emissions-from-land-use-change-for-oil-palm-development-1465-121008224033-phpapp02/85/Session-2-1-fahmuddin-agus-reducing-ghg-emissions-from-land-use-change-for-oil-palm-development-1465-11-320.jpg)
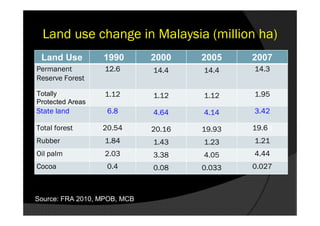

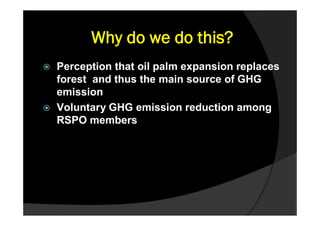
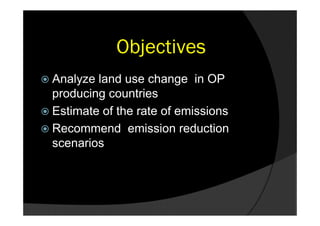
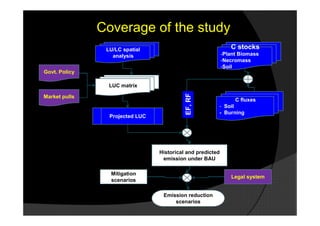
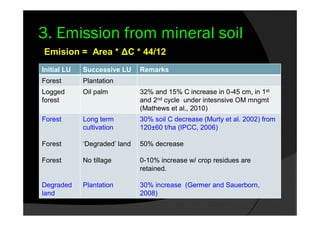
This document discusses reducing greenhouse gas emissions from land use changes for oil palm development. It aims to analyze land use change in major oil palm producing countries, estimate emissions rates, and recommend emission reduction scenarios. Key points include perceptions that oil palm expansion often replaces forests, leading to greenhouse gas emissions, and the voluntary nature of emission reductions among RSPO members.


