This document analyzes Sharpe's ratio as a measure of investment fund performance. It discusses Sharpe's ratio in the context of portfolio theory and as an approximation of a utility index. The document proposes some modifications to Sharpe's ratio to avoid inconsistent assessments and better approximate a utility index. It establishes six postulates regarding utility theory in the presence of risk to provide a conceptual framework. The document notes two cases where Sharpe's ratio may not function properly and proposes an alternative variation to address situations where expected return is less than the risk-free rate of return. It applies the various performance measures to a sample of Spanish investment funds.
The CBS Television surprise hit “Undercover Boss” has aired for six consecutive seasons and
features publicly traded firms, closely-held corporations, and in some instances not-for-profit institutions. While
there has been much analysis on the ethical dilemmas faced by the undercover CEO or other executive, no
practical analysis of a firm‟s profitability has been conducted on any of the firms featured on the show.
Conventional wisdom would suggest that financial performance of a featured firm would improve after the initial
airing date, as the show typically ends on a „feel good‟ note and most often places the executive, as well as the
firm, in a positive light. This paper analyzes the stock market price after the initial air date as well revenue and net
income for all publicly traded firms that have appears on the show through the end of the sixth season.
Motivated by the problem of computing investment portfolio weightings we investigate various methods of clustering as alternatives to traditional mean-variance approaches. Such methods can have significant benefits from a practical point of view since they remove the need to invert a sample covariance matrix, which can suffer from estimation error and will almost certainly be non-stationary. The general idea is to find groups of assets which share similar return
characteristics over time and treat each group as a single composite asset. We then apply inverse volatility weightings to these new composite assets. In the course of our investigation we devise a method of clustering based on triangular potentials and we present associated theoretical results as well as various examples based on synthetic data.
The article re-institutes the investor faith in CAPM model and talks about how CAPM is very closely coupled to the actual investment practices at the ground level. The general criticism of CAPM model that it does not fit empirical asset pricing well cast doubt on the validity of model have been explained.
Exploration de ressources en libre accèsBessem Aamira
Exploration de ressources en libre accès : revues et thèses
Slaheddine BEN ALI (Centre National Universitaire de Documentation Scientifique et Technique, CNUDST)
Relocating and selling lots of of beautiful houseold items. Beatiful home, beautiful things priced to sell. This is a revised presentation of what is available - revised as of October 23, 2013. All prices are negotiable.
This overview of Fairtrade bananas lists facts and figures on Fairtrade's impact for small-scale farmers around the world. The full report can be found at http://www.fairtrade.net/impact-and-research.html#c9572
Questions and Answers At Least 75 Words each.Please answer th.docxmakdul
Questions and Answers: At Least 75 Words each.
Please answer the following questions.
1. What are the differences and similarities between samples and populations?
2. What are the measures of Central Tendency assumptions?
3. What are measures of Dispersion used for and what are the assumptions for each?
4. Define collaboration and how you will apply it in Statistics? (100 Words)
The Capital Asset Pricing Model:
Theory and Evidence
Eugene F. Fama and Kenneth R. French
T he capital asset pricing model (CAPM) of William Sharpe (1964) and JohnLintner (1965) marks the birth of asset pricing theory (resulting in aNobel Prize for Sharpe in 1990). Four decades later, the CAPM is still
widely used in applications, such as estimating the cost of capital for firms and
evaluating the performance of managed portfolios. It is the centerpiece of MBA
investment courses. Indeed, it is often the only asset pricing model taught in these
courses.1
The attraction of the CAPM is that it offers powerful and intuitively pleasing
predictions about how to measure risk and the relation between expected return
and risk. Unfortunately, the empirical record of the model is poor—poor enough
to invalidate the way it is used in applications. The CAPM’s empirical problems may
reflect theoretical failings, the result of many simplifying assumptions. But they may
also be caused by difficulties in implementing valid tests of the model. For example,
the CAPM says that the risk of a stock should be measured relative to a compre-
hensive “market portfolio” that in principle can include not just traded financial
assets, but also consumer durables, real estate and human capital. Even if we take
a narrow view of the model and limit its purview to traded financial assets, is it
1 Although every asset pricing model is a capital asset pricing model, the finance profession reserves the
acronym CAPM for the specific model of Sharpe (1964), Lintner (1965) and Black (1972) discussed
here. Thus, throughout the paper we refer to the Sharpe-Lintner-Black model as the CAPM.
y Eugene F. Fama is Robert R. McCormick Distinguished Service Professor of Finance,
Graduate School of Business, University of Chicago, Chicago, Illinois. Kenneth R. French is
Carl E. and Catherine M. Heidt Professor of Finance, Tuck School of Business, Dartmouth
College, Hanover, New Hampshire. Their e-mail addresses are �[email protected]
edu� and �[email protected]�, respectively.
Journal of Economic Perspectives—Volume 18, Number 3—Summer 2004 —Pages 25– 46
legitimate to limit further the market portfolio to U.S. common stocks (a typical
choice), or should the market be expanded to include bonds, and other financial
assets, perhaps around the world? In the end, we argue that whether the model’s
problems reflect weaknesses in the theory or in its empirical implementation, the
failure of the CAPM in empirical tests implies that most applications of the model
are invalid.
We begin by outlining the logic of t ...
Testing and extending the capital asset pricing modelGabriel Koh
This paper attempts to prove whether the conventional Capital Asset Pricing Model (CAPM) holds with respect to a set of asset returns. Starting with the Fama-Macbeth cross-sectional regression, we prove through the significance of pricing errors that the CAPM does not hold. Hence, we expand the original CAPM by including risk factors and factor-mimicking portfolios built on firm-specific characteristics and test for their significance in the model. Ultimately, by adding significant factors, we find that the model helps to better explain asset returns, but does still not entirely capture pricing errors.
Huang (2018) decomposes the differences in quantile portfolio returns using distribution regression. The main issue of using distribution regression is that the decomposition results are path dependent. In this paper, we are able to obtain path independent decomposition results by combining the Oaxaca-Blinder decomposition and the recentered influence function regression method. We show that aggregate composition effects are all positive across quantiles and the market factor is the most significant factor which has detailed composition effect monotonically decreasing with quantiles. The main decomposition results are consistent with Huang (2018)
Falcon stands out as a top-tier P2P Invoice Discounting platform in India, bridging esteemed blue-chip companies and eager investors. Our goal is to transform the investment landscape in India by establishing a comprehensive destination for borrowers and investors with diverse profiles and needs, all while minimizing risk. What sets Falcon apart is the elimination of intermediaries such as commercial banks and depository institutions, allowing investors to enjoy higher yields.
Taurus Zodiac Sign_ Personality Traits and Sign Dates.pptxmy Pandit
Explore the world of the Taurus zodiac sign. Learn about their stability, determination, and appreciation for beauty. Discover how Taureans' grounded nature and hardworking mindset define their unique personality.
Discover the innovative and creative projects that highlight my journey throu...dylandmeas
Discover the innovative and creative projects that highlight my journey through Full Sail University. Below, you’ll find a collection of my work showcasing my skills and expertise in digital marketing, event planning, and media production.
Memorandum Of Association Constitution of Company.pptseri bangash
www.seribangash.com
A Memorandum of Association (MOA) is a legal document that outlines the fundamental principles and objectives upon which a company operates. It serves as the company's charter or constitution and defines the scope of its activities. Here's a detailed note on the MOA:
Contents of Memorandum of Association:
Name Clause: This clause states the name of the company, which should end with words like "Limited" or "Ltd." for a public limited company and "Private Limited" or "Pvt. Ltd." for a private limited company.
https://seribangash.com/article-of-association-is-legal-doc-of-company/
Registered Office Clause: It specifies the location where the company's registered office is situated. This office is where all official communications and notices are sent.
Objective Clause: This clause delineates the main objectives for which the company is formed. It's important to define these objectives clearly, as the company cannot undertake activities beyond those mentioned in this clause.
www.seribangash.com
Liability Clause: It outlines the extent of liability of the company's members. In the case of companies limited by shares, the liability of members is limited to the amount unpaid on their shares. For companies limited by guarantee, members' liability is limited to the amount they undertake to contribute if the company is wound up.
https://seribangash.com/promotors-is-person-conceived-formation-company/
Capital Clause: This clause specifies the authorized capital of the company, i.e., the maximum amount of share capital the company is authorized to issue. It also mentions the division of this capital into shares and their respective nominal value.
Association Clause: It simply states that the subscribers wish to form a company and agree to become members of it, in accordance with the terms of the MOA.
Importance of Memorandum of Association:
Legal Requirement: The MOA is a legal requirement for the formation of a company. It must be filed with the Registrar of Companies during the incorporation process.
Constitutional Document: It serves as the company's constitutional document, defining its scope, powers, and limitations.
Protection of Members: It protects the interests of the company's members by clearly defining the objectives and limiting their liability.
External Communication: It provides clarity to external parties, such as investors, creditors, and regulatory authorities, regarding the company's objectives and powers.
https://seribangash.com/difference-public-and-private-company-law/
Binding Authority: The company and its members are bound by the provisions of the MOA. Any action taken beyond its scope may be considered ultra vires (beyond the powers) of the company and therefore void.
Amendment of MOA:
While the MOA lays down the company's fundamental principles, it is not entirely immutable. It can be amended, but only under specific circumstances and in compliance with legal procedures. Amendments typically require shareholder
Putting the SPARK into Virtual Training.pptxCynthia Clay
This 60-minute webinar, sponsored by Adobe, was delivered for the Training Mag Network. It explored the five elements of SPARK: Storytelling, Purpose, Action, Relationships, and Kudos. Knowing how to tell a well-structured story is key to building long-term memory. Stating a clear purpose that doesn't take away from the discovery learning process is critical. Ensuring that people move from theory to practical application is imperative. Creating strong social learning is the key to commitment and engagement. Validating and affirming participants' comments is the way to create a positive learning environment.
Remote sensing and monitoring are changing the mining industry for the better. These are providing innovative solutions to long-standing challenges. Those related to exploration, extraction, and overall environmental management by mining technology companies Odisha. These technologies make use of satellite imaging, aerial photography and sensors to collect data that might be inaccessible or from hazardous locations. With the use of this technology, mining operations are becoming increasingly efficient. Let us gain more insight into the key aspects associated with remote sensing and monitoring when it comes to mining.
3.0 Project 2_ Developing My Brand Identity Kit.pptxtanyjahb
A personal brand exploration presentation summarizes an individual's unique qualities and goals, covering strengths, values, passions, and target audience. It helps individuals understand what makes them stand out, their desired image, and how they aim to achieve it.
"𝑩𝑬𝑮𝑼𝑵 𝑾𝑰𝑻𝑯 𝑻𝑱 𝑰𝑺 𝑯𝑨𝑳𝑭 𝑫𝑶𝑵𝑬"
𝐓𝐉 𝐂𝐨𝐦𝐬 (𝐓𝐉 𝐂𝐨𝐦𝐦𝐮𝐧𝐢𝐜𝐚𝐭𝐢𝐨𝐧𝐬) is a professional event agency that includes experts in the event-organizing market in Vietnam, Korea, and ASEAN countries. We provide unlimited types of events from Music concerts, Fan meetings, and Culture festivals to Corporate events, Internal company events, Golf tournaments, MICE events, and Exhibitions.
𝐓𝐉 𝐂𝐨𝐦𝐬 provides unlimited package services including such as Event organizing, Event planning, Event production, Manpower, PR marketing, Design 2D/3D, VIP protocols, Interpreter agency, etc.
Sports events - Golf competitions/billiards competitions/company sports events: dynamic and challenging
⭐ 𝐅𝐞𝐚𝐭𝐮𝐫𝐞𝐝 𝐩𝐫𝐨𝐣𝐞𝐜𝐭𝐬:
➢ 2024 BAEKHYUN [Lonsdaleite] IN HO CHI MINH
➢ SUPER JUNIOR-L.S.S. THE SHOW : Th3ee Guys in HO CHI MINH
➢FreenBecky 1st Fan Meeting in Vietnam
➢CHILDREN ART EXHIBITION 2024: BEYOND BARRIERS
➢ WOW K-Music Festival 2023
➢ Winner [CROSS] Tour in HCM
➢ Super Show 9 in HCM with Super Junior
➢ HCMC - Gyeongsangbuk-do Culture and Tourism Festival
➢ Korean Vietnam Partnership - Fair with LG
➢ Korean President visits Samsung Electronics R&D Center
➢ Vietnam Food Expo with Lotte Wellfood
"𝐄𝐯𝐞𝐫𝐲 𝐞𝐯𝐞𝐧𝐭 𝐢𝐬 𝐚 𝐬𝐭𝐨𝐫𝐲, 𝐚 𝐬𝐩𝐞𝐜𝐢𝐚𝐥 𝐣𝐨𝐮𝐫𝐧𝐞𝐲. 𝐖𝐞 𝐚𝐥𝐰𝐚𝐲𝐬 𝐛𝐞𝐥𝐢𝐞𝐯𝐞 𝐭𝐡𝐚𝐭 𝐬𝐡𝐨𝐫𝐭𝐥𝐲 𝐲𝐨𝐮 𝐰𝐢𝐥𝐥 𝐛𝐞 𝐚 𝐩𝐚𝐫𝐭 𝐨𝐟 𝐨𝐮𝐫 𝐬𝐭𝐨𝐫𝐢𝐞𝐬."
What is the TDS Return Filing Due Date for FY 2024-25.pdfseoforlegalpillers
It is crucial for the taxpayers to understand about the TDS Return Filing Due Date, so that they can fulfill your TDS obligations efficiently. Taxpayers can avoid penalties by sticking to the deadlines and by accurate filing of TDS. Timely filing of TDS will make sure about the availability of tax credits. You can also seek the professional guidance of experts like Legal Pillers for timely filing of the TDS Return.
Premium MEAN Stack Development Solutions for Modern BusinessesSynapseIndia
Stay ahead of the curve with our premium MEAN Stack Development Solutions. Our expert developers utilize MongoDB, Express.js, AngularJS, and Node.js to create modern and responsive web applications. Trust us for cutting-edge solutions that drive your business growth and success.
Know more: https://www.synapseindia.com/technology/mean-stack-development-company.html
Premium MEAN Stack Development Solutions for Modern Businesses
Sesión 4. articulo omega
1. Available online at www.sciencedirect.com
Omega 32 (2004) 273 – 284
www.elsevier.com/locate/dsw
An analysis of Spanish investment fund performance:
some considerations concerning Sharpe’s ratio
Luis Ferruz Agudo∗ , Josà Luis Sarto Marzal
e
Faculty of Economics and Business Studies, University of Zaragoza, Gran VÃa 2, 50005-Zaragoza, Spain
Received 20 November 2002; accepted 25 November 2003
Abstract
This paper concentrates on the ÿnancial analysis of investment performance taking Sharpe’s ratio as a basic point of
reference, as well as giving further consideration to the use of this performance measure as an approximation to a utility index.
We also propose certain changes to Sharpe’s ratio which would, on the one hand, avoid the appearance of inconsistent
assessments and, on the other, provide an approach to the use of Sharpe’s performance measure as a utility index. All of the
measures involved in this study have been applied to a sample of Spanish investment funds.
? 2004 Elsevier Ltd. All rights reserved.
Keywords: Return; Risk; Fund management performance; Investment funds; Utility indices
The object of this paper is to analyse Sharpe’s ratio [1–4]
not only from the point of view of its usual application as a
performance measure for ÿnancial investments but also by
way of an approximation to a utility index, representing the
satisfaction obtained by an investor from such investments.
Sharpe’s ratio may be considered as the ÿrst measure
to combine the two key attributes of ÿnancial investments:
risks and returns. This risk/return context itself represents
a continuation of the conceptual framework developed by
Markowitz [5].
The portfolio selection model designed by Markowitz
[5–7] in the context of Portfolio Theory, the inclusion of
risk-free assets by Tobin [8] and the contributions made
by Sharpe himself [9,2–4] laid the foundations for the creation of the Capital Asset Pricing Model (CAPM) developed
by Sharpe [1] and described by Fama [10] as the Sharpe–
Lintner–Black model.
Building on the foundations of Portfolio Theory and the
market equilibrium model, Sharpe [1], Treynor [11] and
Jensen [12] succeeded in weaving together the strands of risk
and returns to establish the ÿrst indices for the measurement
of portfolio management performance.
Subsequent research related with investment performance
has produced certain criticisms of the CAPM, including the
work of scholars such as Roll–Ross [13] and Leland [14].
These failures or inconsistencies in the CAPM would a ect
those performance indices using beta as the systematic risk
indicator.
Modern ÿnancial literature rarely if ever fails to refer to
the CAPM or apply a single factor model, although Carhart’s
[15] four factor model is also commonly used. This model
includes the three factor model created by Fama and French
[16] and Jegadeesh and Titman’s [17] “momentum factor”,
as Khorama [18] explains in a recent paper.
Other signiÿcant lines of research into portfolio management performance include:
∗ Corresponding author. Tel.: +34-976-762-494; fax: +34-976761-791.
E-mail addresses: lferruz@posta.unizar.es (L. Ferruz Agudo),
jlsarto@posta.unizar.es (J.L. Sarto Marzal).
• The work of scholars such as Modigliani and Modigliani
[19], who analyse risk-adjusted returns as a measure of
performance. The performance measures derived from
this work are in line with those drawn from Sharpe’s ratio.
1. Introduction
0305-0483/$ - see front matter ? 2004 Elsevier Ltd. All rights reserved.
doi:10.1016/j.omega.2003.11.006
2. 274
L. Ferruz Agudo, J.L. Sarto Marzal / Omega 32 (2004) 273 – 284
• Other authors have tried to break investment performance down into constituent factors such as portfolio
management style, synchronisation with the market and
investment securities selection. The work of Grinblatt and
Titman [20–22], Sharpe [2], Rubio [23], Ferson and
Schadt [24], Daniel et al. [25], Christopherson et al. [26],
Becker et al. [27] and Basarrate and Rubio [28] stands out
in this ÿeld. Recent empirical work includes a study by
Kothari and Warner [29], which concentrates especially
on what has come to be termed “style characteristics”
and “abnormal performance”.
• A third line of research looks at persistence with the objective of predicting future fund performance on the basis of historical data. These issues have been addressed
by Grinblatt and Titman [21], Malkiel [30], Elton et al.
[31], Carhart [15], Ribeiro et al. [32], Jain and Wu [33],
Argawal and Yaik [34], Casarin et al. [35], Hallahan and
Fa [36], Droms and Walker [37] and Davis [38] among
others.
As we have already mentioned, this paper takes Sharpe’s
ratio as the starting point for performance measurement,
since it continues to be a valid reference for the task, as
has been made clear in a number of recent papers, including work by Stutzer [39] and Muralidhar [40]. Moreover,
Sharpe’s ratio does not require the validation or veriÿcation
of any equilibrium model for ÿnancial assets.
A further objective is to tie our analysis in with a minimum axiomatic and conceptual framework related with utility theory in the presence of risk.
Against this background, Section 2 contains a ÿnancial
analysis of the functioning of Sharpe’s ratio and proposes
certain small changes, while respecting the essence of the
original. Section 3 provides an empirical study of a set of
Spanish investment funds. The paper concludes with a review of our ÿndings from the study.
2. Sharpe’s ratio in connection with utility theory in the
presence of risk
2.1. Re ections on Sharpe’s ratio
Sharpe’s ratio can be used to measure portfolio performance without the need to validate or verify any prior model,
in contrast to Treynor’s and Jensen’s indices, which assume
the validity of the CAPM and, therefore, presuppose optimum diversiÿcation of the portfolios analysed.
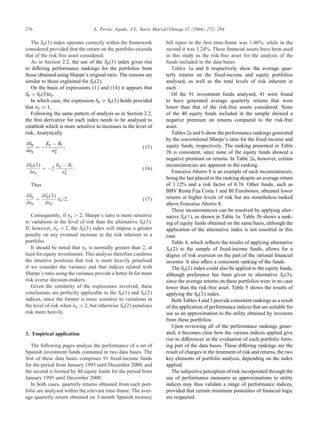
Sharpe’s ratio is expressed as follows:
Sp =
E p − Rf
p
;
(1)
where Ep is the average return on a portfolio, p, Rf is the
average return on a risk-free asset and p is the standard
deviation in the return on the portfolio, p.
Consequently, this performance measure considers a
given combination for the expected return on a portfolio
and the total associated risk.
If Sharpe’s ratio, or any other performance measure for
that matter, is to be considered as an approximation to a
utility index, it is necessary ÿrst to propose a minimum, objective conceptual framework for its application. It seems
reasonable to extend Sharpe’s performance measure to an
investor utility index in order to derive a complementary
application which allows the generalisation of a minimum
objective conceptual framework, on the one hand, and the
inclusion of a degree of discretion with regard to the subjective perception of risk on the other.
Starting from the framework created by Markowitz [5],
we propose six logical/ÿnancial postulates that take into account basic aspects of Portfolio Theory and Utility Theory
in the presence of risk. These postulates are as follows:
1. Utility or satisfaction depend on risk and returns:
U = f(Ep ;
p );
(2)
where U is utility, Ep is the expected return on p and
p is the portfolio risk measured in terms of standard
deviation.
2. Utility increases in line with returns if risk remains constant:
U
¿ 0:
(3)
Ep
3. Utility decreases as risk increases if returns remains constant:
U
¡ 0:
(4)
p
4. There is a positive premium on returns at higher levels of
risk. As risk increases it must be traded o against rising
returns:
dEp
¿ 0:
(5)
d p
This postulate is a consequence of or inference from
the preceding two.
5. Marginal returns rise strictly in line with risk. Where risk
increases, the related increment in returns is more than
proportional:
d 2 Ep
¿ 0:
d( p )2
(6)
The combination of this and the fourth postulate implies
a ÿnancial risk-return ÿeld formed by increasing, convex indi erence curves. The degree of risk aversion is represented
by the convexity of the indi erence curve, which is equivalent to the demand for higher premiums to trade the acceptance of higher risk o against an increase in returns.
6. Positive marginal utility decreases strictly in line with
returns.
3. L. Ferruz Agudo, J.L. Sarto Marzal / Omega 32 (2004) 273 – 284
Declining marginal utility in the presence of wealth is a
generally accepted principle of utility theory. In this context,
however, it would seem appropriate to modify the principle
such that marginal utility declines with returns, expressed
analytically as follows:
2
U (Ep ; p )
¡ 0:
(Ep )2
(7)
This postulate may be relaxed to allow a more general
position in which marginal utility is decreasing or constant
with returns. Analytically:
2
U (Ep ; p )
6 0:
(Ep )2
(8)
Sharpe’s ratio is shown to function appropriately in the
context described by applying these six postulates, except
in two cases:
• In accordance with postulate 3, Ep ¿ Rf must hold for
Sharpe’s ratio to function properly with regard to risk.
Though this is a requirement of long-term ÿnancial logic,
it may not actually be the case in certain short-term circumstances in the ÿnancial markets.
• Contrary to postulate 5, Sharpe’s ratio does not consider
scaled increases in returns in the presence of rising levels
of risk. Thus, the indi erence functions are straight.
2.2. Alternative variation of Sharpe’s ratio when Ep ¡ Rf
As explained above, when Ep ¡ Rf Sharpe’s ratio does
not function properly because postulate 3 does not hold.
One proposal to correct eventual inconsistencies in
Sharpe’s ratio due to this phenomenon would be to treat the
premium on returns as relative rather than absolute.
In principle, this might be regarded as a mere algebraic
solution. However, it may also be considered meaningful in
ÿnancial terms for the following reasons:
• The treatment of the premium on returns as relative is not
without precedent in Financial Analysis. For example, the
straightforward use of Net Present Value is not su cient
and therefore it is necessary to establish the Cost-Beneÿt
relationship in the analysis of alternative investments with
di ering initial outlays.
• In dynamic studies that take the evolution of portfolio performance over time into account, the return on risk-free
assets, considered initially as a constant, becomes a signiÿcant and volatile variable. As a result, it is more appropriate to treat the return on risk free assets in the same
manner as the total risk inherent in the portfolios analysed.
The proposed performance measure would thus be expressed as follows:
Sp (1) =
Ep =Rf
p
:
(9)
275
This index resolves possible failings in the original in the
presence of variations in the level of risk.
It should be noted that the performance rankings obtained
for a given set of portfolios would vary upon applying the
conventional expression of Sharpe’s ratio and the proposed
variant. This is because the expressions themselves di er
and, hence, they throw up diverging values.
On the basis of expressions (1) and (9):
Sp ¿ Sp (1) provided that Ep − Rf ¿ Ep =Rf .
That is, if
Ep ¿
R2
f
:
Rf − 1
(10)
It is also necessary to establish which of the two indices
penalises risk more or, to put it another way, which expression is more sensitive to increases in the level of risk. This
implies consideration of the ÿrst partial derivative for each
index with respect to risk. Thus
Sp
p
=−
Sp (1)
p
E p − Rf
2
p
=−
;
Ep =Rf
2
p
(11)
(12)
Thus, expression (10) must hold for the ÿrst expression
to take a higher negative value than the second (i.e. for the
conventional Sharpe’s ratio to penalise performance more
than the alternative).
2.3. Alternatives to Sharpe’s ratio to take into account
scaled increases in returns in the presence of rising levels
of risk
An alternative to resolve the second question mentioned
above, which is arises from postulate 5, might be to measure risk in terms of variance rather than standard deviation.
Analytically
Sp (2) =
Ep =Rf
2
p
:
(13)
This index does consider the existence of scaled increases
in returns in the presence of rising levels of risk, and it
therefore represents an approximation to quadratic utility
functions. In this case, postulate 5 would indeed hold.
This Sp (2) index should, however, only be used if the
returns on some or all of the portfolios included in the sample
are lower than the return on the risk-free asset employed.
If all of the portfolios in the sample perform in accordance
with the dictates of normal long-term ÿnancial logic (which
is to say that Ep ¿ Rf holds for each portfolio) on the basis of
Sharpe’s ratio and using the variance to evaluate increasing
aversion in the presence of risking levels of risk, a ÿrst
alternative index would be
Sp (3) =
Ep − Rf
2
p
:
(14)
4. 276
L. Ferruz Agudo, J.L. Sarto Marzal / Omega 32 (2004) 273 – 284
The Sp (3) index operates correctly within the framework
considered provided that the return on the portfolio exceeds
that of the risk free asset considered.
As in Section 2.2, the use of the Sp (3) index gives rise
to di ering performance rankings for the portfolios from
those obtained using Sharpe’s original ratio. The reasons are
similar to those explained for Sp (2).
On the basis of expressions (1) and (14) it appears that
Sp = Sp (3) p .
In which case, the expression Sp ¿ Sp (3) holds provided
that p ¿ 1.
Following the same pattern of analysis as in Section 2.2,
the ÿrst derivative for each index needs to be analysed to
establish which is more sensitive to increases in the level of
risk. Analytically
Sp
p
=−
Sp (3)
p
E p − Rf
2
p
= −2
;
(15)
E p − Rf
3
p
:
(16)
Thus
Sp
p
=
Sp (3)
p
p =2:
(17)
Consequently, if p ¿ 2, Sharpe’s ratio is more sensitive
to variations in the level of risk than the alternative Sp (3).
If, however, p ¡ 2, the Sp (3) index will impose a greater
penalty on any eventual increase in the risk inherent in a
portfolio.
It should be noted that p is normally greater than 2, at
least for equity investments. This analysis therefore conÿrms
the intuitive positions that risk is more heavily penalised
if we consider the variance and that indices related with
Sharpe’s ratio using the variance provide a better ÿt for more
risk averse decision-makers.
Given the similarity of the expressions involved, these
conclusions are perfectly applicable to the Sp (1) and Sp (2)
indices, since the former is more sensitive to variations in
the level of risk when p ¿ 2, but otherwise Sp (2) penalises
risk more heavily.
3. Empirical application
The following pages analyse the performance of a set of
Spanish investment funds contained in two data bases. The
ÿrst of these data bases comprises 91 ÿxed-income funds
for the period from January 1993 until December 2000, and
the second is formed by 40 equity funds for the period from
January 1995 until December 2000.
In both cases, quarterly returns obtained from each portfolio are analysed within the relevant time-frame. The average quarterly return obtained on 3-month Spanish treasury
bill repos in the ÿrst time-frame was 1.46%, while in the
second it was 1.24%. These ÿnancial assets have been used
in this study as the risk-free asset for the analysis of the
funds included in the data bases.
Tables 1a and b respectively show the average quarterly returns on the ÿxed-income and equity portfolios
analysed, as well as the total levels of risk inherent in
each.
Of the 91 investment funds analysed, 41 were found
to have generated average quarterly returns that were
lower than that of the risk-free assets considered. None
of the 40 equity funds included in the sample showed a
negative premium on returns compared to the risk-free
asset.
Tables 2a and b show the performance rankings generated
by the conventional Sharpe’s ratio for the ÿxed-income and
equity funds, respectively. The ranking presented in Table
2b is consistent, since none of the equity funds showed a
negative premium on returns. In Table 2a, however, certain
inconsistencies are apparent in the ranking.
Foncaixa Ahorro 8 is an example of such inconsistencies,
being the last placed in the ranking despite an average return
of 1.12% and a risk factor of 0.76. Other funds, such as
BBV Renta Fija Corta 1 and BI Eurobonos, obtained lower
returns at higher levels of risk but are nonetheless ranked
above Foncaixa Ahorro 8.
These inconsistencies can be resolved by applying alternative Sp (1), as shown in Table 3a. Table 3b shows a ranking of equity funds obtained on the same basis, although the
application of the alternative index is not essential in this
case.
Table 4, which re ects the results of applying alternative
Sp (2) to the sample of ÿxed-income funds, allows for a
degree of risk aversion on the part of the rational ÿnancial
investor. It also o ers a consistent ranking of the funds.
The Sp (2) index could also be applied to the equity funds,
although preference has been given to alternative Sp (3),
since the average returns on these portfolios were in no case
lower than the risk-free asset. Table 5 shows the results of
applying the Sp (3) index.
Both Tables 4 and 5 provide consistent rankings as a result
of the application of performance indices that are suitable for
use as an approximation to the utility obtained by investors
from these portfolios.
Upon reviewing all of the performance rankings generated, it becomes clear how the various indices applied give
rise to di erences in the evaluation of each portfolio forming part of the data bases. These di ering rankings are the
result of changes in the treatment of risk and returns, the two
key elements of portfolio analysis, depending on the index
applied.
The subjective perception of risk incorporated through the
use of performance measures as approximations to utility
indices may thus validate a range of performance indices,
provided that certain minimum postulates of ÿnancial logic
are respected.
5. L. Ferruz Agudo, J.L. Sarto Marzal / Omega 32 (2004) 273 – 284
277
Table 1
Fixed-income investment funds and equity funds comprising the data base and quarterly returns as well as the level of risk inherent in each
Investment fund
(a) Fixed-income investment funds from January
1
AB AHORRO
2
AB FONDO
3
AB FT
4
AC DEUDA FT
5
BANESDEUDA FT
6
BANIF RENTA FIJA
7
BANKPYME FT
8
BANKPYME MULTIVALOR
9
BASKEFOND
10
BBVA DEUDA FT
11
BBVA HORIZONTE
12
BBVA RENTA FIJA CORTO 1
13
BBVA RENTA FIJA CORTO 3
14
BBVA RENTA FIJA CORTO 5
15
BBVA RENTA FIJA CORTO 7
16
BBVA RENTA FIJA LARGO 3
17
BCH BONOS FT
18
BCH RENTA FIJA 1
19
BCH RENTA FIJA 3
20
BETA DEUDA FT
21
BETA RENTA
22
BI EUROBONOS
23
BK FONDO FIJO
24
BM FT
25
BSN RENTA FIJA
26
CAIXA GALICIA INV
27
CAJA BURGOS RENTA
28
CAJA MURCIA
29
CAJA SEGOVIA RENTA
30
CAM BONOS 1
31
CANTABRIA DINERO
32
CANTABRIA MONETARIO
33
CITIFONDO PREMIUM
34
CITIFONDO RF
35
CUENTAFONDO RENTA
36
DB INVEST
37
DB INVEST II
38
EDM AHORRO
39
EUROVALOR RF
40
FG TESORERIA
41
FIBANC FT
42
FIBANC RENTA
43
FONBANESTO
44
FONBILBAO FT
45
FONCAIXA AHORRO 10
46
FONCAIXA AHORRO 11
Ep
Investment fund
p
1993 to December 2000
1.83
1.86
47
1.94
1.85
48
1.61
1.76
49
1.58
1.65
50
1.77
1.89
51
1.76
1.59
52
1.82
1.96
53
1.34
1.20
54
1.59
1.38
55
1.84
1.93
56
1.83
1.75
57
1.11
0.87
58
1.31
0.88
59
1.30
0.90
60
1.41
1.74
61
1.48
1.60
62
1.74
1.72
63
1.86
1.76
64
1.56
1.66
65
1.80
2.17
66
1.73
1.87
67
0.95
1.66
68
1.85
1.96
69
2.13
2.50
70
1.84
2.42
71
1.54
2.78
72
1.41
1.03
73
1.15
1.18
74
1.26
0.99
75
1.63
1.70
76
1.28
0.88
77
1.15
0.92
78
1.38
0.83
79
1.41
1.59
80
2.01
2.35
81
1.42
1.31
82
1.35
1.27
83
1.40
1.72
84
1.65
1.76
85
1.36
0.70
86
1.93
1.75
87
2.01
1.79
88
1.51
1.43
89
2.32
2.89
90
1.24
0.82
91
1.42
0.83
(b) Equity funds from January 1995 to December
1
AB BOLSA
2
ARGENTARIA BOLSA
3
BANKPYME SWISS
4
BBVA BOLSA 2
5
BBVA EUROPA BLUE CHIPS 2
6
BBVA EUROPA CRECIMIENTO 1
7
BBVA MIX 60 A
8
BCH ACCIONES
2000
5.02
5.66
5.20
4.21
6.35
4.81
3.25
4.82
13.21
14.89
8.75
13.53
12.76
14.03
8.24
12.03
21
22
23
24
25
26
27
28
Ep
p
FONCAIXA AHORRO 2
FONCAIXA AHORRO 4
FONCAIXA AHORRO 7
FONCAIXA AHORRO 8
FONCAIXA AHORRO 9
FONDACOFAR
FONDICAJA
FONDMAPFRE RENTA
FONDOATLANTICO
FONLAIETANA
FONMARCH
FONSEGUR
FONSNOSTRO
FONTARRACO
FONVALOR
HERRERO RENTA FIJA
IBERAGENTES AHORRO
IBERAGENTES FT
IBERCAJA AHORRO
INVERFONDO
INVERMADRID FT
INVERMONTE
INVER-RIOJA FONDO
IURISFOND
KUTXAINVER
LLOYDS FONDO 1
MAPFRE FT
MUTUAFONDO
NOVOCAJAS
P& G CRECIMIENTO
RENTA 4 AHORRO
RENTCAJAS
RENTMADRID
SABADELL BONOS EURO
SABADELL INTERES EURO 1
SABADELL INTERES EURO 2
SABADELL INTERES EURO 3
SANTANDER AHORRO
SEGURFONDO
SOLBANK INTERES EURO
TOP RENTA
UNIFOND EURORENTA
URQUIJO RENTA
URQUIJO RENTA 2
ZARAGOZANO RF
1.23
1.13
1.62
1.12
1.14
1.29
1.33
1.56
1.54
1.48
1.57
1.57
1.47
1.18
1.31
1.51
1.86
1.89
1.48
1.29
1.64
1.25
1.26
1.62
1.43
1.48
1.36
2.11
1.28
1.28
1.72
1.39
1.24
1.86
1.54
1.53
1.75
1.13
2.01
1.53
1.35
1.16
1.60
1.60
1.31
0.81
0.77
0.84
0.76
0.79
0.81
1.21
1.54
1.26
0.91
1.59
1.47
1.30
1.23
1.05
1.53
2.58
2.02
1.49
1.16
1.53
1.01
0.84
0.76
1.81
1.37
0.93
1.78
1.17
0.89
1.57
1.18
0.93
1.31
0.97
0.97
0.96
0.73
1.91
1.39
1.73
1.83
1.70
1.69
0.99
FONBILBAO ACCIONES
FONBOLSA
FONCAIXA BOLSA 5
FONDBARCLAYS 2
FONJALON ACCIONES
FONJALON II
IBERAGENTES BOLSA
IBERCAJA BOLSA
5.01
4.39
6.17
5.39
4.58
3.62
4.93
4.47
11.53
13.17
11.93
13.59
10.90
8.51
13.32
12.32
6. 278
L. Ferruz Agudo, J.L. Sarto Marzal / Omega 32 (2004) 273 – 284
Table 1 (continued)
Investment fund
9
10
11
12
13
14
15
16
17
18
19
20
Ep
BETA CRECIMIENTO
BK FONDO
BM-DINERBOLSA
BNP BOLSA
BSN ACCIONES
CITIFONDO RV
DB ACCIONES
DB MIXTA II
EUROFONDO
EUROVALOR BOLSA
FG ACCIONES
FIBANC CRECIMIENTO
4.66
5.14
5.74
5.13
5.11
5.12
5.66
4.16
2.70
4.70
4.67
3.71
Investment fund
p
10.82
11.61
15.53
13.48
11.99
13.40
13.47
10.31
10.58
12.42
12.36
8.42
29
30
31
32
33
34
35
36
37
38
39
40
Ep
INDEXBOLSA
INDOSUEZ BOLSA
INVERBAN FONBOLSA
MADRID BOLSA
MERCHFONDO
METAVALOR
PLUSCARTERA
SANT EUROACCIONES
SANTANDER ACCIONES
URQUIJO CRECIMIENTO
URQUIJO GLOBAL
URQUIJO INDICE
4.72
3.63
4.60
4.81
6.39
3.51
4.46
4.78
4.47
4.08
3.12
4.29
p
12.73
10.02
10.95
13.20
15.08
9.64
10.95
11.12
10.15
10.66
7.90
11.42
Table 2
Application of Sharpe’s original ratio to the data base of ÿxed-income funds and equity funds
Investment fund
(a) Fixed-income funds
1
MUTUAFONDO
2
FIBANC RENTA
3
SABADELL BONOS EURO
4
SABADELL INTERES EURO 3
5
FONBILBAO FT
6
SEGURFONDO
7
FIBANC FT
8
BM FT
9
AB FONDO
10
CUENTAFONDO RENTA
11
BCH RENTA FIJA 1
12
IBERAGENTES FT
13
BBVA HORIZONTE
14
IURISFOND
15
AB AHORRO
16
BK FONDO FIJO
17
BBVA DEUDA FT
18
BANIF RENTA FIJA
19
FONCAIXA AHORRO 7
20
BANKPYME FT
21
RENTA 4 AHORRO
22
BCH BONOS FT
23
BANESDEUDA FT
24
BSN RENTA FIJA
25
BETA DEUDA FT
26
IBERAGENTES AHORRO
27
BETA RENTA
28
INVERMADRID FT
29
EUROVALOR RF
30
CAM BONOS 1
31
BASKEFOND
32
AB FT
33
URQUIJO RENTA 2
34
URQUIJO RENTA
35
SABADELL INTERES EURO 1
36
SABADELL INTERES EURO 2
37
FONSEGUR
Sp
0.364
0.305
0.302
0.297
0.297
0.283
0.267
0.265
0.257
0.231
0.222
0.211
0.211
0.203
0.199
0.198
0.194
0.187
0.186
0.183
0.162
0.162
0.160
0.156
0.155
0.152
0.139
0.119
0.107
0.100
0.095
0.083
0.081
0.080
0.075
0.070
0.070
Investment fund
47
48
49
50
51
52
53
54
55
56
57
58
59
60
61
62
63
64
65
66
67
68
69
70
71
72
73
74
75
76
77
78
79
80
81
82
83
Sp
FONLAIETANA
IBERCAJA AHORRO
BBVA RENTA FIJA LARGO 3
LLOYDS FONDO 1
FONSNOSTRO
KUTXAINVER
CITIFONDO RF
BBVA RENTA FIJA CORTO 7
DB INVEST
EDM AHORRO
FONCAIXA AHORRO 11
CAJA BURGOS RENTA
RENTCAJAS
TOP RENTA
DB INVEST II
CITIFONDO PREMIUM
BANKPYME MULTIVALOR
FONDICAJA
MAPFRE FT
FG TESORERIA
FONVALOR
INVERFONDO
ZARAGOZANO RF
NOVOCAJAS
UNIFOND EURORENTA
BBVA RENTA FIJA CORTO 3
BBVA RENTA FIJA CORTO 5
CAJA SEGOVIA RENTA
INVERMONTE
CANTABRIA DINERO
P& G CRECIMIENTO
FONDACOFAR
FONTARRACO
INVER-RIOJA FONDO
RENTMADRID
CAJA MURCIA
FONCAIXA AHORRO 10
0.015
0.012
0.010
0.009
0.008
−0.016
−0.031
−0.033
−0.034
−0.035
−0.051
−0.056
−0.063
−0.066
−0.092
−0.095
−0.103
−0.112
−0.114
−0.142
−0.145
−0.146
−0.153
−0.161
−0.166
−0.171
−0.179
−0.208
−0.208
−0.209
−0.211
−0.220
−0.235
−0.238
−0.240
−0.263
−0.269
7. L. Ferruz Agudo, J.L. Sarto Marzal / Omega 32 (2004) 273 – 284
279
Table 2 (continued)
Investment fund
38
39
40
41
42
43
44
45
46
Sp
AC DEUDA FT
FONDMAPFRE RENTA
FONMARCH
BCH RENTA FIJA 3
FONDOATLANTICO
SOLBANK INTERES EURO
HERRERO RENTA FIJA
FONBANESTO
CAIXA GALICIA INV
0.070
0.065
0.064
0.060
0.058
0.049
0.031
0.029
0.028
0.453
0.413
0.400
0.342
0.336
0.328
0.327
0.323
0.319
0.318
0.316
0.307
0.307
0.305
0.298
0.297
0.294
0.294
0.290
0.290
(b) Equity funds
1
BANKPYME SWISS
2
FONCAIXA BOLSA 5
3
BBVA EUROPA BLUE CHIPS 2
4
MERCHFONDO
5
BK FONDO
6
DB ACCIONES
7
FONBILBAO ACCIONES
8
BSN ACCIONES
9
SANT EUROACCIONES
10
SANTANDER ACCIONES
11
BETA CRECIMIENTO
12
FONJALON ACCIONES
13
INVERBAN FONBOLSA
14
FONDBARCLAYS 2
15
BCH ACCIONES
16
ARGENTARIA BOLSA
17
FIBANC CRECIMIENTO
18
PLUSCARTERA
19
BM-DINERBOLSA
20
CITIFONDO RV
Investment fund
Sp
84
85
86
87
88
89
90
91
FONCAIXA AHORRO 2
BI EUROBONOS
CANTABRIA MONETARIO
BBVA RENTA FIJA CORTO 1
FONCAIXA AHORRO 9
FONCAIXA AHORRO 4
SANTANDER AHORRO
FONCAIXA AHORRO 8
−0.282
−0.308
−0.336
−0.403
−0.405
−0.426
−0.457
−0.459
21
22
23
24
25
26
27
28
29
30
31
32
33
34
35
36
37
38
39
40
BNP BOLSA
AB BOLSA
DB MIXTA II
FONJALON II
EUROVALOR BOLSA
FG ACCIONES
IBERAGENTES BOLSA
INDEXBOLSA
MADRID BOLSA
URQUIJO INDICE
URQUIJO CRECIMIENTO
IBERCAJA BOLSA
BBVA EUROPA CRECIMIENTO 1
BBVA MIX 60 A
INDOSUEZ BOLSA
FONBOLSA
URQUIJO GLOBAL
METAVALOR
BBVA BOLSA 2
EUROFONDO
0.288
0.286
0.284
0.280
0.279
0.277
0.277
0.274
0.271
0.267
0.266
0.262
0.255
0.244
0.239
0.239
0.238
0.236
0.220
0.138
Investment fund
Sp (1)
LLOYDS FONDO 1
INVERMADRID FT
DB INVEST II
FONSEGUR
BCH RENTA FIJA 1
FONBANESTO
AB FONDO
SEGURFONDO
BBVA HORIZONTE
FONDMAPFRE RENTA
BCH BONOS FT
IBERCAJA AHORRO
HERRERO RENTA FIJA
AB AHORRO
FONMARCH
CAJA MURCIA
CAM BONOS 1
FONTARRACO
AC DEUDA FT
0.735
0.735
0.726
0.726
0.719
0.718
0.716
0.716
0.714
0.693
0.693
0.680
0.675
0.675
0.672
0.670
0.656
0.656
0.652
Table 3
Application of index Sp (1) to the ÿxed-income funds and equity funds
Investment fund
(a) Fixed-income funds
1
IURISFOND
2
FG TESORERIA
3
FONCAIXA AHORRO 7
4
SABADELL INTERES EURO 3
5
FONCAIXA AHORRO 11
6
CITIFONDO PREMIUM
7
FONLAIETANA
8
SABADELL INTERES EURO 2
9
FONDACOFAR
10
SABADELL INTERES EURO 1
11
SANTANDER AHORRO
12
FONCAIXA AHORRO 2
13
FONCAIXA AHORRO 10
14
INVER-RIOJA FONDO
15
BBVA RENTA FIJA CORTO 3
16
FONCAIXA AHORRO 8
17
FONCAIXA AHORRO 4
18
MAPFRE FT
19
FONCAIXA AHORRO 9
Sp (1)
1.460
1.336
1.311
1.242
1.171
1.140
1.106
1.083
1.083
1.082
1.055
1.035
1.033
1.024
1.024
1.009
1.003
0.994
0.991
47
48
49
50
51
52
53
54
55
56
57
58
59
60
61
62
63
64
65
8. 280
L. Ferruz Agudo, J.L. Sarto Marzal / Omega 32 (2004) 273 – 284
Table 3 (continued)
Investment fund
20
21
22
23
24
25
26
27
28
29
30
31
32
33
34
35
36
37
38
39
40
41
42
43
44
45
46
Sp (1)
CANTABRIA DINERO
BBVA RENTA FIJA CORTO 5
P& G CRECIMIENTO
SABADELL BONOS EURO
CAJA BURGOS RENTA
RENTMADRID
ZARAGOZANO RF
CAJA SEGOVIA RENTA
BBVA RENTA FIJA CORTO 1
CANTABRIA MONETARIO
INVERMONTE
FONVALOR
FONDOATLANTICO
MUTUAFONDO
RENTCAJAS
BASKEFOND
FONSNOSTRO
FIBANC RENTA
BANKPYME MULTIVALOR
INVERFONDO
FIBANC FT
BANIF RENTA FIJA
SOLBANK INTERES EURO
FONDICAJA
RENTA 4 AHORRO
NOVOCAJAS
DB INVEST
0.989
0.988
0.980
0.970
0.930
0.913
0.906
0.870
0.869
0.859
0.850
0.849
0.833
0.810
0.801
0.792
0.773
0.769
0.760
0.760
0.755
0.755
0.752
0.750
0.748
0.746
0.740
0.480
0.418
0.402
0.357
0.356
0.355
0.351
0.348
0.347
0.344
0.343
0.342
0.340
0.339
0.339
0.329
0.326
0.323
0.320
0.319
(b) Equity funds
1
BANKPYME SWISS
2
FONCAIXA BOLSA 5
3
BBVA EUROPA BLUE CHIPS 2
4
BK FONDO
5
FIBANC CRECIMIENTO
6
SANTANDER ACCIONES
7
FONBILBAO ACCIONES
8
BETA CRECIMIENTO
9
SANT EUROACCIONES
10
BSN ACCIONES
11
FONJALON II
12
MERCHFONDO
13
FONJALON ACCIONES
14
INVERBAN FONBOLSA
15
DB ACCIONES
16
PLUSCARTERA
17
DB MIXTA II
18
BCH ACCIONES
19
FONDBARCLAYS 2
20
URQUIJO GLOBAL
The level of similarity between the various rankings can
be calculated by applying Spearman’s correlation coe cient, which is expressed as follows:
rs = 1 −
6 d2
i
;
N (N 2 − 1)
(18)
Investment fund
Sp (1)
66
67
68
69
70
71
72
73
74
75
76
77
78
79
80
81
82
83
84
85
86
87
88
89
90
91
BBVA DEUDA FT
URQUIJO RENTA 2
BK FONDO FIJO
BCH RENTA FIJA 3
URQUIJO RENTA
EUROVALOR RF
IBERAGENTES FT
BANESDEUDA FT
BANKPYME FT
BBVA RENTA FIJA LARGO 3
BETA RENTA
AB FT
CITIFONDO RF
CUENTAFONDO RENTA
BM FT
BETA DEUDA FT
EDM AHORRO
BBVA RENTA FIJA CORTO 7
FONBILBAO FT
KUTXAINVER
TOP RENTA
BSN RENTA FIJA
IBERAGENTES AHORRO
UNIFOND EURORENTA
BI EUROBONOS
CAIXA GALICIA INV
0.650
0.646
0.645
0.644
0.643
0.642
0.640
0.639
0.635
0.633
0.629
0.623
0.609
0.583
0.580
0.567
0.559
0.551
0.549
0.543
0.534
0.519
0.491
0.433
0.391
0.379
21
22
23
24
25
26
27
28
29
30
31
32
33
34
35
36
37
38
39
40
BBVA MIX 60 A
URQUIJO CRECIMIENTO
CITIFONDO RV
ARGENTARIA BOLSA
BNP BOLSA
AB BOLSA
EUROVALOR BOLSA
FG ACCIONES
URQUIJO INDICE
INDEXBOLSA
IBERAGENTES BOLSA
BM-DINERBOLSA
MADRID BOLSA
METAVALOR
IBERCAJA BOLSA
INDOSUEZ BOLSA
BBVA EUROPA CRECIMIENTO 1
FONBOLSA
BBVA BOLSA 2
EUROFONDO
0.319
0.309
0.308
0.307
0.307
0.307
0.305
0.305
0.303
0.300
0.299
0.298
0.294
0.294
0.293
0.293
0.277
0.269
0.251
0.206
where N is the number of funds in each sample, and di is
the di erence in the position occupied by the fund, i, in each
ranking.
This empirical study considers two di erent data bases,
and Spearman’s coe cient has been applied separately to
each. Table 6 shows the results of the correlation in the
9. L. Ferruz Agudo, J.L. Sarto Marzal / Omega 32 (2004) 273 – 284
281
Table 4
Application of index Sp (2) to the ÿxed-income funds
Investment fund
1
2
3
4
5
6
7
8
9
10
11
12
13
14
15
16
17
18
19
20
21
22
23
24
25
26
27
28
29
30
31
32
33
34
35
36
37
38
39
40
41
42
43
44
45
46
Sp (2)
IURISFOND
FG TESORERIA
FONCAIXA AHORRO 7
SANTANDER AHORRO
FONCAIXA AHORRO 11
CITIFONDO PREMIUM
FONDACOFAR
FONCAIXA AHORRO 8
FONCAIXA AHORRO 4
SABADELL INTERES EURO 3
FONCAIXA AHORRO 2
FONCAIXA AHORRO 10
FONCAIXA AHORRO 9
INVER-RIOJA FONDO
FONLAIETANA
BBVA RENTA FIJA CORTO 3
SABADELL INTERES EURO 2
CANTABRIA DINERO
SABADELL INTERES EURO 1
P& G CRECIMIENTO
BBVA RENTA FIJA CORTO 5
MAPFRE FT
BBVA RENTA FIJA CORTO 1
RENTMADRID
CANTABRIA MONETARIO
ZARAGOZANO RF
CAJA BURGOS RENTA
CAJA SEGOVIA RENTA
INVERMONTE
FONVALOR
SABADELL BONOS EURO
RENTCAJAS
FONDOATLANTICO
INVERFONDO
NOVOCAJAS
BANKPYME MULTIVALOR
FONDICAJA
FONSNOSTRO
BASKEFOND
DB INVEST II
CAJA MURCIA
DB INVEST
SOLBANK INTERES EURO
LLOYDS FONDO 1
FONTARRACO
FONBANESTO
1.929
1.914
1.551
1.443
1.411
1.373
1.335
1.334
1.297
1.291
1.270
1.258
1.257
1.215
1.211
1.168
1.121
1.119
1.114
1.101
1.097
1.066
0.996
0.983
0.935
0.915
0.900
0.881
0.843
0.805
0.740
0.676
0.660
0.654
0.638
0.632
0.620
0.593
0.575
0.573
0.569
0.565
0.540
0.536
0.535
0.502
ranking of ÿxed-income funds, while Table 7 re ects the
levels of similarity in the ranking of equity funds.
The lack of correlation between Sharpe’s ratio and the
alternative Sp (1) in Table 6 is immediately striking. This is
due, in the ÿrst place, to the fact that it is a non-homogeneus
comparison, since Sharpe’s original ratio ranks the funds
inconsistently. Furthermore, in the relevant time-frame the
Investment fund
47
48
49
50
51
52
53
54
55
56
57
58
59
60
61
62
63
64
65
66
67
68
69
70
71
72
73
74
75
76
77
78
79
80
81
82
83
84
85
86
87
88
89
90
91
Sp (2)
FONSEGUR
INVERMADRID FT
RENTA 4 AHORRO
BANIF RENTA FIJA
IBERCAJA AHORRO
MUTUAFONDO
FONDMAPFRE RENTA
HERRERO RENTA FIJA
FIBANC FT
FIBANC RENTA
FONMARCH
BCH RENTA FIJA 1
BBVA HORIZONTE
BCH BONOS FT
BBVA RENTA FIJA LARGO 3
AC DEUDA FT
BCH RENTA FIJA 3
AB FONDO
CAM BONOS 1
CITIFONDO RF
URQUIJO RENTA 2
URQUIJO RENTA
SEGURFONDO
EUROVALOR RF
AB AHORRO
AB FT
BANESDEUDA FT
BBVA DEUDA FT
BETA RENTA
BK FONDO FIJO
EDM AHORRO
BANKPYME FT
IBERAGENTES FT
BBVA RENTA FIJA CORTO 7
TOP RENTA
KUTXAINVER
BETA DEUDA FT
CUENTAFONDO RENTA
UNIFOND EURORENTA
BI EUROBONOS
BM FT
BSN RENTA FIJA
IBERAGENTES AHORRO
FONBILBAO FT
CAIXA GALICIA INV
0.493
0.480
0.476
0.474
0.457
0.456
0.450
0.442
0.432
0.430
0.421
0.407
0.407
0.403
0.397
0.395
0.389
0.387
0.386
0.384
0.382
0.378
0.374
0.365
0.364
0.353
0.338
0.337
0.335
0.329
0.326
0.324
0.318
0.316
0.309
0.301
0.262
0.248
0.237
0.235
0.232
0.214
0.190
0.190
0.136
return on the risk-free asset was 1.46%, and expression (10)
tells us that where Ep ¿ 4:63% Sharpe’s ratio will penalise
higher levels of risk in the portfolios more heavily than the
alternative Sp (1).
Nevertheless, none of the portfolios analysed has achieved
such a high average return, and indeed all of the values
obtained are signiÿcantly lower. Consequently, there is a
10. 282
L. Ferruz Agudo, J.L. Sarto Marzal / Omega 32 (2004) 273 – 284
Table 5
Application of index Sp (3) to the equity funds
Investment fund
1
2
3
4
5
6
7
8
9
10
11
12
13
14
15
16
17
18
19
20
Sp (3)
BANKPYME SWISS
FIBANC CRECIMIENTO
FONCAIXA BOLSA 5
FONJALON II
BBVA EUROPA BLUE CHIPS 2
SANTANDER ACCIONES
URQUIJO GLOBAL
BBVA MIX 60 A
BETA CRECIMIENTO
BK FONDO
SANT EUROACCIONES
FONBILBAO ACCIONES
FONJALON ACCIONES
INVERBAN FONBOLSA
DB MIXTA II
BSN ACCIONES
PLUSCARTERA
URQUIJO CRECIMIENTO
BCH ACCIONES
METAVALOR
0.052
0.035
0.035
0.033
0.031
0.031
0.030
0.030
0.029
0.029
0.029
0.028
0.028
0.028
0.028
0.027
0.027
0.025
0.025
0.024
Table 6
Spearman’s correlation coe cient based on the rankings for indices
Sp , Sp (1), Sp (2) and Sp (3) applied to ÿxed-income funds
Sp
Sp
Sp (1)
Sp (2)
Sp (3)
Sp (1)
Sp (2)
Sp (3)
1
−0.2965
1
−0.4674
0.9669
1
0.9872
−0.2705
−0.4356
1
Table 7
Spearman’s correlation coe cient based on the rankings for indices
Sp , Sp (1), Sp (2) and Sp (3) applied to equity funds
Sp
Sp
Sp (1)
Sp (2)
Sp (3)
Sp (1)
Sp (2)
Sp (3)
1
0.8623
1
0.3764
0.7482
1
0.5456
0.8687
0.9687
1
wide gulf between the treatment of risk in Sp and Sp (1) for
the portfolios comprising the ÿrst data base, resulting in a
correlation coe cient of −0:2965.
The same reasoning is applicable to the correlation, also
negative, between the rankings generated by the Sp (2) and
Sp (3) indices.
Investment fund
21
22
23
24
25
26
27
28
29
30
31
32
33
34
35
36
37
38
39
40
Sp (3)
DB ACCIONES
INDOSUEZ BOLSA
URQUIJO INDICE
MERCHFONDO
FONDBARCLAYS 2
EUROVALOR BOLSA
FG ACCIONES
AB BOLSA
CITIFONDO RV
INDEXBOLSA
BNP BOLSA
IBERCAJA BOLSA
IBERAGENTES BOLSA
MADRID BOLSA
ARGENTARIA BOLSA
BM-DINERBOLSA
FONBOLSA
BBVA EUROPA CRECIMIENTO 1
BBVA BOLSA 2
EUROFONDO
0.024
0.024
0.023
0.023
0.022
0.022
0.022
0.022
0.022
0.022
0.021
0.021
0.021
0.020
0.020
0.019
0.018
0.018
0.016
0.013
The high level of correlation o ered by indices Sp and
Sp (3) and by Sp (1) and Sp (2) is also interesting, bearing
in mind that the di erence between each pair of measures
refers to the inclusion of the variance of the returns on the
portfolios rather than their standard deviation. Furthermore,
the results o ered by Sp and Sp (3) are inconsistent, while
Sp (1) and Sp (2) operate correctly.
Finally, on the basis of expression (17), when p ¿ 2 the
Sp and Sp (1) indices are more sensitive to variations in the
level of risk in the portfolios than either Sp (3) or Sp (2).
For the funds comprising this data base, the levels of
risk in certain portfolios are close to 2, both at the top and
the bottom of the ranking. This explains the high levels of
correlation between the pairs of indices.
To complete this review of correlations between the application of pairs of indices, it should be mentioned that
the correlation is negative for the pair Sp and Sp (2) and for
the pair Sp (1) and Sp (3), because of the considerable di erences between the expressions, aside from the fact that Sp
and Sp (3) are inconsistent.
The results obtained from the application of Spearman’s
correlation coe cient to the second data base, shown in
Table 7, di er considerably from those re ected in Table 6.
Firstly, the correlation between Sp and Sp (1), and between
Sp (2) and Sp (3), is very high in contrast to the results for the
ÿxed-income funds. In this time-frame, the average return on
the risk-free asset was 1.24% and, consequently, expression
(10) establishes a threshold level of 6.41% for returns on
the portfolios.
11. L. Ferruz Agudo, J.L. Sarto Marzal / Omega 32 (2004) 273 – 284
283
Table 8
Study of partial derivatives permitting analysis of the conventional Sharpe’s ratio and the alternatives proposed as approximation to utility
indicators in the presence of risk
Sp
Ip = E p
2 I = (E )2
p
p
Ip = p
Ep = p
2 E = ( )2
p
p
∗ if
Sp (1)
Sp (2)
Sp (3)
+
=0
−∗
+
=0
+
=0
−
+
=0
+
=0
−
+
+
+
=0
−∗
+
+
E p ¿ Rf
On the basis of the results shown in Table 1b, the average returns obtained on the equity portfolios were generally lower than, but reasonably close to, this threshold. This
means that the sensitivity of all of the indices to risk tends
to be similar and, therefore, the rankings generated from the
application of each measure have a high correlation.
Secondly, the correlations between the rankings generated
by indices Sp , Sp (3), Sp (1) and Sp (2) are noticeably lower
than those obtained for the ÿrst data base (Table 6).
In this sense, the key reference value was level 2 of the
standard deviation of the portfolios. In the second data base,
which comprises equity funds, risk levels are signiÿcantly
higher than 2, as shown in Table 1b. As a result, sensitivity to risk di ers markedly between the pairs of indices. In
particular Sp (2) and Sp (3) are less sensitive in these circumstances and penalise risk to a lesser degree than Sp (1) and
Sp , respectively.
4. Conclusions
The measurement of portfolio performance using
Sharpe’s ratio may give rise to inconsistent rankings where
the average returns on the portfolios considered are lower
than the average returns on the risk-free asset taken as a
reference.
More generally, and taking this anomaly into consideration, where Sharpe’s ratio is used as an approximation to a
utility index, it can be seen, among other matters, that it does
not take strict risk aversion on the part of a rational ÿnancial
investor into account within a normative conceptual framework. This needs to be taken into account from the point of
view of the utility or satisfaction obtained by the individual
investor from the investments in the portfolios analysed.
The proposed series of postulates, which take into account
basic aspects of utility theory in the presence of risk and
the basic ÿnancial logic of Portfolio Theory, allows detailed
analysis of Sharpe’s ratio, bringing out its strengths but also
highlighting the sources of possible ÿnancial anomalies (e.g.
where Ep ¡ Rf ) and the lack of a strict treatment of risk
aversion. On this basis, alternative indices belonging to the
same family as Sharpe’s can be generated.
Such alternative indices have been applied together with
Sharpe’s ratio to a data base containing the returns on Spanish investment funds. The application of each index gives
rise to di ering performance rankings for the portfolios analysed.
Not all these rankings can be considered as valid, with it
being necessary to exclude classiÿcations with inconsistent
indexes when Ep ¡ Rf . In the remaining indexes coherent,
albeit di erent, rankings are generated although, in general,
with high correlations. These di erences are explained by a
distinct treatment given to the risk-return combination, with
a greater or lower compensation being required for return
when there is an increase in risk.
Further research will be required to ÿne tune the conceptual framework and operational approach. Among other
matters, the relative premium appears to make little di erence to the rankings, while the measurement of risk using
the variance may have profound e ects, especially in equity
portfolios, where it introduces a bias towards more conservatively managed funds.
Acknowledgements
The authors would like to express their thanks to the
Spanish Directorate General for Higher Education for the
award of Project PB97-1003, to the Regional Government of
Aragon for the award of Project P06/97, to Ibercaja for the
award of Project 268-96 and to the University of Zaragoza
for the award of funding through Research Projects 268-77,
268-84, and 268-93.
The authors also express their thanks to comments and
suggestions of the anonymous referees.
Any possible errors contained in this paper are the exclusive responsibility of the authors.
Appendix
Details regarding the study of partial derivatives permitting analysis of the conventional Sharpe’s ratio and the alternatives proposed as approximations to utility indicators
in the presence of risk are given in Table 8.
12. 284
L. Ferruz Agudo, J.L. Sarto Marzal / Omega 32 (2004) 273 – 284
References
[1] Sharpe W. Mutual fund performance. Journal of Business
1966;39:119–38.
[2] Sharpe W. Asset allocation: management style and
performance measurement. Journal of Portfolio Management
1992;18:7–19.
[3] Sharpe W. The Sharpe ratio. Journal of Portfolio Management
1994;21:49–58.
[4] Sharpe W. Morningstar’s risk-adjusted ratings. Financial
Analysts Journal 1998;54:21–33.
[5] Markowitz H. Portfolio selection. Journal of Finance
1952;7:77–91.
[6] Markowitz H. Mean-variance analysis in portfolio choice and
capital markets. Oxford, New York: Basil Blackwell Inc.;
1987.
[7] Markowitz H. Portfolio selection. Oxford, New York: Basil
Blackwell Inc.; 1991.
[8] Tobin J. Liquidity preferences as behaviour towards risk.
Review of Economic Studies 1958;26:65–86.
[9] Sharpe W. A simpliÿed model for portfolio analysis.
Management Science 1963;9:277–93.
[10] Fama EF. E cient capital markets: II. Journal of Finance
1991;46:1575–617.
[11] Treynor JL. How to rate management of investment funds?
Harvard Business Review 1965;43:63–75.
[12] Jensen MC. The performance of mutual funds in
the period 1945 –1964. Journal of Finance 1968;23:
389–416.
[13] Roll R, Ross S. On the cross-sectional relation between
expected returns and betas. Journal of Finance 1994;49:
101–21.
[14] Leland
HE.
Beyond
mean-variance:
performance
measurement in a nonsymmetrical world. Financial Analysts
Journal 1999;55:27–35.
[15] Carhart MM. On persistence in mutual fund performance.
Journal of Finance 1997;52:57–82.
[16] Fama E, French KR. Common risk factors in the returns on
stocks and bonds. Journal of Financial Economics 1993;33:
3–56.
[17] Jegadeesh N, Titman S. Returns to buying winners and selling
losers: implications for stock market e ciency. Journal of
Finance 1993;48:65–91.
[18] Khorama A. Performance changes following top management
turnover: evidence from open-end mutual funds. Journal
of Financial and Quantitative Analysis 2001;36(3):
371–93.
[19] Modigliani F, Modigliani L. Risk-adjusted performance.
Journal of Portfolio Management 1997;23:45–54.
[20] Grinblatt M, Titman S. Mutual fund performance: an
analysis of quarterly portfolio holdings. Journal of Business
1989;62:394–415.
[21] Grinblatt M, Titman S. The persistence of mutual fund
performance. Journal of Finance 1992;47:1977–84.
[22] Grinblatt M, Titman S. Performance measurement without
benchmarks: an examination of mutual fund returns. Journal
of Business 1993;66:47–68.
[23] Rubio G. Further evidence on performance evaluation:
portfolio holdings, recommendations and turnover costs.
Review of Quantitative Finance and Accounting 1995;5:
127–53.
[24] Ferson W, Schadt R. Measuring fund strategy and performance
in changing economic conditions. Journal of Finance
1996;51:425–61.
[25] Daniel K, Grinblatt M, Titman S, Wermers R.
Measuring mutual fund performance with characteristic-based
benchmarks. Journal of Finance 1997;52:1035–58.
[26] Christopherson J, Ferson W, Glassman D. Conditioning
manager alphas on economic information: another look at
the persistence of performance. Review of Financial Studies
1998;11:111–42.
[27] Becker C, Ferson W, Myers D, Schill M. Conditional
market timing with benchmarks investors. Journal of Financial
Economics 1999;52:119–48.
[28] Barrasate B, Rubio G. Nonsimultaneous prices and the
evaluation of managed portfolios in Spain. Applied Financial
Economics 1999;9:273–81.
[29] Kothari SP, Warner JB. Evaluating mutual fund performance.
Journal of Finance 2001;56(5):1985–2010.
[30] Malkiel B. Returns from investing in equity mutual funds
1971 to 1991. Journal of Finance 1995;50:549–72.
[31] Elton EJ, Gruber MJ, Blake CR. The persistence of
risk-adjusted mutual fund performance. Journal of Business
1996;69:133–57.
[32] Ribeiro M, Paxson D, Rocha MJ. Persistence in Portuguese
mutual fund performance. The European Journal of Finance
1999;5:342–65.
[33] Jain PC, Wu JS. Truth in mutual fund advertising: evidence
on future performance and fund ows. Journal of Finance
2000;55(2):937–58.
[34] Agarwal V, Yaik N. Multi-period performance persistence
analysis and hedge funds. Journal of Financial and
Quantitative Analysis 2000;35(3):327–42.
[35] Casarin R, Pelizzon L, Piva A. Italian equity funds:
e ciency and performance persistence. Working Paper in
www.efmaefm.org, 2000.
[36] Hallaham TA, Fa RW. Induced persistence of reversals
in fund performance?: the e ect of survivor bias. Applied
Financial Economics 2001;11:119–26.
[37] Droms WG, Walker DA. Persistence of mutual fund operating
characteristics: return, turnover rates and expense ratios.
Applied Financial Economics 2001;11:457–66.
[38] Davis JL. Mutual fund performance and management style.
Financial Analysts Journal 2001;57(1):19 –27.
[39] Stutzer M. A portfolio performance index. Financial Analysts
Journal 2000;56:52–61.
[40] Muralidhar A. Risk-adjusted performance: the correlation
correct. Financial Analysts Journal 2000;56:63–71.