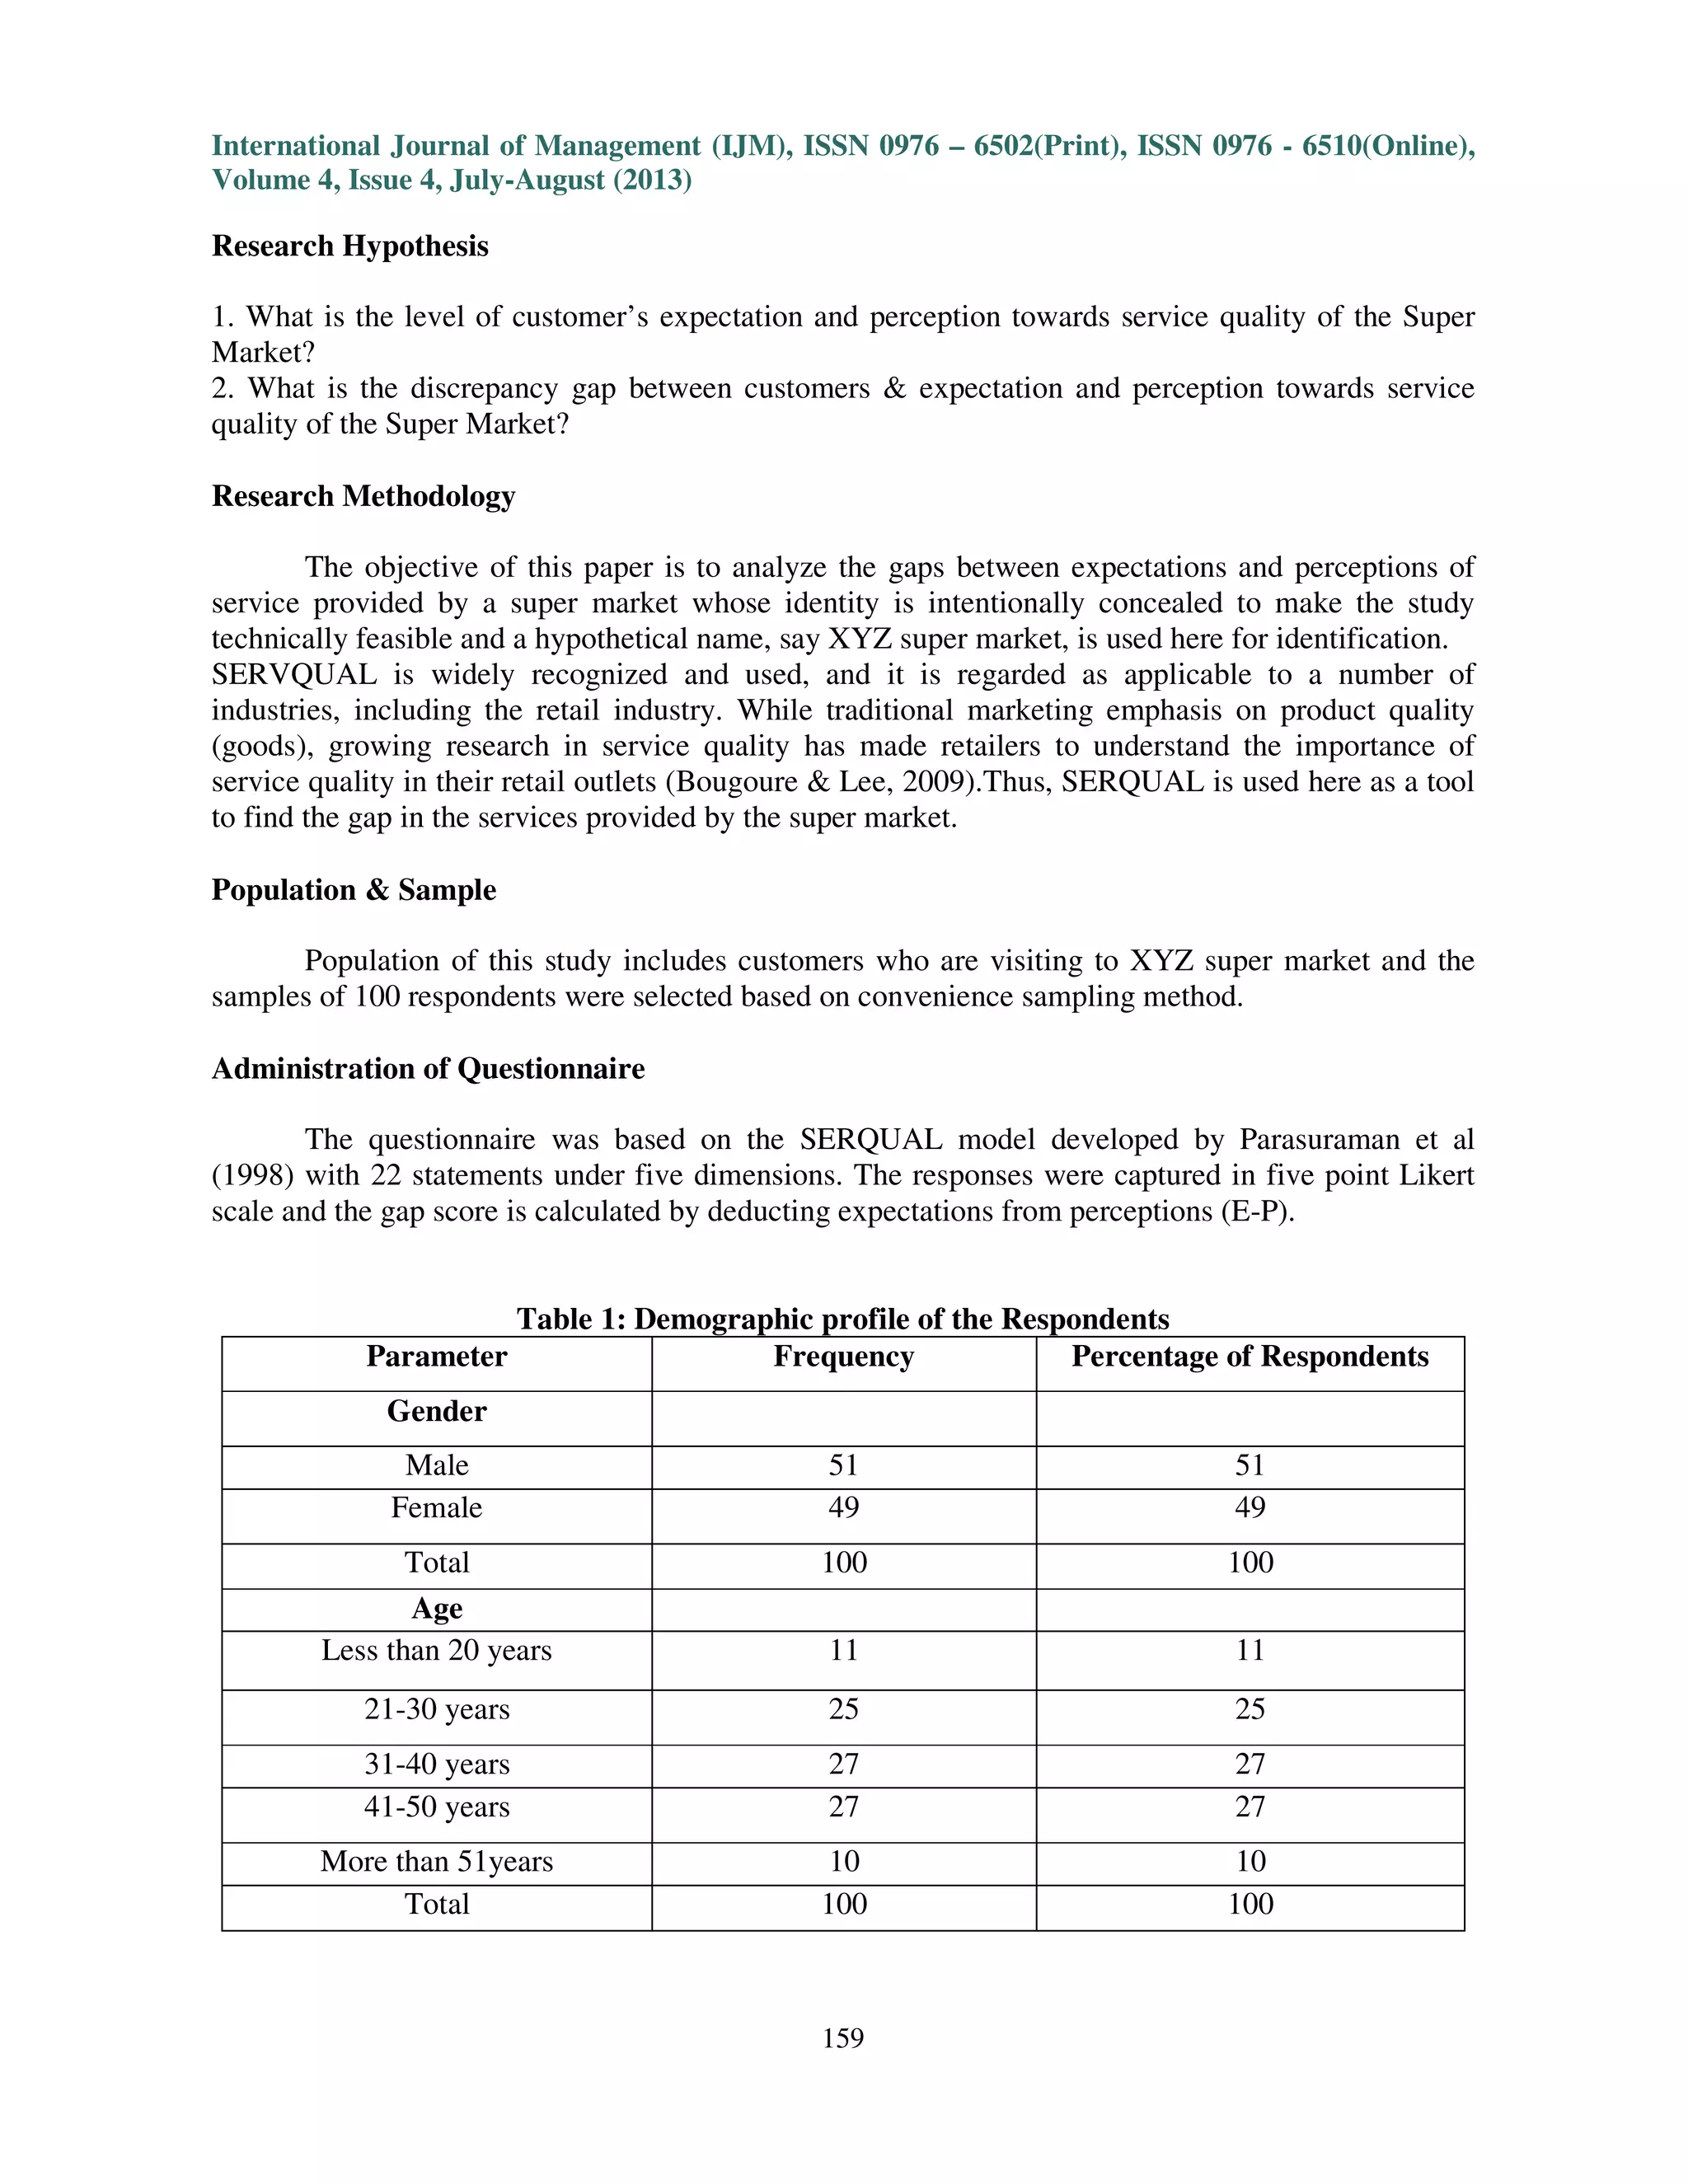
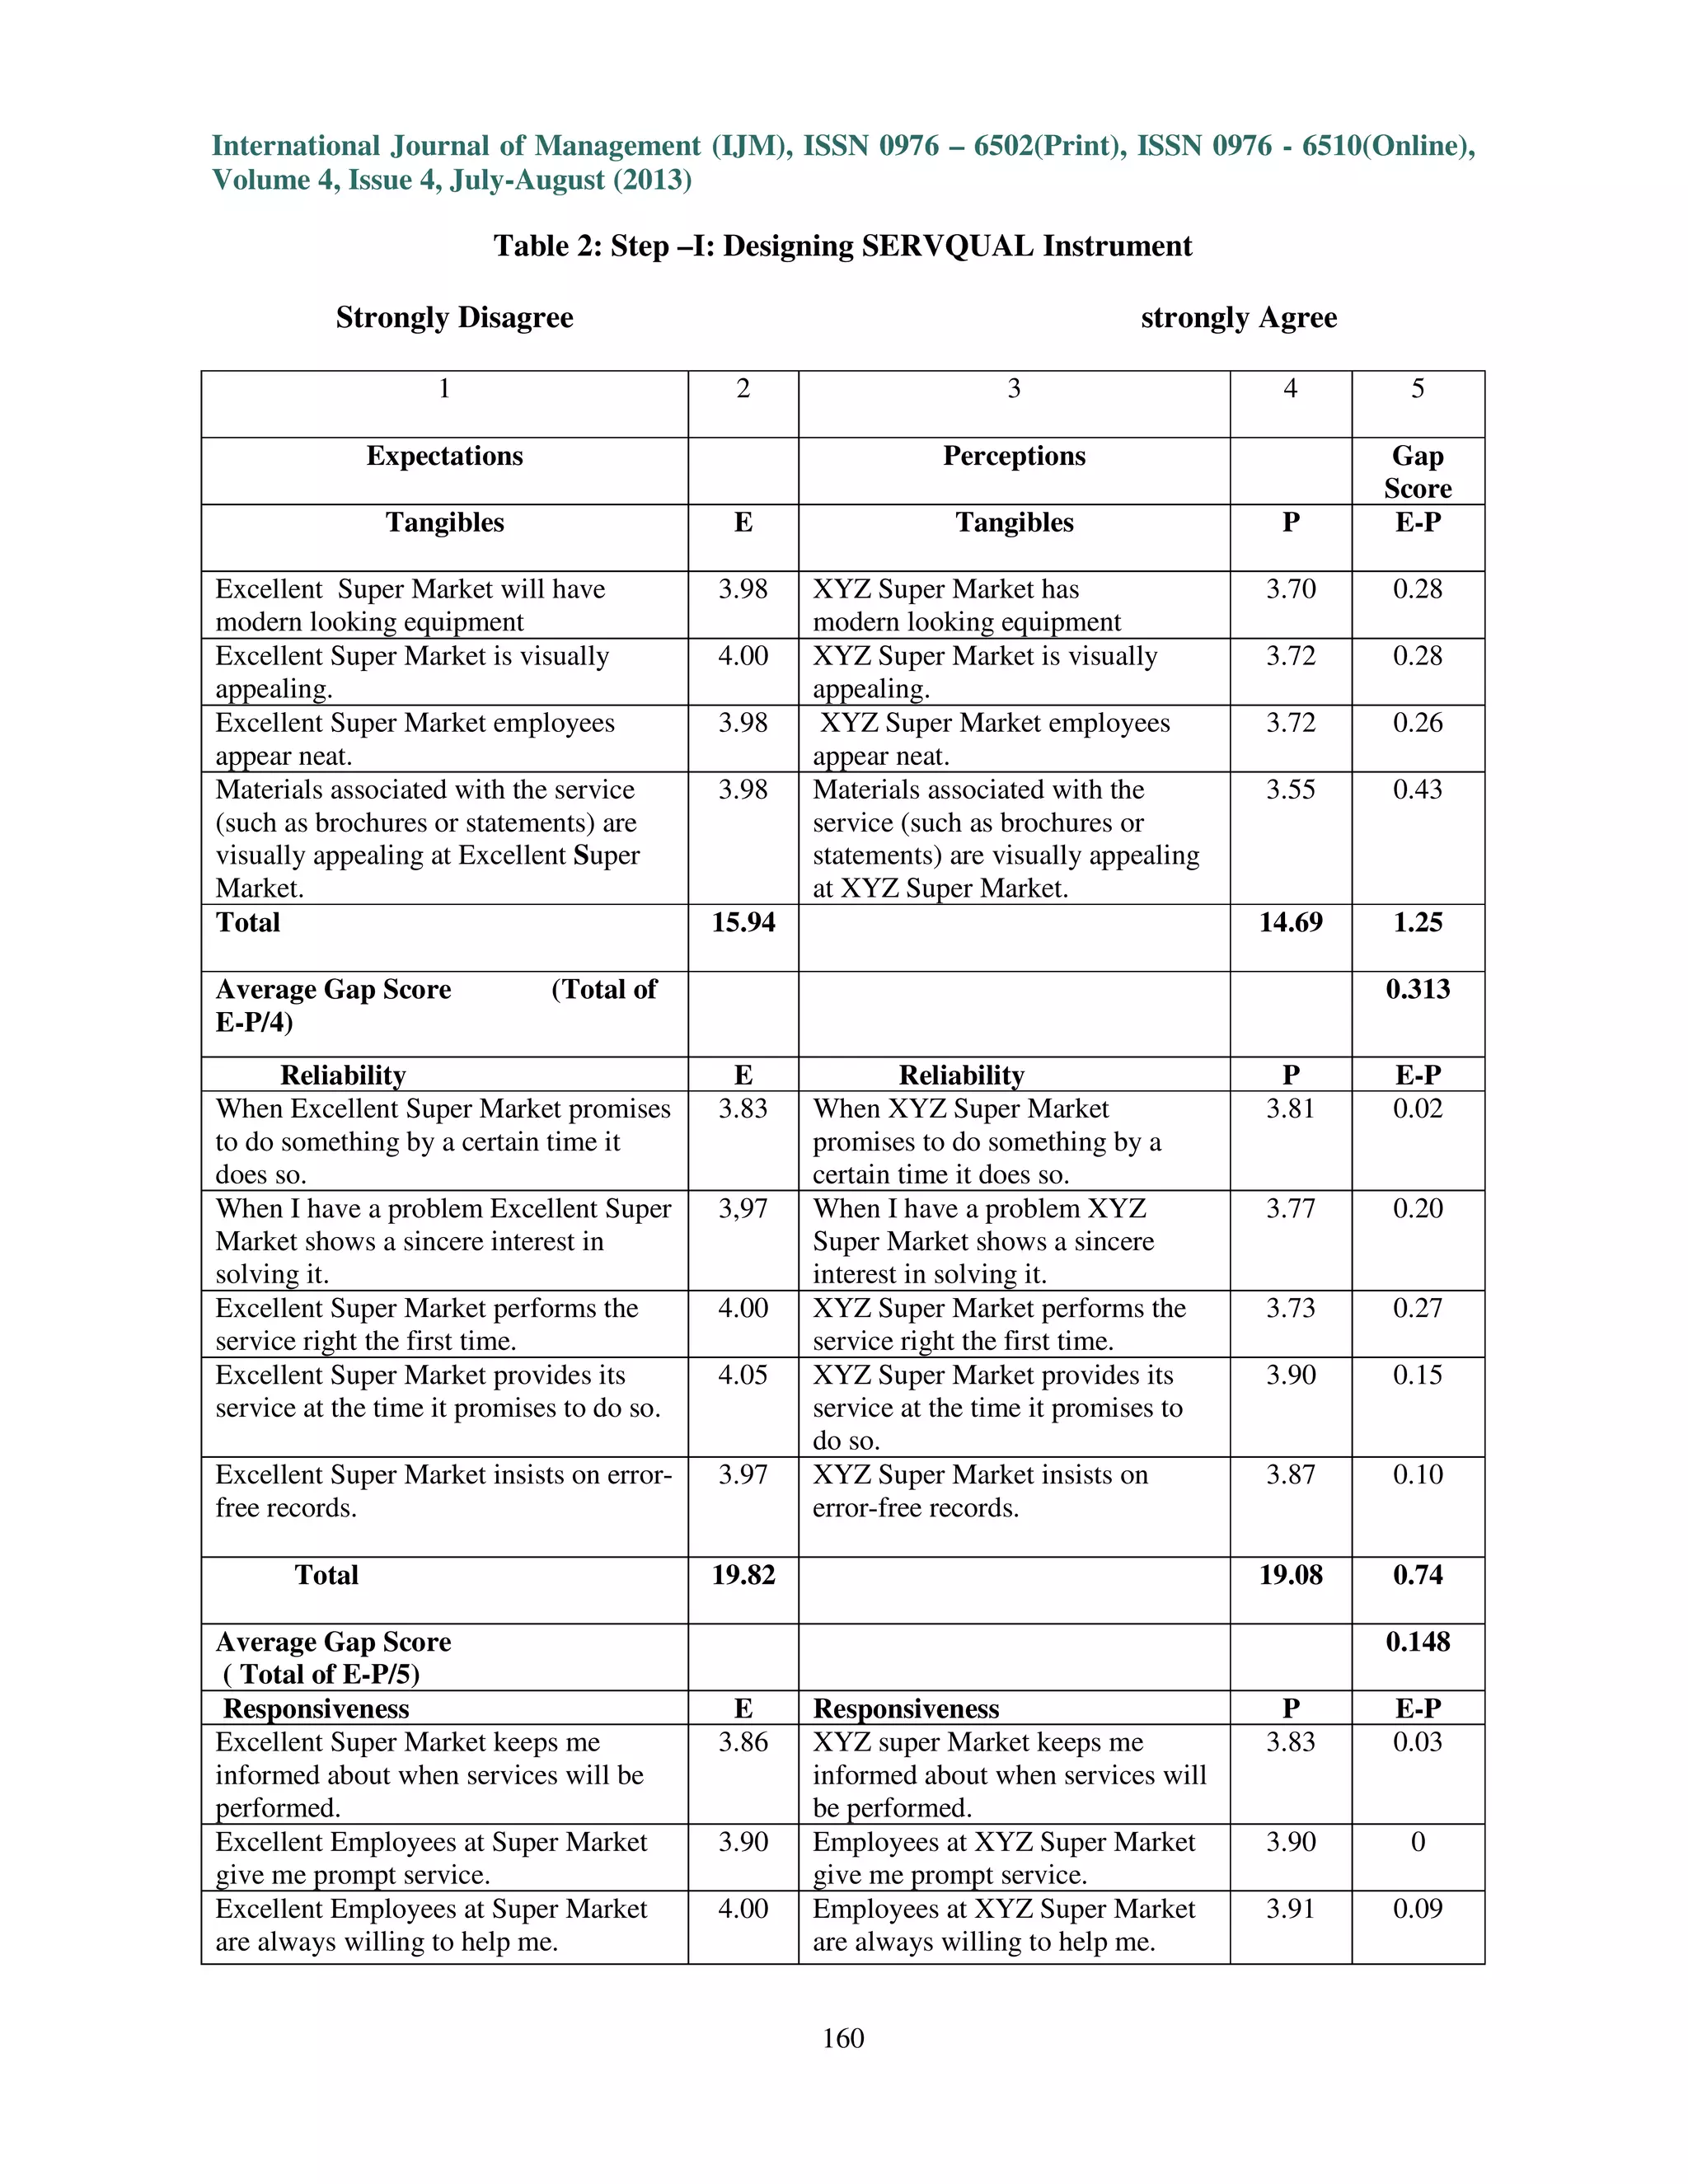
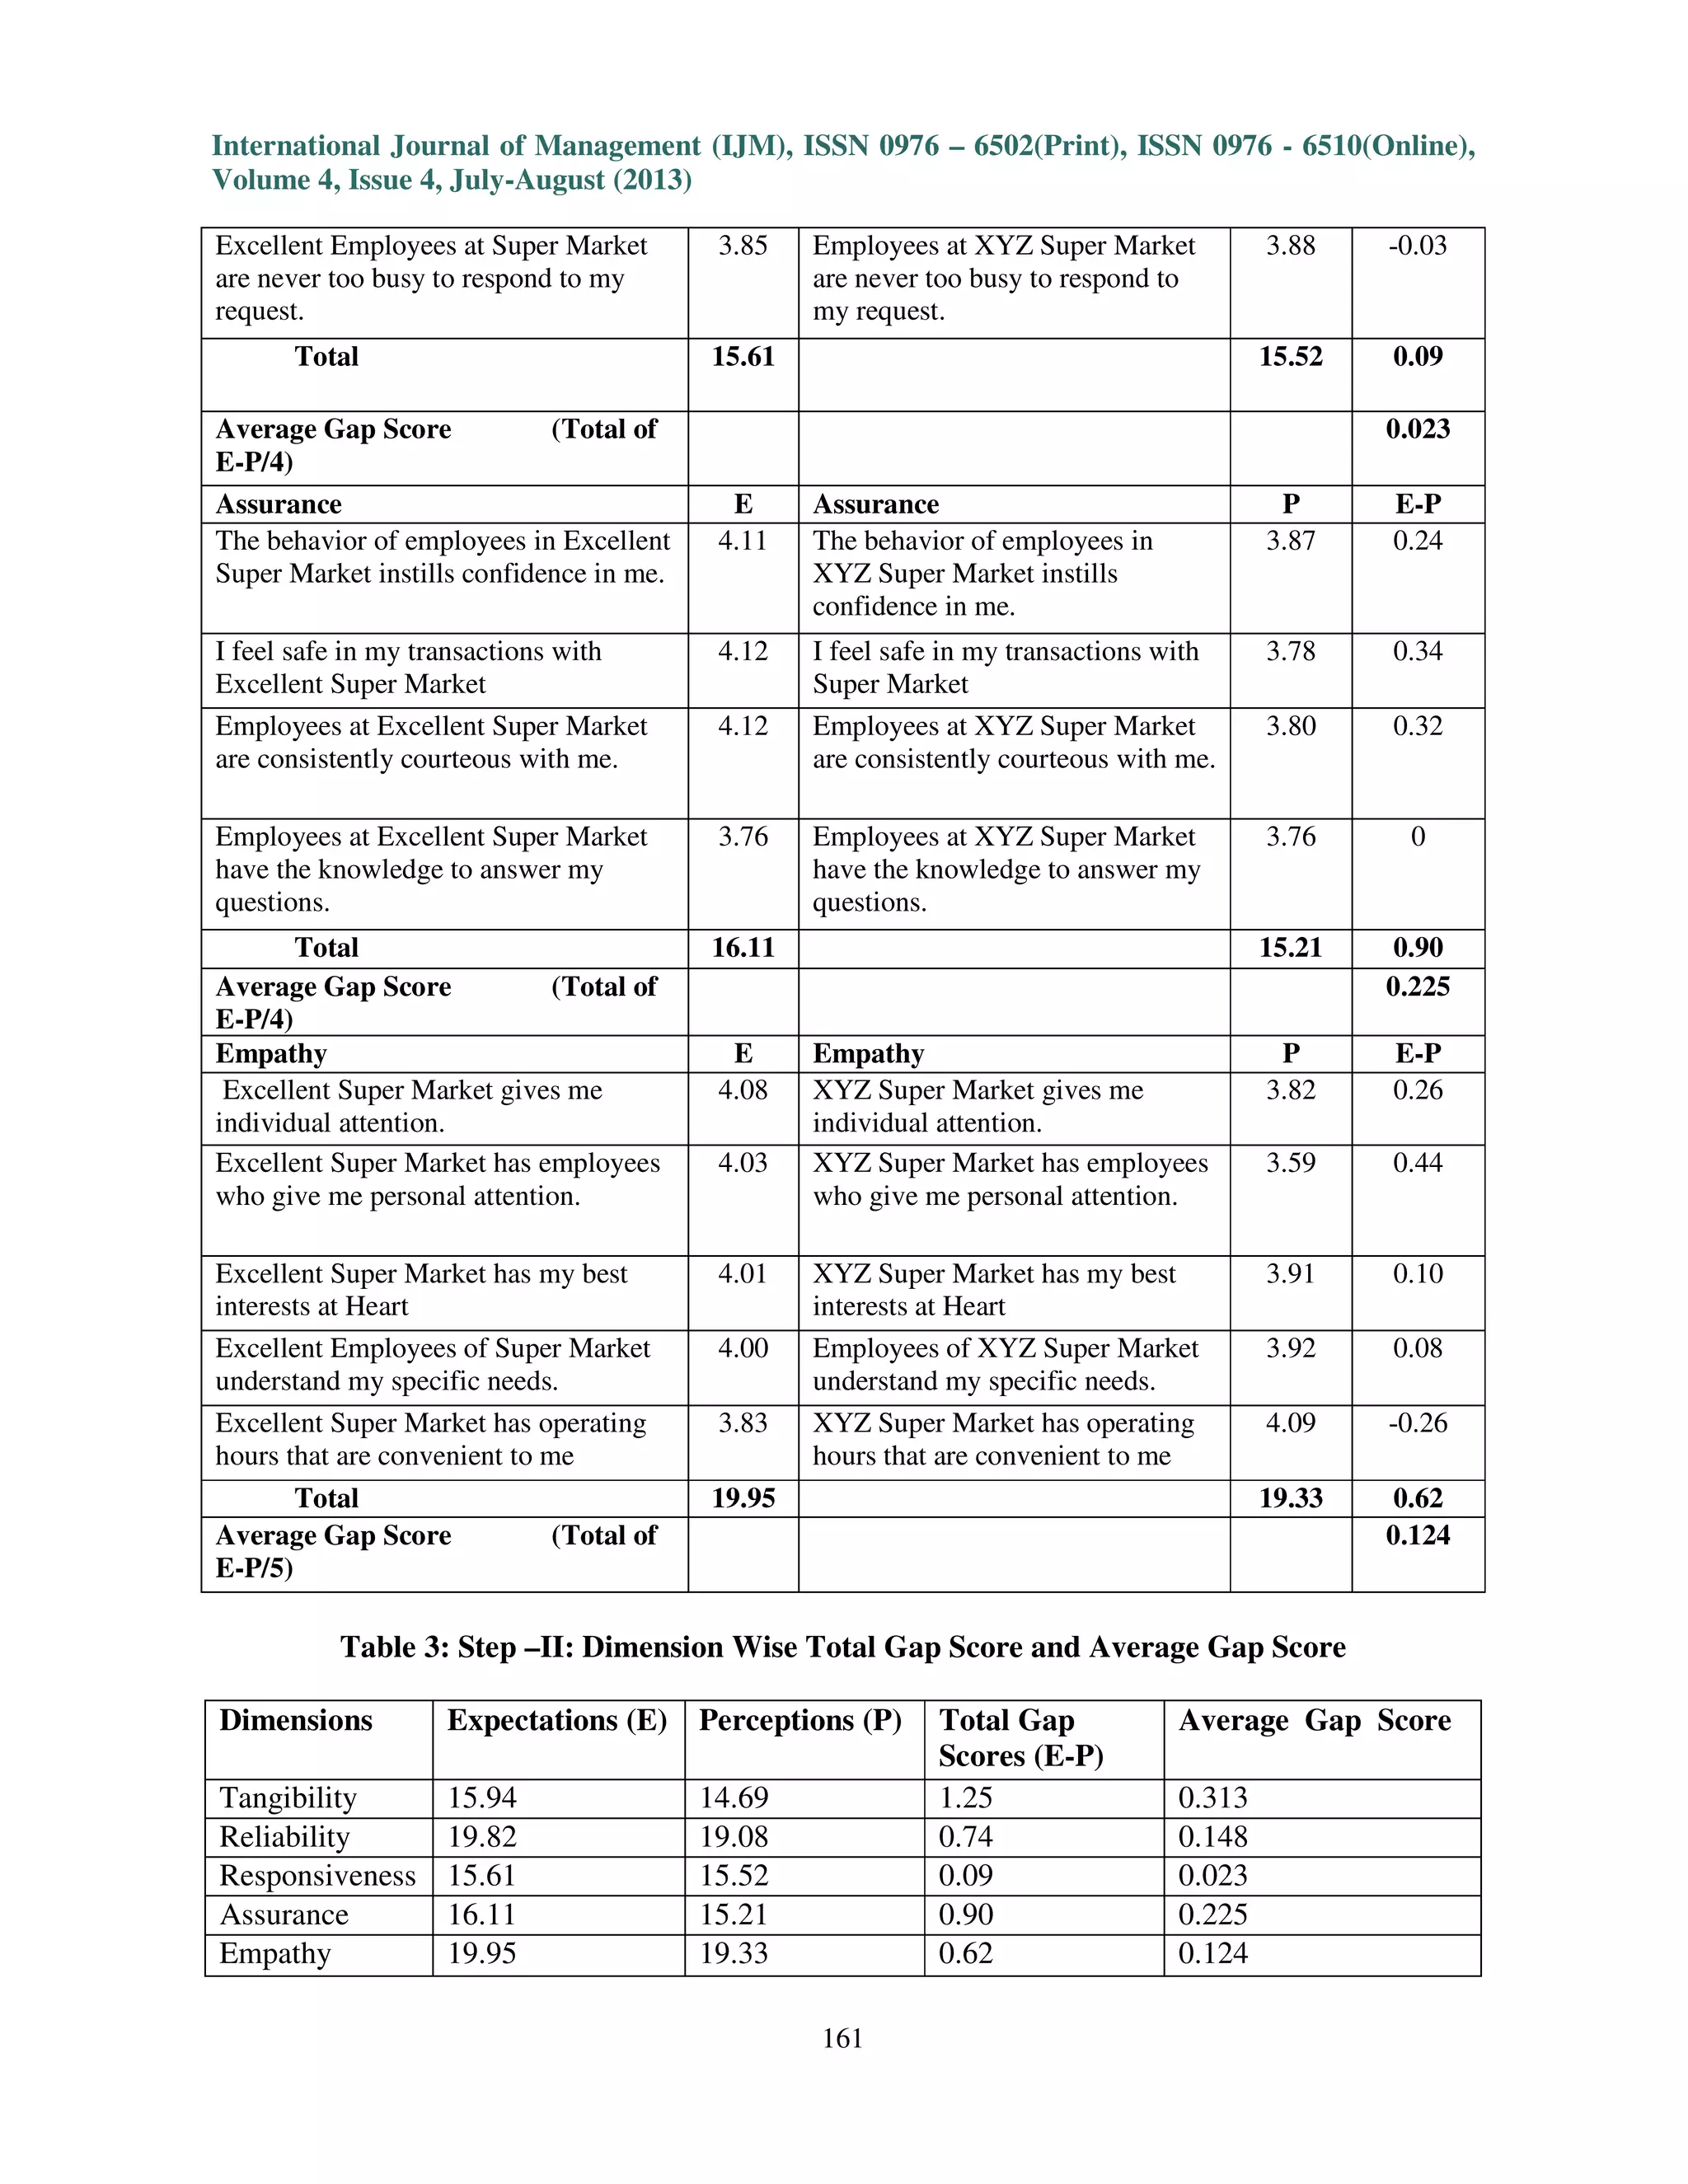
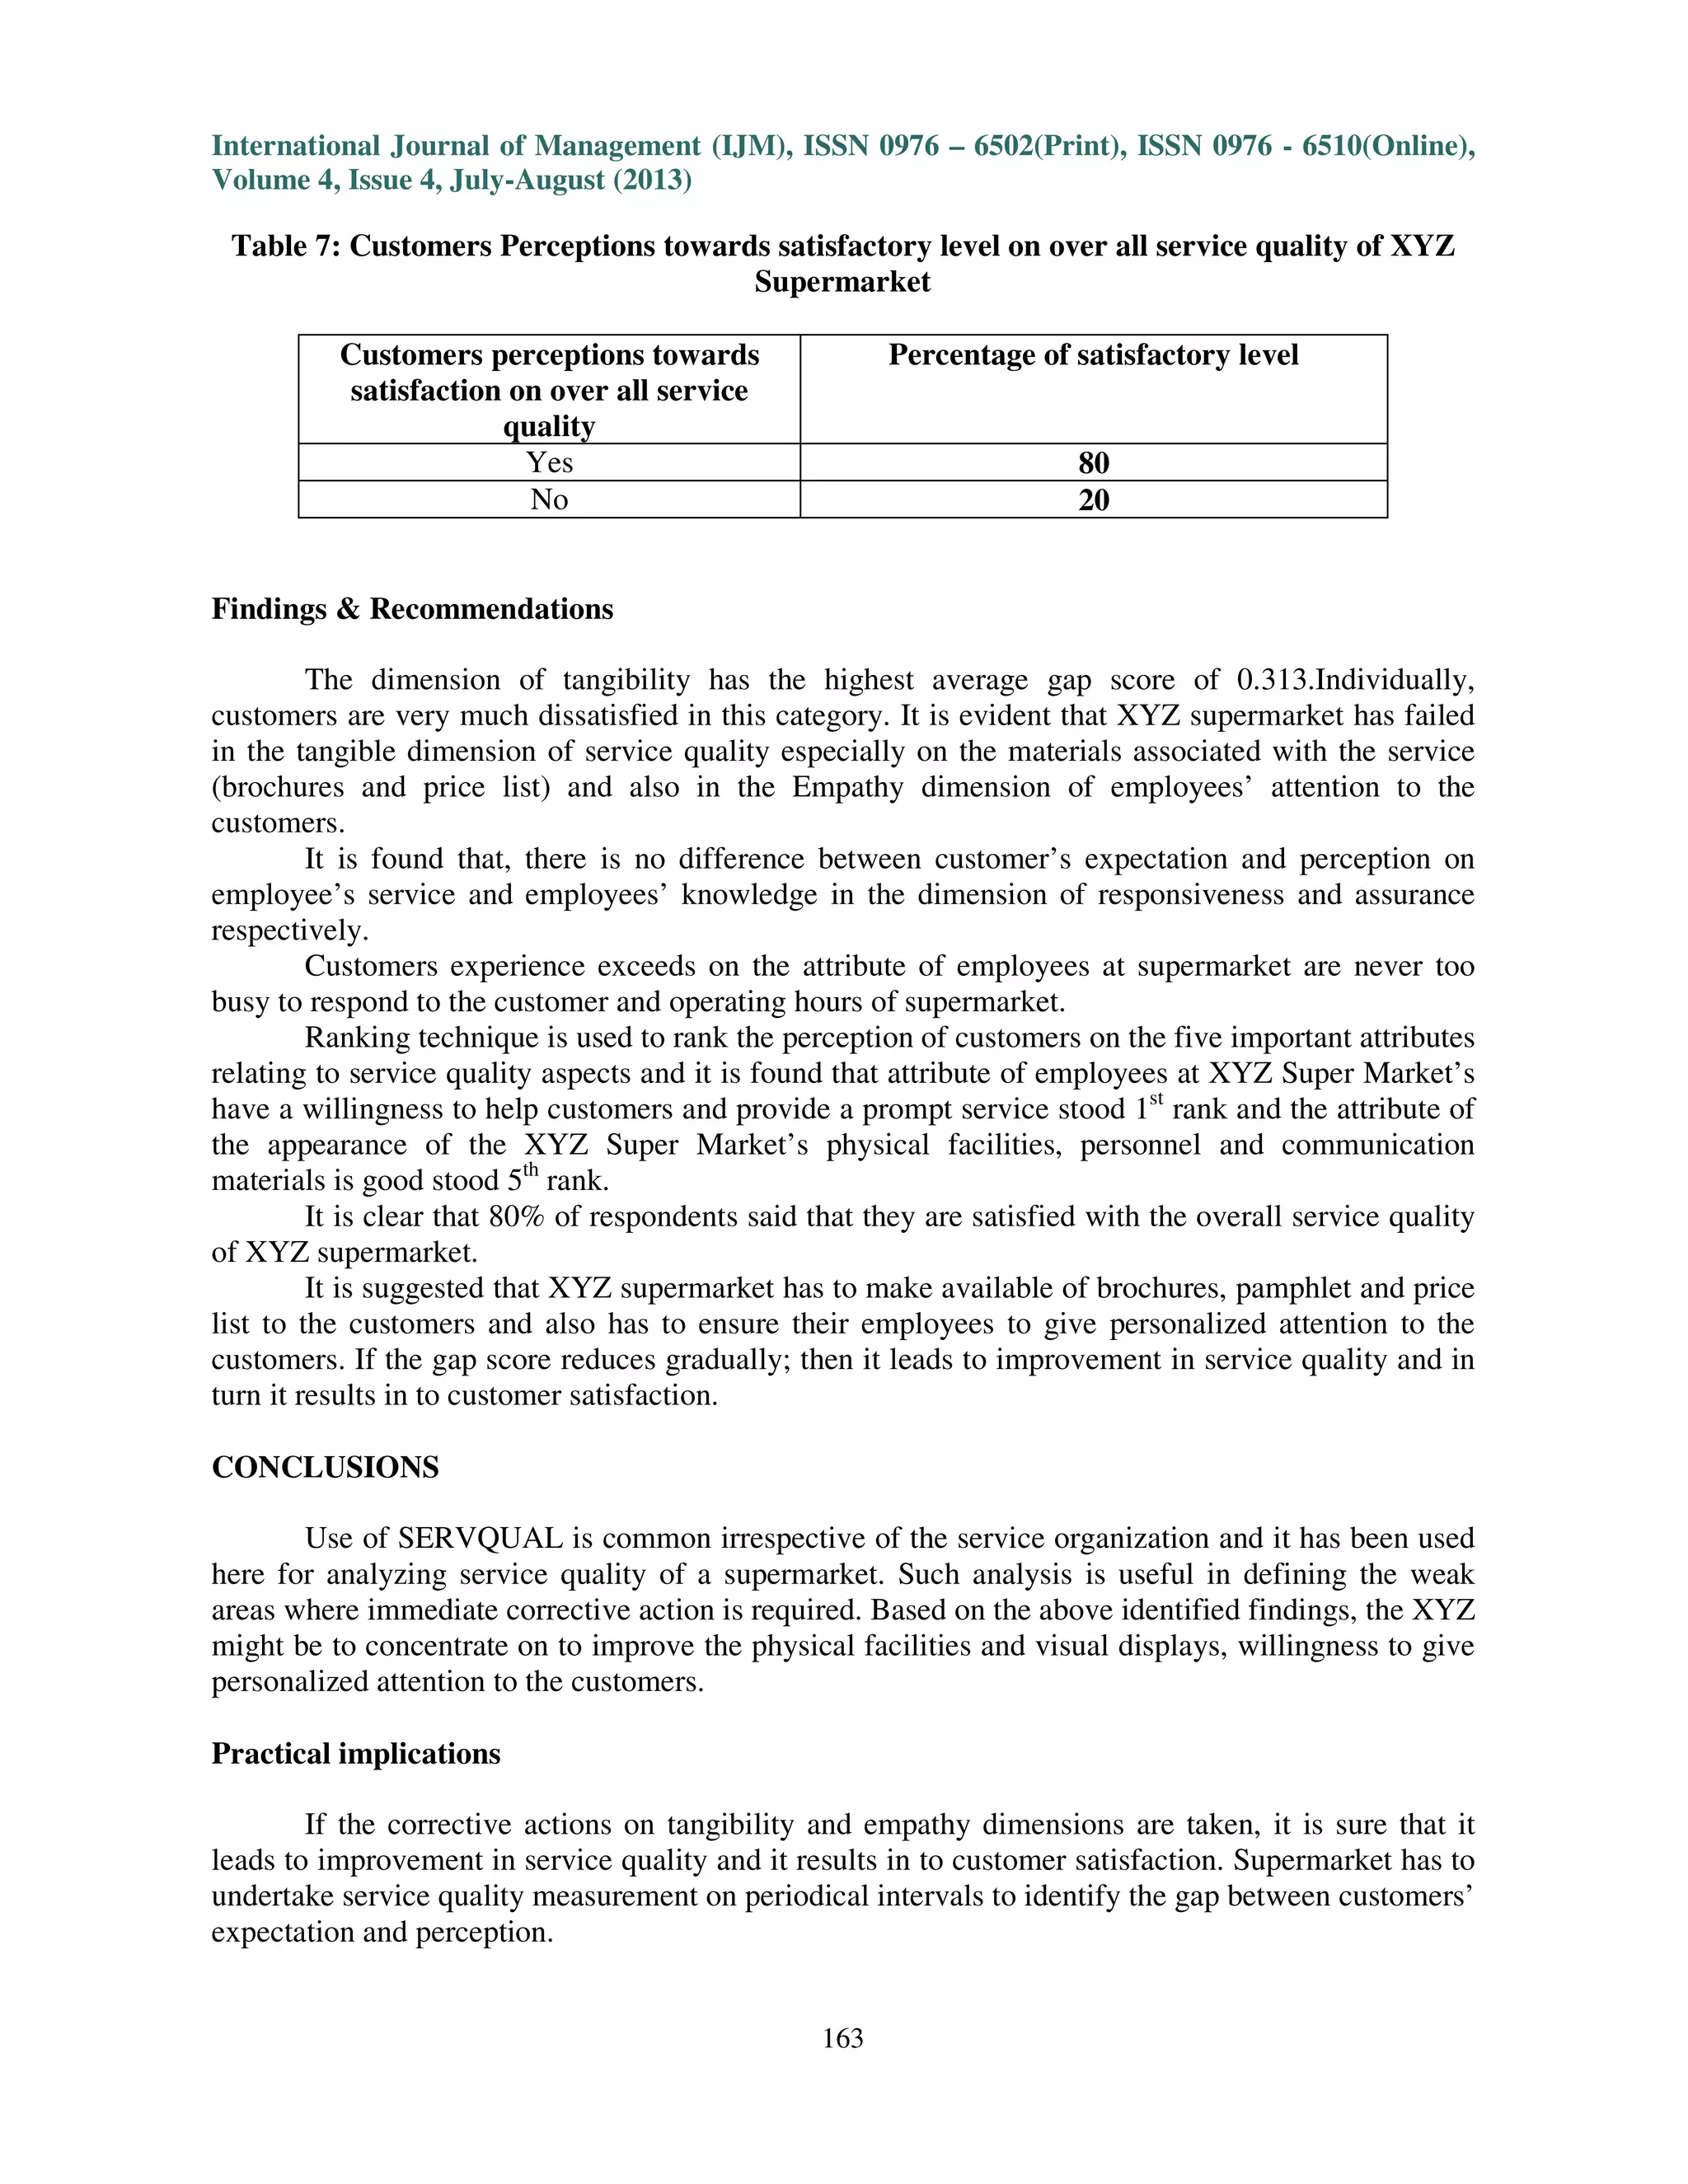
International Journal of Management (IJM), ISSN 0976 – 6502(Print), ISSN 0976 - 6510(Online),
Volume 4, Issue 4, July-August (2013)
156
SERVICE QUALITY MEASUREMENT AND CUSTOMERS PERCEPTION
ABOUT THE SERVICES OF SUPERMARKET
*Mr.R.SatheeshKumar
M.B.A., M.Phil., (Ph.D)
*Author, Assistant Professor, Department of Management Studies, DC School of Management and
Technology, Pullikkanam, Vagamon, Idukki, Kerala, India.
**Dr.T.Vetrivel
B.Sc.,M.B.A.,M.Phil.,Ph.D.
**Co-Author, Professor and Head of Department of Management Studies, Velalar College of
Engineering and Technology, Erode, Tamilnadu, India.
ABSTRACT
Service quality is the level of conformance of service to the customer specification and
expectations. Whether customers are satisfied or not, depends on the balance between customer’s
expectations and customer’s experiences with the products (Zeithaml et al., 1990). When company is
able to raise the customer’s experience to a level that exceeds customer’s expectations then it results
in to customer satisfaction. SERVQUAL is used here as a tool to find the gap in the services
provided by the super market. Service quality analysis is useful in defining the weak areas where
immediate corrective action is required. If the gap score reduces gradually; then it leads to
improvement in service quality and in turn it results in to customer satisfaction.
Key words: Service quality, Service quality dimensions, Service quality measurement, customers’
perception, Supermarket.
INTRODUCTION
Service
Kotler and Armstrong (2001) defined a service as any act or performance that one party
provides to another that is fundamentally intangible or untouched, and does not affect the ownership
of anything. Its production may or may not be tied to a physical product.
INTERNATIONAL JOURNAL OF MANAGEMENT (IJM)
ISSN 0976-6502 (Print)
ISSN 0976-6510 (Online)
Volume 4, Issue 4, July-August (2013), pp. 156-164
© IAEME: www.iaeme.com/ijm.asp
Journal Impact Factor (2013): 6.9071 (Calculated by GISI)
www.jifactor.com
IJM
© I A E M E
International Journal of Management (IJM), ISSN 0976 – 6502(Print), ISSN 0976 - 6510(Online),
Volume 4, Issue 4, July-August (2013)
157
Service Quality
Lewis and Booms (1983) defined service quality as an evaluation of the degree to which the
service provider can match the expectations of the customer.
Service quality is defined as the customer’s perception of how well a service meets or
exceeds their expectations. It is the level of conformance of service to customer specification and
expectations. Consumers form service expectations based on past experiences, marketing
communications and word-of-mouth and it is the consumer who finally judges the service quality.
This forces service marketers to take an outside-in approach and evaluate their service quality from
customer’s point of view.
Whether customers are satisfied or not, depends on the balance between customer’s
expectations and customer’s experiences with the products (Zeithaml et al., 1990). When company is
able to raise the customer’s experience to a level that exceeds customer’s expectations then it results
in to customer satisfaction.
Customers Perception
“Customers Perception has been defined as a customer’s overall impression of the relative
inferiority/superiority of an organization and its services (Bitner & Hubbert, 1994). Further, due to
technological developments, affluence and rise in level of education, customers’ perception are
greatly changing calling for organization to have concerted effort to understand these perceptions”
(Sarah wambui kimani et al, 2012)
Review of literature
Parasuraman et al. (1985) viewed quality as “the degree and direction of discrepancy between
customers’ service perception and expectations.” pp 41-50. According to this approach, services
differ from goods because they are intangible and heterogeneous, and are simultaneously produced
and consumed. Additionally, according to the disconfirmation paradigm, service quality consists
of a comparison between consumers’ expectations and their perceptions of the service actually
received.
Based on the traditional definition of service quality, Parasuraman et al. (1985) developed
their gap model of perceived service quality. The model incorporates five gaps, between: (a) the
management’s perceptions of consumer expectations and the expected service, (b) the management’s
perceptions of consumers’ expectations and the translation of those perceptions into a service-quality
specification, (c) the translation of perceptions of service-quality specification and service delivery,
(d) the service delivery and external communications to consumers, and (e) the level of service
consumers expect and the actual service performance.
This disconfirmation paradigm conceptualizes the perception of service quality as the difference
between the expected level of service and the actual service performance. The developers of the gap
model proposed 10 second-order dimensions that consumers in a broad variety of service sectors use
to assess service quality. They include: tangibles, reliability, responsiveness, competence, courtesy,
credibility, security, access, communication, and understanding (Parasuraman et al., 1985).Using
these 10 dimensions, Parasuraman et al. (1988) made the first effort to operationalize the concept of
service quality. They developed an instrument to assess service quality that empirically relied on the
difference in scores between expectations and perceived performance. Their instrument consisted of
22 items, divided along the 10 second-order dimensions, with a seven-point answer scale
accompanying each statement to test the strength of the relations. The 22 items were used to
represent five dimensions, namely: reliability, responsiveness, tangibles, assurance, and empathy.
International Journal of Management (IJM), ISSN 0976 – 6502(Print), ISSN 0976 - 6510(Online),
Volume 4, Issue 4, July-August (2013)
158
The authors measured the differences between customer expectations and perceptions across five
determinants, as follows:
1. Tangibles: Appearance of physical facilities, equipment, employees and communication materials
from the service company.
2. Reliability: The service company’s ability to perform the promised service dependably and
accurately.
3. Assurance: Employees’ knowledge and behavior about courtesy and ability to convey trust and
confidence.
4. Responsiveness: The service company’s willingness to help customers and provide punctual
services.
5. Empathy: The provision of care and individualized attention from the service company to its
customers, as well as convenient operating hours.
Parasuraman et al. (1988) thus defined service quality as the consumers’ judgment about a
firm’s overall excellence or superiority. It expresses the degree to which a number of inbuilt features
(relating to a product, a process or a system) meet requirements. The inbuilt features can be physical,
sensory, behavioral, temporal, ergonomic or functional, whilst requirements are the stated need or
expectation, be it implied or obligatory. Anything that happens and is perceived by customers during
the interaction process will obviously have critical impacts on the customers’ evaluation of service
quality (Grönroos, 2000).
Researchers suggest that customers do not perceive quality of service in a one-dimensional
way but rather judge service quality based on multiple factors relevant to the context (Zeithaml and
Bitner 2003: 93). For example, quality of automobiles is judged by such factors as reliability,
serviceability, prestige, durability, functionality and ease of use, where as quality of food products
might be assessed on other dimensions ( flavor, freshness, aroma and so on).
Problem Statement
Service quality has been seen as critical for service firms to position themselves strongly in a
competitive environment (Parasuraman, et al., 1985, Mehta et al., 2000) and also as indicators of
business performance (Hurley &Estelami, 1998). When faced with larger, powerful retail competitor,
smaller stores could compete by improving service instead of competing on price (Klemz & Boshoff,
1999). Concentrating on service quality is seen as critical in markets that offer similar products in the
store (Berry, 1986), commonly seen in grocery retail stores. However, improvement of the quality of
services requires identification of the service quality attributes - the so-called dimensions- that are
important to retail customers. Despite of these efforts, research on perception of service quality in the
supermarket is scanty.
Research Objectives
The objectives of the study are:
1. To assess customers’ expectation and perception level towards service quality of the super Market
in terms of five dimensions: tangibility, reliability, responsiveness, assurance, and empathy
(Parasuraman et al. 1988).
2. To analyze the discrepancy gap between customers & expectation and perception towards service
quality of the super Market.
International Journal of Management (IJM), ISSN 0976 – 6502(Print), ISSN 0976 - 6510(Online),
Volume 4, Issue 4, July-August (2013)
159
Research Hypothesis
1. What is the level of customer’s expectation and perception towards service quality of the Super
Market?
2. What is the discrepancy gap between customers & expectation and perception towards service
quality of the Super Market?
Research Methodology
The objective of this paper is to analyze the gaps between expectations and perceptions of
service provided by a super market whose identity is intentionally concealed to make the study
technically feasible and a hypothetical name, say XYZ super market, is used here for identification.
SERVQUAL is widely recognized and used, and it is regarded as applicable to a number of
industries, including the retail industry. While traditional marketing emphasis on product quality
(goods), growing research in service quality has made retailers to understand the importance of
service quality in their retail outlets (Bougoure & Lee, 2009).Thus, SERQUAL is used here as a tool
to find the gap in the services provided by the super market.
Population & Sample
Population of this study includes customers who are visiting to XYZ super market and the
samples of 100 respondents were selected based on convenience sampling method.
Administration of Questionnaire
The questionnaire was based on the SERQUAL model developed by Parasuraman et al
(1998) with 22 statements under five dimensions. The responses were captured in five point Likert
scale and the gap score is calculated by deducting expectations from perceptions (E-P).
Table 1: Demographic profile of the Respondents
Parameter Frequency Percentage of Respondents
Gender
Male 51 51
Female 49 49
Total 100 100
Age
Less than 20 years 11 11
21-30 years 25 25
31-40 years 27 27
41-50 years 27 27
More than 51years 10 10
Total 100 100
International Journal of Management (IJM), ISSN 0976 – 6502(Print), ISSN 0976 - 6510(Online),
Volume 4, Issue 4, July-August (2013)
160
Table 2: Step –I: Designing SERVQUAL Instrument
Strongly Disagree strongly Agree
1 2 3 4 5
Expectations Perceptions Gap
Score
Tangibles E Tangibles P E-P
Excellent Super Market will have
modern looking equipment
3.98 XYZ Super Market has
modern looking equipment
3.70 0.28
Excellent Super Market is visually
appealing.
4.00 XYZ Super Market is visually
appealing.
3.72 0.28
Excellent Super Market employees
appear neat.
3.98 XYZ Super Market employees
appear neat.
3.72 0.26
Materials associated with the service
(such as brochures or statements) are
visually appealing at Excellent Super
Market.
3.98 Materials associated with the
service (such as brochures or
statements) are visually appealing
at XYZ Super Market.
3.55 0.43
Total 15.94 14.69 1.25
Average Gap Score (Total of
E-P/4)
0.313
Reliability E Reliability P E-P
When Excellent Super Market promises
to do something by a certain time it
does so.
3.83 When XYZ Super Market
promises to do something by a
certain time it does so.
3.81 0.02
When I have a problem Excellent Super
Market shows a sincere interest in
solving it.
3,97 When I have a problem XYZ
Super Market shows a sincere
interest in solving it.
3.77 0.20
Excellent Super Market performs the
service right the first time.
4.00 XYZ Super Market performs the
service right the first time.
3.73 0.27
Excellent Super Market provides its
service at the time it promises to do so.
4.05 XYZ Super Market provides its
service at the time it promises to
do so.
3.90 0.15
Excellent Super Market insists on error-
free records.
3.97 XYZ Super Market insists on
error-free records.
3.87 0.10
Total 19.82 19.08 0.74
Average Gap Score
( Total of E-P/5)
0.148
Responsiveness E Responsiveness P E-P
Excellent Super Market keeps me
informed about when services will be
performed.
3.86 XYZ super Market keeps me
informed about when services will
be performed.
3.83 0.03
Excellent Employees at Super Market
give me prompt service.
3.90 Employees at XYZ Super Market
give me prompt service.
3.90 0
Excellent Employees at Super Market
are always willing to help me.
4.00 Employees at XYZ Super Market
are always willing to help me.
3.91 0.09
International Journal of Management (IJM), ISSN 0976 – 6502(Print), ISSN 0976 - 6510(Online),
Volume 4, Issue 4, July-August (2013)
161
Excellent Employees at Super Market
are never too busy to respond to my
request.
3.85 Employees at XYZ Super Market
are never too busy to respond to
my request.
3.88 -0.03
Total 15.61 15.52 0.09
Average Gap Score (Total of
E-P/4)
0.023
Assurance E Assurance P E-P
The behavior of employees in Excellent
Super Market instills confidence in me.
4.11 The behavior of employees in
XYZ Super Market instills
confidence in me.
3.87 0.24
I feel safe in my transactions with
Excellent Super Market
4.12 I feel safe in my transactions with
Super Market
3.78 0.34
Employees at Excellent Super Market
are consistently courteous with me.
4.12 Employees at XYZ Super Market
are consistently courteous with me.
3.80 0.32
Employees at Excellent Super Market
have the knowledge to answer my
questions.
3.76 Employees at XYZ Super Market
have the knowledge to answer my
questions.
3.76 0
Total 16.11 15.21 0.90
Average Gap Score (Total of
E-P/4)
0.225
Empathy E Empathy P E-P
Excellent Super Market gives me
individual attention.
4.08 XYZ Super Market gives me
individual attention.
3.82 0.26
Excellent Super Market has employees
who give me personal attention.
4.03 XYZ Super Market has employees
who give me personal attention.
3.59 0.44
Excellent Super Market has my best
interests at Heart
4.01 XYZ Super Market has my best
interests at Heart
3.91 0.10
Excellent Employees of Super Market
understand my specific needs.
4.00 Employees of XYZ Super Market
understand my specific needs.
3.92 0.08
Excellent Super Market has operating
hours that are convenient to me
3.83 XYZ Super Market has operating
hours that are convenient to me
4.09 -0.26
Total 19.95 19.33 0.62
Average Gap Score (Total of
E-P/5)
0.124
Table 3: Step –II: Dimension Wise Total Gap Score and Average Gap Score
Dimensions Expectations (E) Perceptions (P) Total Gap
Scores (E-P)
Average Gap Score
Tangibility 15.94 14.69 1.25 0.313
Reliability 19.82 19.08 0.74 0.148
Responsiveness 15.61 15.52 0.09 0.023
Assurance 16.11 15.21 0.90 0.225
Empathy 19.95 19.33 0.62 0.124
International Journal of Management (IJM), ISSN 0976 – 6502(Print), ISSN 0976 - 6510(Online),
Volume 4, Issue 4, July-August (2013)
162
Table 4: Step-III: Calculation of Un-weighted Score
S.No Categories Gap Scores
1 Average Gap Score for Tangibility 0.313
2 Average Gap Score for Reliability 0.148
3 Average Gap Score for
Responsiveness
0.023
4 Average Gap Score for Assurance 0.225
5 Average Gap Score for Empathy 0.124
Total 0.833
Average Un-weighted Score(Total/5) 0.167
Table 5: Ranking of Customer’s Expectations on the five features pertaining to XYZ Super
Market that is closest to service quality
Five features pertaining to XYZ Super Market Ranking
I expect that the appearance of the XYZ Super Market, physical
facilities, personnel and communication materials is good.
5
I expect that the XYZ Super Market has ability to perform the promised
service dependably and accurately.
1
I expect that XYZ Super Market has a willingness to help customers and
provide a prompt service.
4
I expect that XYZ Super Market’s personnel have knowledge and
courtesy and ability to convey trust and confidence.
2
I expect that XYZ Super Market provides its customers with caring and
individualized attention.
3
Table 6: Ranking of Customer’s Perceptions on the five features pertaining to XYZ Super
Market that is closest to service quality
Five features pertaining to XYZ Super Market Ranking
The appearance of the XYZ Super Market’s physical facilities,
personnel and communication materials is good
5
The XYZ Super Market has ability to perform the promised service
dependably and accurately.
2
The XYZ Super Market’s has a willingness to help customers and
provide a prompt service.
1
The knowledge and courtesy of the XYZ Super Market’s personnel and
their ability to convey trust and confidence are good
3
XYZ Super Market’s personnel provide caring individualized attention
to its customers.
4
International Journal of Management (IJM), ISSN 0976 – 6502(Print), ISSN 0976 - 6510(Online),
Volume 4, Issue 4, July-August (2013)
163
Table 7: Customers Perceptions towards satisfactory level on over all service quality of XYZ
Supermarket
Customers perceptions towards
satisfaction on over all service
quality
Percentage of satisfactory level
Yes 80
No 20
Findings & Recommendations
The dimension of tangibility has the highest average gap score of 0.313.Individually,
customers are very much dissatisfied in this category. It is evident that XYZ supermarket has failed
in the tangible dimension of service quality especially on the materials associated with the service
(brochures and price list) and also in the Empathy dimension of employees’ attention to the
customers.
It is found that, there is no difference between customer’s expectation and perception on
employee’s service and employees’ knowledge in the dimension of responsiveness and assurance
respectively.
Customers experience exceeds on the attribute of employees at supermarket are never too
busy to respond to the customer and operating hours of supermarket.
Ranking technique is used to rank the perception of customers on the five important attributes
relating to service quality aspects and it is found that attribute of employees at XYZ Super Market’s
have a willingness to help customers and provide a prompt service stood 1st
rank and the attribute of
the appearance of the XYZ Super Market’s physical facilities, personnel and communication
materials is good stood 5th
rank.
It is clear that 80% of respondents said that they are satisfied with the overall service quality
of XYZ supermarket.
It is suggested that XYZ supermarket has to make available of brochures, pamphlet and price
list to the customers and also has to ensure their employees to give personalized attention to the
customers. If the gap score reduces gradually; then it leads to improvement in service quality and in
turn it results in to customer satisfaction.
CONCLUSIONS
Use of SERVQUAL is common irrespective of the service organization and it has been used
here for analyzing service quality of a supermarket. Such analysis is useful in defining the weak
areas where immediate corrective action is required. Based on the above identified findings, the XYZ
might be to concentrate on to improve the physical facilities and visual displays, willingness to give
personalized attention to the customers.
Practical implications
If the corrective actions on tangibility and empathy dimensions are taken, it is sure that it
leads to improvement in service quality and it results in to customer satisfaction. Supermarket has to
undertake service quality measurement on periodical intervals to identify the gap between customers’
expectation and perception.
International Journal of Management (IJM), ISSN 0976 – 6502(Print), ISSN 0976 - 6510(Online),
Volume 4, Issue 4, July-August (2013)
164
Suggestions for Further Research
Since this research was concentrated on only one area of southern Tamilnadu in India, it is
important to increase the scope of the study in terms of geographical and as well as sample –wise to
let for generalization of the findings.
REFERENCES
1. Bougoure,U., & Lee,B.(2009).Service quality in Hong Kong: Wet Markets vs. Supermarkets.
British Food Journal.Vol.111, No.1, pp.70- 79.
http://dx.doi.org/10.1108/00070700910924245
2. Berry, L. L. (1986). Retail businesses are services businesses. Journal of Retailing, 62 (1),
spring, 3-6.
3. E.Watkins. (1976).Customer Analysis and Market Strategy- Supermarket Vs Convenience
stores. Journal of Food Distribution Research. pp 110-113.
4. Grönroos, C. (2000), Service Management and Marketing – A Customer Relationship
Management Approach. Chichester:Wiley.
5. Hurley, R. F. & Estelami, H. (1998). Alternative indexes for monitoring customer perceptions
of service quality: a comparative evaluation in a retail context. Journal of the Academy of
Marketing Science, 26 (3), 209 – 221.
6. Kotler, P. & Armstrong, G. (2001) Principles of Marketing, 9th edition, Upper Saddle River,
NJ: Prentice-Hall.
7. Klemz, B. & Boshoff C. (2001). Environmental and emotional influences on willingness- to-
buy in small and large retailers. European Journal of Marketing, 35 (1/2), 70-91.
8. Lewis, R.C & Booms, B.H. (1983), The marketing aspects of service quality. Quoted in: L.
Berry et al. Emerging perspectives on service marketing, New York: American Marketing
Association.
9. Mehta, S. C., Lalwani, A. and Han, S. L. (2000) Service quality in retailing: relative
efficiency of alternative measurement scales for different product-service environments.
International Journal of Retail & Distribution Management, 28, 2, pp. 62–72.
10. Parasuraman, A., Zeithaml,V.A. & Berry, L.L. (1985) A conceptual model of service quality
and its implications for future research. Journal of Marketing, 49, 41–50.
11. Parasuraman, A., Zeithaml,V.A. & Berry, L.L. (1988) SERVQUAL: a multiple-item scale for
measuring consumer perceptions of service quality. Journal of Retailing, 64, 12–40.
12. Sarah Wambui Kimani, Elias Kiarie Kagira, Lydia Kendi, Cleophas Muhavini Wawire &
Joseph Fourier (2012) Shoppers’perception of retail service quality: supermarkets versus
small convenience shops (Dukas) in Kenya.Journal of Management and Strategy, 3,1. pp.
55–66.
13. V.A. Zeithaml, and M.J. Bitner, Service Marketing, 3rd Edition, Ney York, United States of
America: The McGraw-Hill Companies, Inc, 2003
14. Zethaml.,V.A., Parasuraman, A.,. & Berry, L.L. (19990).Delivering quality service,
balancing customer perceptions and expectations, The Free press, New York
15. Vijay.R.Kulkarni, “A Comparative Study of Customer Perceptions of Store Atmospherics of
Spencer’s Vs Reliance Fresh”, International Journal of Management (IJM), Volume 3,
Issue 2, 2012, pp. 370 - 380, ISSN Print: 0976-6502, ISSN Online: 0976-6510.
16. N. Gunasekaran, Sangeeta Peter, Jijo George and S.Victor Anandkumar, “Alternative
Accommodation Market in Pondicherry: A study of Tourists’ Expectations and Experiences
using SERVQUAL”, International Journal of Management (IJM), Volume 3, Issue 3, 2012,
pp. 8 - 16, ISSN Print: 0976-6502, ISSN Online: 0976-6510.

Service quality measurement and customers perception about the services of supermark

  • 1.
    International Journal ofManagement (IJM), ISSN 0976 – 6502(Print), ISSN 0976 - 6510(Online), Volume 4, Issue 4, July-August (2013) 156 SERVICE QUALITY MEASUREMENT AND CUSTOMERS PERCEPTION ABOUT THE SERVICES OF SUPERMARKET *Mr.R.SatheeshKumar M.B.A., M.Phil., (Ph.D) *Author, Assistant Professor, Department of Management Studies, DC School of Management and Technology, Pullikkanam, Vagamon, Idukki, Kerala, India. **Dr.T.Vetrivel B.Sc.,M.B.A.,M.Phil.,Ph.D. **Co-Author, Professor and Head of Department of Management Studies, Velalar College of Engineering and Technology, Erode, Tamilnadu, India. ABSTRACT Service quality is the level of conformance of service to the customer specification and expectations. Whether customers are satisfied or not, depends on the balance between customer’s expectations and customer’s experiences with the products (Zeithaml et al., 1990). When company is able to raise the customer’s experience to a level that exceeds customer’s expectations then it results in to customer satisfaction. SERVQUAL is used here as a tool to find the gap in the services provided by the super market. Service quality analysis is useful in defining the weak areas where immediate corrective action is required. If the gap score reduces gradually; then it leads to improvement in service quality and in turn it results in to customer satisfaction. Key words: Service quality, Service quality dimensions, Service quality measurement, customers’ perception, Supermarket. INTRODUCTION Service Kotler and Armstrong (2001) defined a service as any act or performance that one party provides to another that is fundamentally intangible or untouched, and does not affect the ownership of anything. Its production may or may not be tied to a physical product. INTERNATIONAL JOURNAL OF MANAGEMENT (IJM) ISSN 0976-6502 (Print) ISSN 0976-6510 (Online) Volume 4, Issue 4, July-August (2013), pp. 156-164 © IAEME: www.iaeme.com/ijm.asp Journal Impact Factor (2013): 6.9071 (Calculated by GISI) www.jifactor.com IJM © I A E M E
  • 2.
    International Journal ofManagement (IJM), ISSN 0976 – 6502(Print), ISSN 0976 - 6510(Online), Volume 4, Issue 4, July-August (2013) 157 Service Quality Lewis and Booms (1983) defined service quality as an evaluation of the degree to which the service provider can match the expectations of the customer. Service quality is defined as the customer’s perception of how well a service meets or exceeds their expectations. It is the level of conformance of service to customer specification and expectations. Consumers form service expectations based on past experiences, marketing communications and word-of-mouth and it is the consumer who finally judges the service quality. This forces service marketers to take an outside-in approach and evaluate their service quality from customer’s point of view. Whether customers are satisfied or not, depends on the balance between customer’s expectations and customer’s experiences with the products (Zeithaml et al., 1990). When company is able to raise the customer’s experience to a level that exceeds customer’s expectations then it results in to customer satisfaction. Customers Perception “Customers Perception has been defined as a customer’s overall impression of the relative inferiority/superiority of an organization and its services (Bitner & Hubbert, 1994). Further, due to technological developments, affluence and rise in level of education, customers’ perception are greatly changing calling for organization to have concerted effort to understand these perceptions” (Sarah wambui kimani et al, 2012) Review of literature Parasuraman et al. (1985) viewed quality as “the degree and direction of discrepancy between customers’ service perception and expectations.” pp 41-50. According to this approach, services differ from goods because they are intangible and heterogeneous, and are simultaneously produced and consumed. Additionally, according to the disconfirmation paradigm, service quality consists of a comparison between consumers’ expectations and their perceptions of the service actually received. Based on the traditional definition of service quality, Parasuraman et al. (1985) developed their gap model of perceived service quality. The model incorporates five gaps, between: (a) the management’s perceptions of consumer expectations and the expected service, (b) the management’s perceptions of consumers’ expectations and the translation of those perceptions into a service-quality specification, (c) the translation of perceptions of service-quality specification and service delivery, (d) the service delivery and external communications to consumers, and (e) the level of service consumers expect and the actual service performance. This disconfirmation paradigm conceptualizes the perception of service quality as the difference between the expected level of service and the actual service performance. The developers of the gap model proposed 10 second-order dimensions that consumers in a broad variety of service sectors use to assess service quality. They include: tangibles, reliability, responsiveness, competence, courtesy, credibility, security, access, communication, and understanding (Parasuraman et al., 1985).Using these 10 dimensions, Parasuraman et al. (1988) made the first effort to operationalize the concept of service quality. They developed an instrument to assess service quality that empirically relied on the difference in scores between expectations and perceived performance. Their instrument consisted of 22 items, divided along the 10 second-order dimensions, with a seven-point answer scale accompanying each statement to test the strength of the relations. The 22 items were used to represent five dimensions, namely: reliability, responsiveness, tangibles, assurance, and empathy.
  • 3.
    International Journal ofManagement (IJM), ISSN 0976 – 6502(Print), ISSN 0976 - 6510(Online), Volume 4, Issue 4, July-August (2013) 158 The authors measured the differences between customer expectations and perceptions across five determinants, as follows: 1. Tangibles: Appearance of physical facilities, equipment, employees and communication materials from the service company. 2. Reliability: The service company’s ability to perform the promised service dependably and accurately. 3. Assurance: Employees’ knowledge and behavior about courtesy and ability to convey trust and confidence. 4. Responsiveness: The service company’s willingness to help customers and provide punctual services. 5. Empathy: The provision of care and individualized attention from the service company to its customers, as well as convenient operating hours. Parasuraman et al. (1988) thus defined service quality as the consumers’ judgment about a firm’s overall excellence or superiority. It expresses the degree to which a number of inbuilt features (relating to a product, a process or a system) meet requirements. The inbuilt features can be physical, sensory, behavioral, temporal, ergonomic or functional, whilst requirements are the stated need or expectation, be it implied or obligatory. Anything that happens and is perceived by customers during the interaction process will obviously have critical impacts on the customers’ evaluation of service quality (Grönroos, 2000). Researchers suggest that customers do not perceive quality of service in a one-dimensional way but rather judge service quality based on multiple factors relevant to the context (Zeithaml and Bitner 2003: 93). For example, quality of automobiles is judged by such factors as reliability, serviceability, prestige, durability, functionality and ease of use, where as quality of food products might be assessed on other dimensions ( flavor, freshness, aroma and so on). Problem Statement Service quality has been seen as critical for service firms to position themselves strongly in a competitive environment (Parasuraman, et al., 1985, Mehta et al., 2000) and also as indicators of business performance (Hurley &Estelami, 1998). When faced with larger, powerful retail competitor, smaller stores could compete by improving service instead of competing on price (Klemz & Boshoff, 1999). Concentrating on service quality is seen as critical in markets that offer similar products in the store (Berry, 1986), commonly seen in grocery retail stores. However, improvement of the quality of services requires identification of the service quality attributes - the so-called dimensions- that are important to retail customers. Despite of these efforts, research on perception of service quality in the supermarket is scanty. Research Objectives The objectives of the study are: 1. To assess customers’ expectation and perception level towards service quality of the super Market in terms of five dimensions: tangibility, reliability, responsiveness, assurance, and empathy (Parasuraman et al. 1988). 2. To analyze the discrepancy gap between customers & expectation and perception towards service quality of the super Market.
  • 4.
    International Journal ofManagement (IJM), ISSN 0976 – 6502(Print), ISSN 0976 - 6510(Online), Volume 4, Issue 4, July-August (2013) 159 Research Hypothesis 1. What is the level of customer’s expectation and perception towards service quality of the Super Market? 2. What is the discrepancy gap between customers & expectation and perception towards service quality of the Super Market? Research Methodology The objective of this paper is to analyze the gaps between expectations and perceptions of service provided by a super market whose identity is intentionally concealed to make the study technically feasible and a hypothetical name, say XYZ super market, is used here for identification. SERVQUAL is widely recognized and used, and it is regarded as applicable to a number of industries, including the retail industry. While traditional marketing emphasis on product quality (goods), growing research in service quality has made retailers to understand the importance of service quality in their retail outlets (Bougoure & Lee, 2009).Thus, SERQUAL is used here as a tool to find the gap in the services provided by the super market. Population & Sample Population of this study includes customers who are visiting to XYZ super market and the samples of 100 respondents were selected based on convenience sampling method. Administration of Questionnaire The questionnaire was based on the SERQUAL model developed by Parasuraman et al (1998) with 22 statements under five dimensions. The responses were captured in five point Likert scale and the gap score is calculated by deducting expectations from perceptions (E-P). Table 1: Demographic profile of the Respondents Parameter Frequency Percentage of Respondents Gender Male 51 51 Female 49 49 Total 100 100 Age Less than 20 years 11 11 21-30 years 25 25 31-40 years 27 27 41-50 years 27 27 More than 51years 10 10 Total 100 100
  • 5.
    International Journal ofManagement (IJM), ISSN 0976 – 6502(Print), ISSN 0976 - 6510(Online), Volume 4, Issue 4, July-August (2013) 160 Table 2: Step –I: Designing SERVQUAL Instrument Strongly Disagree strongly Agree 1 2 3 4 5 Expectations Perceptions Gap Score Tangibles E Tangibles P E-P Excellent Super Market will have modern looking equipment 3.98 XYZ Super Market has modern looking equipment 3.70 0.28 Excellent Super Market is visually appealing. 4.00 XYZ Super Market is visually appealing. 3.72 0.28 Excellent Super Market employees appear neat. 3.98 XYZ Super Market employees appear neat. 3.72 0.26 Materials associated with the service (such as brochures or statements) are visually appealing at Excellent Super Market. 3.98 Materials associated with the service (such as brochures or statements) are visually appealing at XYZ Super Market. 3.55 0.43 Total 15.94 14.69 1.25 Average Gap Score (Total of E-P/4) 0.313 Reliability E Reliability P E-P When Excellent Super Market promises to do something by a certain time it does so. 3.83 When XYZ Super Market promises to do something by a certain time it does so. 3.81 0.02 When I have a problem Excellent Super Market shows a sincere interest in solving it. 3,97 When I have a problem XYZ Super Market shows a sincere interest in solving it. 3.77 0.20 Excellent Super Market performs the service right the first time. 4.00 XYZ Super Market performs the service right the first time. 3.73 0.27 Excellent Super Market provides its service at the time it promises to do so. 4.05 XYZ Super Market provides its service at the time it promises to do so. 3.90 0.15 Excellent Super Market insists on error- free records. 3.97 XYZ Super Market insists on error-free records. 3.87 0.10 Total 19.82 19.08 0.74 Average Gap Score ( Total of E-P/5) 0.148 Responsiveness E Responsiveness P E-P Excellent Super Market keeps me informed about when services will be performed. 3.86 XYZ super Market keeps me informed about when services will be performed. 3.83 0.03 Excellent Employees at Super Market give me prompt service. 3.90 Employees at XYZ Super Market give me prompt service. 3.90 0 Excellent Employees at Super Market are always willing to help me. 4.00 Employees at XYZ Super Market are always willing to help me. 3.91 0.09
  • 6.
    International Journal ofManagement (IJM), ISSN 0976 – 6502(Print), ISSN 0976 - 6510(Online), Volume 4, Issue 4, July-August (2013) 161 Excellent Employees at Super Market are never too busy to respond to my request. 3.85 Employees at XYZ Super Market are never too busy to respond to my request. 3.88 -0.03 Total 15.61 15.52 0.09 Average Gap Score (Total of E-P/4) 0.023 Assurance E Assurance P E-P The behavior of employees in Excellent Super Market instills confidence in me. 4.11 The behavior of employees in XYZ Super Market instills confidence in me. 3.87 0.24 I feel safe in my transactions with Excellent Super Market 4.12 I feel safe in my transactions with Super Market 3.78 0.34 Employees at Excellent Super Market are consistently courteous with me. 4.12 Employees at XYZ Super Market are consistently courteous with me. 3.80 0.32 Employees at Excellent Super Market have the knowledge to answer my questions. 3.76 Employees at XYZ Super Market have the knowledge to answer my questions. 3.76 0 Total 16.11 15.21 0.90 Average Gap Score (Total of E-P/4) 0.225 Empathy E Empathy P E-P Excellent Super Market gives me individual attention. 4.08 XYZ Super Market gives me individual attention. 3.82 0.26 Excellent Super Market has employees who give me personal attention. 4.03 XYZ Super Market has employees who give me personal attention. 3.59 0.44 Excellent Super Market has my best interests at Heart 4.01 XYZ Super Market has my best interests at Heart 3.91 0.10 Excellent Employees of Super Market understand my specific needs. 4.00 Employees of XYZ Super Market understand my specific needs. 3.92 0.08 Excellent Super Market has operating hours that are convenient to me 3.83 XYZ Super Market has operating hours that are convenient to me 4.09 -0.26 Total 19.95 19.33 0.62 Average Gap Score (Total of E-P/5) 0.124 Table 3: Step –II: Dimension Wise Total Gap Score and Average Gap Score Dimensions Expectations (E) Perceptions (P) Total Gap Scores (E-P) Average Gap Score Tangibility 15.94 14.69 1.25 0.313 Reliability 19.82 19.08 0.74 0.148 Responsiveness 15.61 15.52 0.09 0.023 Assurance 16.11 15.21 0.90 0.225 Empathy 19.95 19.33 0.62 0.124
  • 7.
    International Journal ofManagement (IJM), ISSN 0976 – 6502(Print), ISSN 0976 - 6510(Online), Volume 4, Issue 4, July-August (2013) 162 Table 4: Step-III: Calculation of Un-weighted Score S.No Categories Gap Scores 1 Average Gap Score for Tangibility 0.313 2 Average Gap Score for Reliability 0.148 3 Average Gap Score for Responsiveness 0.023 4 Average Gap Score for Assurance 0.225 5 Average Gap Score for Empathy 0.124 Total 0.833 Average Un-weighted Score(Total/5) 0.167 Table 5: Ranking of Customer’s Expectations on the five features pertaining to XYZ Super Market that is closest to service quality Five features pertaining to XYZ Super Market Ranking I expect that the appearance of the XYZ Super Market, physical facilities, personnel and communication materials is good. 5 I expect that the XYZ Super Market has ability to perform the promised service dependably and accurately. 1 I expect that XYZ Super Market has a willingness to help customers and provide a prompt service. 4 I expect that XYZ Super Market’s personnel have knowledge and courtesy and ability to convey trust and confidence. 2 I expect that XYZ Super Market provides its customers with caring and individualized attention. 3 Table 6: Ranking of Customer’s Perceptions on the five features pertaining to XYZ Super Market that is closest to service quality Five features pertaining to XYZ Super Market Ranking The appearance of the XYZ Super Market’s physical facilities, personnel and communication materials is good 5 The XYZ Super Market has ability to perform the promised service dependably and accurately. 2 The XYZ Super Market’s has a willingness to help customers and provide a prompt service. 1 The knowledge and courtesy of the XYZ Super Market’s personnel and their ability to convey trust and confidence are good 3 XYZ Super Market’s personnel provide caring individualized attention to its customers. 4
  • 8.
    International Journal ofManagement (IJM), ISSN 0976 – 6502(Print), ISSN 0976 - 6510(Online), Volume 4, Issue 4, July-August (2013) 163 Table 7: Customers Perceptions towards satisfactory level on over all service quality of XYZ Supermarket Customers perceptions towards satisfaction on over all service quality Percentage of satisfactory level Yes 80 No 20 Findings & Recommendations The dimension of tangibility has the highest average gap score of 0.313.Individually, customers are very much dissatisfied in this category. It is evident that XYZ supermarket has failed in the tangible dimension of service quality especially on the materials associated with the service (brochures and price list) and also in the Empathy dimension of employees’ attention to the customers. It is found that, there is no difference between customer’s expectation and perception on employee’s service and employees’ knowledge in the dimension of responsiveness and assurance respectively. Customers experience exceeds on the attribute of employees at supermarket are never too busy to respond to the customer and operating hours of supermarket. Ranking technique is used to rank the perception of customers on the five important attributes relating to service quality aspects and it is found that attribute of employees at XYZ Super Market’s have a willingness to help customers and provide a prompt service stood 1st rank and the attribute of the appearance of the XYZ Super Market’s physical facilities, personnel and communication materials is good stood 5th rank. It is clear that 80% of respondents said that they are satisfied with the overall service quality of XYZ supermarket. It is suggested that XYZ supermarket has to make available of brochures, pamphlet and price list to the customers and also has to ensure their employees to give personalized attention to the customers. If the gap score reduces gradually; then it leads to improvement in service quality and in turn it results in to customer satisfaction. CONCLUSIONS Use of SERVQUAL is common irrespective of the service organization and it has been used here for analyzing service quality of a supermarket. Such analysis is useful in defining the weak areas where immediate corrective action is required. Based on the above identified findings, the XYZ might be to concentrate on to improve the physical facilities and visual displays, willingness to give personalized attention to the customers. Practical implications If the corrective actions on tangibility and empathy dimensions are taken, it is sure that it leads to improvement in service quality and it results in to customer satisfaction. Supermarket has to undertake service quality measurement on periodical intervals to identify the gap between customers’ expectation and perception.
  • 9.
    International Journal ofManagement (IJM), ISSN 0976 – 6502(Print), ISSN 0976 - 6510(Online), Volume 4, Issue 4, July-August (2013) 164 Suggestions for Further Research Since this research was concentrated on only one area of southern Tamilnadu in India, it is important to increase the scope of the study in terms of geographical and as well as sample –wise to let for generalization of the findings. REFERENCES 1. Bougoure,U., & Lee,B.(2009).Service quality in Hong Kong: Wet Markets vs. Supermarkets. British Food Journal.Vol.111, No.1, pp.70- 79. http://dx.doi.org/10.1108/00070700910924245 2. Berry, L. L. (1986). Retail businesses are services businesses. Journal of Retailing, 62 (1), spring, 3-6. 3. E.Watkins. (1976).Customer Analysis and Market Strategy- Supermarket Vs Convenience stores. Journal of Food Distribution Research. pp 110-113. 4. Grönroos, C. (2000), Service Management and Marketing – A Customer Relationship Management Approach. Chichester:Wiley. 5. Hurley, R. F. & Estelami, H. (1998). Alternative indexes for monitoring customer perceptions of service quality: a comparative evaluation in a retail context. Journal of the Academy of Marketing Science, 26 (3), 209 – 221. 6. Kotler, P. & Armstrong, G. (2001) Principles of Marketing, 9th edition, Upper Saddle River, NJ: Prentice-Hall. 7. Klemz, B. & Boshoff C. (2001). Environmental and emotional influences on willingness- to- buy in small and large retailers. European Journal of Marketing, 35 (1/2), 70-91. 8. Lewis, R.C & Booms, B.H. (1983), The marketing aspects of service quality. Quoted in: L. Berry et al. Emerging perspectives on service marketing, New York: American Marketing Association. 9. Mehta, S. C., Lalwani, A. and Han, S. L. (2000) Service quality in retailing: relative efficiency of alternative measurement scales for different product-service environments. International Journal of Retail & Distribution Management, 28, 2, pp. 62–72. 10. Parasuraman, A., Zeithaml,V.A. & Berry, L.L. (1985) A conceptual model of service quality and its implications for future research. Journal of Marketing, 49, 41–50. 11. Parasuraman, A., Zeithaml,V.A. & Berry, L.L. (1988) SERVQUAL: a multiple-item scale for measuring consumer perceptions of service quality. Journal of Retailing, 64, 12–40. 12. Sarah Wambui Kimani, Elias Kiarie Kagira, Lydia Kendi, Cleophas Muhavini Wawire & Joseph Fourier (2012) Shoppers’perception of retail service quality: supermarkets versus small convenience shops (Dukas) in Kenya.Journal of Management and Strategy, 3,1. pp. 55–66. 13. V.A. Zeithaml, and M.J. Bitner, Service Marketing, 3rd Edition, Ney York, United States of America: The McGraw-Hill Companies, Inc, 2003 14. Zethaml.,V.A., Parasuraman, A.,. & Berry, L.L. (19990).Delivering quality service, balancing customer perceptions and expectations, The Free press, New York 15. Vijay.R.Kulkarni, “A Comparative Study of Customer Perceptions of Store Atmospherics of Spencer’s Vs Reliance Fresh”, International Journal of Management (IJM), Volume 3, Issue 2, 2012, pp. 370 - 380, ISSN Print: 0976-6502, ISSN Online: 0976-6510. 16. N. Gunasekaran, Sangeeta Peter, Jijo George and S.Victor Anandkumar, “Alternative Accommodation Market in Pondicherry: A study of Tourists’ Expectations and Experiences using SERVQUAL”, International Journal of Management (IJM), Volume 3, Issue 3, 2012, pp. 8 - 16, ISSN Print: 0976-6502, ISSN Online: 0976-6510.