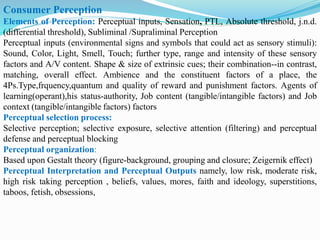
Consumer perception is influenced by various factors including sensory inputs, selective attention, past experiences, and intrinsic and extrinsic cues used to evaluate products and services. When evaluating quality, consumers rely more on extrinsic cues like branding, price, and reputation in the absence of first-hand experience. For services specifically, consumers perceive quality based on consistency, customized attention, and the gap between expectations and the actual delivery. Researchers have developed scales like SERVQUAL and SERVPERF to measure service quality gaps across tangible dimensions like facilities and reliability. High perceived service quality and satisfaction can increase purchase intentions and loyalty.


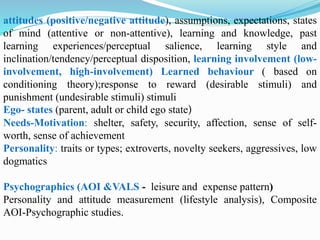
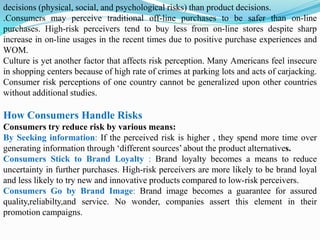
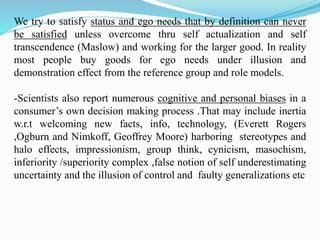
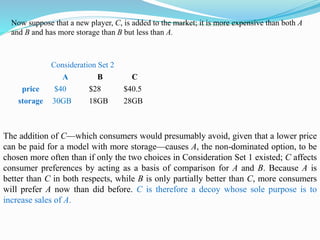
![RELATIONSHIP BETWEEN PERCEIVED PRICE / PERCEIVED QUALITY
A number of studies prove that generally customers rely on price (an extrinsic cue) as
an indicator of product quality. According to one study when consumers have little
information, or have little confidence in their own ability to make a choice on other
grounds they use price as a surrogate indicator of quality. Several studies have
interestingly shown that consumers attribute different qualities to identical products that
carry different price labels. Naturally, some ads deliberately emphasize a high price to
underscore the marketer's claim of quality. Price declines as a factor in product selection
when the consumer is familiar with a brand name or has an experience with a
product/service. Other studies as mentioned earlier show that consumers using a
price/quality relationship actually rely on expensive brand names as an indicator of
quality, without relying on price per se.As a result better brands with even average
quality are able to fetch premium prices.
.According to an important study (Dodds,Munroe,and Grewal, JoM 28 Aug-1991) both
brand and store information have a positive effect on ‘perceived quality’ and also on
‘perceived product value’ and ‘willingness to buy’.[‘Perceived Product Value’ is a
trade-off that goes on in the mind of the consumer between the product’s perceived
benefits (or quality) and the perceived sacrifice (both monetary and non-monetary) –
required to acquire it].While price as usual has a positive effect on perceived quality but
a negative effect on perceived product value and the willingness to buy. Segment
characteristics (background variables such as age and income) have also been shown to
affect perception of value.](https://image.slidesharecdn.com/consumerperceptionstudymaterialunitiii-221125155253-6d971a2a/85/consumer-perception-study-material-unit-iii-pptx-15-320.jpg)
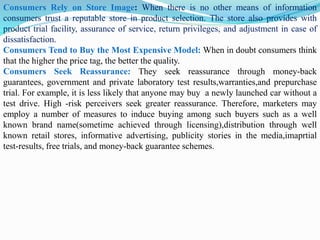
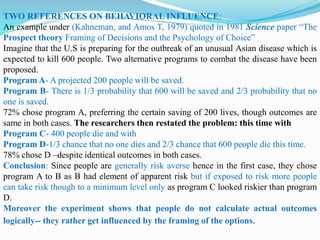
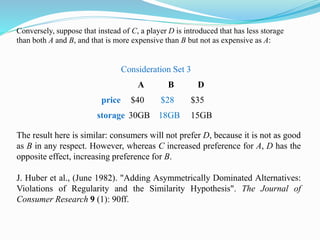
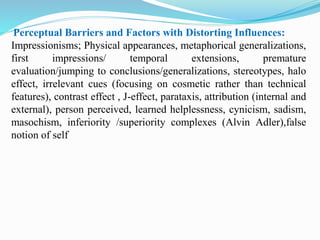
![In the context of sales pricing(discount/promo tools) stores that offer ‘frequency of
price advantage’ (small discount on large number of items) over ‘magnitude of price
advantage’ (large discounts on a smaller number of items) come to be perceived as
stores offering ‘lower prices’ and thus as ‘better value-pricing avenues’ (JoCR 21 Sep-
1994).In another study stores offering frequent price specials are perceived to be more
‘competitive’ but the constant use of sales price is harmful to the store’s image in the
long run.
Impact of Store Environment and its Constituent Factors on
Perceived Product/Service Quality:
.In one study bank customers considered the following attributes important towards a
conducive service environment namely, privacy (visual and verbal),
effiiency/convenience, ambient background, social conditions, and aesthetics.
In another study [Dhruv ,Baker et al. Journal of the Academy of Marketing Science 22
– 4(1994)]consumer perceptions were found to be heavily influenced by ‘ambient
factors (such as the number, type, and behaviour of other customers within the store and
the sales personnel) than by store design features.
.In addition to the other environmental/ambient factors as mentioned above in specific
cases showroom displays and merchandising also greatly influence consumer
perception.](https://image.slidesharecdn.com/consumerperceptionstudymaterialunitiii-221125155253-6d971a2a/85/consumer-perception-study-material-unit-iii-pptx-17-320.jpg)