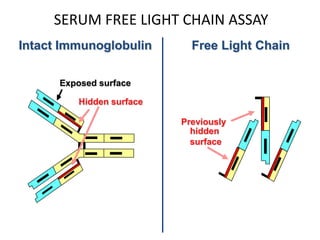
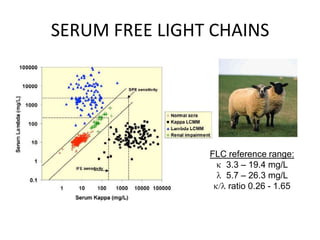
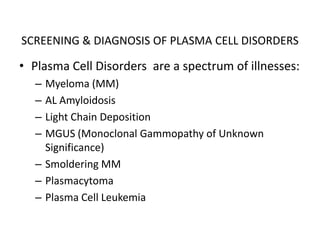
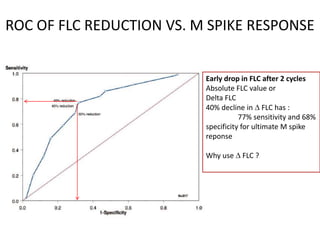
This document discusses strategies for screening, diagnosing, monitoring, and prognosticating plasma cell disorders. It presents three case studies demonstrating the utility of serum free light chain assays:
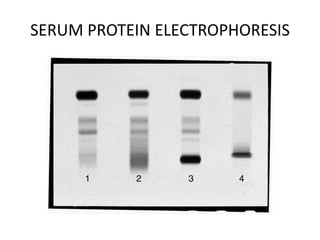
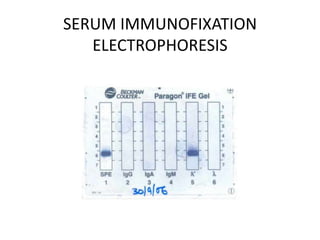
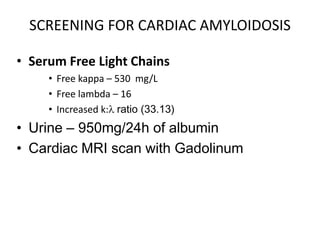
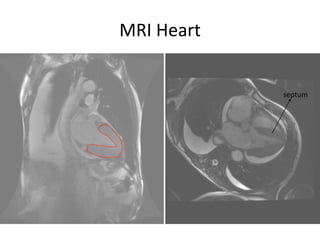
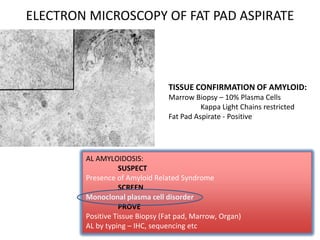
1) A case of cardiac amyloidosis diagnosed through an abnormal serum free light chain ratio and confirmed on biopsy.
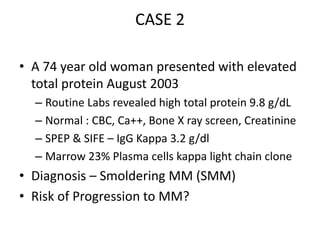
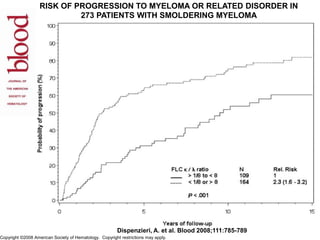
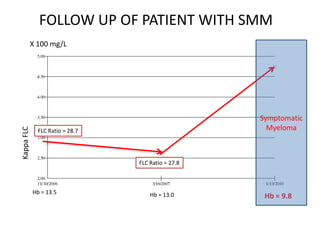
2) A patient with smoldering multiple myeloma where serial serum free light chain measurements identified risk of progression.
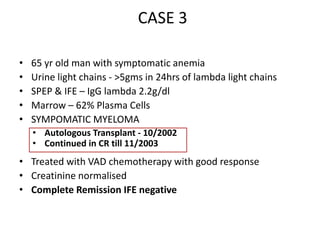
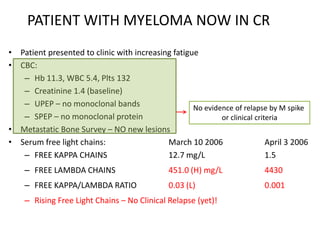
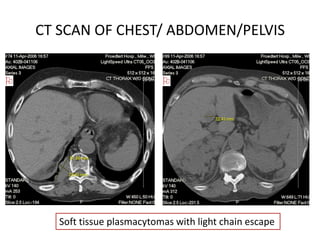
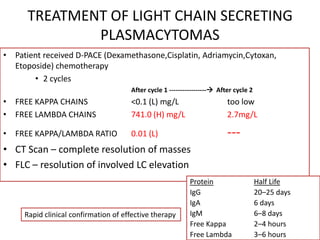
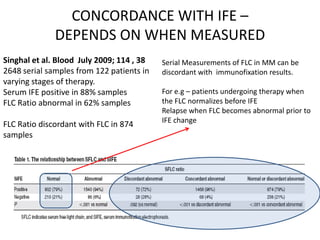
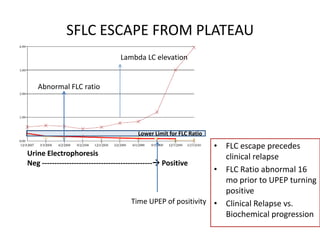
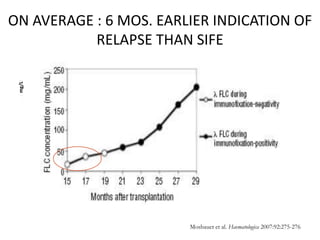
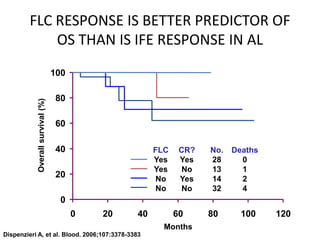
3) A patient in complete remission from multiple myeloma where a rising serum free light chain preceded clinical relapse detected on imaging. Treatment rapidly lowered the abnormal free light chains.
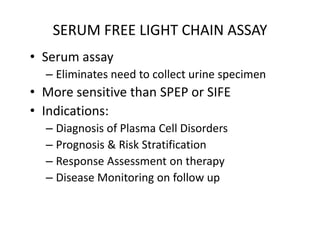
The document emphasizes how serum free light chain assays provide a sensitive marker for detecting and monitoring plasma cell disorders, complementing other