Download to read offline
![International Research Journal of Engineering and Technology (IRJET) e-ISSN: 2395-0056
Volume: 04 Issue: 08 | Aug -2017 www.irjet.net p-ISSN: 2395-0072
© 2017, IRJET | Impact Factor value: 5.181 | ISO 9001:2008 Certified Journal | Page 1458
SERIES ACTIVE POWER FILTER FOR POWER QUALITY IMPROVEMENT
Shital B. Sahare1, Sagar B. Kudkelwar2
1PG Scholar, Electrical Engineering Department & Ballarpur Institute of Technology, Ballarpur, Chandrapur
2Assistant Professor, Electrical Engineering Department & Ballarpur Institute of Technology, Ballarpur,
Chandrapur
---------------------------------------------------------------------***---------------------------------------------------------------------
Abstract - These hundreds area unit sensitive for any input
variations in voltage. The performance of the electrical
instrumentality gets worsened if they're furnished with
contaminated or distorted voltage. variety of solutions area
unit offered within the gift day apply like power issue
correction system with detuned filter, capacitance banks and
series reactors to mitigate harmonics, improve power issue,
avoid electrical resonance. Much passive filters area unit still
used those they need mounted compensationandthereforethe
threat of resonance.
Solutions to those issues are often of 2 ways- one is to vary the
look of the systems so the matter gets reduced and therefore
the alternative is to seek out a remedy for the prevailing
system. The various hundreds area unit classified in line with
the issues raised by them and to focus on the assorted sensible
solutions that may solve them to a good extent.
This paper focuses on modeling and analysis of Custom Power
Device (SAPF). MATLAB/Simulink based mostly models for
Series Active Power filter (SAPF) is given. Among varied PWM
techniques, physical phenomenon band voltage management
PWM is popularly used as a result of its simplicity of
implementation. This renowned technique doesn't would like
any info regarding system parameters. The SAPF is simulated
for various voltage variations at input generated bythe3part
programmable supply and therefore the results area unit
given.
Key Words: MATLAB Simulink, Series active power filter,
power quality.
1. INTRODUCTION
Power qualityphenomena embraceall doablethings
during which the wave form oftheprovisionvoltage(voltage
quality) or load current (current quality) deviate from the
curving wave form at rated frequency with amplitude
equivalent to the rated rms price for all 3 phases of a three-
phase system [1]. The wide selection of power quality
disturbances covers fast, short length variations, e.g.
impulsive and oscillating transients, voltage sags, short
interruptions, yet as steady state deviations, like harmonics
and flicker. One can even distinguish, supported the cause,
between disturbances associated with the standard of the
provision voltage and people associatedwiththestandard of
the present taken by the load [2].
To the primary category covers voltage dips and
interruptions, principally caused by faults within the grid.
These disturbances could cause tripping of “sensitive”
instrumentality with fatal consequences in industrial plants
wherever tripping of vital equipment will bear the stoppage
of the entire production with high prices associated.
One will say that during this case it's the supplythat
disturbs the load. To avoid consistent cash losses, industrial
customers typically conceive to install mitigation
instrumentation to shield their plants from such
disturbances. The second category covers phenomena
thanks to caliber of this drawn by the load. During this case,
it's the load that disturbs the supply. A typical example is
current harmonics drawn by worrisome masses like diode
rectifiers, or unbalanced currents drawn by unbalanced
masses. Customers don't expertise any direct production
loss associated with the incidence of those power quality
phenomena. However poor quality of this taken by many
purchasers along can ultimately lead to caliber of the facility
delivered to alternative customers [3]. Each harmonics and
unbalanced currents ultimately cause distortion and
severally, unbalance within the voltage moreover.
Therefore, correct standards area unit issued to limit the
number of harmonic currents, unbalance and/or flickerthat
a load could introduce. To fits limits set by standards,
customers typically need to install mitigation
instrumentation.
In recent years, each industrial and business
customer of utilities has reported a flood tide of
misadventures associated with power quality. the difficulty
stems from the multiplied refinement of today’s automatic
instrumentation, whether or not variable speed drives or
robots, automatic production lines or machine tools,
programmable logic controllers or power provides in
computers. They and therefore their like area unit way at
risk of disturbances on the utility system than were the
previous generation of mechanical device instrumentation
and the previous less automatic production and knowledge
systems. A growing range of masses is sensitive to
customers’ vital processes that have pricey consequences if
disturbed by either poor power quality or power
interruption.
For the explanations represented higher than, there's a
growing interest in instrumentation for mitigation of power](https://image.slidesharecdn.com/irjet-v4i8260-170921102654/85/Series-Active-Power-Filter-for-Power-Quality-Improvement-1-320.jpg)
![International Research Journal of Engineering and Technology (IRJET) e-ISSN: 2395-0056
Volume: 04 Issue: 08 | Aug -2017 www.irjet.net p-ISSN: 2395-0072
© 2017, IRJET | Impact Factor value: 5.181 | ISO 9001:2008 Certified Journal | Page 1458
SERIES ACTIVE POWER FILTER FOR POWER QUALITY IMPROVEMENT
Shital B. Sahare1, Sagar B. Kudkelwar2
1PG Scholar, Electrical Engineering Department & Ballarpur Institute of Technology, Ballarpur, Chandrapur
2Assistant Professor, Electrical Engineering Department & Ballarpur Institute of Technology, Ballarpur,
Chandrapur
---------------------------------------------------------------------***---------------------------------------------------------------------
Abstract - These hundreds area unit sensitive for any input
variations in voltage. The performance of the electrical
instrumentality gets worsened if they're furnished with
contaminated or distorted voltage. variety of solutions area
unit offered within the gift day apply like power issue
correction system with detuned filter, capacitance banks and
series reactors to mitigate harmonics, improve power issue,
avoid electrical resonance. Much passive filters area unit still
used those they need mounted compensationandthereforethe
threat of resonance.
Solutions to those issues are often of 2 ways- one is to vary the
look of the systems so the matter gets reduced and therefore
the alternative is to seek out a remedy for the prevailing
system. The various hundreds area unit classified in line with
the issues raised by them and to focus on the assorted sensible
solutions that may solve them to a good extent.
This paper focuses on modeling and analysis of Custom Power
Device (SAPF). MATLAB/Simulink based mostly models for
Series Active Power filter (SAPF) is given. Among varied PWM
techniques, physical phenomenon band voltage management
PWM is popularly used as a result of its simplicity of
implementation. This renowned technique doesn't would like
any info regarding system parameters. The SAPF is simulated
for various voltage variations at input generated bythe3part
programmable supply and therefore the results area unit
given.
Key Words: MATLAB Simulink, Series active power filter,
power quality.
1. INTRODUCTION
Power qualityphenomena embraceall doablethings
during which the wave form oftheprovisionvoltage(voltage
quality) or load current (current quality) deviate from the
curving wave form at rated frequency with amplitude
equivalent to the rated rms price for all 3 phases of a three-
phase system [1]. The wide selection of power quality
disturbances covers fast, short length variations, e.g.
impulsive and oscillating transients, voltage sags, short
interruptions, yet as steady state deviations, like harmonics
and flicker. One can even distinguish, supported the cause,
between disturbances associated with the standard of the
provision voltage and people associatedwiththestandard of
the present taken by the load [2].
To the primary category covers voltage dips and
interruptions, principally caused by faults within the grid.
These disturbances could cause tripping of “sensitive”
instrumentality with fatal consequences in industrial plants
wherever tripping of vital equipment will bear the stoppage
of the entire production with high prices associated.
One will say that during this case it's the supplythat
disturbs the load. To avoid consistent cash losses, industrial
customers typically conceive to install mitigation
instrumentation to shield their plants from such
disturbances. The second category covers phenomena
thanks to caliber of this drawn by the load. During this case,
it's the load that disturbs the supply. A typical example is
current harmonics drawn by worrisome masses like diode
rectifiers, or unbalanced currents drawn by unbalanced
masses. Customers don't expertise any direct production
loss associated with the incidence of those power quality
phenomena. However poor quality of this taken by many
purchasers along can ultimately lead to caliber of the facility
delivered to alternative customers [3]. Each harmonics and
unbalanced currents ultimately cause distortion and
severally, unbalance within the voltage moreover.
Therefore, correct standards area unit issued to limit the
number of harmonic currents, unbalance and/or flickerthat
a load could introduce. To fits limits set by standards,
customers typically need to install mitigation
instrumentation.
In recent years, each industrial and business
customer of utilities has reported a flood tide of
misadventures associated with power quality. the difficulty
stems from the multiplied refinement of today’s automatic
instrumentation, whether or not variable speed drives or
robots, automatic production lines or machine tools,
programmable logic controllers or power provides in
computers. They and therefore their like area unit way at
risk of disturbances on the utility system than were the
previous generation of mechanical device instrumentation
and the previous less automatic production and knowledge
systems. A growing range of masses is sensitive to
customers’ vital processes that have pricey consequences if
disturbed by either poor power quality or power
interruption.
For the explanations represented higher than, there's a
growing interest in instrumentation for mitigation of power](https://image.slidesharecdn.com/irjet-v4i8260-170921102654/75/Series-Active-Power-Filter-for-Power-Quality-Improvement-1-2048.jpg)
![International Research Journal of Engineering and Technology (IRJET) e-ISSN: 2395-0056
Volume: 04 Issue: 08 | Aug -2017 www.irjet.net p-ISSN: 2395-0072
© 2017, IRJET | Impact Factor value: 5.181 | ISO 9001:2008 Certified Journal | Page 1462
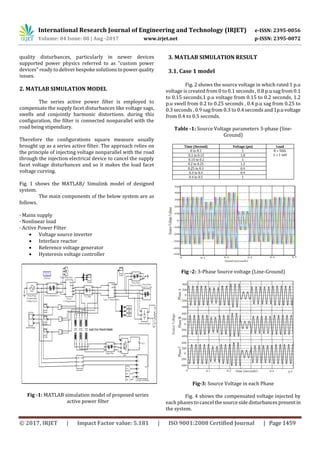
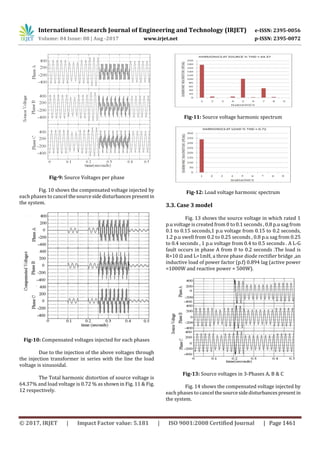
Fig-14: Compensated voltages injected for each phases
Due to the injection of the above voltages through
the injection transformer in series with the line the load
voltage is sinusoidal as shown in the Fig. 15
Fig-15: 3-Phase load voltage (Line-Ground)
The Total harmonic distortion of source voltage is
3.52% and load voltage is 1.09 % as shown in Fig. 16 & Fig.
17 respectively.
Fig-16: Source voltage harmonic spectrum
Fig-17: load voltage harmonic spectrum
The SAPF is simulated with interruptions in the
form of Sag, Swell, LG fault in the input side on phase A & the
performance of SAPF is analyzed by taking the FFT analysis
of the Source and load Voltages.
4. CONCLUSION
A Series activepowerfilterhasbeeninvestigatedfor
power quality improvement. Numerous simulations area
unit administrated to research the performance of the
system. Physical phenomenon controller primarily based
Series active power filter is enforced for harmonic and
voltage distortion compensation of the non-linear load. The
Simulation is evenextended forabnormal faultsoccurringon
the ability system like L-G & L-L faults.
This section presents an summary of series active
filter, its principle of operationanditsmanagementthemeto
come up with reference load voltage and physical
phenomenon voltage controller to administer pulses to the
series filter to inject the voltage through electrical device
asynchronous with the road and also the simulation
waveforms for supply voltage, salaried voltage and cargo
voltage area unit planned. The doctor's degree of the load
voltage with the inclusion of the active filter is well below
five-hitter that is that the harmonic limit obligatory by the
IEEE 519 standards.
REFERENCES
[1] Bhim Singh and venkateswarlu.P, “A Simplified Control
Algorithm for Three- Phase, Four-Wire Unified Power
Quality Conditioner” Journal of Power Electronics, Vol. 10,
No. 1, January 2010 pp.91-96.
[2] B.Singh,K.Al-Haddad,and A.Chandra, “A review of active
power filters for power quality improvement,” IEEE
Trans.Ind.Electron.,vol.45,no.5,pp.960- 971,Oct 1999.
[3] V.Khadkikar,A.Chandra,A.O.Barry,and T.D.Nguyen,
“Application of UPQC to protect a sensitiveloadona polluted
distribution network,” in Proc. IEEE PES General
Meeting,Montreal,QC,Canada,2006,6pp.](https://image.slidesharecdn.com/irjet-v4i8260-170921102654/85/Series-Active-Power-Filter-for-Power-Quality-Improvement-5-320.jpg)
![International Research Journal of Engineering and Technology (IRJET) e-ISSN: 2395-0056
Volume: 04 Issue: 08 | Aug -2017 www.irjet.net p-ISSN: 2395-0072
© 2017, IRJET | Impact Factor value: 5.181 | ISO 9001:2008 Certified Journal | Page 1463
[4] V.Khadkikar ,A.Chandra,A.O.Barry,and T.D.Nguyen,
“Conceptual analysis of unified power quality
conditioner(UPQC),” in proc. IEEE ISIE,2006,pp.1088-1093.
[5] Vinod Khadkikar and Ambrish Chandra, “A Novel
Structure for Three-Phase Four-Wire Distribution System
Utilizing Unified Power Quality Conditioner (UPQC)” IEEE
Transactions on Industry Appl., Vol. 45, No. 5,
September/October 2009.
[6] Yash Pal, A. Swarup, and Bhim Singh, “ A Comparison of
Three Topologies ofThree-PhaseFour-WireUPQCforPower
Quality Improvement” 16th National Power systems
conference, 15th-17th December, 2010 pp.227-232.
[7] S. Chakraborty and F. A. Farret, “ A Single Phase High
Frequency AC Microgrid with an Unified Power Quality
Conditioner,” Proceedings on IEEE 2003, pp.952-967.
[8] Active power filter with automatic control circuit for
neutral current harmonic minimization technique by mohd
izhar bin a bakar
[9] Handbook of Power Quality by Angelo Baggini.
[10] S.K. Jain, P. Agrawal and H.O. Gupta, “Fuzzy logic
controlled shunt active power filter for power quality
improvement”IEEE Proceedings on Elect.Power.Appl.Vol
149.No.5,September 2002.](https://image.slidesharecdn.com/irjet-v4i8260-170921102654/85/Series-Active-Power-Filter-for-Power-Quality-Improvement-6-320.jpg)

This document discusses the modeling and simulation of a series active power filter (SAPF) using MATLAB/Simulink software to improve power quality. SAPFs inject compensating voltages in series with the transmission line to mitigate voltage disturbances from the source, such as sags, swells, and harmonics, ensuring sinusoidal voltage at the load. The paper presents the MATLAB simulation model of a SAPF and evaluates its performance under different source voltage conditions, including interruptions and harmonic distortions. Simulation results demonstrate the SAPF is able to maintain low harmonic distortion at the load voltage below 5% even with 64% distortion in the source voltage.