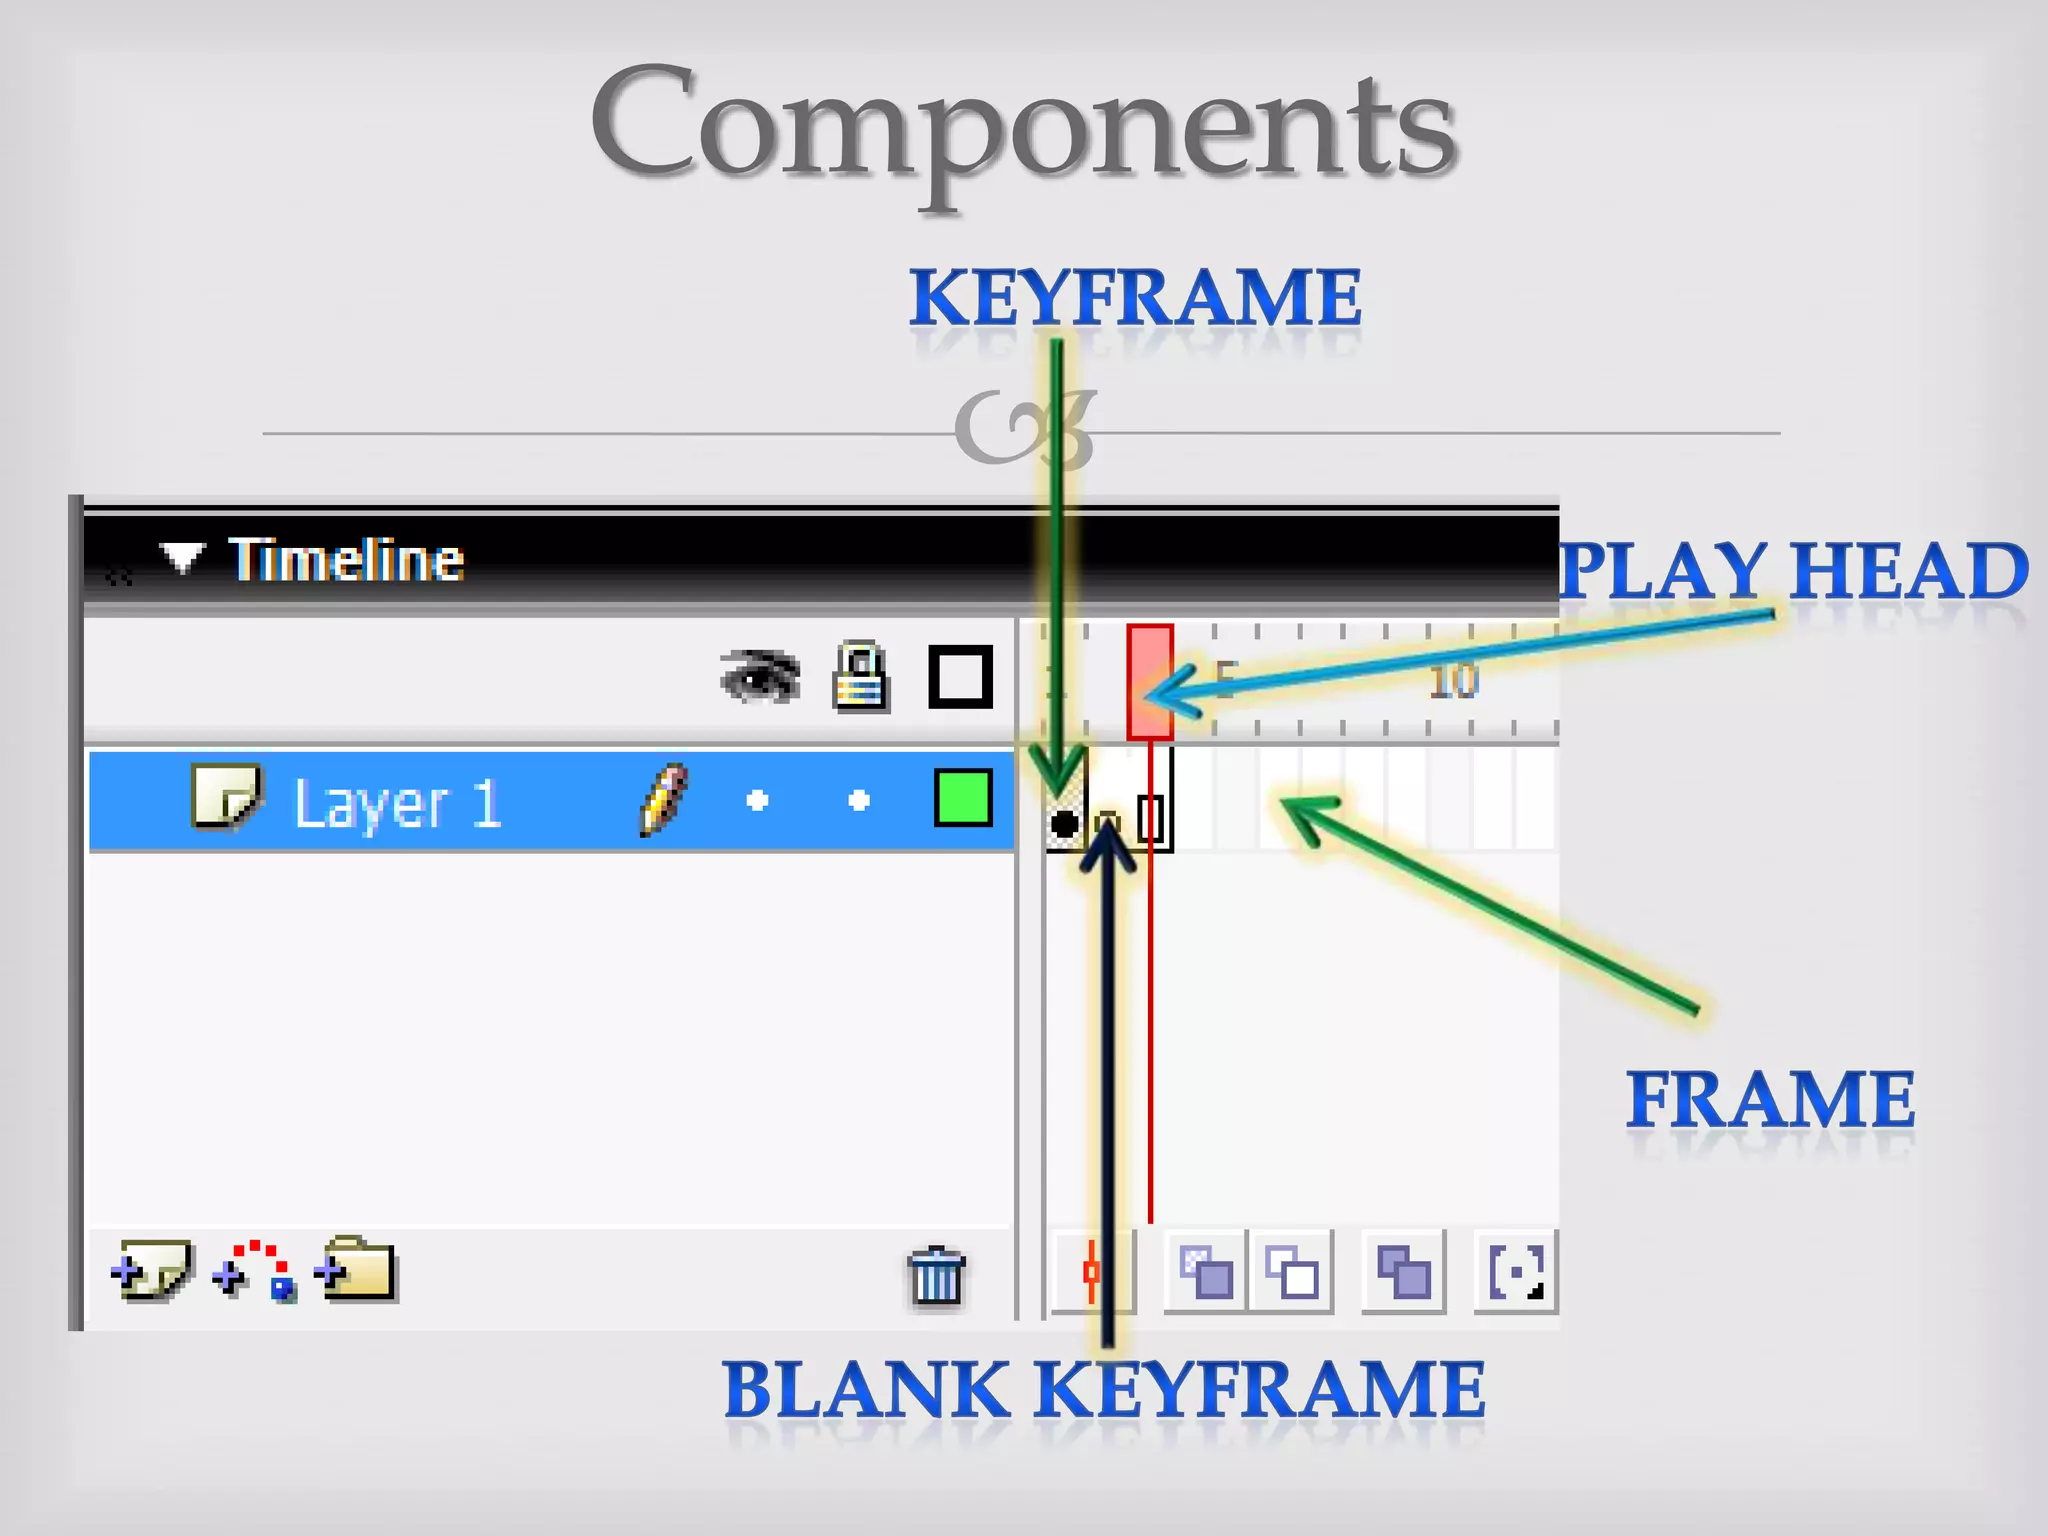
The document discusses the components and timeline of frame by frame animation in Flash. It explains that the timeline organizes content over time in layers and frames. Keyframes represent major changes and define transition points, while blank keyframes create empty areas. Frames add time but carry over previous content. The play head indicates the currently displayed frame. It provides steps to create a simple moving circle animation using keyframes and frames.
I prepared this material when I was working as a Tracking, Rigging and Animation Artist. I hope you find this material useful. All the best for your career.
The presentation showcases the basic editing tricks or commands which can help an Unix user accomplish editing tasks in Vim editor at the click of a button.
Gameplay in The Hour of Code with Star Wars | Brendan RevilleJessica Tams
Β
Delivered at Casual Connect USA 2016. The Hour of Code 2015 was the world's largest learning event, with 198,000 events taking place around the world in a single week. In partnership with Disney and LucasFilm, Code.org built a Star Wars themed tutorial played by millions of students who learned the basics of coding and in an hour. This talk goes deep into the unique challenges we faced in building a gameplay progression that was simultaneously fun, creative, educational, and inspirational.
For too long, instructional design has been reduced to page design, alignment of content and assessments with outcomes, and the βscienceβ of step-A-to-step-B learning. It has lacked imagination, spontaneity, passion, and care. What we propose here is that instructional design and the digital platforms (and spaces) we use for teaching and learning can be more. More critical. More relational. More flexible. More beautiful.
A presentation outlining the reasons and ways to implement Flash in your classroom. Includes some basic instructions for getting started. Note that it incorporates .swf files which will not appear nor work withing slideshare. I will look into uploading those .swfs independently at a later date.
SAP Sapphire 2024 - ASUG301 building better apps with SAP Fiori.pdfPeter Spielvogel
Β
Building better applications for business users with SAP Fiori.
β’ What is SAP Fiori and why it matters to you
β’ How a better user experience drives measurable business benefits
β’ How to get started with SAP Fiori today
β’ How SAP Fiori elements accelerates application development
β’ How SAP Build Code includes SAP Fiori tools and other generative artificial intelligence capabilities
β’ How SAP Fiori paves the way for using AI in SAP apps
Enhancing Performance with Globus and the Science DMZGlobus
Β
ESnet has led the way in helping national facilitiesβand many other institutions in the research communityβconfigure Science DMZs and troubleshoot network issues to maximize data transfer performance. In this talk we will present a summary of approaches and tips for getting the most out of your network infrastructure using Globus Connect Server.
Smart TV Buyer Insights Survey 2024 by 91mobiles.pdf91mobiles
Β
91mobiles recently conducted a Smart TV Buyer Insights Survey in which we asked over 3,000 respondents about the TV they own, aspects they look at on a new TV, and their TV buying preferences.
Epistemic Interaction - tuning interfaces to provide information for AI supportAlan Dix
Β
Paper presented at SYNERGY workshop at AVI 2024, Genoa, Italy. 3rd June 2024
https://alandix.com/academic/papers/synergy2024-epistemic/
As machine learning integrates deeper into human-computer interactions, the concept of epistemic interaction emerges, aiming to refine these interactions to enhance system adaptability. This approach encourages minor, intentional adjustments in user behaviour to enrich the data available for system learning. This paper introduces epistemic interaction within the context of human-system communication, illustrating how deliberate interaction design can improve system understanding and adaptation. Through concrete examples, we demonstrate the potential of epistemic interaction to significantly advance human-computer interaction by leveraging intuitive human communication strategies to inform system design and functionality, offering a novel pathway for enriching user-system engagements.
Le nuove frontiere dell'AI nell'RPA con UiPath Autopilotβ’UiPathCommunity
Β
In questo evento online gratuito, organizzato dalla Community Italiana di UiPath, potrai esplorare le nuove funzionalitΓ di Autopilot, il tool che integra l'Intelligenza Artificiale nei processi di sviluppo e utilizzo delle Automazioni.
π Vedremo insieme alcuni esempi dell'utilizzo di Autopilot in diversi tool della Suite UiPath:
Autopilot per Studio Web
Autopilot per Studio
Autopilot per Apps
Clipboard AI
GenAI applicata alla Document Understanding
π¨βπ«π¨βπ» Speakers:
Stefano Negro, UiPath MVPx3, RPA Tech Lead @ BSP Consultant
Flavio Martinelli, UiPath MVP 2023, Technical Account Manager @UiPath
Andrei Tasca, RPA Solutions Team Lead @NTT Data
The Metaverse and AI: how can decision-makers harness the Metaverse for their...Jen Stirrup
Β
The Metaverse is popularized in science fiction, and now it is becoming closer to being a part of our daily lives through the use of social media and shopping companies. How can businesses survive in a world where Artificial Intelligence is becoming the present as well as the future of technology, and how does the Metaverse fit into business strategy when futurist ideas are developing into reality at accelerated rates? How do we do this when our data isn't up to scratch? How can we move towards success with our data so we are set up for the Metaverse when it arrives?
How can you help your company evolve, adapt, and succeed using Artificial Intelligence and the Metaverse to stay ahead of the competition? What are the potential issues, complications, and benefits that these technologies could bring to us and our organizations? In this session, Jen Stirrup will explain how to start thinking about these technologies as an organisation.
LF Energy Webinar: Electrical Grid Modelling and Simulation Through PowSyBl -...DanBrown980551
Β
Do you want to learn how to model and simulate an electrical network from scratch in under an hour?
Then welcome to this PowSyBl workshop, hosted by Rte, the French Transmission System Operator (TSO)!
During the webinar, you will discover the PowSyBl ecosystem as well as handle and study an electrical network through an interactive Python notebook.
PowSyBl is an open source project hosted by LF Energy, which offers a comprehensive set of features for electrical grid modelling and simulation. Among other advanced features, PowSyBl provides:
- A fully editable and extendable library for grid component modelling;
- Visualization tools to display your network;
- Grid simulation tools, such as power flows, security analyses (with or without remedial actions) and sensitivity analyses;
The framework is mostly written in Java, with a Python binding so that Python developers can access PowSyBl functionalities as well.
What you will learn during the webinar:
- For beginners: discover PowSyBl's functionalities through a quick general presentation and the notebook, without needing any expert coding skills;
- For advanced developers: master the skills to efficiently apply PowSyBl functionalities to your real-world scenarios.
PHP Frameworks: I want to break free (IPC Berlin 2024)Ralf Eggert
Β
In this presentation, we examine the challenges and limitations of relying too heavily on PHP frameworks in web development. We discuss the history of PHP and its frameworks to understand how this dependence has evolved. The focus will be on providing concrete tips and strategies to reduce reliance on these frameworks, based on real-world examples and practical considerations. The goal is to equip developers with the skills and knowledge to create more flexible and future-proof web applications. We'll explore the importance of maintaining autonomy in a rapidly changing tech landscape and how to make informed decisions in PHP development.
This talk is aimed at encouraging a more independent approach to using PHP frameworks, moving towards a more flexible and future-proof approach to PHP development.
Encryption in Microsoft 365 - ExpertsLive Netherlands 2024Albert Hoitingh
Β
In this session I delve into the encryption technology used in Microsoft 365 and Microsoft Purview. Including the concepts of Customer Key and Double Key Encryption.
A tale of scale & speed: How the US Navy is enabling software delivery from l...sonjaschweigert1
Β
Rapid and secure feature delivery is a goal across every application team and every branch of the DoD. The Navyβs DevSecOps platform, Party Barge, has achieved:
- Reduction in onboarding time from 5 weeks to 1 day
- Improved developer experience and productivity through actionable findings and reduction of false positives
- Maintenance of superior security standards and inherent policy enforcement with Authorization to Operate (ATO)
Development teams can ship efficiently and ensure applications are cyber ready for Navy Authorizing Officials (AOs). In this webinar, Sigma Defense and Anchore will give attendees a look behind the scenes and demo secure pipeline automation and security artifacts that speed up application ATO and time to production.
We will cover:
- How to remove silos in DevSecOps
- How to build efficient development pipeline roles and component templates
- How to deliver security artifacts that matter for ATOβs (SBOMs, vulnerability reports, and policy evidence)
- How to streamline operations with automated policy checks on container images
Removing Uninteresting Bytes in Software FuzzingAftab Hussain
Β
Imagine a world where software fuzzing, the process of mutating bytes in test seeds to uncover hidden and erroneous program behaviors, becomes faster and more effective. A lot depends on the initial seeds, which can significantly dictate the trajectory of a fuzzing campaign, particularly in terms of how long it takes to uncover interesting behaviour in your code. We introduce DIAR, a technique designed to speedup fuzzing campaigns by pinpointing and eliminating those uninteresting bytes in the seeds. Picture this: instead of wasting valuable resources on meaningless mutations in large, bloated seeds, DIAR removes the unnecessary bytes, streamlining the entire process.
In this work, we equipped AFL, a popular fuzzer, with DIAR and examined two critical Linux libraries -- Libxml's xmllint, a tool for parsing xml documents, and Binutil's readelf, an essential debugging and security analysis command-line tool used to display detailed information about ELF (Executable and Linkable Format). Our preliminary results show that AFL+DIAR does not only discover new paths more quickly but also achieves higher coverage overall. This work thus showcases how starting with lean and optimized seeds can lead to faster, more comprehensive fuzzing campaigns -- and DIAR helps you find such seeds.
- These are slides of the talk given at IEEE International Conference on Software Testing Verification and Validation Workshop, ICSTW 2022.
GDG Cloud Southlake #33: Boule & Rebala: Effective AppSec in SDLC using Deplo...James Anderson
Β
Effective Application Security in Software Delivery lifecycle using Deployment Firewall and DBOM
The modern software delivery process (or the CI/CD process) includes many tools, distributed teams, open-source code, and cloud platforms. Constant focus on speed to release software to market, along with the traditional slow and manual security checks has caused gaps in continuous security as an important piece in the software supply chain. Today organizations feel more susceptible to external and internal cyber threats due to the vast attack surface in their applications supply chain and the lack of end-to-end governance and risk management.
The software team must secure its software delivery process to avoid vulnerability and security breaches. This needs to be achieved with existing tool chains and without extensive rework of the delivery processes. This talk will present strategies and techniques for providing visibility into the true risk of the existing vulnerabilities, preventing the introduction of security issues in the software, resolving vulnerabilities in production environments quickly, and capturing the deployment bill of materials (DBOM).
Speakers:
Bob Boule
Robert Boule is a technology enthusiast with PASSION for technology and making things work along with a knack for helping others understand how things work. He comes with around 20 years of solution engineering experience in application security, software continuous delivery, and SaaS platforms. He is known for his dynamic presentations in CI/CD and application security integrated in software delivery lifecycle.
Gopinath Rebala
Gopinath Rebala is the CTO of OpsMx, where he has overall responsibility for the machine learning and data processing architectures for Secure Software Delivery. Gopi also has a strong connection with our customers, leading design and architecture for strategic implementations. Gopi is a frequent speaker and well-known leader in continuous delivery and integrating security into software delivery.
5. It represents a major change within the animation which defines the starting and ending points of any smooth transition. To insert keyframe, press F6 or select Insert > Keyframe. Keyframe
6. represents a major change within the animation, the major change is that it creates a blank area on the layer. Blank Keyframe
7. a frame adds time to an animation, they just carry over the content from the previous frames. To insert a frame, press F5 or choose Insert > Frame. Frame
8. the play head is the red rectangle and line that moves across the timeline and it indicates what frame is currently being displayed on the stage. Play Head
9. Steps of a Moving Circle Frame by Frame Animation Open Macromedia Flash. Check (or modify) the Document Properties. Click frame 1 in the timeline and draw a circle at the left of the stage. Right-click frame 2 and select Insert Keyframe. Press Enter to play, Ctrl+Enter to test the movie. Save the file as framebyframe.fla. Publish the movie to create the Flash movie (.swf file).
Editor's Notes
Animated countdown timer on textured background(Difficult)Tip: Some shape effects on this slide are created with the Combine Shapes commands. To access this command, you must add it to the Quick Access Toolbar, located above the File tab. To customize the Quick Access Toolbar, do the following:Click the arrow next to the Quick Access Toolbar, and then under CustomizeQuickAccessToolbar click MoreCommands.In the PowerPointOptions dialog box, in the Choose commands from list, select All Commands. In the list of commands, click CombineShapes, and then click Add.To reproduce the donut shape effects on this slide, do the following:On the Home tab, in the Slides group, click Layout, and then click Blank.On the Insert tab, in the Illustrations group, click Shapes, and then under Basic Shapes click Donut.On the slide, drag to draw a donut. Drag the yellow sizing handle so that the donut is roughly 0.25β in thickness.Select the donut. Under Drawing Tools, on the Format tab, in the Size group, in the Height box enter 5β and in the Width box enter 5β.Also under Drawing Tools, on the Format tab, in the Shape Styles group, click Shape Outline and then click No Outline.On the Insert tab, in the Illustrations group, click Shapes, and then under Rectangles click Rectangle.On the slide, drag to draw a rectangle.Select the rectangle. Under Drawing Tools, on the Format tab, in the Size group, in the Height box enter 5.5β and in the Width box enter 0.08β.Also under Drawing Tools, on the Format tab, in the Shape Styles group, click Shape Outline and then click No Outline.Select the rectangle. On the Home tab, in the Clipboard group, click the arrow to the right of Copy, and then click Duplicate. Repeat this process this process 7 times for a total of 9 thin rectangles.Select a duplicate rectangle. Under DrawingTools, on the Format tab, in the Size group, click the Size and Position dialog box launcher. In the Format Shape dialog box, click Size in the left pane, and in the Size pane, under Size and rotate, in the Rotation box enter 10. Select another duplicate rectangle. Under DrawingTools, on the Format tab, in the Size group, click the Size and Position dialog box launcher. In the Format Shape dialog box, click Size in the left pane, and in the Size pane, under Size and rotate, in the Rotation box enter 20. Select another duplicate rectangle. Under DrawingTools, on the Format tab, in the Size group, click the Size and Position dialog box launcher. In the Format Shape dialog box, click Size in the left pane, and in the Size pane, under Size and rotate, in the Rotation box enter 30. Select another duplicate rectangle. Under DrawingTools, on the Format tab, in the Size group, click the Size and Position dialog box launcher. In the Format Shape dialog box, click Size in the left pane, and in the Size pane, under Size and rotate, in the Rotation box enter 40. Select another duplicate rectangle. Under DrawingTools, on the Format tab, in the Size group, click the Size and Position dialog box launcher. In the Format Shape dialog box, click Size in the left pane, and in the Size pane, under Size and rotate, in the Rotation box enter 50. Select another duplicate rectangle. Under DrawingTools, on the Format tab, in the Size group, click the Size and Position dialog box launcher. In the Format Shape dialog box, click Size in the left pane, and in the Size pane, under Size and rotate, in the Rotation box enter 60. Select another duplicate rectangle. Under DrawingTools, on the Format tab, in the Size group, click the Size and Position dialog box launcher. In the Format Shape dialog box, click Size in the left pane, and in the Size pane, under Size and rotate, in the Rotation box enter 70. Select the last duplicate rectangle. Under DrawingTools, on the Format tab, in the Size group, click the Size and Position dialog box launcher. In the Format Shape dialog box, click Size in the left pane, and in the Size pane, under Size and rotate, in the Rotation box enter 80. Press and hold CTRL, and then select all of the small thin rectangles. On the Quick Access Toolbar, click Combine Shapes, and then click ShapeUnion.Also on the Home tab, in the Clipboard group, click Copy, and then click Duplicate.Select the duplicate group of rectangles. On the Home tab, in the Drawing group, click Arrange, point to Rotate, and then click Rotate Right 90Β°.On the Home tab, in the Edit group, click Select, and then click Select All.Also on the Home tab, in the Drawing group, click Arrange, point to Align, and then do the following:Click Align to Slide.Click Align Middle.Click Align Center.Press and hold CTRL, select the donut shape, and then select the first group of rectangles. On the Quick Access Toolbar, click Combine Shapes, and then click ShapeSubtract.Press and hold CTRL, select the donut shape, and then select the second group of rectangles. On the Quick Access Toolbar, click Combine Shapes, and then click ShapeSubtract.On the Insert tab, in the Illustrations group, click Shapes, and then under Basic Shapes click Donut.On the slide, drag to draw a donut. Drag a sizing handle so that the donut is roughly 0.5β in thickness.Select the second donut. Under Drawing Tools, on the Format tab, in the Size group, in the Height box enter 5.21β and in the Width box enter 5.21β.Also under Drawing Tools, on the Format tab, in the Shape Styles group, click Shape Outline, and then click No Outline.Press and hold CTRL, select the second donut, and then select the first, segmented donut. On the Quick Access Toolbar, click Combine Shapes, and then click ShapeSubtract.Select the remaining donut. Under Drawing Tools, on the Format tab, in the Shape Styles group, click the Format Shape dialog box launcher. In the Format Shape dialog box, click Fill in the left pane, in the Fill pane, click Gradient fill, and then do the following:Click the button next to Preset colors and then click Silver.In the Type list, select Linear.Also in the Format Shape dialog box, click Line Color in the left pane, and then in the Line Color pane click No line.Also in the Format Shape dialog box, click Shadow in the left pane, in the Shadow pane, click the button next to Presets, and then under Outer click Offset Center. Also in the Format Shape dialog box, click 3-D Format in the left pane, in the 3-D Format pane, under Bevel, click the button next to Top and then click Slope.On the Insert tab, in the Illustrations group, click Shapes, and then under Basic Shapes click Donut.On the slide, drag to draw a donut. Drag a sizing handle so that the donut is roughly 0.25β in thickness.Select the new donut. Under Drawing Tools, on the Format tab, in the Shape Styles group, click the Format Shape dialog box launcher. In the Format Shape dialog box, click Fill in the left pane, in the Fill pane, click the button next to Color, click More Colors, and then in the Colors dialog box, on the Custom tab, enter values for Red: 194, Green: 10, and Blue: 6.Also in the Format Shape dialog box, click Line Color in the left pane, and then in the Line Color pane click No line.Also in the Format Shape dialog box, click Size in the left pane, in the Size pane, under Size and rotate, in the Height box enter 5.14β and in the Width box enter 5.14β.Select the new donut. On the Home tab, in the Drawing group, click Arrange, and then click Send Backward.Press and hold CTRL, and then select the two donuts. On the Home tab, in the Drawing group, click Arrange, point to Align, and then do the following:Click Align Selected Objects.Click Align Center.Click Align Middle.With both donuts selected, drag the donuts so that the top edge is roughly 1β from the top edge of the slide.To reproduce the other shape effects on this slide, do the following:On the Insert tab, in the Illustrations group, click Shapes, and then under Rectangles click Rectangle.On the slide, drag to draw a rectangle.Select the rectangle. On the Home tab, in the Drawing tab, click the Format Shape dialog box launcher. In the Format Shape dialog box, click Fill in the left pane, in the Fill pane, click Gradient fill, and then do the following:In the Type list, select Linear.In the Angle box, enter 90.Under Gradient stops, click Add gradient stop or Remove gradient stop until three stops appear in the slider, then customize the gradient stops as follows:Select the first stop in the slider, and then do the following: In the Position box, enter 0%.Click the button next to Color, and then under Theme Colors click Black, Text 1 (first row, first option from the left).In the Transparency box, enter 75%.Select the next stop in the slider, and then do the following: In the Position box, enter 35%.Click the button next to Color, and then under Theme Colors click Black, Text 1 (first row, first option from the left).In the Transparency box, enter 0%.Select the last stop in the slider, and then do the following: In the Position box, enter 100%.Click the button next to Color, and then under Theme Colors click Black, Text 1 (first row, first option from the left).In the Transparency box, enter 100%.Also in the Format Shape dialog box, click Line Color in the left pane, and then in the Line Color pane click No line.Also in the Format Shape dialog box, click Size, and in the Height box enter 7.5, and in the Width box enter 2.83.On the slide, select the rectangle. On the Home tab, in the Drawing group, click Arrange, and then click Send Backward.Also on the Home tab, in the Drawing group, click Arrange, point to Align, and then click AlignMiddle and Align Center.To reproduce the text effects on this slide, do the following:On the Insert tab, in the Text group, click Text Box.On the slide, drag to draw a text box.Type β3β in the text box, and then select the text. On the Home tab, in the Font group, select Lucida Bright from the Font list, select White, Background 1 from the Font Color list, and then select 96 pt. from the FontSize list.Select the text box. On the Home tab, in the Clipboard group, click the arrow next to Copy, and then click Duplicate.Select the second text box. Change the text to β2.βSelect the text box. On the Home tab, in the Clipboard group, click the arrow next to Copy, and then click Duplicate.Select the third text box. Change the text to β1.βPress and hold CTRL, and then select all three text boxes. On the Home tab, in the Drawing group, click Arrange, point to Align, and then do the following:Click Align Selected Objects.Click Align Middle.Click Align Center.With all three text boxes selected, position the text boxes in the center of the two donuts.To reproduce the animation effects on this slide, do the following:On the Home tab, in the Editing group, click Select, and then click Selection Pane.On the slide, select the silver, segmented donut. On the Animations tab, in the Advanced Animation group, click Add Animation, and then under Entrance click Grow & Turn.Also on the Animations tab, in the Timing group, do the following:In the Start list, select With Previous.In the Duration box, enter 1.00.On the slide, select the gradient-fill rectangle. On the Animations tab, in the Advanced Animation group, click Add Animation, and then click More Entrance Effects. In the Add Entrance Effect dialog box, under Subtle, click Expand.Also on the Animations tab, in the Timing group, do the following:In the Start list, select With Previous.In the Duration box, enter 1.00.On the slide, select the red, solid donut. On the Animations tab, in the Advanced Animation group, click Add Animation, and then under Entrance click Fade.Also on the Animations tab, in the Timing group, do the following:In the Start list, select After Previous.In the Duration box, enter 0.25.In the Selection and Visibility pane, select the β3β text box. On the Animations tab, in the Advanced Animation group, click Add Animation, and then under Entrance click Fade.Also on the Animations tab, in the Timing group, in the Duration box enter 0.50.Select the red, solid donut. On the Animations tab, in the Advanced Animation group, click Add Animation, and then under Exit click Wheel.Also on the Animations tab, in the Timing group, do the following:In the Start list, select With Previous.In the Duration box, enter 1.00.In the Selection and Visibility pane, select the β3β text box. On the Animations tab, in the Advanced Animation group, click Add Animation, and then under Exit click Fade.Also on the Animations tab, in the Timing group, do the following:In the Start list, select With Previous.In the Duration box, enter 0.50.In the Delay box, enter 0.50.In the Selection and Visibility pane, select the solid red donut. On the Animations tab, in the Advanced Animation group, click Add Animation, and then under Entrance click Fade.Also on the Animations tab, in the Timing group, do the following:In the Start list, select With Previous.In the Duration box, enter 0.25.In the Delay box, enter 1.00.In the Selection and Visibility pane, select the β2β text box. On the Animations tab, in the Advanced Animation group, click Add Animation, and then under Entrance click Fade.Also on the Animations tab, in the Timing group, do the following:In the Start list, select With Previous.In the Duration box, enter 0.50.In the Delay box, enter 1.00.Select the red, solid donut. On the Animations tab, in the Advanced Animation group, click Add Animation, and then under Exit click Wheel.Also on the Animations tab, in the Timing group, do the following:In the Start list, select With Previous.In the Duration box, enter 1.00.In the Selection and Visibility pane, select the β2β text box. On the Animations tab, in the Advanced Animation group, click Add Animation, and then under Exit click Fade.Also on the Animations tab, in the Timing group, do the following:In the Start list, select With Previous.In the Duration box, enter 0.50.In the Delay box, enter 1.50.In the Selection and Visibility pane, select the β1β text box. On the Animations tab, in the Advanced Animation group, click Add Animation, and then under Entrance click Fade.Also on the Animations tab, in the Timing group, do the following:In the Start list, select With Previous.In the Duration box, enter 0.50.In the Delay box, enter 1.50.In the Selection and Visibility pane, select the solid red donut. On the Animations tab, in the Advanced Animation group, click Add Animation, and then under Entrance click Fade.Also on the Animations tab, in the Timing group, do the following:In the Start list, select With Previous.In the Duration box, enter 0.25.In the Delay box, enter 1.00.In the Selection and Visibility pane, select the β1β text box. On the Animations tab, in the Advanced Animation group, click Add Animation, and then under Exit click FadeAlso on the Animations tab, in the Timing group, do the following:In the Start list, select With Previous.In the Duration box, enter 0.50.In the Delay box, enter 2.00.Select the red, solid donut. On the Animations tab, in the Advanced Animation group, click Add Animation, and then under Exit click Wheel.Also on the Animations tab, in the Timing group, do the following:In the Start list, select With Previous.In the Duration box, enter 2.00.To reproduce the background effects on this slide, do the following:On the Insert tab, in the Illustrations group, click Shapes, and then under Rectangles click Rectangle.On the slide, drag to draw a rectangle.Select the rectangle. Under Drawing Tools, on the Format tab, in the Shape Styles group, click the Format Shape dialog box. In the Format Shape dialog box, click Fill in the left pane, in the Fill pane, click Picture or texture fill, and then do the following:Click the button next to Texture and select Brown Marble (fourth row, first option from the left).Clear the Tile picture as texture box.Also in the Format Picture dialog box, click Line Color in the left pane, and in the Line Color pane, click No line.Also in the Format Picture dialog box, click Picture Corrections in the left pane, and in the Picture Corrections pane, under Brightness and contrast, do the following:In the Brightness box, enter -42%.In the Contrast Box, enter -28%.Also in the Format Picture dialog box, click Picture Color in the left pane, and in the Picture Color pane, under Recolor, click the button next to Presets and then click Grayscale.Also in the Format Picture dialog box, click Artistic Effects in the left pane, and in the Artistic Effects pane, do the following:Click the button next to Artistic Effects and then click Blur.In the Radius box, enter 7.Also in the Format Picture dialog box, click Size in the left pane, and then under Size and rotate do the following:In the Height box, enter 7.5.In the Width box, enter 10.On the slide, select the rectangle. On the Home tab, in the Drawing group, click Arrange, point to Align, and then click Align Middle and Align Center.On the Home tab, in the Clipboard group, click the arrow to the right of Copy, and then click Duplicate. Select the second, duplicate rectangle. Under Drawing Tools, on the Format tab, in the Shape Styles group, click the Format Shape dialog box launcher. In the Format Shape dialog box, click Fill in the left pane, in the Fill pane, in the Transparency box, enter 90%.Also in the Format Picture dialog box, click Picture Corrections in the left pane, and in the Picture Corrections pane, under Brightness and contrast, do the following:In the Brightness box, enter 12%.In the Contrast Box, enter 44%.Also in the Format Picture dialog box, click Artistic Effects in the left pane, and in the Artistic Effects pane, do the following:Click the button next to Artistic Effects and then click Blur.In the Radius box, enter 9.On the slide, select the rectangle. On the Home tab, in the Drawing group, click Arrange, point to Align, and then click Align Middle and Align Center.On the Home tab, in the Clipboard group, click the arrow to the right of Copy, and then click Duplicate.Select the third, duplicate rectangle. Under Picture Tools, on the Format tab, in the Adjust group, click Reset Picture.Also under Picture Tools, on the Format tab, in the Picture Styles group, click the Format Picture dialog box launcher. In the Format Picture dialog box, click Fill in the left pane, and then in the Fill pane, do the following:Click the button next to Texture and then click Granite.Select Tile picture as texture.In the Transparency box, enter 94%.Also in the Format Picture dialog box, click Picture Corrections in the left pane, in the Picture Corrections pane, under Brightness and contrast, do the following:In the Brightness box, enter 2%.In the Contrast box, enter 70%.Also in the Format Picture dialog box, click Artistic Effects in the left pane, and then in the Artistic Effects pane, do the following:Click the button next to Artistic Effect and then click Photocopy.In the Detail box, enter 9.On the slide, select the third rectangle. On the Home tab, in the Drawing group, click Arrange, point to Align, and then click Align Middle and Align Center.On the Home tab, in the Clipboard group, click the arrow to the right of Copy, and then click Duplicate.Select the fourth, duplicate rectangle. On the Home tab, in the Drawing group, click the FormatShape dialog box launcher. In the Format Picture dialog box, click Fill in the left pane, in the Fill pane, click Gradient fill, and then do the following:In the Type list, select Radial. In the Direction list, select From Center.Under Gradient stops, click Add gradient stop or Remove gradient stop until two stops appear on the slider. Customize the gradient stops as follows:Select the first stop in the slider, and then do the following: In the Position box, enter 0%.Click the button next to Color, and then under Theme Colors click Black, Text 1 (first row, second option from the left).In the Transparency box, enter 100%.Select the last stop in the slider, and then do the following: In the Position box, enter 100%.Click the button next to Color, and then under Theme Colors click Black, Text 1 (first row, second option from the left).In the Transparency box, enter 50%.On the slide, select the fourth rectangle. On the Home tab, in the Drawing group, click Arrange, point to Align, and then click Align Middle and Align Center.Also on the Home tab, in the Editing group, click Select, and then click Select All.Also on the Home tab, in the Drawing group, click Arrange, and then click Group.On the slide, select the grouped rectangles. Also on the Home tab, in the Clipboard group, click Cut.Also on the Home tab, in the Clipboard group, click the arrow below Paste, and select Paste Special. In the Paste Special dialog box, select Paste, and then under As, select Picture (PNG).Also on the Home tab, in the Drawing group, click Arrange, point to Align and then click Align Middle and Align Center.