SlideShare a Scribd company logo
1 of 31
Download to read offline
Sensor Technology
Sweta Barnwal Page 1
TOPICS: Sensors, Signals and Systems; Sensor Classification; Units of Measurements; Sensor
Characteristics; Electric Charges, Fields and Potentials Capacitance; Magnetism Induction, Resistance;
Piezoelectric Effect, Hall Effect, Temperature and Thermal Properties of Material, Heat Transfer, Light,
Dynamic Models of Sensor Elements
Module: 1
(Sensors: Different Types of Sensors)
Sensors are sophisticated devices that are frequently used to detect and respond to electrical or optical
signals. A Sensor converts the physical parameter (for example: temperature, blood pressure, humidity,
speed, etc.) into a signal which can be measured electrically. Let’s explain the example of temperature. The
mercury in the glass thermometer expands and contracts the liquid to convert the measured temperature which
can be read by a viewer on the calibrated glass tube.
Figure 1: Anatomy of a Sensor System
Figure 2: Schematic Representation of Smart Sensor
Sensor Technology
Sweta Barnwal Page 2
Criteria to choose a Sensor
There are certain features which have to be considered when we choose a sensor. They are as given below:
1. Accuracy
2. Environmental condition – usually has limits for temperature/ humidity
3. Range – Measurement limit of sensor
4. Calibration – Essential for most of the measuring devices as the readings changes with time
5. Resolution – Smallest increment detected by the sensor
6. Cost
7. Repeatability – The reading that varies is repeatedly measured under the same environment
Classification based on property is as given below:
· Temperature – Thermistors, thermocouples, RTD’s, IC and many more.
· Pressure – Fibre optic, vacuum, elastic liquid-based manometers, LVDT, electronic.
· Flow – Electromagnetic, differential pressure, positional displacement, thermal mass, etc.
· Level Sensors – Differential pressure, ultrasonic radio frequency, radar, thermal displacement, etc.
· Proximity and displacement – LVDT, photoelectric, capacitive, magnetic, ultrasonic.
· Biosensors – Resonant mirror, electrochemical, surface Plasmon resonance, Light addressable potentio-
metric.
· Image – Charge coupled devices, CMOS
· Gas and chemical – Semiconductor, Infrared, Conductance, Electrochemical.
· Acceleration – Gyroscopes, Accelerometers.
· Others – Moisture, humidity sensor, Speed sensor, mass, Tilt sensor, force, viscosity.
Signal & System:
Signal is an electric or electromagnetic current carrying data that can be transmitted or received.
Mathematically represented as a function of an independent variable e.g. density, depth, etc. Therefore, a
signal is a physical quantity that varies with time, space, or any other independent variable by which
information can be conveyed. Here independent variable is time.
Types of time signals:
1. Continuous time signals x(t)- defined at every point in time
2. Discrete time signals x[n] – defined only at a discrete set of values of time (integer).
A System is any physical set of components or a function of several devices that takes a signal in input, and
produces a signal as output.
Calculating Energy and Power of signals:
Energy– Square of amplitude/magnitude (if complex) over entire time domain.
for a continuous time signal- for a discrete time signal-
Power- It is known as rate of change of energy.
Equation of Power for a continuous time signal, & for a discrete time signal-
Sensor Technology
Sweta Barnwal Page 3
Classes of signals on the basis of their power and energy:
1. Energy signal– generally converging signals, a periodic signal or signals that are bounded.
2. Power signal– generally periodic signals, as they encompass infinite area under their graph and extend
from ( -∞ to +∞).
3. Neither energy nor power signal.
Transformation of the independent variable:
1. Shifting- the signal can be delayed ( x(t-T) ) or advanced ( x(t+T) ) by incrementing or decrementing
the independent variable (time here).
The shape of the graph remains same only shifted on the time axis.
2. Scaling- the signal can be compressed ( x(at), a>1 ) or expanded ( x(t/a), a>1 or x(at), 1>a>0 ).
Here the shape/behaviour of the graph of the signal changes as the fundamental time period changes. In
compression the time period decreases and in expansion the time period increases.
3. Reversal- also called folding as the graph is folded about the Y-axis or T if given x(T-t).
Properties of systems:
1. Periodicity- the signal’s behavior/graph repeats after every T. Therefore,
here T is the fundamental period
So we can say signal remains unchanged when shifted by multiples of T.
2. Even and Odd- an even signal is symmetric about the Y-axis.
x(t)=x(-t) even
x(t)=-x(-t) odd
A signal can be broken into it’s even and odd parts to make certain conversions easy.
3. Linearity- constitutes of two properties-
(i) Additivity/Superposition-
if x1(t) -> y1(t)
and x2(t) -> y2(t)
(ii) Property of scaling-
if x1(t) -> y1(t)
then
Sensor Technology
Sweta Barnwal Page 4
If both are satisfied, the system is linear.
4. Time invariant- Any delay provided in the input must be reflected in the output for a time invariant
system.
here x2(t) is a delayed input.
We check if putting a delayed input through the system is the same as a delay in the output signal.
5. LTI systems- A linear time invariant system. A system that is linear and time-invariant.
6. BIBO stability- The bounded input bounded output stability.
We say a system is BIBO stable if-
7. Causality- Causal signals are signals that are zero for all negative time.
If any value of the output signal depends on a future value of the input signal then the signal is non-
causal.
UNIT OF MEASUREMENTS
As civilization developed, a wide variety of measuring scales came into existence, many for the same quantity
(such as length), but adapted to particular activities or trades. Eventually, it became apparent that in order for
trade and commerce to be possible, these scales had to be defined in terms of standards that would allow
measures to be verified, and, when expressed in different units (bushels and pecks, for example), to be
correlated or converted.
HISTORY OF UNITS
Over the centuries, hundreds of measurement units and scales have developed in the many civilizations that
achieved some literate means of recording them. Some, such as those used by the Aztecs, fell out of use and
were largely forgotten as these civilizations died out. Other units, such as the various systems of measurement
that developed in England, achieved prominence through extension of the Empire and widespread trade; many
of these were confined to specific trades or industries. The examples shown here are only some of those that
have been used to measure length or distance. The history of measuring units provides a fascinating reflection
on the history of industrial development.
The most influential event in the history of measurement was undoubtedly the French Revolution and the Age
of Rationality that followed. This led directly to the metric system that attempted to do away with the
confusing multiplicity of measurement scales by reducing them to a few fundamental ones that could be
combined in order to express any kind of quantity. The metric system spread rapidly over much of the world,
and eventually even to England and the rest of the U.K. when that country established closer economic ties
with Europe in the latter part of the 20th Century. The United States is presently the only major country in
which “metrication” has made little progress within its own society, probably because of its relative
geographical isolation and its vibrant internal economy.
Science, being a truly international endeavor, adopted metric measurement very early on; engineering and
related technologies have been slower to make this change, but are gradually doing so. Even the within the
metric system, however, a variety of units were employed to measure the same fundamental quantity; for
example, energy could be expressed within the metric system in units of ergs, electron-volts, joules, and two
Sensor Technology
Sweta Barnwal Page 5
kinds of calories. This led, in the mid-1960s, to the adoption of a more basic set of units, the System
International (SI) units that are now recognized as the standard for science and, increasingly, for technology
of all kinds.
THE SEVEN SI BASE UNITS AND DECIMAL PREFIXES
In principle, any physical quantity can be expressed in terms of only seven base units, with each base unit
defined by a standard described below.
A few special points about some of these units are worth noting:
• The base unit of mass is unique in that a decimal prefix (Table 1.4.21.4.2) is built into it; i.e., the base
SI unit is not the gram.
• The base unit of time is the only one that is not metric. Numerous attempts to make it so have never
garnered any success; we are still stuck with the 24:60:60 system that we inherited from ancient times.
The ancient Egyptians of around 1500 BC invented the 12-hour day, and the 60:60 part is a remnant of
the base-60 system that the Sumerians used for their astronomical calculations around 100 BC.
• Of special interest to Chemistry is the mole, the base unit for expressing the quantity of matter.
Although the number is not explicitly mentioned in the official definition, chemists define the mole as
Avogadro’s number (approximately 6.02x10²³
) of anything.
The Seven Base Units
Property Unit Symbol
length meter m
mass kilogram kg
time second s
temperature (absolute) kelvin K
amount of substance mole mol
electric current ampere A
luminous intensity candela cd
Owing to the wide range of values that quantities can have, it has long been the practice to employ prefixes
such as milli and mega to indicate decimal fractions and multiples of metric units. As part of the SI standard,
this system has been extended and formalized (Table 1.4.21.4.2).
Prefixes used to scale up or down base units
Prefix Abbreviation Multiplier Prefix Abbreviation Multiplier
peta P 1018
deci s 10–1
tera T 1012
centi c 10–2
giga G 109
milli m 10–3
mega M 106
micro μ 10–6
Sensor Technology
Sweta Barnwal Page 6
Prefixes used to scale up or down base units
Prefix Abbreviation Multiplier Prefix Abbreviation Multiplier
kilo k 103
nano n 10–9
hecto h 102
pico p 10–12
deca da 10 femto f 10–15
PSEUDO SI UNITS
There is a category of units that are “honorary” members of the SI in the sense that it is acceptable to use them
along with the base units defined above. These include such mundane units as the hour, minute, and degree
(of angle), etc., but the three shown here are of particular interest to chemistry, and you will need to know
them.
liter (litre) L 1 L = 1 dm3
= 10–3
m3
metric ton t 1 t = 103
kg
united atomic mass unit (amu) u 1 u = 1.66054×10⁻²⁷
kg
DERIVED UNITS AND DIMENSIONS
Most of the physical quantities we actually deal with in science and also in our daily lives, have units of their
own: volume, pressure, energy and electrical resistance are only a few of hundreds of possible examples. It is
important to understand, however, that all of these can be expressed in terms of the SI base units; they are
consequently known as derived units. In fact, most physical quantities can be expressed in terms of one or
more of the following five fundamental units:
• mass (M)
• length (L)
• time (T)
• electric charge (Q)
• temperature (Θ theta)
Consider, for example, the unit of volume, which we denote as V. To measure the volume of a rectangular
box, we need to multiply the lengths as measured along the three coordinates:
V=x⋅y⋅z(1.4.1)(1.4.1)V=x·y·z
We say, therefore, that volume has the dimensions of length-cubed:
dim{V}=L3(1.4.2)(1.4.2)dim{V}=L3
Thus the units of volume will be m3
(in the SI) or cm3
, ft3
(English), etc. Moreover, any formula that
calculates a volume must contain within it the L3
dimension; thus the volume of a sphere is 4/3πr34/3πr3.
Sensor Technology
Sweta Barnwal Page 7
The dimensions of a unit are the powers which M, L, t, Q and Q must be given in order to express the unit.
Thus,
dim{V}=M0L3T0Q0Θ0(1.4.3)(1.4.3)dim{V}=M0L3T0Q0Θ0
as given above.
There are several reasons why it is worthwhile to consider the dimensions of a unit.
1. Perhaps the most important use of dimensions is to help us understand the relations between various
units of measure and thereby get a better understanding of their physical meaning. For example, a look
at the dimensions of the frequently confused electrical terms resistance and resistivity should enable
you to explain, in plain words, the difference between them.
2. By the same token, the dimensions essentially tell you how to calculate any of these quantities, using
whatever specific units you wish. (Note here the distinction between dimensions and units.)
3. Just as you cannot add apples to oranges, an expression such as a=b+cx2a=b+cx2 is meaningless
unless the dimensions of each side are identical. (Of course, the two sides should work out to the same
units as well.)
4. Many quantities must be dimensionless— for example, the variable x in expressions such
as logxlog⁡x, exex, and sinxsin⁡x. Checking through the dimensions of such a quantity can help
avoid errors.
The formal, detailed study of dimensions is known as dimensional analysis and is a topic in any basic physics
course.
Sensor Technology
Sweta Barnwal Page 8
Module: 2
ELECTRIC CHARGE
It is that physical property of matter due to which the other matter experiences a force when matters are
placed in electromagnetic field. Electric charge is also known as Charge, Electrical Charge and Electrostatic
Charge. It is denoted by symbol ‘q’. It is a scalar quantity as charge has only magnitude and no direction.
The two types of charges exist in nature: Positive and Negative Charge.
Same charge repels each other and opposite charge attract each other. In the figure given below, we can see
that like charge are repelling each other, while opposites are attracting each other.
Example of Electric Charge
We know that in a nucleus proton and neutron exists while electron revolve around the nucleus.
Proton (p+) have positive charge and electron (e-) have negative charge. As symbol of proton is (p+) so
proton carrying positive charge and symbol of electron is (e-) so electron carrying negative charge. As number
of proton and electron in a nucleus are equal so net charge on nucleus is zero.
For existing the net charge on a body the sum of positive and negative charge should be equal to zero.
Properties of Electric Charge
• Charge is measured in terms of Coulombs (C)
• Charge is a scalar quantity
• Charge can be positive or negative
• Charge of proton and electron have same in magnitude but opposite in sign. Proton have charge 1.6 *
10-19
C while electron have -1.6 * 10-19
C
• Charge is conserved while transferring.
• Charge is quantized in nature.
Example: Q = n e where e, is the electric unit of charge and its value is 1.6 * 10-19. C and n is a integer it
may be positive or negative.
ELECTRIC FIELD
It is the region around a charge particle or object due to which another charge particle or object experience
force. Electric Field is a vector quantity so we must consider the sign in numerical.
Formula of Electric Field;
Unit of electric field: E = N/C
As, unit of force is Newton (N) and charge is Coulomb ( C), So unit of electric field is N/C.
Note: While writing the unit 1st
letter should be capital.
In the above formula F is the force and q is the charge. F is calculated in terms of coulombs law.
Sensor Technology
Sweta Barnwal Page 9
Coulombs law is stated as force acting on a charge particle due to another charge particle is directly
proportional to product of their charges and inversely proportional to square of distance between the charges.
From the above definition, of coulomb’s force;
Where, k is the proportionality constant and its value is 9 * 109 Nm2/C2. It is different for different medium.
SI unit of F is = N m2 C2/C2 m2
So, on solving above equation we get F = Newton (N)
How to calculate the Direction of E?
Direction of Electric Field is always from positive charge to negative charge. In terms of single positive
charge Electric field move away from the positive charge as shown in the first part of the diagram and in
terms of negative charge Electric field move towards the negative charge as shown in the second part of the
diagram. In third diagram, all the three directions are used. Firstly, Electric field goes from Positive charge to
negative charge. Secondly, In terms of positive charge field lines are moving away from positive charge and
in terms of negative charge field lines are coming towards the charge.
Sensor Technology
Sweta Barnwal Page 10
Detection of electric field
When a detection electrode is brought close to an electrified body, an electric charge that is proportional to the
intensity of the electric field is induced in the detection electrode due to "electrostatic induction".
The electrostatic sensor opens and closes a tuning-fork vibrating plate called a chopper in front of the
detection electrode in order to cancel out DC noise and perform higher precision measurement. The sensor
detects the intensity of the electric field by receiving the induced electric charge as a communication signal.
Conversion to electric potential
Electric potential is proportional to the intensity of the electric field, but the intensity of the electric field gets
smaller as it gets further away from an electrified object.
Therefore, the electrostatic sensor sets a distance between the electrified object and the sensor using a
controller and a corrected calculation of the electric potential is performed.
Characteristics based on the principle of electrostatic sensor detection
Since an electric field relies on the measurement distance, you need to fix the sensor at a set distance in order
to perform a high precision measurement.
The electric field that is produced by an electrified object spreads concentrically out from the electrified
object. Therefore, the electrostatic sensor that detects the electric field measures a wider range as the
measurement distance increases.
Moreover, the existing electrostatic sensors and electrometers have the same range characteristics since they
all detect the electric field.
CAPACITANCE & MAGNETISM
Capacitive proximity sensors are non-contact devices that can detect the presence or absence of virtually any
object regardless of material. They utilize the electrical property of capacitance and the change of capacitance
based on a change in the electrical field around the active face of the sensor.
Capacitive sensing technology is often used in other sensing technologies such as:
• flow
Sensor Technology
Sweta Barnwal Page 11
• pressure
• liquid level
• spacing
• thickness
• ice detection
• shaft angle or linear position
• dimmer switches
• key switches
• x-y tablet
• accelerometers
Principle of operation
A capacitive sensor acts like a simple capacitor. A metal plate in the sensing face of the sensor is electrically
connected to an internal oscillator circuit and the target to be sensed acts as the second plate of the capacitor.
Unlike an inductive sensor that produces an electromagnetic field a capacitive sensor produces an electrostatic
field.
The external capacitance between the target and the internal sensor plate forms a part of the feedback
capacitance in the oscillator circuit. As the target approaches the sensors face the oscillations increase until
they reach a threshold level and activate the output.
Capacitive sensors have the ability to adjust the sensitivity or the threshold level of the oscillator. The
sensitivity adjustment can be made by adjusting a potentiometer, using an integral teach pushbutton or
remotely by using a teach wire. If the sensor does not have an adjustment method then the sensor must
physically be moved for sensing the target correctly. Increasing the sensitivity causes a greater operating
distance to the target. Large increases in sensitivity can cause the sensor to be influenced by temperature,
humidity, and dirt.
There are two categories of targets that capacitive sensors can detect the first being conductive and the second
is non-conductive. Conductive targets include metal, water, blood, acids, bases, and salt water. These targets
have a greater capacitance and a targets dielectric strength is immaterial. The non-conductive target category
acts like an insulator to the sensor’s electrode.
Magnetic sensors are solid state devices that are becoming more and more popular because they can be used
in many different types of application such as sensing position, velocity or directional movement. They are
also a popular choice of sensor for the electronics designer due to their non-contact wear free operation, their
low maintenance, robust design and as sealed hall effect devices are immune to vibration, dust and water.
One of the main uses of magnetic sensors is in automotive systems for the sensing of position, distance and
speed. For example, the angular position of the crank shaft for the firing angle of the spark plugs, the position
of the car seats and seat belts for air-bag control or wheel speed detection for the anti-lock braking system,
(ABS).
Sensor Technology
Sweta Barnwal Page 12
Magnetic sensors are designed to respond to a wide range of positive and negative magnetic fields in a variety
of different applications and one type of magnet sensor whose output signal is a function of magnetic field
density around it is called the Hall Effect Sensor.
Inductive sensors use currents induced by magnetic fields to detect nearby metal objects. The inductive sensor
uses a coil (an inductor) to generate a high frequency magnetic field as shown in Figure 1 below. If there is a
metal object near the changing magnetic field, current will flow in the object.
This resulting current flow sets up a new magnetic field that opposes the original magnetic field. The net
effect is that it changes the inductance of the coil in the inductive sensor.
These sensors will detect any metals, when detecting multiple types of metal multiple sensors are often used.
Note: these work by setting up a high frequency field. If a target nears the field will induce eddy currents.
These currents consume power because of resistance, so energy is in the field is lost, and the signal amplitude
decreases. The detector examines filed magnitude to determine when it has decreased enough to switch.
The sensors can detect objects a few centimeters away from the end. But, the direction to the object can be
arbitrary as shown in Figure 2 below.
The magnetic field of the unshielded sensor covers a larger volume around the head of the coil. By adding a
shield (a metal jacket around the sides of the coil) the magnetic field becomes smaller, but also more directed.
Shields will often be available for inductive sensors to improve their directionality and accuracy.
HALL EFFECT SENSORS
These devices which are activated by an external magnetic field. We know that a magnetic field has two
important characteristics flux density, (B) and polarity (North and South Poles). The output signal from a Hall
effect sensor is the function of magnetic field density around the device. When the magnetic flux density
around the sensor exceeds a certain pre-set threshold, the sensor detects it and generates an output voltage
called the Hall Voltage, VH. Consider the diagram below.
Sensor Technology
Sweta Barnwal Page 13
Hall Effect Sensor Principles
Hall Effect Sensors consist basically of a thin piece of rectangular p-type semiconductor material such as
gallium arsenide (GaAs), indium antimonide (InSb) or indium arsenide (InAs) passing a continuous current
through itself. When the device is placed within a magnetic field, the magnetic flux lines exert a force on the
semiconductor material which deflects the charge carriers, electrons and holes, to either side of the
semiconductor slab. This movement of charge carriers is a result of the magnetic force they experience
passing through the semiconductor material.
As these electrons and holes move side wards a potential difference is produced between the two sides of the
semiconductor material by the build-up of these charge carriers. Then the movement of electrons through the
semiconductor material is affected by the presence of an external magnetic field which is at right angles to it
and this effect is greater in a flat rectangular shaped material.
The effect of generating a measurable voltage by using a magnetic field is called the Hall Effect after Edwin
Hall who discovered it back in the 1870’s with the basic physical principle underlying the Hall effect being
Lorentz force. To generate a potential difference across the device the magnetic flux lines must be
perpendicular, (90o
) to the flow of current and be of the correct polarity, generally a south pole.
The Hall effect provides information regarding the type of magnetic pole and magnitude of the magnetic field.
For example, a south pole would cause the device to produce a voltage output while a north pole would have
no effect. Generally, Hall Effect sensors and switches are designed to be in the “OFF”, (open circuit
condition) when there is no magnetic field present. They only turn “ON”, (closed circuit condition) when
subjected to a magnetic field of sufficient strength and polarity.
Hall Effect Magnetic Sensor
The output voltage, called the Hall voltage, (VH) of the basic Hall Element is directly proportional to the
strength of the magnetic field passing through the semiconductor material (output ∝ H). This output voltage
can be quite small, only a few microvolts even when subjected to strong magnetic fields so most
commercially available Hall effect devices are manufactured with built-in DC amplifiers, logic switching
Sensor Technology
Sweta Barnwal Page 14
circuits and voltage regulators to improve the sensors sensitivity, hysteresis and output voltage. This also
allows the Hall effect sensor to operate over a wider range of power supplies and magnetic field conditions.
The Hall Effect Sensor
𝑽𝑯 = 𝑹𝑯(
𝑰
𝒕
× 𝑩)
Hall Effect Sensors are available with either linear or digital outputs. The output signal for linear (analogue)
sensors is taken directly from the output of the operational amplifier with the output voltage being directly
proportional to the magnetic field passing through the Hall sensor. This output Hall voltage is given as:
Linear or analogue sensors give a continuous voltage output that increases with a strong magnetic field and
decreases with a weak magnetic field. In linear output Hall effect sensors, as the strength of the magnetic field
increases the output signal from the amplifier will also increase until it begins to saturate by the limits
imposed on it by the power supply. Any additional increase in the magnetic field will have no effect on the
output but drive it more into saturation.
Digital output sensors on the other hand have a Schmitt-trigger with built in hysteresis connected to the op-
amp. When the magnetic flux passing through the Hall sensor exceeds a pre-set value the output from the
device switches quickly between its “OFF” condition to an “ON” condition without any type of contact
bounce. This built-in hysteresis eliminates any oscillation of the output signal as the sensor moves in and out
of the magnetic field. Then digital output sensors have just two states, “ON” and “OFF”.
• Where:
• VH is the Hall Voltage in volts
• RH is the Hall Effect co-efficient
• I is the current flow through the sensor in
amps
• t is the thickness of the sensor in mm
• B is the Magnetic Flux density in Teslas
There are two basic types of digital Hall effect sensor, Bipolar and Unipolar. Bipolar sensors require a
positive magnetic field (south pole) to operate them and a negative field (north pole) to release them while
Sensor Technology
Sweta Barnwal Page 15
unipolar sensors require only a single magnetic south pole to both operate and release them as they move in
and out of the magnetic field.
Most Hall effect devices can not directly switch large electrical loads as their output drive capabilities are very
small around 10 to 20mA. For large current loads an open-collector (current sinking) NPN Transistor is added
to the output.
This transistor operates in its saturated region as a NPN sink switch which shorts the output terminal to
ground whenever the applied flux density is higher than that of the “ON” pre-set point.
The output switching transistor can be either an open emitter transistor, open collector transistor configuration
or both providing a push-pull output type configuration that can sink enough current to directly drive many
loads, including relays, motors, LEDs, and lamps.
Hall Effect Applications
Hall effect sensors are activated by a magnetic field and in many applications the device can be operated by a
single permanent magnet attached to a moving shaft or device. There are many different types of magnet
movements, such as “Head-on”, “Sideways”, “Push-pull” or “Push-push” etc sensing movements. Which
every type of configuration is used, to ensure maximum sensitivity the magnetic lines of flux must always be
perpendicular to the sensing area of the device and must be of the correct polarity.
Also to ensure linearity, high field strength magnets are required that produce a large change in field strength
for the required movement. There are several possible paths of motion for detecting a magnetic field, and
below are two of the more common sensing configurations using a single magnet: Head-on
Detection and Sideways Detection.
Head-on Detection
Head-on-detection Sideways-detection
As its name implies, “head-on detection” requires that the magnetic field is perpendicular to the hall effect
sensing device and that for detection, it approaches the sensor straight on towards the active face. A sort of
“head-on” approach.
This head-on approach generates an output signal, VH which in the linear devices represents the strength of
the magnetic field, the magnetic flux density, as a function of distance away from the hall effect sensor. The
nearer and therefore the stronger the magnetic field, the greater the output voltage and vice versa.
Sensor Technology
Sweta Barnwal Page 16
Linear devices can also differentiate between positive and negative magnetic fields. Non-linear devices can be
made to trigger the output “ON” at a pre-set air gap distance away from the magnet for indicating positional
detection.
Sideways Detection
The second sensing configuration is “sideways detection”. This requires moving the magnet across the face of
the Hall effect element in a sideways motion.
Sideways or slide-by detection is useful for detecting the presence of a magnetic field as it moves across the
face of the Hall element within a fixed air gap distance for example, counting rotational magnets or the speed
of rotation of motors.
Depending upon the position of the magnetic field as it passes by the zero field center line of the sensor, a
linear output voltage representing both a positive and a negative output can be produced. This allows for
directional movement detection which can be vertical as well as horizontal.
There are many different applications for Hall Effect Sensors especially as proximity sensors. They can be
used instead of optical and light sensors where the environmental conditions consist of water, vibration, dirt or
oil such as in automotive applications. Hall effect devices can also be used for current sensing.
We know from the previous tutorials that when a current passes through a conductor, a circular
electromagnetic field is produced around it. By placing the Hall sensor next to the conductor, electrical
currents from a few milliamps into thousands of amperes can be measured from the generated magnetic field
without the need of large or expensive transformers and coils.
As well as detecting the presence or absence of magnets and magnetic fields, Hall effect sensors can also be
used to detect ferromagnetic materials such as iron and steel by placing a small permanent “biasing” magnet
behind the active area of the device. The sensor now sits in a permanent and static magnetic field, and any
change or disturbance to this magnetic field by the introduction of a ferrous material will be detected with
sensitivities as low as mV/G possible.
There are many different ways to interface Hall effect sensors to electrical and electronic circuits depending
upon the type of device, whether digital or linear. One very simple and easy to construct example is using a
Light Emitting Diode as shown below.
PIEZOELECTRIC SENSOR
Piezoelectric sensor is used for the measurement of pressure, acceleration and dynamic-forces such as
oscillation, impact, or high-speed compression or tension. It contains piezoelectric ionic crystal materials such
as Quartz (Figure 2.4.10). On application of force or pressure these materials get stretched or compressed.
During this process, the charge over the material changes and redistributes. One face of the material becomes
positively charged and the other negatively charged. The net charge q on the surface is proportional to the
amount x by which the charges have been displaced. The displacement is proportion to force. Therefore, we
can write,
q = kx = SF
where k is constant and S is a constant termed the charge sensitivity.
Sensor Technology
Sweta Barnwal Page 17
TEMPERATURE SENSORS
Temperature conveys the state of a mechanical system in terms of expansion or contraction of solids, liquids
or gases, change in electrical resistance of conductors, semiconductors and thermoelectric emfs. Temperature
sensors such as bimetallic strips, thermocouples, thermistors are widely used in monitoring of manufacturing
processes such as casting, molding, metal cutting etc. The construction details and principle of working of
some of the temperature sensors are discussed in following sections.
Bimetallic strips
Bimetallic strips are used as thermal switch in controlling the temperature or heat in a manufacturing process
or system. It contains two different metal strips bonded together. The metals have different coefficients of
expansion. On heating the strips bend into curved strips with the metal with higher coefficient of expansion on
the outside of the curve. Figure 2.5.1 shows a typical arrangement of a bimetallic strip used with a setting-up
magnet. As the strips bend, the soft iron comes in closer proximity of the small magnet and further touches.
Then the electric circuit completes and generates an alarm. In this way bimetallic strips help to protect the
desired application from heating above the pre-set value of temperature.
Sensor Technology
Sweta Barnwal Page 18
Figure: Construction and working of Bi-metallic strip
Resistance temperature detectors (RTDs)
RTDs work on the principle that the electric resistance of a metal changes due to change in its temperature.
On heating up metals, their resistance increases and follows a linear relationship as shown in Figure 2.5.2. The
correlation is
Rt = R0 (1 + αT)
where Rt is the resistance at temperature T (⁰C) and R0 is the temperature at 0⁰C and α is the constant for the
metal termed as temperature coefficient of resistance. The sensor is usually made to have a resistance of 100
Ω at 0 °C.
Figure: Construction and working of RTDs
Figure: Behavior of RTD materials
Sensor Technology
Sweta Barnwal Page 19
Above figure shows the construction of a RTD. It has a resistor element connected to a Wheatstone bridge.
The element and the connection leads are insulated and protected by a sheath. A small amount of current is
continuously passing though the coil. As the temperature changes the resistance of the coil changes which is
detected at the Wheatstone bridge.
RTDs are used in the form of thin films, wire wound or coil. They are generally made of metals such as
platinum, nickel or nickel-copper alloys. Platinum wire held by a high-temperature glass adhesive in a
ceramic tube is used to measure the temperature in a metal furnace. Other applications are:
• Air conditioning and refrigeration servicing
• Food Processing
• Stoves and grills
• Textile production
• Plastics processing
• Petrochemical processing
• Micro electronics
• Air, gas and liquid temperature measurement in pipes and tanks
• Exhaust gas temperature measurement
LIGHT SENSORS
A light sensor is a device that is used to detect light. There are different types of light sensors such as
photocell/photoresistor and photo diodes being used in manufacturing and other industrial applications.
Photoresistor is also called as light dependent resistor (LDR). It has a resistor whose resistance decreases
with increasing incident light intensity. It is made of a high resistance semiconductor material, cadmium
sulfide (CdS). The resistance of a CdS photoresistor varies inversely to the amount of light incident upon it.
Photoresistor follows the principle of photoconductivity which results from the generation of mobile carriers
when photons are absorbed by the semiconductor material.
Below figure shows the construction of a photo resistor. The CdS resistor coil is mounted on a ceramic
substrate. This assembly is encapsulated by a resin material. The sensitive coil electrodes are connected to the
control system though lead wires. On incidence of high intensity light on the electrodes, the resistance of
resistor coil decreases which will be used further to generate the appropriate signal by the microprocessor via
lead wires.
Construction of a photo resistor
Sensor Technology
Sweta Barnwal Page 20
Photoresistors are used in science and in almost any branch of industry for control, safety, amusement, sound
reproduction, inspection and measurement.
Applications of photo resistor
• Computers, wireless phones, and televisions, use ambient light sensors to automatically control the
brightness of a screen
• Barcode scanners used in retailer locations work using light sensor technology
• In space and robotics: for controlled and guided motions of vehicles and robots. The light sensor enables a
robot to detect light. Robots can be programmed to have a specific reaction if a certain amount of light is
detected.
• Auto Flash for camera
• Industrial process control
Photo diodes
Photodiode is a solid-state device which converts incident light into an electric current. It is made of Silicon.
It consists of a shallow diffused p-n junction, normally a p-on-n configuration. When photons of energy
greater than 1.1eV (the bandgap of silicon) fall on the device, they are absorbed and electron-hole pairs are
created. The depth at which the photons are absorbed depends upon their energy. The lower the energy of the
photons, the deeper they are absorbed. Then the electron-hole pairs drift apart. When the minority carriers
reach the junction, they are swept across by the electric field and an electric current establishes.
Photodiodes are one of the types of photodetector, which convert light into either current or voltage. These are
regular semiconductor diodes except that they may be either exposed to detect vacuum UV or X-rays or
packaged with a opening or optical fiber connection to allow light to reach the sensitive part of the device.
Figure below shows the construction of Photo diode detector. It is constructed from single crystal silicon
wafers. It is a p-n junction device. The upper layer is p layer. It is very thin and formed by thermal diffusion
or ion implantation of doping material such as boron. Depletion region is narrow and is sandwiched between p
layer and bulk n type layer of silicon. Light irradiates at front surface, anode, while the back surface is
cathode. The incidence of light on anode generates a flow of electron across the p-n junction which is the
measure of light intensity.
Sensor Technology
Sweta Barnwal Page 21
Applications of photo diodes
Camera: Light Meters, Automatic Shutter Control, Auto-focus, Photographic Flash Control
Medical: CAT Scanners - X ray Detection, Pulse Oximeters, Blood Particle Analyzers
Industry
• Bar Code Scanners
• Light Pens
• Brightness Controls
• Encoders
• Position Sensors
• Surveying Instruments
• Copiers - Density of Toner
Safety Equipment
• Smoke Detectors
• Flame Monitors
• Security Inspection Equipment - Airport X ray
• Intruder Alert - Security System
Automotive
• Headlight Dimmer
• Twilight Detectors
• Climate Control - Sunlight Detector
Communications
• Fiber Optic Links
• Optical Communications
• Optical Remote Control
LIGHT
It is a very efficient form of energy for sensing a great variety of stimuli. Among many others, these include
distance, motion, temperature, and chemical composition. Light has an electromagnetic nature. It may be
considered a propagation of either quanta of energy or electromagnetic waves. Different portions of the wave-
frequency spectrum are given special names: ultraviolet (UV), visible, near-, mid-, and far infrared (IR),
microwaves, radio waves, and so forth. The name “light” was arbitrarily given to electromagnetic radiation
which occupies wavelengths from approximately 0.1 to 100 µm. Light below the shortest wavelength that we
can see (violet) is called ultraviolet, and higher than the longest that we can see (red) is called infrared. The
infrared range is arbitrarily subdivided into three regions: near-infrared (from about 0.9 to 1.5 mµ), mid-
infrared (1.5 to 4 µm), and far-infrared (4 to 100 µm). Different portions of the radiation spectrum are studied
by separate branches of physics. An entire electromagnetic spectrum is represented in Fig. 3.41. It spreads
from γ -rays (the shortest) to radio waves (the longest). In this section, we will briefly review those properties
Sensor Technology
Sweta Barnwal Page 22
of light which are mostly concerned with the visible and near-infrared portions of the electromagnetic
spectrum.
The velocity of light c0 in vacuum is independent of wavelengths and can be expressed as
µ0 = 4π × 10−7 henrys/m and ε0 = 8.854 × 10⁻¹² farads/m ,
Which are the magnetic and electric permittivity of free space:
c0 = (1/ √µ0ε0) = 299,792,458.7 ± 1.1 m /s .
HEAT TRANSFER
There are two fundamental properties of heat which should be well recognized: (1) The heat is totally not
specific; that is, once it is produced, it is impossible to say what origin it has. (2) The heat cannot be
contained, which means that it flows spontaneously from the warmer part to the cooler part of the system.
Thermal energy may be transferred from one object to another in three ways: conduction, convection, and
radiation. Naturally, one of the objects which gives or receives heat may be a thermal detector. Its purpose
would be to measure the amount of heat which represents some information about the object producing that
heat. Such information may be the temperature of an object, chemical reaction, location or movement of the
object, and so forth. Let us consider a sandwichlike multilayer entity, where each layer is made of a different
material. When heat moves through the layers, a temperature profile within each material depends on its
thickness and thermal conductivity. Figure 3.39 shows three laminated layers where the first layer is attached
to a heat source (a device having an “infinite” heat capacity and a high thermal conductivity). One of the best
solid materials to act as an infinite heat source is a thermostatically controlled bulk copper. The temperature
within the source is higher and constant, except of a very thin region near the laminated materials. Heat
propagates from one material to another by conduction. The temperature within each material drops with
different rates depending on the thermal properties of the material. The last layer loses heat to air through
natural convection and to the surrounding objects through infrared radiation. Thus, Fig. 3.39 illustrates all
three possible ways to transfer heat from one object to another.
Fig. 3.39. Temperature profile in laminated materials.
THERMAL CONDUCTION
Heat conduction requires a physical contact between two bodies. Thermally agitated particles in a warmer
body jiggle and transfer kinetic energy to a cooler body by agitating its particles. As a result, the warmer body
loses heat while the cooler body gains heat. Heat transfer by conduction is analogous to water flow or to
electric current.
Sensor Technology
Sweta Barnwal Page 23
THERMAL CONVECTION
Another way to transfer heat is convection. It requires an intermediate agent (fluid: gas or liquid) that takes
heat from a warmer body, carries it to a cooler body, releases heat, and then may or may not return back to a
warmer body to pick up another portion of heat. Heat transfer from a solid body to a moving agent or within
the moving agent is also called convection. Convection may be natural (gravitational) or forced (produced by
a mechanism). With the natural convection of air, buoyant forces produced by gravitation act upon air
molecules. Warmed-up air rises, carrying heat away from a warm surface. Cooler air descends toward the
warmer object. Forced convection of air is produced by a fan or blower. Forced convection is used in liquid
thermostats to maintain the temperature of a device at a predetermined level.
THERMAL RADIATION
It was mentioned earlier that in any object, every atom and every molecule vibrate. The average kinetic
energy of vibrating particles is represented by the absolute temperature. According to laws of
electrodynamics, a moving electric charge is associated with a variable electric field that produces an
alternating magnetic field. In turn, when the magnetic field changes, it results in a changing electric field
coupled with it and so on. Thus, a vibrating particle is a source of an electromagnetic field which propagates
outwardly with the speed of light and is governed by the laws of optics. Electromagnetic waves can be
reflected, filtered, focused, and so forth. Figure 3.41 shows the total electromagnetic radiation spectrum which
spreads from γ -rays to radio waves.
The wavelength directly relates to frequency, ν, by means of the speed of light c in a particular media:
λ = c/ ν.
DYNAMIC MODELS OF SENSOR ELEMENTS
To determine a sensor’s dynamic response, a variable stimulus should be applied to its input while observing
the output values. Generally, a test stimulus may have any shape or form, which should be selected depending
on a practical need. For instance, for determining a natural frequency of an accelerometer, sinusoidal
vibrations of different frequencies are the best. On the other hand, for a thermistor probe, a step function of
temperature would be preferable. In many other cases, a step or square-pulse input stimulus is often
employed. The reason for that is the theoretically infinite frequency spectrum of a step function; that is, the
sensor can be tested simultaneously at all frequencies. Mathematically, a sensor can be described by a
differential equation whose order depends on the sensor’s physical nature and design. There are three general
types of relationship between the input s and the output S: a zero-order, a first-order and a second-order
response.
• Mechanical Elements: Dynamic mechanical elements are made of masses, or inertias, which have
attached springs and dampers. Often the damping is viscous, and for the rectilinear motion, the
retaining force is proportional to velocity. Similarly, for the rotational motion, the retaining force is
proportional to angular velocity. Also, the force, or torque, exerted by a spring or shaft is usually
proportional to displacement
• Thermal Elements: Thermal elements include such things as heat sinks, heating elements, insulators,
heat reflectors, and absorbers. If heat is of concern, a sensor should be regarded as a component of a
larger device. In other words, heat conduction through the housing and the mounting elements, air
convection, and radiative heat exchange with other objects should not be discounted. Heat may be
transferred by three mechanisms: conduction, natural and forced convection, and thermal radiation.
Sensor Technology
Sweta Barnwal Page 24
• Electrical Elements: There are three basic electrical elements: the capacitor, the inductor, and the
resistor. Again, the governing equation describing the idealized elements are given in Table 3.4. For
the idealized elements, the equations describing the sensor’s behavior may be obtained from
Kirchhoff’s laws, which directly follow from the law of conservation of energy:
➢ Kirchhoff’s first law: The total current flowing toward a junction is equal to the total
current flowing from that junction (i.e., the algebraic sum of the currents flowing
toward a junction is zero).
➢ Kirchhoff’s second law: In a closed circuit, the algebraic sum of the voltages across
each part of the circuit is equal to the applied e.m.f.
TEMPERATURE & THERMAL PROPERTIES OF MATERIALS
By thermal properties of material, we mean those properties or characteristics of materials which are the
functions of temperature or heat. We are here concerned with the thermal behavior of solids i.e., the response
of solid material to thermal change, i.e., increase or decrease of heat or temperature.
Thermal properties of engineering materials comprise the following:
1. Specific heat.
2. Thermal conductivity.
3. Thermal expansion.
4. Melting point or heat resistance.
5. Thermal shock.
6. Thermal diffusivity.
7. Thermal effect.
These properties are important in applications like thermodynamics, heat transfer, and melting of metals.
1. Specific Heat (Heat Capacity):
The heat capacity of a material is defined as the amount of heat required to raise its temperature by 1°. The
heat capacity per unit mass, of material is defined as its specific heat. Heat capacity per mole is defined as its
molar heat capacity.
Mathematically, specific heat of a solid is defined as-
Where, m = Mass,
T = Temperature,
Q = Energy content, and
dQ = Energy (heat) added or subtracted to produce the temperature change dT.
For unit mass per degree change in temperature specific heat c = dQ, the quantity of heat that must be added
per unit mass of a solid to raise its temperature by one degree. The specific heat of material is sometimes
Sensor Technology
Sweta Barnwal Page 25
defined as the ratio of its heat capacity to that of water. Specific heat in this becomes the dimensionless unit
(as specific heat of water is unity in MKS units).
For gases there are two specific heats i.e., specific heat at constant volume cv and specific at constant pressure
cp . cp is always greater than cv since any substance expands on heating and extra heat is required to raise the
temperature by 1 degree in order to compensate for the energy required for expansion. For solids, difference
between cp and cv is negligible and only one specific heat is used (cp = cv = c). This is due to the fact that in
solids and liquids the expansion with heating is very small.
According to classical kinetic theory of heat, heat capacity of an atom in a solid (crystalline element) is
constant and is equal to 26 kJ/kg atoms (°C) at room temperature. This is to be divided by molecular weight in
order to get mass specific heat of a solid.
Specific heat increases slightly with increase in temperature and varies from metal to metal. An increase of 5
percent for every 100°C temperature rise can be used as a general approximation. The effect of raising
temperature of metals and alloys is to raise the amplitude of vibration of each atom and the heat energy so
absorbed is the specific heat.
2. Thermal Conductivity:
It is defined as the amount of heat conducted in a unit time through a unit area normal to the direction
of heat flow. Heat conduction through isotropic solids is expressed by Fourier’s law:
q = Rate of heat flow/unit area normal to the direction of flow,
T = Temperature,
x = Distance measured in the direction of flow, and
k = Thermal conductivity.
Heat flow through solids is due to elastic vibration of atoms or molecules or due to transfer of energy by the
free electrons. Metals have large supply of free electrons which account for their thermal conductivity. Both
Sensor Technology
Sweta Barnwal Page 26
types of conduction occurs in metals and semiconductors. Insulators have lower conductivities as they depend
entirely on the lattice vibration of atoms and molecules. This is a slower process than electronic conduction.
The theory of thermal conductivity through crystalline solids (metals) based on quantum (solid state) theory
can be explained by concept of phonons which represent the particles (gas) characteristics of a thermal wave.
It is a quantum of energy and vibration of a thermoelastic (acoustic) wave.
In dielectrics (thermal insulators) thermal conductivity is caused alone by the atomic or molecular vibration of
the lattice (lattice is a geometrical array of lines or points in which atoms are considered spheres) representing
a certain type of crystal (say metal) structure.
The progress of this elastic thermal wave (or phonons) through a crystal is akin to a gas molecule through a
gas. At a heated surface the motion is increased so that collision with other phonons occurs at an increased
rate and thus heat is transmitted to other parts of the phonon gas. Thermal conductivity in solids is given by a
formula similar to that derived from the kinetic theory of gases.
Where, k = Thermal conductivity,
c = Specific heat per unit volume,
ν = Average particles velocity or velocity of the lattice wave (the velocity of sound), and
λ = Mean free path of lattice wave (phonon) of a given frequency.
In an ideal crystal, the atomic or molecular waves of vibration are harmonic, hence, X is very large and it
should have infinite thermal conductivity. In actual crystals mutual scattering and lattice wave (phonons) may
occur, due to inharmonicity of the vibration and internal crystal imperfection. Phonons scattering and thus
thermal conductivity depends, on crystalline structure of metals and alloys.
A comparison of thermal and electrical conductivities is given below:
Some typical thermal conductivities are shown as follows:
Sensor Technology
Sweta Barnwal Page 27
The thermal conductivity of pure metals increases as temperature is lowered often to a considerable degree.
Copper has thermal conductivity about 35 times greater at – 269°C than at 20°C.
Alloys, however, do not show this pronounced increase of thermal conductivity at lower temperatures and
only small percentages of alloying are required to suppress this change in thermal characteristics.
At normal and elevated temperatures, pure metals and their alloys possess very low temperature co-efficient
of thermal conductivity and thus for all design purposes these effects of higher temperature on thermal
conductivity are usually ignored.
The thermal conductivity of amorphous solids such as glasses, and plastics increases with a rise in
temperature. They generally possess, low thermal conductivity at room temperature. This is due to the fact
that amorphous solids have excessive scattering of phonons by their disordered structure at lower
temperatures.
The thermal conductivity of refractories (more complex solids) depends on their chemical composition and
crystalline structures. This is due to the presence of impurities and comparatively smaller grain size and
porosity which result in lower values of thermal conductivity.
If structure is simple as in case of silicon carbide, thermal conductivity has higher value. Fire clay bricks and
fuel fused silica also show an increase in thermal conductivity with increasing temperature. On the other hand
Sensor Technology
Sweta Barnwal Page 28
in case of magnesite and alumina which are more crystalline in nature, the thermal conductivity decreases
with rising temperature.
3. Thermal Expansion:
Thermal expansion arises from the addition of heat energy in the atoms and their subsequent movement away
from their equilibrium positions as the temperature rises in solid. This expansion or contraction resulting from
increase or decrease in temperature is three dimensional but in practice linear thermal expansion is used for
simplicity instead of volume expansion.
The increase in length per unit length per degree rise in temperature is called coefficient of linear expansion.
Thermal expansion does not necessarily vary uniformly with temperature but it is sufficiently linear over
narrow ranges of temperature.
If the bonds between the atoms are strong and highly directional as in ionic and covalent solids, the thermal
expansion will be relatively small. If on the other hand the atoms are more loosely bound as in metals, a
greater degree of expansion is there. In molecular solid, where bonding least resists the movement of the
molecules, the thermal expansion will be the greatest.
The thermal expansion of solid is related to other thermal properties such as specific heat and melting point as
all these properties have their origin in lattice vibrations which increase with the temperature. The atoms or
molecules as earlier explained oscillate (vibrate) with a certain amplitude about their equilibrium positions.
The amplitude of this vibration increases as the temperature rises resulting in moving further away of atoms
and molecules from their equilibrium position causing an increase in volume (or linear expansion) of solid. In
this way magnitude of the coefficient of thermal expansion of solids will depend on their interatomic and
intermolecular forms and also on their structural arrangement.
It has been observed that between absolute zero temperature and the melting point, total volume range of
elements is approximately constant. This can be interpreted that materials with lower softening (melting)
points will have higher expansion coefficients. This also means that thermal expansion will approach zero at
the absolute zero temperature.
Organic polymers such as plastics and rubber have many times higher expansion coefficients than metals
because of their relatively lower softening point. This may be reduced by addition of filler materials (such as
glass fibre, asbestos, alumina etc.) possessing lower thermal expansion coefficients. Alloying of metals have a
minor effect on this property.
4. Melting Point:
Melting point or softening point is a significant temperature level as it represents transition point between
solid and liquid phases having different structural arrangement of the atoms within the material. As heat is
added to a solid, its thermal energy increases until the atoms or molecules on the surface begin to break away
from their equilibrium positions.
There is a link between interatomic spacing at which the bonding force is maximum and the amplitude of
thermal vibration at which this breaking away occurs as if the atoms can be separated at this point, no further
Sensor Technology
Sweta Barnwal Page 29
increase in force is needed to separate them further. After melting commences, any further heat is all used up
in activating more particles of solids which in turn collide with neighbouring particles transmitting their
energy to them.
The structure is therefore transformed from a solid having definite equilibrium positions to a liquid having
only short range order. During melting no further rise in temperature occurs and solid and liquid phases exist
at the same temperature. Melting temperature depends upon the amount of thermal energy required.
This in turn depends on the nature of interatomic and intermolecular bonds. Therefore higher melting point is
exhibited by those materials possessing stronger bonds. Covalent, ionic, metallic and molecular types of solids
have decreasing order of bonding strength and thus the melting points.
Crystalline solids have a sharp melting point at which there is sudden transformation from solids to liquid
states. Amorphous solids such as glasses, plastics and rubbers and also clays do not have definite melting
points but soften gradually over a certain temperature range.
Relation between Thermal Expansion and Melting Point:
Both depend upon the bonds between atoms (or molecules) of the solid and so are related. For each class of
materials
α Tm = constant
Where, α = Coefficient of thermal expansion, and
Tm = Melting temperature.
Therefore, any two materials of a given class possessing same coefficient of expansion will therefore have
approximately same melting point.
The value of this constant is as under:
There is an interesting conclusion that for a material to be coated to another material, coating will have to be
of different class than the base material if both must have same thermal expansion.
Heat Resistance:
Melting point determines the heat resistance of a material as any material for high temperature application
should have its melting point above the service temperature. Ceramic materials are known to have high
melting points and good chemical stability but they are difficult to fabricate and cannot take thermal or
mechanical shock.
Following is the list of some materials possessing resistance to high temperatures:
Sensor Technology
Sweta Barnwal Page 30
5. Thermal Shock:
Thermal shock is the effect of a sudden change of temperature on a material whereas thermal shock resistance
can be defined as the ability of material to withstand thermal stresses due to sudden and severe changes in the
temperature at the surface of a solid body.
If a solid structure is prevented so that it cannot expand or contract freely on heating or cooling, excessive
thermal stresses may result culminating in thermal shock and causing failure of the body. Thermal shock
resulting from cooling which results in tensile stresses at the surface is much more dangerous than that from
heating.
Thermal shock resistance of a solid is sometimes given by the equation:
Where, k = Thermal conductivity,
σt = Tensile strength,
E = Young’s modulus, and
α = Linear co-efficient of thermal expansion.
For maximum shock resistance:
(i) Thermal-conductivity should be high.
(ii) Thermal expansion should be low.
(iii) Material should have low elastic modulus and high tensile strength.
c. Brittle materials such as glass and ceramics are particularly prone to thermal shock because they readily
experience brittle failure instead of plastic yield.
6. Thermal Diffusivity:
Thermal diffusivity (h) is defined as:
cp ρ represent heat requirement per unit volume. A material having high heat requirement per unit volume
possesses a low thermal diffusivity because more heat must be added to or removed from the material for
affecting a temperature change. Thermal diffusivity is therefore associated with the diffusion of thermal
energy and may be taken to represent an energy flux arising from the motion of phonons through a relatively
Sensor Technology
Sweta Barnwal Page 31
stationary atomic array. As phonons are in the nature of waveform, the atoms vibrate in unison but are not
physically transported.
7. Thermal Stresses:
When expansion or contraction of a body due to temperature change is wholly or partially prevented, thermal
stress will be developed in body. Thermal stress may arise from external bodies connected to one under stress
as for example, welded structure, railway line shrink fit components. Or, it may be due to non-uniform
expansion of the body itself, for example bimetallic strips used in thermostatic controls. The value of thermal
stress, expansion or contraction can be calculated by applying simple stress calculation theory.
8. Thermo-Elastic Effect:
When a solid is subjected to a load, work is done on it and it changes in volume. If this work is done at
constant temperature, an adiabatic temperature rise (without transfer of heat to or from the surroundings)
occurs. This will appear in the form of rise of temperature of solid when it is in stretched condition. Similarly
when the solid is rapidly relaxed, -it will feel. cool. This warming or cooling phenomenon is called
thermoelastic effect.

More Related Content

What's hot

Basics of Sensors & Transducers
Basics of Sensors & TransducersBasics of Sensors & Transducers
Basics of Sensors & TransducersBurdwan University
 
Smart Sensors.pptx
Smart Sensors.pptxSmart Sensors.pptx
Smart Sensors.pptxDrHemaCR
 
Transfer function of Mechanical rotational system
Transfer function of Mechanical rotational system Transfer function of Mechanical rotational system
Transfer function of Mechanical rotational system KALPANA K
 
Schmitt trigger circuit
Schmitt trigger circuitSchmitt trigger circuit
Schmitt trigger circuittaranjeet10
 
Sensors and its classification 1
Sensors and its classification 1Sensors and its classification 1
Sensors and its classification 1Mani Vannan M
 
CHARACTERISTICS OF AN INSTRUMENT
CHARACTERISTICS OF AN INSTRUMENT CHARACTERISTICS OF AN INSTRUMENT
CHARACTERISTICS OF AN INSTRUMENT Kunj Thummar
 
1. elementary signals
1. elementary signals 1. elementary signals
1. elementary signals MdFazleRabbi18
 
Isolation amplifier
Isolation amplifierIsolation amplifier
Isolation amplifiervickeysv
 
Contact and Non Contact Sensors.pptx
Contact and Non Contact Sensors.pptxContact and Non Contact Sensors.pptx
Contact and Non Contact Sensors.pptxDrHemaCR
 
Classification of transducers
Classification of transducersClassification of transducers
Classification of transducersManash Deka
 
Signal & systems
Signal & systemsSignal & systems
Signal & systemsAJAL A J
 
Measurement and instrumentation
Measurement and instrumentationMeasurement and instrumentation
Measurement and instrumentationmpsrekha83
 
Signal conditioning unit
Signal conditioning unit Signal conditioning unit
Signal conditioning unit BharathasreejaG
 

What's hot (20)

Types of sensors
Types of sensorsTypes of sensors
Types of sensors
 
Basics of Sensors & Transducers
Basics of Sensors & TransducersBasics of Sensors & Transducers
Basics of Sensors & Transducers
 
Introduction to dsp
Introduction to dspIntroduction to dsp
Introduction to dsp
 
Smart Sensors.pptx
Smart Sensors.pptxSmart Sensors.pptx
Smart Sensors.pptx
 
Transfer function of Mechanical rotational system
Transfer function of Mechanical rotational system Transfer function of Mechanical rotational system
Transfer function of Mechanical rotational system
 
PN JUNCTION
PN JUNCTION PN JUNCTION
PN JUNCTION
 
Schmitt trigger circuit
Schmitt trigger circuitSchmitt trigger circuit
Schmitt trigger circuit
 
Sensors and its classification 1
Sensors and its classification 1Sensors and its classification 1
Sensors and its classification 1
 
CHARACTERISTICS OF AN INSTRUMENT
CHARACTERISTICS OF AN INSTRUMENT CHARACTERISTICS OF AN INSTRUMENT
CHARACTERISTICS OF AN INSTRUMENT
 
1. elementary signals
1. elementary signals 1. elementary signals
1. elementary signals
 
Isolation amplifier
Isolation amplifierIsolation amplifier
Isolation amplifier
 
Sampling Theorem
Sampling TheoremSampling Theorem
Sampling Theorem
 
Electronic Measurement and Instrumentation
Electronic Measurement and InstrumentationElectronic Measurement and Instrumentation
Electronic Measurement and Instrumentation
 
Contact and Non Contact Sensors.pptx
Contact and Non Contact Sensors.pptxContact and Non Contact Sensors.pptx
Contact and Non Contact Sensors.pptx
 
Classification of transducers
Classification of transducersClassification of transducers
Classification of transducers
 
Signal & systems
Signal & systemsSignal & systems
Signal & systems
 
Sensors
SensorsSensors
Sensors
 
Introduction to sensors
Introduction to sensorsIntroduction to sensors
Introduction to sensors
 
Measurement and instrumentation
Measurement and instrumentationMeasurement and instrumentation
Measurement and instrumentation
 
Signal conditioning unit
Signal conditioning unit Signal conditioning unit
Signal conditioning unit
 

Similar to Sensors fundamentals and characteristics, physical principle of sensing

Unit1 measurement and tech(1b)
Unit1 measurement and tech(1b)Unit1 measurement and tech(1b)
Unit1 measurement and tech(1b)Hira Rizvi
 
CHAPTER_ONE_INTRODUCTION_TO_INSTRUMENTAT.pdf
CHAPTER_ONE_INTRODUCTION_TO_INSTRUMENTAT.pdfCHAPTER_ONE_INTRODUCTION_TO_INSTRUMENTAT.pdf
CHAPTER_ONE_INTRODUCTION_TO_INSTRUMENTAT.pdfGautamTalukdar3
 
1. Classification and Characteristics of signals.ppt
1. Classification and Characteristics of signals.ppt1. Classification and Characteristics of signals.ppt
1. Classification and Characteristics of signals.pptDongVelez
 
Introduction to Sensor
Introduction to SensorIntroduction to Sensor
Introduction to Sensorutpal sarkar
 
Quarter 1 Lesson 1 - Physical Quantities and Measurements
Quarter 1 Lesson 1 - Physical Quantities and MeasurementsQuarter 1 Lesson 1 - Physical Quantities and Measurements
Quarter 1 Lesson 1 - Physical Quantities and MeasurementsMarkNicholzSimporios
 
Physical Quantities and Measurements
Physical Quantities and MeasurementsPhysical Quantities and Measurements
Physical Quantities and MeasurementsMarkNicholzSimporios
 
Mechanical measurements
Mechanical measurements  Mechanical measurements
Mechanical measurements Nandi Sudheer
 
L-1 Units and Measurements.pdf
L-1 Units and Measurements.pdfL-1 Units and Measurements.pdf
L-1 Units and Measurements.pdfAbadat Hossain
 
Diploma sem 2 applied science physics-unit 1-chap 1 measurements
Diploma sem 2 applied science physics-unit 1-chap 1 measurementsDiploma sem 2 applied science physics-unit 1-chap 1 measurements
Diploma sem 2 applied science physics-unit 1-chap 1 measurementsRai University
 
Instrument Calibration
Instrument Calibration Instrument Calibration
Instrument Calibration Ramesh Dham
 
Introduction to fundamentals of instrument & control
Introduction to fundamentals of instrument & controlIntroduction to fundamentals of instrument & control
Introduction to fundamentals of instrument & controlMahmoud Wanis
 
Rigol RF basics_knowledge_applications
Rigol RF basics_knowledge_applicationsRigol RF basics_knowledge_applications
Rigol RF basics_knowledge_applicationsNIHON DENKEI SINGAPORE
 
Units & measurements
Units &  measurementsUnits &  measurements
Units & measurementsAmol Kumbhar
 
Measurement & Instrumentation (BE)
Measurement & Instrumentation (BE)Measurement & Instrumentation (BE)
Measurement & Instrumentation (BE)PRABHAHARAN429
 
GROUP1_INSTRU-SENSORS-CALI_FEEDBACK.pptx
GROUP1_INSTRU-SENSORS-CALI_FEEDBACK.pptxGROUP1_INSTRU-SENSORS-CALI_FEEDBACK.pptx
GROUP1_INSTRU-SENSORS-CALI_FEEDBACK.pptxRyan Cortes
 

Similar to Sensors fundamentals and characteristics, physical principle of sensing (20)

Unit1 measurement and tech(1b)
Unit1 measurement and tech(1b)Unit1 measurement and tech(1b)
Unit1 measurement and tech(1b)
 
CHAPTER_ONE_INTRODUCTION_TO_INSTRUMENTAT.pdf
CHAPTER_ONE_INTRODUCTION_TO_INSTRUMENTAT.pdfCHAPTER_ONE_INTRODUCTION_TO_INSTRUMENTAT.pdf
CHAPTER_ONE_INTRODUCTION_TO_INSTRUMENTAT.pdf
 
Sensors
SensorsSensors
Sensors
 
1. Classification and Characteristics of signals.ppt
1. Classification and Characteristics of signals.ppt1. Classification and Characteristics of signals.ppt
1. Classification and Characteristics of signals.ppt
 
PHYSICS-FOR-ENGINEERS.pptx
PHYSICS-FOR-ENGINEERS.pptxPHYSICS-FOR-ENGINEERS.pptx
PHYSICS-FOR-ENGINEERS.pptx
 
Introduction to Sensor
Introduction to SensorIntroduction to Sensor
Introduction to Sensor
 
Ch1 Metrology.pptx
Ch1 Metrology.pptxCh1 Metrology.pptx
Ch1 Metrology.pptx
 
BI_unit1.pptx
BI_unit1.pptxBI_unit1.pptx
BI_unit1.pptx
 
section1.1.pdf
section1.1.pdfsection1.1.pdf
section1.1.pdf
 
Quarter 1 Lesson 1 - Physical Quantities and Measurements
Quarter 1 Lesson 1 - Physical Quantities and MeasurementsQuarter 1 Lesson 1 - Physical Quantities and Measurements
Quarter 1 Lesson 1 - Physical Quantities and Measurements
 
Physical Quantities and Measurements
Physical Quantities and MeasurementsPhysical Quantities and Measurements
Physical Quantities and Measurements
 
Mechanical measurements
Mechanical measurements  Mechanical measurements
Mechanical measurements
 
L-1 Units and Measurements.pdf
L-1 Units and Measurements.pdfL-1 Units and Measurements.pdf
L-1 Units and Measurements.pdf
 
Diploma sem 2 applied science physics-unit 1-chap 1 measurements
Diploma sem 2 applied science physics-unit 1-chap 1 measurementsDiploma sem 2 applied science physics-unit 1-chap 1 measurements
Diploma sem 2 applied science physics-unit 1-chap 1 measurements
 
Instrument Calibration
Instrument Calibration Instrument Calibration
Instrument Calibration
 
Introduction to fundamentals of instrument & control
Introduction to fundamentals of instrument & controlIntroduction to fundamentals of instrument & control
Introduction to fundamentals of instrument & control
 
Rigol RF basics_knowledge_applications
Rigol RF basics_knowledge_applicationsRigol RF basics_knowledge_applications
Rigol RF basics_knowledge_applications
 
Units & measurements
Units &  measurementsUnits &  measurements
Units & measurements
 
Measurement & Instrumentation (BE)
Measurement & Instrumentation (BE)Measurement & Instrumentation (BE)
Measurement & Instrumentation (BE)
 
GROUP1_INSTRU-SENSORS-CALI_FEEDBACK.pptx
GROUP1_INSTRU-SENSORS-CALI_FEEDBACK.pptxGROUP1_INSTRU-SENSORS-CALI_FEEDBACK.pptx
GROUP1_INSTRU-SENSORS-CALI_FEEDBACK.pptx
 

More from Sweta Kumari Barnwal

Computer Network-Data Link Layer-Module-2.pdf
Computer Network-Data Link Layer-Module-2.pdfComputer Network-Data Link Layer-Module-2.pdf
Computer Network-Data Link Layer-Module-2.pdfSweta Kumari Barnwal
 
Sensors in Different Applications Area.pdf
Sensors in Different Applications Area.pdfSensors in Different Applications Area.pdf
Sensors in Different Applications Area.pdfSweta Kumari Barnwal
 
Sensor technology module-3-interface electronic circuits
Sensor technology module-3-interface electronic circuitsSensor technology module-3-interface electronic circuits
Sensor technology module-3-interface electronic circuitsSweta Kumari Barnwal
 
Module 5-cloud computing-SECURITY IN THE CLOUD
Module 5-cloud computing-SECURITY IN THE CLOUDModule 5-cloud computing-SECURITY IN THE CLOUD
Module 5-cloud computing-SECURITY IN THE CLOUDSweta Kumari Barnwal
 
Process improvement & service oriented software engineering
Process improvement & service oriented software engineeringProcess improvement & service oriented software engineering
Process improvement & service oriented software engineeringSweta Kumari Barnwal
 

More from Sweta Kumari Barnwal (20)

UNIT-1 Start Learning R.pdf
UNIT-1 Start Learning R.pdfUNIT-1 Start Learning R.pdf
UNIT-1 Start Learning R.pdf
 
MODULE-2-Cloud Computing.docx.pdf
MODULE-2-Cloud Computing.docx.pdfMODULE-2-Cloud Computing.docx.pdf
MODULE-2-Cloud Computing.docx.pdf
 
Number System.pdf
Number System.pdfNumber System.pdf
Number System.pdf
 
Cloud Computing_Module-1.pdf
Cloud Computing_Module-1.pdfCloud Computing_Module-1.pdf
Cloud Computing_Module-1.pdf
 
Computer Network-Data Link Layer-Module-2.pdf
Computer Network-Data Link Layer-Module-2.pdfComputer Network-Data Link Layer-Module-2.pdf
Computer Network-Data Link Layer-Module-2.pdf
 
Sensors in Different Applications Area.pdf
Sensors in Different Applications Area.pdfSensors in Different Applications Area.pdf
Sensors in Different Applications Area.pdf
 
Sensor technology module-3-interface electronic circuits
Sensor technology module-3-interface electronic circuitsSensor technology module-3-interface electronic circuits
Sensor technology module-3-interface electronic circuits
 
Logic gates
Logic gatesLogic gates
Logic gates
 
Basic computer system
Basic computer systemBasic computer system
Basic computer system
 
Features of windows
Features of windowsFeatures of windows
Features of windows
 
Operating system and services
Operating system and servicesOperating system and services
Operating system and services
 
Introduction to computers
Introduction to computersIntroduction to computers
Introduction to computers
 
Application Layer
Application LayerApplication Layer
Application Layer
 
Network Layer & Transport Layer
Network Layer & Transport LayerNetwork Layer & Transport Layer
Network Layer & Transport Layer
 
Module 5-cloud computing-SECURITY IN THE CLOUD
Module 5-cloud computing-SECURITY IN THE CLOUDModule 5-cloud computing-SECURITY IN THE CLOUD
Module 5-cloud computing-SECURITY IN THE CLOUD
 
Module 3-cyber security
Module 3-cyber securityModule 3-cyber security
Module 3-cyber security
 
Unit ii-hackers and cyber crimes
Unit ii-hackers and cyber crimesUnit ii-hackers and cyber crimes
Unit ii-hackers and cyber crimes
 
Module 3-cloud computing
Module 3-cloud computingModule 3-cloud computing
Module 3-cloud computing
 
Virtualization - cloud computing
Virtualization - cloud computingVirtualization - cloud computing
Virtualization - cloud computing
 
Process improvement & service oriented software engineering
Process improvement & service oriented software engineeringProcess improvement & service oriented software engineering
Process improvement & service oriented software engineering
 

Recently uploaded

Call Girls in Dwarka Mor Delhi Contact Us 9654467111
Call Girls in Dwarka Mor Delhi Contact Us 9654467111Call Girls in Dwarka Mor Delhi Contact Us 9654467111
Call Girls in Dwarka Mor Delhi Contact Us 9654467111Sapana Sha
 
The Most Excellent Way | 1 Corinthians 13
The Most Excellent Way | 1 Corinthians 13The Most Excellent Way | 1 Corinthians 13
The Most Excellent Way | 1 Corinthians 13Steve Thomason
 
Sanyam Choudhary Chemistry practical.pdf
Sanyam Choudhary Chemistry practical.pdfSanyam Choudhary Chemistry practical.pdf
Sanyam Choudhary Chemistry practical.pdfsanyamsingh5019
 
“Oh GOSH! Reflecting on Hackteria's Collaborative Practices in a Global Do-It...
“Oh GOSH! Reflecting on Hackteria's Collaborative Practices in a Global Do-It...“Oh GOSH! Reflecting on Hackteria's Collaborative Practices in a Global Do-It...
“Oh GOSH! Reflecting on Hackteria's Collaborative Practices in a Global Do-It...Marc Dusseiller Dusjagr
 
APM Welcome, APM North West Network Conference, Synergies Across Sectors
APM Welcome, APM North West Network Conference, Synergies Across SectorsAPM Welcome, APM North West Network Conference, Synergies Across Sectors
APM Welcome, APM North West Network Conference, Synergies Across SectorsAssociation for Project Management
 
URLs and Routing in the Odoo 17 Website App
URLs and Routing in the Odoo 17 Website AppURLs and Routing in the Odoo 17 Website App
URLs and Routing in the Odoo 17 Website AppCeline George
 
SOCIAL AND HISTORICAL CONTEXT - LFTVD.pptx
SOCIAL AND HISTORICAL CONTEXT - LFTVD.pptxSOCIAL AND HISTORICAL CONTEXT - LFTVD.pptx
SOCIAL AND HISTORICAL CONTEXT - LFTVD.pptxiammrhaywood
 
BASLIQ CURRENT LOOKBOOK LOOKBOOK(1) (1).pdf
BASLIQ CURRENT LOOKBOOK  LOOKBOOK(1) (1).pdfBASLIQ CURRENT LOOKBOOK  LOOKBOOK(1) (1).pdf
BASLIQ CURRENT LOOKBOOK LOOKBOOK(1) (1).pdfSoniaTolstoy
 
Incoming and Outgoing Shipments in 1 STEP Using Odoo 17
Incoming and Outgoing Shipments in 1 STEP Using Odoo 17Incoming and Outgoing Shipments in 1 STEP Using Odoo 17
Incoming and Outgoing Shipments in 1 STEP Using Odoo 17Celine George
 
Paris 2024 Olympic Geographies - an activity
Paris 2024 Olympic Geographies - an activityParis 2024 Olympic Geographies - an activity
Paris 2024 Olympic Geographies - an activityGeoBlogs
 
POINT- BIOCHEMISTRY SEM 2 ENZYMES UNIT 5.pptx
POINT- BIOCHEMISTRY SEM 2 ENZYMES UNIT 5.pptxPOINT- BIOCHEMISTRY SEM 2 ENZYMES UNIT 5.pptx
POINT- BIOCHEMISTRY SEM 2 ENZYMES UNIT 5.pptxSayali Powar
 
Introduction to AI in Higher Education_draft.pptx
Introduction to AI in Higher Education_draft.pptxIntroduction to AI in Higher Education_draft.pptx
Introduction to AI in Higher Education_draft.pptxpboyjonauth
 
Employee wellbeing at the workplace.pptx
Employee wellbeing at the workplace.pptxEmployee wellbeing at the workplace.pptx
Employee wellbeing at the workplace.pptxNirmalaLoungPoorunde1
 
The basics of sentences session 2pptx copy.pptx
The basics of sentences session 2pptx copy.pptxThe basics of sentences session 2pptx copy.pptx
The basics of sentences session 2pptx copy.pptxheathfieldcps1
 
Industrial Policy - 1948, 1956, 1973, 1977, 1980, 1991
Industrial Policy - 1948, 1956, 1973, 1977, 1980, 1991Industrial Policy - 1948, 1956, 1973, 1977, 1980, 1991
Industrial Policy - 1948, 1956, 1973, 1977, 1980, 1991RKavithamani
 
Q4-W6-Restating Informational Text Grade 3
Q4-W6-Restating Informational Text Grade 3Q4-W6-Restating Informational Text Grade 3
Q4-W6-Restating Informational Text Grade 3JemimahLaneBuaron
 
Measures of Central Tendency: Mean, Median and Mode
Measures of Central Tendency: Mean, Median and ModeMeasures of Central Tendency: Mean, Median and Mode
Measures of Central Tendency: Mean, Median and ModeThiyagu K
 

Recently uploaded (20)

Call Girls in Dwarka Mor Delhi Contact Us 9654467111
Call Girls in Dwarka Mor Delhi Contact Us 9654467111Call Girls in Dwarka Mor Delhi Contact Us 9654467111
Call Girls in Dwarka Mor Delhi Contact Us 9654467111
 
Staff of Color (SOC) Retention Efforts DDSD
Staff of Color (SOC) Retention Efforts DDSDStaff of Color (SOC) Retention Efforts DDSD
Staff of Color (SOC) Retention Efforts DDSD
 
The Most Excellent Way | 1 Corinthians 13
The Most Excellent Way | 1 Corinthians 13The Most Excellent Way | 1 Corinthians 13
The Most Excellent Way | 1 Corinthians 13
 
Sanyam Choudhary Chemistry practical.pdf
Sanyam Choudhary Chemistry practical.pdfSanyam Choudhary Chemistry practical.pdf
Sanyam Choudhary Chemistry practical.pdf
 
“Oh GOSH! Reflecting on Hackteria's Collaborative Practices in a Global Do-It...
“Oh GOSH! Reflecting on Hackteria's Collaborative Practices in a Global Do-It...“Oh GOSH! Reflecting on Hackteria's Collaborative Practices in a Global Do-It...
“Oh GOSH! Reflecting on Hackteria's Collaborative Practices in a Global Do-It...
 
APM Welcome, APM North West Network Conference, Synergies Across Sectors
APM Welcome, APM North West Network Conference, Synergies Across SectorsAPM Welcome, APM North West Network Conference, Synergies Across Sectors
APM Welcome, APM North West Network Conference, Synergies Across Sectors
 
URLs and Routing in the Odoo 17 Website App
URLs and Routing in the Odoo 17 Website AppURLs and Routing in the Odoo 17 Website App
URLs and Routing in the Odoo 17 Website App
 
SOCIAL AND HISTORICAL CONTEXT - LFTVD.pptx
SOCIAL AND HISTORICAL CONTEXT - LFTVD.pptxSOCIAL AND HISTORICAL CONTEXT - LFTVD.pptx
SOCIAL AND HISTORICAL CONTEXT - LFTVD.pptx
 
BASLIQ CURRENT LOOKBOOK LOOKBOOK(1) (1).pdf
BASLIQ CURRENT LOOKBOOK  LOOKBOOK(1) (1).pdfBASLIQ CURRENT LOOKBOOK  LOOKBOOK(1) (1).pdf
BASLIQ CURRENT LOOKBOOK LOOKBOOK(1) (1).pdf
 
Incoming and Outgoing Shipments in 1 STEP Using Odoo 17
Incoming and Outgoing Shipments in 1 STEP Using Odoo 17Incoming and Outgoing Shipments in 1 STEP Using Odoo 17
Incoming and Outgoing Shipments in 1 STEP Using Odoo 17
 
Paris 2024 Olympic Geographies - an activity
Paris 2024 Olympic Geographies - an activityParis 2024 Olympic Geographies - an activity
Paris 2024 Olympic Geographies - an activity
 
TataKelola dan KamSiber Kecerdasan Buatan v022.pdf
TataKelola dan KamSiber Kecerdasan Buatan v022.pdfTataKelola dan KamSiber Kecerdasan Buatan v022.pdf
TataKelola dan KamSiber Kecerdasan Buatan v022.pdf
 
POINT- BIOCHEMISTRY SEM 2 ENZYMES UNIT 5.pptx
POINT- BIOCHEMISTRY SEM 2 ENZYMES UNIT 5.pptxPOINT- BIOCHEMISTRY SEM 2 ENZYMES UNIT 5.pptx
POINT- BIOCHEMISTRY SEM 2 ENZYMES UNIT 5.pptx
 
Introduction to AI in Higher Education_draft.pptx
Introduction to AI in Higher Education_draft.pptxIntroduction to AI in Higher Education_draft.pptx
Introduction to AI in Higher Education_draft.pptx
 
Employee wellbeing at the workplace.pptx
Employee wellbeing at the workplace.pptxEmployee wellbeing at the workplace.pptx
Employee wellbeing at the workplace.pptx
 
The basics of sentences session 2pptx copy.pptx
The basics of sentences session 2pptx copy.pptxThe basics of sentences session 2pptx copy.pptx
The basics of sentences session 2pptx copy.pptx
 
Industrial Policy - 1948, 1956, 1973, 1977, 1980, 1991
Industrial Policy - 1948, 1956, 1973, 1977, 1980, 1991Industrial Policy - 1948, 1956, 1973, 1977, 1980, 1991
Industrial Policy - 1948, 1956, 1973, 1977, 1980, 1991
 
Model Call Girl in Bikash Puri Delhi reach out to us at 🔝9953056974🔝
Model Call Girl in Bikash Puri  Delhi reach out to us at 🔝9953056974🔝Model Call Girl in Bikash Puri  Delhi reach out to us at 🔝9953056974🔝
Model Call Girl in Bikash Puri Delhi reach out to us at 🔝9953056974🔝
 
Q4-W6-Restating Informational Text Grade 3
Q4-W6-Restating Informational Text Grade 3Q4-W6-Restating Informational Text Grade 3
Q4-W6-Restating Informational Text Grade 3
 
Measures of Central Tendency: Mean, Median and Mode
Measures of Central Tendency: Mean, Median and ModeMeasures of Central Tendency: Mean, Median and Mode
Measures of Central Tendency: Mean, Median and Mode
 

Sensors fundamentals and characteristics, physical principle of sensing

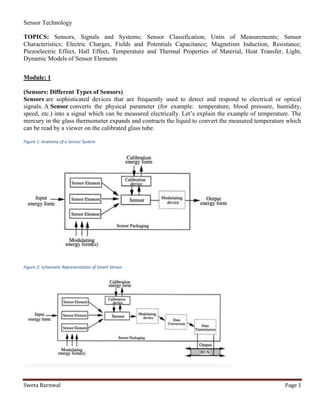
  • 1. Sensor Technology Sweta Barnwal Page 1 TOPICS: Sensors, Signals and Systems; Sensor Classification; Units of Measurements; Sensor Characteristics; Electric Charges, Fields and Potentials Capacitance; Magnetism Induction, Resistance; Piezoelectric Effect, Hall Effect, Temperature and Thermal Properties of Material, Heat Transfer, Light, Dynamic Models of Sensor Elements Module: 1 (Sensors: Different Types of Sensors) Sensors are sophisticated devices that are frequently used to detect and respond to electrical or optical signals. A Sensor converts the physical parameter (for example: temperature, blood pressure, humidity, speed, etc.) into a signal which can be measured electrically. Let’s explain the example of temperature. The mercury in the glass thermometer expands and contracts the liquid to convert the measured temperature which can be read by a viewer on the calibrated glass tube. Figure 1: Anatomy of a Sensor System Figure 2: Schematic Representation of Smart Sensor
  • 2. Sensor Technology Sweta Barnwal Page 2 Criteria to choose a Sensor There are certain features which have to be considered when we choose a sensor. They are as given below: 1. Accuracy 2. Environmental condition – usually has limits for temperature/ humidity 3. Range – Measurement limit of sensor 4. Calibration – Essential for most of the measuring devices as the readings changes with time 5. Resolution – Smallest increment detected by the sensor 6. Cost 7. Repeatability – The reading that varies is repeatedly measured under the same environment Classification based on property is as given below: · Temperature – Thermistors, thermocouples, RTD’s, IC and many more. · Pressure – Fibre optic, vacuum, elastic liquid-based manometers, LVDT, electronic. · Flow – Electromagnetic, differential pressure, positional displacement, thermal mass, etc. · Level Sensors – Differential pressure, ultrasonic radio frequency, radar, thermal displacement, etc. · Proximity and displacement – LVDT, photoelectric, capacitive, magnetic, ultrasonic. · Biosensors – Resonant mirror, electrochemical, surface Plasmon resonance, Light addressable potentio- metric. · Image – Charge coupled devices, CMOS · Gas and chemical – Semiconductor, Infrared, Conductance, Electrochemical. · Acceleration – Gyroscopes, Accelerometers. · Others – Moisture, humidity sensor, Speed sensor, mass, Tilt sensor, force, viscosity. Signal & System: Signal is an electric or electromagnetic current carrying data that can be transmitted or received. Mathematically represented as a function of an independent variable e.g. density, depth, etc. Therefore, a signal is a physical quantity that varies with time, space, or any other independent variable by which information can be conveyed. Here independent variable is time. Types of time signals: 1. Continuous time signals x(t)- defined at every point in time 2. Discrete time signals x[n] – defined only at a discrete set of values of time (integer). A System is any physical set of components or a function of several devices that takes a signal in input, and produces a signal as output. Calculating Energy and Power of signals: Energy– Square of amplitude/magnitude (if complex) over entire time domain. for a continuous time signal- for a discrete time signal- Power- It is known as rate of change of energy. Equation of Power for a continuous time signal, & for a discrete time signal-
  • 3. Sensor Technology Sweta Barnwal Page 3 Classes of signals on the basis of their power and energy: 1. Energy signal– generally converging signals, a periodic signal or signals that are bounded. 2. Power signal– generally periodic signals, as they encompass infinite area under their graph and extend from ( -∞ to +∞). 3. Neither energy nor power signal. Transformation of the independent variable: 1. Shifting- the signal can be delayed ( x(t-T) ) or advanced ( x(t+T) ) by incrementing or decrementing the independent variable (time here). The shape of the graph remains same only shifted on the time axis. 2. Scaling- the signal can be compressed ( x(at), a>1 ) or expanded ( x(t/a), a>1 or x(at), 1>a>0 ). Here the shape/behaviour of the graph of the signal changes as the fundamental time period changes. In compression the time period decreases and in expansion the time period increases. 3. Reversal- also called folding as the graph is folded about the Y-axis or T if given x(T-t). Properties of systems: 1. Periodicity- the signal’s behavior/graph repeats after every T. Therefore, here T is the fundamental period So we can say signal remains unchanged when shifted by multiples of T. 2. Even and Odd- an even signal is symmetric about the Y-axis. x(t)=x(-t) even x(t)=-x(-t) odd A signal can be broken into it’s even and odd parts to make certain conversions easy. 3. Linearity- constitutes of two properties- (i) Additivity/Superposition- if x1(t) -> y1(t) and x2(t) -> y2(t) (ii) Property of scaling- if x1(t) -> y1(t) then
  • 4. Sensor Technology Sweta Barnwal Page 4 If both are satisfied, the system is linear. 4. Time invariant- Any delay provided in the input must be reflected in the output for a time invariant system. here x2(t) is a delayed input. We check if putting a delayed input through the system is the same as a delay in the output signal. 5. LTI systems- A linear time invariant system. A system that is linear and time-invariant. 6. BIBO stability- The bounded input bounded output stability. We say a system is BIBO stable if- 7. Causality- Causal signals are signals that are zero for all negative time. If any value of the output signal depends on a future value of the input signal then the signal is non- causal. UNIT OF MEASUREMENTS As civilization developed, a wide variety of measuring scales came into existence, many for the same quantity (such as length), but adapted to particular activities or trades. Eventually, it became apparent that in order for trade and commerce to be possible, these scales had to be defined in terms of standards that would allow measures to be verified, and, when expressed in different units (bushels and pecks, for example), to be correlated or converted. HISTORY OF UNITS Over the centuries, hundreds of measurement units and scales have developed in the many civilizations that achieved some literate means of recording them. Some, such as those used by the Aztecs, fell out of use and were largely forgotten as these civilizations died out. Other units, such as the various systems of measurement that developed in England, achieved prominence through extension of the Empire and widespread trade; many of these were confined to specific trades or industries. The examples shown here are only some of those that have been used to measure length or distance. The history of measuring units provides a fascinating reflection on the history of industrial development. The most influential event in the history of measurement was undoubtedly the French Revolution and the Age of Rationality that followed. This led directly to the metric system that attempted to do away with the confusing multiplicity of measurement scales by reducing them to a few fundamental ones that could be combined in order to express any kind of quantity. The metric system spread rapidly over much of the world, and eventually even to England and the rest of the U.K. when that country established closer economic ties with Europe in the latter part of the 20th Century. The United States is presently the only major country in which “metrication” has made little progress within its own society, probably because of its relative geographical isolation and its vibrant internal economy. Science, being a truly international endeavor, adopted metric measurement very early on; engineering and related technologies have been slower to make this change, but are gradually doing so. Even the within the metric system, however, a variety of units were employed to measure the same fundamental quantity; for example, energy could be expressed within the metric system in units of ergs, electron-volts, joules, and two
  • 5. Sensor Technology Sweta Barnwal Page 5 kinds of calories. This led, in the mid-1960s, to the adoption of a more basic set of units, the System International (SI) units that are now recognized as the standard for science and, increasingly, for technology of all kinds. THE SEVEN SI BASE UNITS AND DECIMAL PREFIXES In principle, any physical quantity can be expressed in terms of only seven base units, with each base unit defined by a standard described below. A few special points about some of these units are worth noting: • The base unit of mass is unique in that a decimal prefix (Table 1.4.21.4.2) is built into it; i.e., the base SI unit is not the gram. • The base unit of time is the only one that is not metric. Numerous attempts to make it so have never garnered any success; we are still stuck with the 24:60:60 system that we inherited from ancient times. The ancient Egyptians of around 1500 BC invented the 12-hour day, and the 60:60 part is a remnant of the base-60 system that the Sumerians used for their astronomical calculations around 100 BC. • Of special interest to Chemistry is the mole, the base unit for expressing the quantity of matter. Although the number is not explicitly mentioned in the official definition, chemists define the mole as Avogadro’s number (approximately 6.02x10²³ ) of anything. The Seven Base Units Property Unit Symbol length meter m mass kilogram kg time second s temperature (absolute) kelvin K amount of substance mole mol electric current ampere A luminous intensity candela cd Owing to the wide range of values that quantities can have, it has long been the practice to employ prefixes such as milli and mega to indicate decimal fractions and multiples of metric units. As part of the SI standard, this system has been extended and formalized (Table 1.4.21.4.2). Prefixes used to scale up or down base units Prefix Abbreviation Multiplier Prefix Abbreviation Multiplier peta P 1018 deci s 10–1 tera T 1012 centi c 10–2 giga G 109 milli m 10–3 mega M 106 micro μ 10–6
  • 6. Sensor Technology Sweta Barnwal Page 6 Prefixes used to scale up or down base units Prefix Abbreviation Multiplier Prefix Abbreviation Multiplier kilo k 103 nano n 10–9 hecto h 102 pico p 10–12 deca da 10 femto f 10–15 PSEUDO SI UNITS There is a category of units that are “honorary” members of the SI in the sense that it is acceptable to use them along with the base units defined above. These include such mundane units as the hour, minute, and degree (of angle), etc., but the three shown here are of particular interest to chemistry, and you will need to know them. liter (litre) L 1 L = 1 dm3 = 10–3 m3 metric ton t 1 t = 103 kg united atomic mass unit (amu) u 1 u = 1.66054×10⁻²⁷ kg DERIVED UNITS AND DIMENSIONS Most of the physical quantities we actually deal with in science and also in our daily lives, have units of their own: volume, pressure, energy and electrical resistance are only a few of hundreds of possible examples. It is important to understand, however, that all of these can be expressed in terms of the SI base units; they are consequently known as derived units. In fact, most physical quantities can be expressed in terms of one or more of the following five fundamental units: • mass (M) • length (L) • time (T) • electric charge (Q) • temperature (Θ theta) Consider, for example, the unit of volume, which we denote as V. To measure the volume of a rectangular box, we need to multiply the lengths as measured along the three coordinates: V=x⋅y⋅z(1.4.1)(1.4.1)V=x·y·z We say, therefore, that volume has the dimensions of length-cubed: dim{V}=L3(1.4.2)(1.4.2)dim{V}=L3 Thus the units of volume will be m3 (in the SI) or cm3 , ft3 (English), etc. Moreover, any formula that calculates a volume must contain within it the L3 dimension; thus the volume of a sphere is 4/3πr34/3πr3.
  • 7. Sensor Technology Sweta Barnwal Page 7 The dimensions of a unit are the powers which M, L, t, Q and Q must be given in order to express the unit. Thus, dim{V}=M0L3T0Q0Θ0(1.4.3)(1.4.3)dim{V}=M0L3T0Q0Θ0 as given above. There are several reasons why it is worthwhile to consider the dimensions of a unit. 1. Perhaps the most important use of dimensions is to help us understand the relations between various units of measure and thereby get a better understanding of their physical meaning. For example, a look at the dimensions of the frequently confused electrical terms resistance and resistivity should enable you to explain, in plain words, the difference between them. 2. By the same token, the dimensions essentially tell you how to calculate any of these quantities, using whatever specific units you wish. (Note here the distinction between dimensions and units.) 3. Just as you cannot add apples to oranges, an expression such as a=b+cx2a=b+cx2 is meaningless unless the dimensions of each side are identical. (Of course, the two sides should work out to the same units as well.) 4. Many quantities must be dimensionless— for example, the variable x in expressions such as logxlog⁡x, exex, and sinxsin⁡x. Checking through the dimensions of such a quantity can help avoid errors. The formal, detailed study of dimensions is known as dimensional analysis and is a topic in any basic physics course.
  • 8. Sensor Technology Sweta Barnwal Page 8 Module: 2 ELECTRIC CHARGE It is that physical property of matter due to which the other matter experiences a force when matters are placed in electromagnetic field. Electric charge is also known as Charge, Electrical Charge and Electrostatic Charge. It is denoted by symbol ‘q’. It is a scalar quantity as charge has only magnitude and no direction. The two types of charges exist in nature: Positive and Negative Charge. Same charge repels each other and opposite charge attract each other. In the figure given below, we can see that like charge are repelling each other, while opposites are attracting each other. Example of Electric Charge We know that in a nucleus proton and neutron exists while electron revolve around the nucleus. Proton (p+) have positive charge and electron (e-) have negative charge. As symbol of proton is (p+) so proton carrying positive charge and symbol of electron is (e-) so electron carrying negative charge. As number of proton and electron in a nucleus are equal so net charge on nucleus is zero. For existing the net charge on a body the sum of positive and negative charge should be equal to zero. Properties of Electric Charge • Charge is measured in terms of Coulombs (C) • Charge is a scalar quantity • Charge can be positive or negative • Charge of proton and electron have same in magnitude but opposite in sign. Proton have charge 1.6 * 10-19 C while electron have -1.6 * 10-19 C • Charge is conserved while transferring. • Charge is quantized in nature. Example: Q = n e where e, is the electric unit of charge and its value is 1.6 * 10-19. C and n is a integer it may be positive or negative. ELECTRIC FIELD It is the region around a charge particle or object due to which another charge particle or object experience force. Electric Field is a vector quantity so we must consider the sign in numerical. Formula of Electric Field; Unit of electric field: E = N/C As, unit of force is Newton (N) and charge is Coulomb ( C), So unit of electric field is N/C. Note: While writing the unit 1st letter should be capital. In the above formula F is the force and q is the charge. F is calculated in terms of coulombs law.
  • 9. Sensor Technology Sweta Barnwal Page 9 Coulombs law is stated as force acting on a charge particle due to another charge particle is directly proportional to product of their charges and inversely proportional to square of distance between the charges. From the above definition, of coulomb’s force; Where, k is the proportionality constant and its value is 9 * 109 Nm2/C2. It is different for different medium. SI unit of F is = N m2 C2/C2 m2 So, on solving above equation we get F = Newton (N) How to calculate the Direction of E? Direction of Electric Field is always from positive charge to negative charge. In terms of single positive charge Electric field move away from the positive charge as shown in the first part of the diagram and in terms of negative charge Electric field move towards the negative charge as shown in the second part of the diagram. In third diagram, all the three directions are used. Firstly, Electric field goes from Positive charge to negative charge. Secondly, In terms of positive charge field lines are moving away from positive charge and in terms of negative charge field lines are coming towards the charge.
  • 10. Sensor Technology Sweta Barnwal Page 10 Detection of electric field When a detection electrode is brought close to an electrified body, an electric charge that is proportional to the intensity of the electric field is induced in the detection electrode due to "electrostatic induction". The electrostatic sensor opens and closes a tuning-fork vibrating plate called a chopper in front of the detection electrode in order to cancel out DC noise and perform higher precision measurement. The sensor detects the intensity of the electric field by receiving the induced electric charge as a communication signal. Conversion to electric potential Electric potential is proportional to the intensity of the electric field, but the intensity of the electric field gets smaller as it gets further away from an electrified object. Therefore, the electrostatic sensor sets a distance between the electrified object and the sensor using a controller and a corrected calculation of the electric potential is performed. Characteristics based on the principle of electrostatic sensor detection Since an electric field relies on the measurement distance, you need to fix the sensor at a set distance in order to perform a high precision measurement. The electric field that is produced by an electrified object spreads concentrically out from the electrified object. Therefore, the electrostatic sensor that detects the electric field measures a wider range as the measurement distance increases. Moreover, the existing electrostatic sensors and electrometers have the same range characteristics since they all detect the electric field. CAPACITANCE & MAGNETISM Capacitive proximity sensors are non-contact devices that can detect the presence or absence of virtually any object regardless of material. They utilize the electrical property of capacitance and the change of capacitance based on a change in the electrical field around the active face of the sensor. Capacitive sensing technology is often used in other sensing technologies such as: • flow
  • 11. Sensor Technology Sweta Barnwal Page 11 • pressure • liquid level • spacing • thickness • ice detection • shaft angle or linear position • dimmer switches • key switches • x-y tablet • accelerometers Principle of operation A capacitive sensor acts like a simple capacitor. A metal plate in the sensing face of the sensor is electrically connected to an internal oscillator circuit and the target to be sensed acts as the second plate of the capacitor. Unlike an inductive sensor that produces an electromagnetic field a capacitive sensor produces an electrostatic field. The external capacitance between the target and the internal sensor plate forms a part of the feedback capacitance in the oscillator circuit. As the target approaches the sensors face the oscillations increase until they reach a threshold level and activate the output. Capacitive sensors have the ability to adjust the sensitivity or the threshold level of the oscillator. The sensitivity adjustment can be made by adjusting a potentiometer, using an integral teach pushbutton or remotely by using a teach wire. If the sensor does not have an adjustment method then the sensor must physically be moved for sensing the target correctly. Increasing the sensitivity causes a greater operating distance to the target. Large increases in sensitivity can cause the sensor to be influenced by temperature, humidity, and dirt. There are two categories of targets that capacitive sensors can detect the first being conductive and the second is non-conductive. Conductive targets include metal, water, blood, acids, bases, and salt water. These targets have a greater capacitance and a targets dielectric strength is immaterial. The non-conductive target category acts like an insulator to the sensor’s electrode. Magnetic sensors are solid state devices that are becoming more and more popular because they can be used in many different types of application such as sensing position, velocity or directional movement. They are also a popular choice of sensor for the electronics designer due to their non-contact wear free operation, their low maintenance, robust design and as sealed hall effect devices are immune to vibration, dust and water. One of the main uses of magnetic sensors is in automotive systems for the sensing of position, distance and speed. For example, the angular position of the crank shaft for the firing angle of the spark plugs, the position of the car seats and seat belts for air-bag control or wheel speed detection for the anti-lock braking system, (ABS).
  • 12. Sensor Technology Sweta Barnwal Page 12 Magnetic sensors are designed to respond to a wide range of positive and negative magnetic fields in a variety of different applications and one type of magnet sensor whose output signal is a function of magnetic field density around it is called the Hall Effect Sensor. Inductive sensors use currents induced by magnetic fields to detect nearby metal objects. The inductive sensor uses a coil (an inductor) to generate a high frequency magnetic field as shown in Figure 1 below. If there is a metal object near the changing magnetic field, current will flow in the object. This resulting current flow sets up a new magnetic field that opposes the original magnetic field. The net effect is that it changes the inductance of the coil in the inductive sensor. These sensors will detect any metals, when detecting multiple types of metal multiple sensors are often used. Note: these work by setting up a high frequency field. If a target nears the field will induce eddy currents. These currents consume power because of resistance, so energy is in the field is lost, and the signal amplitude decreases. The detector examines filed magnitude to determine when it has decreased enough to switch. The sensors can detect objects a few centimeters away from the end. But, the direction to the object can be arbitrary as shown in Figure 2 below. The magnetic field of the unshielded sensor covers a larger volume around the head of the coil. By adding a shield (a metal jacket around the sides of the coil) the magnetic field becomes smaller, but also more directed. Shields will often be available for inductive sensors to improve their directionality and accuracy. HALL EFFECT SENSORS These devices which are activated by an external magnetic field. We know that a magnetic field has two important characteristics flux density, (B) and polarity (North and South Poles). The output signal from a Hall effect sensor is the function of magnetic field density around the device. When the magnetic flux density around the sensor exceeds a certain pre-set threshold, the sensor detects it and generates an output voltage called the Hall Voltage, VH. Consider the diagram below.
  • 13. Sensor Technology Sweta Barnwal Page 13 Hall Effect Sensor Principles Hall Effect Sensors consist basically of a thin piece of rectangular p-type semiconductor material such as gallium arsenide (GaAs), indium antimonide (InSb) or indium arsenide (InAs) passing a continuous current through itself. When the device is placed within a magnetic field, the magnetic flux lines exert a force on the semiconductor material which deflects the charge carriers, electrons and holes, to either side of the semiconductor slab. This movement of charge carriers is a result of the magnetic force they experience passing through the semiconductor material. As these electrons and holes move side wards a potential difference is produced between the two sides of the semiconductor material by the build-up of these charge carriers. Then the movement of electrons through the semiconductor material is affected by the presence of an external magnetic field which is at right angles to it and this effect is greater in a flat rectangular shaped material. The effect of generating a measurable voltage by using a magnetic field is called the Hall Effect after Edwin Hall who discovered it back in the 1870’s with the basic physical principle underlying the Hall effect being Lorentz force. To generate a potential difference across the device the magnetic flux lines must be perpendicular, (90o ) to the flow of current and be of the correct polarity, generally a south pole. The Hall effect provides information regarding the type of magnetic pole and magnitude of the magnetic field. For example, a south pole would cause the device to produce a voltage output while a north pole would have no effect. Generally, Hall Effect sensors and switches are designed to be in the “OFF”, (open circuit condition) when there is no magnetic field present. They only turn “ON”, (closed circuit condition) when subjected to a magnetic field of sufficient strength and polarity. Hall Effect Magnetic Sensor The output voltage, called the Hall voltage, (VH) of the basic Hall Element is directly proportional to the strength of the magnetic field passing through the semiconductor material (output ∝ H). This output voltage can be quite small, only a few microvolts even when subjected to strong magnetic fields so most commercially available Hall effect devices are manufactured with built-in DC amplifiers, logic switching
  • 14. Sensor Technology Sweta Barnwal Page 14 circuits and voltage regulators to improve the sensors sensitivity, hysteresis and output voltage. This also allows the Hall effect sensor to operate over a wider range of power supplies and magnetic field conditions. The Hall Effect Sensor 𝑽𝑯 = 𝑹𝑯( 𝑰 𝒕 × 𝑩) Hall Effect Sensors are available with either linear or digital outputs. The output signal for linear (analogue) sensors is taken directly from the output of the operational amplifier with the output voltage being directly proportional to the magnetic field passing through the Hall sensor. This output Hall voltage is given as: Linear or analogue sensors give a continuous voltage output that increases with a strong magnetic field and decreases with a weak magnetic field. In linear output Hall effect sensors, as the strength of the magnetic field increases the output signal from the amplifier will also increase until it begins to saturate by the limits imposed on it by the power supply. Any additional increase in the magnetic field will have no effect on the output but drive it more into saturation. Digital output sensors on the other hand have a Schmitt-trigger with built in hysteresis connected to the op- amp. When the magnetic flux passing through the Hall sensor exceeds a pre-set value the output from the device switches quickly between its “OFF” condition to an “ON” condition without any type of contact bounce. This built-in hysteresis eliminates any oscillation of the output signal as the sensor moves in and out of the magnetic field. Then digital output sensors have just two states, “ON” and “OFF”. • Where: • VH is the Hall Voltage in volts • RH is the Hall Effect co-efficient • I is the current flow through the sensor in amps • t is the thickness of the sensor in mm • B is the Magnetic Flux density in Teslas There are two basic types of digital Hall effect sensor, Bipolar and Unipolar. Bipolar sensors require a positive magnetic field (south pole) to operate them and a negative field (north pole) to release them while
  • 15. Sensor Technology Sweta Barnwal Page 15 unipolar sensors require only a single magnetic south pole to both operate and release them as they move in and out of the magnetic field. Most Hall effect devices can not directly switch large electrical loads as their output drive capabilities are very small around 10 to 20mA. For large current loads an open-collector (current sinking) NPN Transistor is added to the output. This transistor operates in its saturated region as a NPN sink switch which shorts the output terminal to ground whenever the applied flux density is higher than that of the “ON” pre-set point. The output switching transistor can be either an open emitter transistor, open collector transistor configuration or both providing a push-pull output type configuration that can sink enough current to directly drive many loads, including relays, motors, LEDs, and lamps. Hall Effect Applications Hall effect sensors are activated by a magnetic field and in many applications the device can be operated by a single permanent magnet attached to a moving shaft or device. There are many different types of magnet movements, such as “Head-on”, “Sideways”, “Push-pull” or “Push-push” etc sensing movements. Which every type of configuration is used, to ensure maximum sensitivity the magnetic lines of flux must always be perpendicular to the sensing area of the device and must be of the correct polarity. Also to ensure linearity, high field strength magnets are required that produce a large change in field strength for the required movement. There are several possible paths of motion for detecting a magnetic field, and below are two of the more common sensing configurations using a single magnet: Head-on Detection and Sideways Detection. Head-on Detection Head-on-detection Sideways-detection As its name implies, “head-on detection” requires that the magnetic field is perpendicular to the hall effect sensing device and that for detection, it approaches the sensor straight on towards the active face. A sort of “head-on” approach. This head-on approach generates an output signal, VH which in the linear devices represents the strength of the magnetic field, the magnetic flux density, as a function of distance away from the hall effect sensor. The nearer and therefore the stronger the magnetic field, the greater the output voltage and vice versa.
  • 16. Sensor Technology Sweta Barnwal Page 16 Linear devices can also differentiate between positive and negative magnetic fields. Non-linear devices can be made to trigger the output “ON” at a pre-set air gap distance away from the magnet for indicating positional detection. Sideways Detection The second sensing configuration is “sideways detection”. This requires moving the magnet across the face of the Hall effect element in a sideways motion. Sideways or slide-by detection is useful for detecting the presence of a magnetic field as it moves across the face of the Hall element within a fixed air gap distance for example, counting rotational magnets or the speed of rotation of motors. Depending upon the position of the magnetic field as it passes by the zero field center line of the sensor, a linear output voltage representing both a positive and a negative output can be produced. This allows for directional movement detection which can be vertical as well as horizontal. There are many different applications for Hall Effect Sensors especially as proximity sensors. They can be used instead of optical and light sensors where the environmental conditions consist of water, vibration, dirt or oil such as in automotive applications. Hall effect devices can also be used for current sensing. We know from the previous tutorials that when a current passes through a conductor, a circular electromagnetic field is produced around it. By placing the Hall sensor next to the conductor, electrical currents from a few milliamps into thousands of amperes can be measured from the generated magnetic field without the need of large or expensive transformers and coils. As well as detecting the presence or absence of magnets and magnetic fields, Hall effect sensors can also be used to detect ferromagnetic materials such as iron and steel by placing a small permanent “biasing” magnet behind the active area of the device. The sensor now sits in a permanent and static magnetic field, and any change or disturbance to this magnetic field by the introduction of a ferrous material will be detected with sensitivities as low as mV/G possible. There are many different ways to interface Hall effect sensors to electrical and electronic circuits depending upon the type of device, whether digital or linear. One very simple and easy to construct example is using a Light Emitting Diode as shown below. PIEZOELECTRIC SENSOR Piezoelectric sensor is used for the measurement of pressure, acceleration and dynamic-forces such as oscillation, impact, or high-speed compression or tension. It contains piezoelectric ionic crystal materials such as Quartz (Figure 2.4.10). On application of force or pressure these materials get stretched or compressed. During this process, the charge over the material changes and redistributes. One face of the material becomes positively charged and the other negatively charged. The net charge q on the surface is proportional to the amount x by which the charges have been displaced. The displacement is proportion to force. Therefore, we can write, q = kx = SF where k is constant and S is a constant termed the charge sensitivity.
  • 17. Sensor Technology Sweta Barnwal Page 17 TEMPERATURE SENSORS Temperature conveys the state of a mechanical system in terms of expansion or contraction of solids, liquids or gases, change in electrical resistance of conductors, semiconductors and thermoelectric emfs. Temperature sensors such as bimetallic strips, thermocouples, thermistors are widely used in monitoring of manufacturing processes such as casting, molding, metal cutting etc. The construction details and principle of working of some of the temperature sensors are discussed in following sections. Bimetallic strips Bimetallic strips are used as thermal switch in controlling the temperature or heat in a manufacturing process or system. It contains two different metal strips bonded together. The metals have different coefficients of expansion. On heating the strips bend into curved strips with the metal with higher coefficient of expansion on the outside of the curve. Figure 2.5.1 shows a typical arrangement of a bimetallic strip used with a setting-up magnet. As the strips bend, the soft iron comes in closer proximity of the small magnet and further touches. Then the electric circuit completes and generates an alarm. In this way bimetallic strips help to protect the desired application from heating above the pre-set value of temperature.
  • 18. Sensor Technology Sweta Barnwal Page 18 Figure: Construction and working of Bi-metallic strip Resistance temperature detectors (RTDs) RTDs work on the principle that the electric resistance of a metal changes due to change in its temperature. On heating up metals, their resistance increases and follows a linear relationship as shown in Figure 2.5.2. The correlation is Rt = R0 (1 + αT) where Rt is the resistance at temperature T (⁰C) and R0 is the temperature at 0⁰C and α is the constant for the metal termed as temperature coefficient of resistance. The sensor is usually made to have a resistance of 100 Ω at 0 °C. Figure: Construction and working of RTDs Figure: Behavior of RTD materials
  • 19. Sensor Technology Sweta Barnwal Page 19 Above figure shows the construction of a RTD. It has a resistor element connected to a Wheatstone bridge. The element and the connection leads are insulated and protected by a sheath. A small amount of current is continuously passing though the coil. As the temperature changes the resistance of the coil changes which is detected at the Wheatstone bridge. RTDs are used in the form of thin films, wire wound or coil. They are generally made of metals such as platinum, nickel or nickel-copper alloys. Platinum wire held by a high-temperature glass adhesive in a ceramic tube is used to measure the temperature in a metal furnace. Other applications are: • Air conditioning and refrigeration servicing • Food Processing • Stoves and grills • Textile production • Plastics processing • Petrochemical processing • Micro electronics • Air, gas and liquid temperature measurement in pipes and tanks • Exhaust gas temperature measurement LIGHT SENSORS A light sensor is a device that is used to detect light. There are different types of light sensors such as photocell/photoresistor and photo diodes being used in manufacturing and other industrial applications. Photoresistor is also called as light dependent resistor (LDR). It has a resistor whose resistance decreases with increasing incident light intensity. It is made of a high resistance semiconductor material, cadmium sulfide (CdS). The resistance of a CdS photoresistor varies inversely to the amount of light incident upon it. Photoresistor follows the principle of photoconductivity which results from the generation of mobile carriers when photons are absorbed by the semiconductor material. Below figure shows the construction of a photo resistor. The CdS resistor coil is mounted on a ceramic substrate. This assembly is encapsulated by a resin material. The sensitive coil electrodes are connected to the control system though lead wires. On incidence of high intensity light on the electrodes, the resistance of resistor coil decreases which will be used further to generate the appropriate signal by the microprocessor via lead wires. Construction of a photo resistor
  • 20. Sensor Technology Sweta Barnwal Page 20 Photoresistors are used in science and in almost any branch of industry for control, safety, amusement, sound reproduction, inspection and measurement. Applications of photo resistor • Computers, wireless phones, and televisions, use ambient light sensors to automatically control the brightness of a screen • Barcode scanners used in retailer locations work using light sensor technology • In space and robotics: for controlled and guided motions of vehicles and robots. The light sensor enables a robot to detect light. Robots can be programmed to have a specific reaction if a certain amount of light is detected. • Auto Flash for camera • Industrial process control Photo diodes Photodiode is a solid-state device which converts incident light into an electric current. It is made of Silicon. It consists of a shallow diffused p-n junction, normally a p-on-n configuration. When photons of energy greater than 1.1eV (the bandgap of silicon) fall on the device, they are absorbed and electron-hole pairs are created. The depth at which the photons are absorbed depends upon their energy. The lower the energy of the photons, the deeper they are absorbed. Then the electron-hole pairs drift apart. When the minority carriers reach the junction, they are swept across by the electric field and an electric current establishes. Photodiodes are one of the types of photodetector, which convert light into either current or voltage. These are regular semiconductor diodes except that they may be either exposed to detect vacuum UV or X-rays or packaged with a opening or optical fiber connection to allow light to reach the sensitive part of the device. Figure below shows the construction of Photo diode detector. It is constructed from single crystal silicon wafers. It is a p-n junction device. The upper layer is p layer. It is very thin and formed by thermal diffusion or ion implantation of doping material such as boron. Depletion region is narrow and is sandwiched between p layer and bulk n type layer of silicon. Light irradiates at front surface, anode, while the back surface is cathode. The incidence of light on anode generates a flow of electron across the p-n junction which is the measure of light intensity.
  • 21. Sensor Technology Sweta Barnwal Page 21 Applications of photo diodes Camera: Light Meters, Automatic Shutter Control, Auto-focus, Photographic Flash Control Medical: CAT Scanners - X ray Detection, Pulse Oximeters, Blood Particle Analyzers Industry • Bar Code Scanners • Light Pens • Brightness Controls • Encoders • Position Sensors • Surveying Instruments • Copiers - Density of Toner Safety Equipment • Smoke Detectors • Flame Monitors • Security Inspection Equipment - Airport X ray • Intruder Alert - Security System Automotive • Headlight Dimmer • Twilight Detectors • Climate Control - Sunlight Detector Communications • Fiber Optic Links • Optical Communications • Optical Remote Control LIGHT It is a very efficient form of energy for sensing a great variety of stimuli. Among many others, these include distance, motion, temperature, and chemical composition. Light has an electromagnetic nature. It may be considered a propagation of either quanta of energy or electromagnetic waves. Different portions of the wave- frequency spectrum are given special names: ultraviolet (UV), visible, near-, mid-, and far infrared (IR), microwaves, radio waves, and so forth. The name “light” was arbitrarily given to electromagnetic radiation which occupies wavelengths from approximately 0.1 to 100 µm. Light below the shortest wavelength that we can see (violet) is called ultraviolet, and higher than the longest that we can see (red) is called infrared. The infrared range is arbitrarily subdivided into three regions: near-infrared (from about 0.9 to 1.5 mµ), mid- infrared (1.5 to 4 µm), and far-infrared (4 to 100 µm). Different portions of the radiation spectrum are studied by separate branches of physics. An entire electromagnetic spectrum is represented in Fig. 3.41. It spreads from γ -rays (the shortest) to radio waves (the longest). In this section, we will briefly review those properties
  • 22. Sensor Technology Sweta Barnwal Page 22 of light which are mostly concerned with the visible and near-infrared portions of the electromagnetic spectrum. The velocity of light c0 in vacuum is independent of wavelengths and can be expressed as µ0 = 4π × 10−7 henrys/m and ε0 = 8.854 × 10⁻¹² farads/m , Which are the magnetic and electric permittivity of free space: c0 = (1/ √µ0ε0) = 299,792,458.7 ± 1.1 m /s . HEAT TRANSFER There are two fundamental properties of heat which should be well recognized: (1) The heat is totally not specific; that is, once it is produced, it is impossible to say what origin it has. (2) The heat cannot be contained, which means that it flows spontaneously from the warmer part to the cooler part of the system. Thermal energy may be transferred from one object to another in three ways: conduction, convection, and radiation. Naturally, one of the objects which gives or receives heat may be a thermal detector. Its purpose would be to measure the amount of heat which represents some information about the object producing that heat. Such information may be the temperature of an object, chemical reaction, location or movement of the object, and so forth. Let us consider a sandwichlike multilayer entity, where each layer is made of a different material. When heat moves through the layers, a temperature profile within each material depends on its thickness and thermal conductivity. Figure 3.39 shows three laminated layers where the first layer is attached to a heat source (a device having an “infinite” heat capacity and a high thermal conductivity). One of the best solid materials to act as an infinite heat source is a thermostatically controlled bulk copper. The temperature within the source is higher and constant, except of a very thin region near the laminated materials. Heat propagates from one material to another by conduction. The temperature within each material drops with different rates depending on the thermal properties of the material. The last layer loses heat to air through natural convection and to the surrounding objects through infrared radiation. Thus, Fig. 3.39 illustrates all three possible ways to transfer heat from one object to another. Fig. 3.39. Temperature profile in laminated materials. THERMAL CONDUCTION Heat conduction requires a physical contact between two bodies. Thermally agitated particles in a warmer body jiggle and transfer kinetic energy to a cooler body by agitating its particles. As a result, the warmer body loses heat while the cooler body gains heat. Heat transfer by conduction is analogous to water flow or to electric current.
  • 23. Sensor Technology Sweta Barnwal Page 23 THERMAL CONVECTION Another way to transfer heat is convection. It requires an intermediate agent (fluid: gas or liquid) that takes heat from a warmer body, carries it to a cooler body, releases heat, and then may or may not return back to a warmer body to pick up another portion of heat. Heat transfer from a solid body to a moving agent or within the moving agent is also called convection. Convection may be natural (gravitational) or forced (produced by a mechanism). With the natural convection of air, buoyant forces produced by gravitation act upon air molecules. Warmed-up air rises, carrying heat away from a warm surface. Cooler air descends toward the warmer object. Forced convection of air is produced by a fan or blower. Forced convection is used in liquid thermostats to maintain the temperature of a device at a predetermined level. THERMAL RADIATION It was mentioned earlier that in any object, every atom and every molecule vibrate. The average kinetic energy of vibrating particles is represented by the absolute temperature. According to laws of electrodynamics, a moving electric charge is associated with a variable electric field that produces an alternating magnetic field. In turn, when the magnetic field changes, it results in a changing electric field coupled with it and so on. Thus, a vibrating particle is a source of an electromagnetic field which propagates outwardly with the speed of light and is governed by the laws of optics. Electromagnetic waves can be reflected, filtered, focused, and so forth. Figure 3.41 shows the total electromagnetic radiation spectrum which spreads from γ -rays to radio waves. The wavelength directly relates to frequency, ν, by means of the speed of light c in a particular media: λ = c/ ν. DYNAMIC MODELS OF SENSOR ELEMENTS To determine a sensor’s dynamic response, a variable stimulus should be applied to its input while observing the output values. Generally, a test stimulus may have any shape or form, which should be selected depending on a practical need. For instance, for determining a natural frequency of an accelerometer, sinusoidal vibrations of different frequencies are the best. On the other hand, for a thermistor probe, a step function of temperature would be preferable. In many other cases, a step or square-pulse input stimulus is often employed. The reason for that is the theoretically infinite frequency spectrum of a step function; that is, the sensor can be tested simultaneously at all frequencies. Mathematically, a sensor can be described by a differential equation whose order depends on the sensor’s physical nature and design. There are three general types of relationship between the input s and the output S: a zero-order, a first-order and a second-order response. • Mechanical Elements: Dynamic mechanical elements are made of masses, or inertias, which have attached springs and dampers. Often the damping is viscous, and for the rectilinear motion, the retaining force is proportional to velocity. Similarly, for the rotational motion, the retaining force is proportional to angular velocity. Also, the force, or torque, exerted by a spring or shaft is usually proportional to displacement • Thermal Elements: Thermal elements include such things as heat sinks, heating elements, insulators, heat reflectors, and absorbers. If heat is of concern, a sensor should be regarded as a component of a larger device. In other words, heat conduction through the housing and the mounting elements, air convection, and radiative heat exchange with other objects should not be discounted. Heat may be transferred by three mechanisms: conduction, natural and forced convection, and thermal radiation.
  • 24. Sensor Technology Sweta Barnwal Page 24 • Electrical Elements: There are three basic electrical elements: the capacitor, the inductor, and the resistor. Again, the governing equation describing the idealized elements are given in Table 3.4. For the idealized elements, the equations describing the sensor’s behavior may be obtained from Kirchhoff’s laws, which directly follow from the law of conservation of energy: ➢ Kirchhoff’s first law: The total current flowing toward a junction is equal to the total current flowing from that junction (i.e., the algebraic sum of the currents flowing toward a junction is zero). ➢ Kirchhoff’s second law: In a closed circuit, the algebraic sum of the voltages across each part of the circuit is equal to the applied e.m.f. TEMPERATURE & THERMAL PROPERTIES OF MATERIALS By thermal properties of material, we mean those properties or characteristics of materials which are the functions of temperature or heat. We are here concerned with the thermal behavior of solids i.e., the response of solid material to thermal change, i.e., increase or decrease of heat or temperature. Thermal properties of engineering materials comprise the following: 1. Specific heat. 2. Thermal conductivity. 3. Thermal expansion. 4. Melting point or heat resistance. 5. Thermal shock. 6. Thermal diffusivity. 7. Thermal effect. These properties are important in applications like thermodynamics, heat transfer, and melting of metals. 1. Specific Heat (Heat Capacity): The heat capacity of a material is defined as the amount of heat required to raise its temperature by 1°. The heat capacity per unit mass, of material is defined as its specific heat. Heat capacity per mole is defined as its molar heat capacity. Mathematically, specific heat of a solid is defined as- Where, m = Mass, T = Temperature, Q = Energy content, and dQ = Energy (heat) added or subtracted to produce the temperature change dT. For unit mass per degree change in temperature specific heat c = dQ, the quantity of heat that must be added per unit mass of a solid to raise its temperature by one degree. The specific heat of material is sometimes
  • 25. Sensor Technology Sweta Barnwal Page 25 defined as the ratio of its heat capacity to that of water. Specific heat in this becomes the dimensionless unit (as specific heat of water is unity in MKS units). For gases there are two specific heats i.e., specific heat at constant volume cv and specific at constant pressure cp . cp is always greater than cv since any substance expands on heating and extra heat is required to raise the temperature by 1 degree in order to compensate for the energy required for expansion. For solids, difference between cp and cv is negligible and only one specific heat is used (cp = cv = c). This is due to the fact that in solids and liquids the expansion with heating is very small. According to classical kinetic theory of heat, heat capacity of an atom in a solid (crystalline element) is constant and is equal to 26 kJ/kg atoms (°C) at room temperature. This is to be divided by molecular weight in order to get mass specific heat of a solid. Specific heat increases slightly with increase in temperature and varies from metal to metal. An increase of 5 percent for every 100°C temperature rise can be used as a general approximation. The effect of raising temperature of metals and alloys is to raise the amplitude of vibration of each atom and the heat energy so absorbed is the specific heat. 2. Thermal Conductivity: It is defined as the amount of heat conducted in a unit time through a unit area normal to the direction of heat flow. Heat conduction through isotropic solids is expressed by Fourier’s law: q = Rate of heat flow/unit area normal to the direction of flow, T = Temperature, x = Distance measured in the direction of flow, and k = Thermal conductivity. Heat flow through solids is due to elastic vibration of atoms or molecules or due to transfer of energy by the free electrons. Metals have large supply of free electrons which account for their thermal conductivity. Both
  • 26. Sensor Technology Sweta Barnwal Page 26 types of conduction occurs in metals and semiconductors. Insulators have lower conductivities as they depend entirely on the lattice vibration of atoms and molecules. This is a slower process than electronic conduction. The theory of thermal conductivity through crystalline solids (metals) based on quantum (solid state) theory can be explained by concept of phonons which represent the particles (gas) characteristics of a thermal wave. It is a quantum of energy and vibration of a thermoelastic (acoustic) wave. In dielectrics (thermal insulators) thermal conductivity is caused alone by the atomic or molecular vibration of the lattice (lattice is a geometrical array of lines or points in which atoms are considered spheres) representing a certain type of crystal (say metal) structure. The progress of this elastic thermal wave (or phonons) through a crystal is akin to a gas molecule through a gas. At a heated surface the motion is increased so that collision with other phonons occurs at an increased rate and thus heat is transmitted to other parts of the phonon gas. Thermal conductivity in solids is given by a formula similar to that derived from the kinetic theory of gases. Where, k = Thermal conductivity, c = Specific heat per unit volume, ν = Average particles velocity or velocity of the lattice wave (the velocity of sound), and λ = Mean free path of lattice wave (phonon) of a given frequency. In an ideal crystal, the atomic or molecular waves of vibration are harmonic, hence, X is very large and it should have infinite thermal conductivity. In actual crystals mutual scattering and lattice wave (phonons) may occur, due to inharmonicity of the vibration and internal crystal imperfection. Phonons scattering and thus thermal conductivity depends, on crystalline structure of metals and alloys. A comparison of thermal and electrical conductivities is given below: Some typical thermal conductivities are shown as follows:
  • 27. Sensor Technology Sweta Barnwal Page 27 The thermal conductivity of pure metals increases as temperature is lowered often to a considerable degree. Copper has thermal conductivity about 35 times greater at – 269°C than at 20°C. Alloys, however, do not show this pronounced increase of thermal conductivity at lower temperatures and only small percentages of alloying are required to suppress this change in thermal characteristics. At normal and elevated temperatures, pure metals and their alloys possess very low temperature co-efficient of thermal conductivity and thus for all design purposes these effects of higher temperature on thermal conductivity are usually ignored. The thermal conductivity of amorphous solids such as glasses, and plastics increases with a rise in temperature. They generally possess, low thermal conductivity at room temperature. This is due to the fact that amorphous solids have excessive scattering of phonons by their disordered structure at lower temperatures. The thermal conductivity of refractories (more complex solids) depends on their chemical composition and crystalline structures. This is due to the presence of impurities and comparatively smaller grain size and porosity which result in lower values of thermal conductivity. If structure is simple as in case of silicon carbide, thermal conductivity has higher value. Fire clay bricks and fuel fused silica also show an increase in thermal conductivity with increasing temperature. On the other hand
  • 28. Sensor Technology Sweta Barnwal Page 28 in case of magnesite and alumina which are more crystalline in nature, the thermal conductivity decreases with rising temperature. 3. Thermal Expansion: Thermal expansion arises from the addition of heat energy in the atoms and their subsequent movement away from their equilibrium positions as the temperature rises in solid. This expansion or contraction resulting from increase or decrease in temperature is three dimensional but in practice linear thermal expansion is used for simplicity instead of volume expansion. The increase in length per unit length per degree rise in temperature is called coefficient of linear expansion. Thermal expansion does not necessarily vary uniformly with temperature but it is sufficiently linear over narrow ranges of temperature. If the bonds between the atoms are strong and highly directional as in ionic and covalent solids, the thermal expansion will be relatively small. If on the other hand the atoms are more loosely bound as in metals, a greater degree of expansion is there. In molecular solid, where bonding least resists the movement of the molecules, the thermal expansion will be the greatest. The thermal expansion of solid is related to other thermal properties such as specific heat and melting point as all these properties have their origin in lattice vibrations which increase with the temperature. The atoms or molecules as earlier explained oscillate (vibrate) with a certain amplitude about their equilibrium positions. The amplitude of this vibration increases as the temperature rises resulting in moving further away of atoms and molecules from their equilibrium position causing an increase in volume (or linear expansion) of solid. In this way magnitude of the coefficient of thermal expansion of solids will depend on their interatomic and intermolecular forms and also on their structural arrangement. It has been observed that between absolute zero temperature and the melting point, total volume range of elements is approximately constant. This can be interpreted that materials with lower softening (melting) points will have higher expansion coefficients. This also means that thermal expansion will approach zero at the absolute zero temperature. Organic polymers such as plastics and rubber have many times higher expansion coefficients than metals because of their relatively lower softening point. This may be reduced by addition of filler materials (such as glass fibre, asbestos, alumina etc.) possessing lower thermal expansion coefficients. Alloying of metals have a minor effect on this property. 4. Melting Point: Melting point or softening point is a significant temperature level as it represents transition point between solid and liquid phases having different structural arrangement of the atoms within the material. As heat is added to a solid, its thermal energy increases until the atoms or molecules on the surface begin to break away from their equilibrium positions. There is a link between interatomic spacing at which the bonding force is maximum and the amplitude of thermal vibration at which this breaking away occurs as if the atoms can be separated at this point, no further
  • 29. Sensor Technology Sweta Barnwal Page 29 increase in force is needed to separate them further. After melting commences, any further heat is all used up in activating more particles of solids which in turn collide with neighbouring particles transmitting their energy to them. The structure is therefore transformed from a solid having definite equilibrium positions to a liquid having only short range order. During melting no further rise in temperature occurs and solid and liquid phases exist at the same temperature. Melting temperature depends upon the amount of thermal energy required. This in turn depends on the nature of interatomic and intermolecular bonds. Therefore higher melting point is exhibited by those materials possessing stronger bonds. Covalent, ionic, metallic and molecular types of solids have decreasing order of bonding strength and thus the melting points. Crystalline solids have a sharp melting point at which there is sudden transformation from solids to liquid states. Amorphous solids such as glasses, plastics and rubbers and also clays do not have definite melting points but soften gradually over a certain temperature range. Relation between Thermal Expansion and Melting Point: Both depend upon the bonds between atoms (or molecules) of the solid and so are related. For each class of materials α Tm = constant Where, α = Coefficient of thermal expansion, and Tm = Melting temperature. Therefore, any two materials of a given class possessing same coefficient of expansion will therefore have approximately same melting point. The value of this constant is as under: There is an interesting conclusion that for a material to be coated to another material, coating will have to be of different class than the base material if both must have same thermal expansion. Heat Resistance: Melting point determines the heat resistance of a material as any material for high temperature application should have its melting point above the service temperature. Ceramic materials are known to have high melting points and good chemical stability but they are difficult to fabricate and cannot take thermal or mechanical shock. Following is the list of some materials possessing resistance to high temperatures:
  • 30. Sensor Technology Sweta Barnwal Page 30 5. Thermal Shock: Thermal shock is the effect of a sudden change of temperature on a material whereas thermal shock resistance can be defined as the ability of material to withstand thermal stresses due to sudden and severe changes in the temperature at the surface of a solid body. If a solid structure is prevented so that it cannot expand or contract freely on heating or cooling, excessive thermal stresses may result culminating in thermal shock and causing failure of the body. Thermal shock resulting from cooling which results in tensile stresses at the surface is much more dangerous than that from heating. Thermal shock resistance of a solid is sometimes given by the equation: Where, k = Thermal conductivity, σt = Tensile strength, E = Young’s modulus, and α = Linear co-efficient of thermal expansion. For maximum shock resistance: (i) Thermal-conductivity should be high. (ii) Thermal expansion should be low. (iii) Material should have low elastic modulus and high tensile strength. c. Brittle materials such as glass and ceramics are particularly prone to thermal shock because they readily experience brittle failure instead of plastic yield. 6. Thermal Diffusivity: Thermal diffusivity (h) is defined as: cp ρ represent heat requirement per unit volume. A material having high heat requirement per unit volume possesses a low thermal diffusivity because more heat must be added to or removed from the material for affecting a temperature change. Thermal diffusivity is therefore associated with the diffusion of thermal energy and may be taken to represent an energy flux arising from the motion of phonons through a relatively
  • 31. Sensor Technology Sweta Barnwal Page 31 stationary atomic array. As phonons are in the nature of waveform, the atoms vibrate in unison but are not physically transported. 7. Thermal Stresses: When expansion or contraction of a body due to temperature change is wholly or partially prevented, thermal stress will be developed in body. Thermal stress may arise from external bodies connected to one under stress as for example, welded structure, railway line shrink fit components. Or, it may be due to non-uniform expansion of the body itself, for example bimetallic strips used in thermostatic controls. The value of thermal stress, expansion or contraction can be calculated by applying simple stress calculation theory. 8. Thermo-Elastic Effect: When a solid is subjected to a load, work is done on it and it changes in volume. If this work is done at constant temperature, an adiabatic temperature rise (without transfer of heat to or from the surroundings) occurs. This will appear in the form of rise of temperature of solid when it is in stretched condition. Similarly when the solid is rapidly relaxed, -it will feel. cool. This warming or cooling phenomenon is called thermoelastic effect.