SlideShare a Scribd company logo
REPORT
Bacterial diversity patterns along a gradient
of primary productivity
M. Claire Horner-Devine1
*,
Mathew A. Leibold2
,
Val H. Smith3
and
Brendan J. M. Bohannan1
1
Department of Biological
Sciences, Stanford University,
Stanford, CA 94305, USA
2
Department of Ecology and
Evolution, University of
Chicago, Chicago, IL 6063, USA
3
Department of Ecology and
Evolutionary Biology, University
of Kansas, Lawrence, KS 6604,
USA
*Correspondence: E-mail:
mcdevine@stanford.edu
Abstract
Primary productivity is a key determinant of biodiversity patterns in plants and animals
but has not previously been shown to affect bacterial diversity. We examined the
relationship between productivity and bacterial richness in aquatic mesocosms designed
to mimic small ponds. We observed that productivity could influence the composition
and richness of bacterial communities. We showed that, even within the same system,
different bacterial taxonomic groups could exhibit different responses to changes in
productivity. The richness of members of the Cytophaga-Flavobacteria-Bacteroides
group exhibited a significant hump-shaped relationship with productivity, as is often
observed for plant and animal richness in aquatic systems. In contrast, we observed a
significant U-shaped relationship between richness and productivity for a-proteobacteria
and no discernable relationship for b-proteobacteria. We show, for the first time, that
bacterial diversity varies along a gradient of primary productivity and thus make an
important step towards understanding processes responsible for the maintenance of
bacterial biodiversity.
Keywords
Bacterial diversity, biodiversity, community composition, eutrophication, freshwater
ecology, microbial ecology, primary productivity, ribosomal DNA, taxonomic diversity.
Ecology Letters (2003) 6: 613–622
IN T ROD U CTI ON
A primary goal of ecology is to understand the distribution
of organisms. Investigating patterns of biodiversity is a
crucial step towards achieving this goal (Lubchenco et al.
1991). While many factors likely affect the biodiversity of a
region, primary productivity (the rate of energy capture and
carbon fixation by primary producers) is emerging as a key
determinant of plant and animal biodiversity, especially
species richness (i.e. the number of species present;
Rosenzweig 1995; Mittelbach et al. 2001). However, it is
unknown how, or even if, bacterial diversity varies with
primary productivity. Understanding patterns of bacterial
diversity is of particular importance because bacteria may
well comprise the majority of the earth’s biodiversity and
they mediate critical ecosystem processes (Cavigelli &
Robertson 2000; Torsvik et al. 2002).
The relationship between productivity and diversity has
been of long-standing interest to ecologists. Many studies of
plants and animals have reported a hump-shaped relationship
between productivity and diversity, where diversity peaks at
intermediate productivity (Rosenzweig 1995; Leibold 1999;
Dodson et al. 2000; Mittelbach et al. 2001). Other studies
have reported a monotonic increase of diversity with
productivity, a decrease, a U-shaped relationship or no
discernible pattern (Abrams 1995; Mittelbach et al. 2001).
Variation in observed productivity–diversity patterns may
result both from differences in study design and differential
responses of organisms at various spatial and temporal
scales (Mittelbach et al. 2001). For example, the geographical
scale (e.g. local vs. regional) and ecological scale (e.g. within
vs. among communities) of studies often influences patterns
even within the same taxonomic group (Waide et al. 1999;
Gross et al. 2000). It is also possible that some studies lump
taxa or guilds that differ in their responses to productivity
and thus mask patterns at different taxonomic scales (e.g.
Haddad et al. 2000; Torsvik et al. 2002). In addition, our
understanding of productivity–diversity relationships is
influenced strongly by particular well-studied taxonomic
groups such as terrestrial plants and, therefore, may be
biased by these taxa (Mittelbach et al. 2001). Other taxa
(especially microorganisms) remain relatively unstudied.
Our ignorance regarding patterns of bacterial diversity is
primarily due to significant theoretical and practical problems
Ecology Letters, (2003) 6: 613–622
Ó2003 Blackwell Publishing Ltd/CNRS
that have, until recently, hindered the quantification of
bacterial diversity. These problems include the very small
proportion of microbial species that can be cultured (Amann
et al. 1995), the very large number of individuals that may be
present per sample, the high diversity that may be present at a
small scale and the difficulty of defining a microbial species
(Goodfellow & O’Donnell 1993). However, solutions to
many of these problems have recently been developed
(O’Donnell et al. 1994; Ovreas 2000; Hughes et al. 2001).
For example, a number of techniques have been developed
that assess bacterial diversity without requiring growth. The
most promising of these techniques use ribosomal gene
sequences (obtained from DNA isolated from the environ-
ment) as the indicators of bacterial phylogenetic richness
(O’Donnell et al. 1994; Stackebrandt & Rainey 1995).
Evidence from laboratory studies suggests that produc-
tivity may influence microbial diversity, and such studies
offer insight into possible mechanisms responsible for
observed productivity–diversity relationships (Kaunzinger &
Morin 1998; Bohannan & Lenski 2000; Kassen et al. 2000).
For example, Kassen et al. (2000) found that bacterial
diversity peaked at intermediate productivity in heterogene-
ous lab microcosms. They suggested that this was likely due
to niche specialization in a heterogeneous environment.
This work, however, considered only strains of one bacterial
species and, like most terrestrial plant studies, contained
only one trophic level. In contrast, Kaunzinger & Morin
(1998) used multi-trophic level laboratory microcosms
comprised of aquatic bacteria and protists, to demonstrate
that increasing productivity resulted in increased food chain
length. Furthermore, they observed that food chain length
determined the numerical response of a given trophic level
to productivity; for example, bacteria increased in abun-
dance in response to productivity only in food chains with
an odd number of trophic levels. Finally, Bohannan &
Lenski (2000) observed that increasing productivity resulted
in an increase in the relative importance of competition
(ÔÔbottom–upÕÕ effects) and predation (ÔÔtop–downÕÕ effects)
as determinants of bacterial community composition in
laboratory microcosms. At low productivity levels, superior
competitors were favoured, while at high levels of produc-
tivity more predator-resistant types were favoured. These
observations are consistent with the keystone-predation
model (Leibold 1996), which predicts a unimodal relation-
ship between productivity and diversity.
Observations from several field studies suggest that
increased nutrients (and associated increased primary
productivity) can alter bacterial community composition
(Broughton & Gross 2000; Fisher et al. 2000; Lindstrom
2000; Schafer et al. 2001; Ovreas et al. 2003). For example,
Fisher et al. (2000) assessed the composition of microbial
communities in aquatic mesocosms that varied in nutrient
inputs. They observed that community composition,
assessed by using length heterogeneities in the intergenic
region between 16S and 23S ribosomal genes, changed in
response to additions of nitrogen and phosphorous.
We know of only three field studies that have attempted
to document the relationship between primary productivity
and bacterial diversity (Benlloch et al. 1995; Torsvik et al.
1998; Schafer et al. 2001). Over a period of 13 days, Schafer
et al. (2001) found that nutrient addition first decreased
bacterial diversity (measured as the number of DNA derived
DGGE bands). A subsequent increase in the abundance of
protists, and thus possible increased grazing, was accom-
panied by increased bacterial diversity. In the post-grazing
stage, bacterial diversity once again decreased. These results
suggest that both bottom–up and top–down processes
might control bacterial diversity. They also observed that
community composition varied with nutrient addition.
Benlloch et al. (1995) used the richness of 16S rDNA
sequences as an estimate of bacterial diversity in two coastal
lagoons that differed in primary productivity. They observed
a greater number of unique ribosomal gene sequences in the
more productive lagoon than in the less productive lagoon,
suggesting that bacterial richness may increase with primary
productivity. In addition, the sample from the more
productive lagoon contained individuals related to 10 major
phylogenetic groups while the less productive lagoon
contained representatives from only five. However, due to
the time and effort necessary to clone and sequence, only 50
clones per lagoon were assessed, and 70% of these clones
were unique. This suggests that the lagoons were likely very
undersampled (Benlloch et al. 1995; Hughes et al. 2001).
Torsvik et al. (1998) observed that pristine aquatic sediments
had much higher prokaryotic diversity than sediments
below fish farms (which receive a substantial input of
nutrients via fish feed), suggesting that increased nutrients
may decrease diversity. In all three studies discussed above,
only two productivity levels were sampled, and thus the
authors could not differentiate between a linear and
quadratic trend.
To determine the relationship between both bacterial and
algal richness and primary productivity, we estimated
bacterial taxonomic richness along a gradient of primary
productivity in freshwater mesocosms. Small ponds and,
similarly, mesocosms that mimic small ponds have proven
to be excellent model systems with which to study
productivity–diversity relationships (Wilbur 1997; Leibold
1999; Chase & Leibold 2002; Downing & Leibold 2002). In
particular, small, fishless ponds represent a relatively simple
natural system comprised of viruses, bacteria, algae and
zooplankton. Productivity is easily manipulated via the
addition of inorganic nutrients, and eukaryotic organisms in
such systems tend to have short generation times and thus
can respond quickly to such manipulations. In addition,
substances (such as humic acids) that interfere with
614 M. C. Horner-Devine et al.
Ó2003 Blackwell Publishing Ltd/CNRS
molecular techniques used to estimate bacterial diversity are
usually found in low concentrations. Both natural ponds
(e.g. Dodson et al. 2000; Leibold 1999) and mesocosm
studies (e.g. Leibold unpublished) have shown unimodal
relationships between primary productivity and richness of
planktonic plants. We manipulated the primary productivity
of aquatic mesocosms by altering the input of inorganic
nutrients. We used culture-independent techniques coupled
with statistical extrapolation methods to estimate bacterial
taxonomic richness as a measure of bacterial diversity in the
water column of mesocosms that varied in primary
productivity. We compare these bacterial results with
patterns observed for algal richness from the same system.
Our results suggest that, like algal richness, bacterial richness
can vary with primary productivity and that the nature of
this relationship may vary among taxonomic groups of
bacteria.
M A T ER I A L A N D ME T H O D S
Mesocosms
We established 16 mesocosms at the Kellogg Biological
Station (KBS) in southern Michigan as part of a larger
experiment to assess the relationships among productivity,
diversity and food web structure. Each mesocosm consis-
ted of a 2 m-diameter polyethylene cattle tank with a
screen cover, filled with well water. Mesocosms were
evenly spaced in a random block design in a field at KBS
(Downing & Leibold 2002). Each mesocosm was inocu-
lated from the same pooled sample collected from six
ponds in southern Michigan that spanned a natural
gradient in primary productivity. The samples were filtered
through a 30 lm mesh and flushed with CO2 to kill
macro-zooplankton. A gradient of primary productivity
was established across the mesocosms by maintaining
otherwise identical mesocosms with different input con-
centrations of nitrogen and phosphorus. Four levels of
nutrient input were used: high (27 · baseline), intermediate
(9 · baseline and 3 · baseline) and low (1 · baseline) with
four replicates at each level. We added sand to each
mesocosm as a bottom substrate and maintained a
constant water level by adding nutrient-poor well water
when necessary. Although microorganisms could enter the
mesocosms through the well water or through the air, we
have no reason to believe that microbes from these
sources differentially colonized the mesocosms. The
mesocosms were sampled at the end of the 4-month
summer growing season. Fourteen samples were collected
from the water column of each mesocosm, from just
below the pond surface and to a depth of one foot. To
minimize sampling effects due to spatial heterogeneity
within the mesocosms, samples were pooled to form one
large sample for each mesocosm. Replicate subsamples
were taken from the pooled sample for analysis.
Productivity and nutrients
We estimated primary productivity as chlorophyll a.
Chlorophyll a has been shown to be a highly significant
correlate of primary productivity in aquatic systems (Lam-
bou et al. 1982) and especially in aquatic mesocosms
(Downing & Leibold 2002). Samples from 16 mesocosms
were analysed for total nitrogen, phosphorous and
chlorophyll a within an hour of sampling. We measured
chlorophyll a using fluorometric methods, and total nitrogen
and phosphorous using spectrophotometry after persulfate
digestion at the end of the growing season.
Algae
Algal richness was determined morphologically to genus by
microscopic inspection of subsamples preserved in 5%
gluteraldehyde immediately after sampling. We examined
similarity in algal composition among ponds by calculating
Jaccard similarity coefficients for each pair of ponds
(Magurran 1988). The Jaccard index is the ratio of species
or unique types shared by two sites to the total number of
species or types in the two sites combined. We then used a
multidimensional scaling algorithm (MDS with a Kruskal
loss function, SYSTAT 8.0, Chicago, IL, USA) to reveal
clustering by treatment. We tested the significance of this
clustering with a two-way analysis of similarity (ANOSIM;
Carr 1997). ANOSIM is a permutation-based test, i.e. an
analogue of the commonly used univariate ANOVA, and tests
for differences between groups of multivariate samples from
different treatments.
Bacteria
In order to maximize the proportion of bacterial diversity
represented in our samples, we chose to sample intensively a
subset of five of 16 mesocosms for bacterial diversity. The
five mesocosms were selected to represent the range of
primary productivity available. These five samples represent,
to date, the largest collection of bacterial sequences ever
sampled along an environmental gradient (760 individual
sequences) and thus offer a fuller picture of bacterial
diversity than currently exists. Of these mesocosms, two
received low inputs of nitrogen and phosphorus, one
received intermediate inputs, and two received high. Bacter-
ial abundance was determined by direct microbial counts of
DAPI (4¢,6-Diamidino-2-phenylindole) stained subsamples
preserved in 5% gluteraldehyde immediately after sampling.
Samples for bacterial richness analysis were pre-filtered
through a 45 lm filter and then concentrated on a 0.2 lm
Bacterial diversity and primary productivity 615
Ó2003 Blackwell Publishing Ltd/CNRS
cylindrical filter (Somerville et al. 1989). We flushed the filters
with SET buffer and stored them at )20 °C until analysis.
Extraction, amplification, cloning and sequencing
of bacterial rDNA
We used cloning and sequencing of 16S rDNA to assess
bacterial richness in the five mesocosms. Community DNA
was extracted from the concentrated cells using a combi-
nation of chemical lysis and physical disruption (cycles of
freezing and thawing). Bacterial rDNA was amplified using
the PCR, with primer sequences corresponding to Escherichia
coli nucleotides 1392–1406 (1392r) and 8–26 (8f). This
primer set is known to amplify only sequences within the
domain Bacteria (Amann et al. 1995). Twenty PCR cycles
were used, with each cycle consisting of 30 s at 94 °C, 30 s
at 57 °C, and 90 s at 72 °C. The amplicons were ligated into
plasmid pCR2.1 and cloned using the TOPO-TA cloning
system (Invitrogen, Carlsbad, CA, USA). We used an ABI
377 automated DNA sequencer to determine the sequence
of the 5¢ terminal 500 nucleotides of 760 of the cloned
rDNA amplicons (Stackebrandt & Rainey 1995).
PCR-based methods for assessing bacterial diversity are
less biased than culture-based techniques, but potential
sources of bias remain (Wintzingerode et al. 1997; Speksnij-
der et al. 2001). We selected PCR conditions to reduce these
potential biases. For example, we limited the PCR to 20
cycles, we used DMSO in our PCR reactions to reduce
biases due to GC content, and we pooled five replicate PCR
reactions prior to cloning (Devereux & Willis 1995;
Stackebrandt & Rainey 1995; Qiu et al. 2001; Speksnijder
et al. 2001). In addition, we minimized changes in the
relative abundance of bacteria in the samples by chilling
immediately after sampling and storing the samples at
)20 °C within an hour of sampling. We also used both
chemical lysis and physical disruption to extract nucleic
acids from a broad array of possible cell types.
Phylogenetic analysis of rDNA
We used the RDP database (Maidak et al. 2001) and ARB
software (Ludwig & Strunk 1999) to initially align the rDNA
sequences from our five clone libraries. Ambiguously and
incorrectly aligned positions were aligned manually based on
conserved primary sequence and secondary structure. We
identified and excluded potential chimeras by using the
Chimera_Check program (Maidak et al. 2001) and by using
ARB to create and compare trees generated from the 5¢-end
vs. the 3¢-end sequences separated at the break point
suggested by Chimera_Check. We repeated this process for
a break point in the middle of the sequence. Clones were
identified as chimeric if their two ends showed affiliation
with different reference species.
Similarity matrices were generated using 334–450 unam-
biguously aligned positions. We used the Felsenstein
correction and the neighbor joining method to build a
phylogenetic tree using the ARB software program (Ludwig
& Strunk 1999). We grouped sequences into operational
taxonomic units (OTUs) based on rDNA sequence
similarity (Stackebrandt & Rainey 1995). There is no
common standard for defining operational taxonomic units
(OTUs) based on rDNA sequences. Therefore we used the
three most commonly used definitions to group our
sequences into OTUs: 95% sequence similarity (Speksnijder
et al. 2001), 97% sequence similarity (Stackebrandt & Rainey
1995) and 99% sequence similarity (Kroes et al. 1999). When
it was not possible to separate sequences into OTUs
unambiguously, we used complete-linkage clustering to
resolve the OTUs, starting with the largest group of most
closely related sequences (Dunn & Everitt 1982).
Bacterial diversity estimation
We used OTU richness as our estimate of bacterial
phylogenetic richness. OTU richness was estimated via
extrapolation from observed OTU richness patterns using
the Chao1 approach (Hughes et al. 2001). These calculations
were performed using EstimateS software (Colwell 1997).
In addition to richness, we examined similarity in bacterial
composition among mesocosms in two ways. First, we used
the Jaccard index to examine clustering in OTU composi-
tion (as described above for algae). Second, we used a
Mantel test (MANTEL 2.0) to test whether the composition
of algae and bacteria were correlated by determining the
significance between similarity matrices for the two groups
(Sokal & Rohlf 1995). We tested the correlation between
Jaccard similarity coefficients for bacteria and algae for pairs
of ponds to examine similarity in species turnover or
associations among algal and bacterial types. We used the
RDP (Maidak et al. 2001) and Bergey’s Manual of System-
atic Bacteriology (Garrity 2001) to determine the putative
taxonomic affiliation of each clone. We focused additional
analyses on the three most commonly observed taxo-
nomic groups in our study: the Cytophaga-Flavobacterium-
Bacteroides (CFB) group, the a-proteobacteria, and the
b-proteobacteria.
Statistical analysis
We used a generalized linear model and quadratic regression
models (GLM regression, SYSTAT 8.0) to examine the
relationship between productivity and richness (Mittelbach
et al. 2001). Values were log-transformed when necessary.
We applied the test of Mitchell-Olds and Shaw (hereafter,
MOS test; Mitchell-Olds & Shaw 1997; Leibold 1999;
Mittelbach et al. 2001) to determine if a curvilinear
616 M. C. Horner-Devine et al.
Ó2003 Blackwell Publishing Ltd/CNRS
Table 2 The effect of productivity on bacterial richness. GLM results in conjunction with the test of Mitchell-Olds and Shaw (1997) show
that a-proteobacterial richness exhibits a unimodal relationship with productivity as measured by chlorophyll a. CFB richness shows a
significant U-shaped relationship with productivity. Abbreviations are as in Table 1
Coeff. SE (Coeff.) t P Multiple r2
d.f.
a-proteobacteria Overall linear model 0.469 0.186 1
Constant 4.966 9.828 0.505 0.648
Prod 4.255 5.146 0.827 0.469
Overall quadratic model 0.090 0.910 2
Constant 88.308 21.091 4.187 0.053
Prod )87.409 22.873 )3.821 0.062
Prod2
24.123 5.994 4.024 0.057
Prod* < Prodmax 4.420 0.048
Prod* < Prodmin )3.466 0.074
CFBs Overall linear model 0.712 0.052 1
Constant 17.838 11.372 1.569 0.215
Prod )2.413 5.954 )0.405 0.712
Overall quadratic model 0.095 0.905 2
Constant )79.118 23.311 )3.394 0.077
Prod 104.224 25.282 4.123 0.054
Prod2
)28.064 6.626 )4.236 0.051
Prod* < Prodmax )4.361 0.049
Prod* < Prodmin 3.894 0.060
b-proteobacteria Overall model 0.172 0.515 1
Constant 12.023 3.500 3.435 0.041
Prod )3.271 1.832 )1.785 0.172
Table 1 The effect of productivity on algal and bacterial richness. GLM results in conjunction with the test of Mitchell-Olds and Shaw (1997)
show that algal richness exhibits a unimodal trend with productivity as measured by chlorophyll a. Overall bacterial richness does not show a
significant relationship with productivity
Coeff. SE (Coeff.) t P Multiple r2
d.f.
Algae Overall linear model 0.136 0.152 1
Constant 24.763 6.528 3.793 0.002
Prod )5.737 3.622 )1.584 0.136
Overall quadratic model 0.079 0.323 2
Constant )25.156 28.228 )0.891 0.389
Prod 51.262 31.661 3.483 1.619
Prod2
)15.450 8.534 )1.811 0.093
Prod* < Prodmax )2.209 0.046
Prod* < Prodmin 1.283 0.222
Overall bacteria Overall linear model 0.190 0.487 1
Constant 26.497 17.387 1.524 0.225
Prod 15.371 9.104 1.688 0.190
Abbreviations: Prod ¼ Log chlorophyll a, Prod* ¼ observed Log chlorophyll a, Coeff. ¼ regression coefficient of each term, SE
(Coeff.) ¼ standard error of the coefficient, t ¼ value of the t-test, P ¼ probability value for each term and d.f. ¼ degrees of freedom for
the overall model. Also shown are P-values for the MOS-test of the hypothesis that the function maximum or minimum is located at
productivity levels less than the greatest (Prod* < Prodmax) and greater than the least (Prod* < Prodmin) observed productivity level.
Significant terms for both denote an internal minimum or maximum. The MOS test for algae shows that the internal maximum is significantly
less than the observed maximum productivity. We are less confident that an extreme minimum value of productivity does not possess
maximum species richness. Thus we characterize the productivity–diversity relationship for algae only as a unimodal trend.
Bacterial diversity and primary productivity 617
Ó2003 Blackwell Publishing Ltd/CNRS
relationship reaches a maximum or minimum with the
observed range of productivities. Curvilinear relationships
that show an internal maximum or minimum are considered
unimodal or U-shaped, respectively. Values for the MOS
test are reported in Tables 1 and 2. Due to the constraints
inherent in sampling and analysing bacterial richness, the
number of mesocosms sampled was low (5), thus limiting
statistical power. We assumed a priori a 10% probability of
Type I error in our statistical analyses (as discussed by
Gill 1978), rather than the more common assumption of
5%. We thus deemed relationships as significant trends if
P £ 0.10.
R E S U L T S
Increasing inorganic nutrients increased primary productiv-
ity, estimated as chlorophyll a, as anticipated. In addition,
bacterial abundance increased with increasing primary
productivity (r2
¼ 0.709, P ¼ 0.07; Fig. 1).
The 760 bacterial 16S sequences sampled grouped into
150 OTUs, using the broadest OTU definition (95%
similarity). Almost half the OTUs were singletons
(n ¼ 74), and 15 OTUS were represented by more than 10
sequences. The most abundant OTU across all mesocosms
contained 112 clones and was most similar to a member of
the b-proteobacteria belonging to the family Alcaligenaceae.
The number of OTUs and the number of singletons tended
to increase as the OTU definition was narrowed.
Both bacterial and algal taxonomic composition differed
according to productivity level (ANOSIM: P ¼ 0.067 for
both; Fig. 2). Algal composition was more similar between
pairs of high and low productivity ponds than it was
between the intermediate productivity pond and others. All
three productivity levels clustered independently for
bacteria. Mantel tests showed that pairs of sites that were
similar for algae were also similar for b-proteobacteria
(r ¼ 0.73, 100 permutations, P < 0.025) but not for CFBs
(r ¼ 0.42, 100 permutations, P > 0.10) or a-proteobacteria
(r ¼ 0.18, 100 permutations, P > 0.10).
Overall bacterial and algal richness exhibited different
trends with productivity. Algal richness exhibited a hump-
shaped trend with increasing productivity (r2
¼ 0.323,
P ¼ 0.079; Fig. 3a, Table 1). In contrast, overall bacterial
richness showed no trend with increasing productivity
(r2
¼ 0.487, P ¼ 0.190, Fig. 3b, Table 1), although bacterial
richness did decrease significantly with increasing algal
richness (r2
¼ 0.713, P ¼ 0.072). Changing the OTU
definition from 95% similarity to 97 or 99% did not
qualitatively alter these results.
Our estimates of overall bacterial richness included
sequences from many different phylogenetic groups.
Log chlorophyll a
Abundance(millions)
25
20
15
10
5
0
1.2 1.4 1.6 1.8 2.0 2.2 2.4 2.6
Figure 1 Total bacterial abundance increased with primary pro-
ductivity (r2
¼ 0.709, P ¼ 0.07).
1.5 1 0.5 0 0.5 1 1.5
1
0.5
0
0.5
1
1.5
(a) Algae
Dimension2
(b) Bacteria
1.5 1 0.5 0 0.5 1 1.5
Dimension2
1
0.5
0
0.5
1
1.5
Dimension 1
Figure 2 The relationship between species composition and
nutrient input level for both (a) algae and (b) bacteria. These
multidimensional scaling algorithm plots show values of Jaccard
similarity coefficients among productivity levels. Distance between
two points is inversely proportional to the Jaccard similarity value
for a given pair such that sites positioned close together share more
species than sites further apart. The triangle represents the
intermediate productivity mesocosm, the squares represent the
high productivity mesocosms, and the circles represent the low
productivity treatments. Both algal and bacterial composition
differs significantly with primary productivity (ANOSIM,
P ¼ 0.067 for both).
618 M. C. Horner-Devine et al.
Ó2003 Blackwell Publishing Ltd/CNRS
Combining diverse groups can potentially mask patterns pre-
sent in individual groups (Peet & Christensen 1988; Haddad
et al. 2000). In an attempt to increase the resolution of our
analysis, we reanalysed our data, focusing on the three most
numerically dominant taxonomic groups in our sample: the
CFB group (representing 20.1% of sequences sampled), the
a-proteobacteria (29.9%), and the b-proteobacteria (29.7%).
We observed that these three groups exhibited very different
responses to primary productivity (Fig. 4, Table 2). a-pro-
teobacterial richness exhibited a significant U-shaped
relationship with productivity (r2
¼ 0.91, P ¼ 0.09), and
CFB richness exhibited a significant hump-shaped relation-
ship with productivity (r2
¼ 0.90, P ¼ 0.095). In contrast,
b-proteobacterial richness showed no discernable response
to increasing productivity (r2
¼ 0.533, P ¼ 0.172). Again,
changing the OTU definition from 95 to 97 or 99% did not
qualitatively alter these relationships.
D I SCU S S I O N
We observed that bacterial abundance increased with
increasing primary productivity in our system, as reported
in studies of other aquatic systems (Kaunzinger & Morin
1998, and reviewed in Gasol & Duarte 2000). These
observations suggest that, despite the presence of bacter-
iovores, top–down effects are, in general, less important
than bottom–up effects in determining the overall abun-
dance of bacteria in aquatic systems.
Previous studies also observed an effect of primary
productivity or nutrient status on bacterial community
composition (e.g. Broughton & Gross 2000; Fisher et al.
2000; Lindstrom 2000; Schafer et al. 2001; Ovreas et al. 2003).
Our results are consistent with these observations. The
communities at each productivity level were more similar to
each other in species composition than to communities at
either of the other two productivity levels. Furthermore, we
found a statistical association between particular b-proteobac-
teria and algae but not between algae and other bacterial types.
Bacterial and algal diversity had different responses to
primary productivity. Our observation that algal diversity
exhibited a hump-shaped relationship with increasing
productivity is consistent with observations in other aquatic
ecosystems (e.g. Leibold 1999; Waide et al. 1999; Dodson
et al. 2000; Mittelbach et al. 2001; Chase & Leibold 2002). In
contrast, overall bacterial richness showed no trend.
However, when we examined the most common taxonomic
groups within the broad group of bacteria sampled by our
methods, we found that different taxonomic groups of
bacteria exhibited different responses to changes in primary
1.2 1.4 1.6 1.8 2.0 2.2 2.4 2.6
Log chlorophyll a
1.2 1.4 1.6 1.8 2.0 2.2 2.4 2.6
Bacterialrichness
(b) Bacteria
75
70
65
60
55
50
45
(a) Algae
30
25
20
15
10
5
0
Algalrichness
Figure 3 The relationship between primary productivity and
taxonomic richness. (a) Algal richness and primary productivity.
Large symbols represent mesocosms sampled for bacteria across a
productivity gradient. Algal richness exhibits a unimodal trend with
productivity (r2
¼ 0.323, P ¼ 0.079). (b) Overall bacterial richness
and primary productivity. There is no significant trend between
bacterial richness and productivity (r2
¼ 0.487, P ¼ 0.190).
Log chlorophyll a
1.2 1.4 1.6 1.8 2.0 2.2 2.4 2.6
20
18
16
14
12
10
8
6
4
2
0
Estimatedrichness
CFB
β proteo
α proteo
Figure 4 Richness of three major groups of bacteria and primary
productivity. a-proteobacterial richness exhibited a significant
U-shaped relationship with productivity (r2
¼ 0.91, P ¼ 0.090).
CFB richness has a unimodal relationship with productivity
(r2
¼ 0.905, P ¼ 0.095), and b-proteobacterial richness shows no
discernible response to increasing productivity (r2
¼ 0.515,
P ¼ 0.172).
Bacterial diversity and primary productivity 619
Ó2003 Blackwell Publishing Ltd/CNRS
productivity. The CFBs exhibited a hump-shaped relation-
ship, the a-proteobacteria exhibited a U-shaped relation-
ship, and the b-proteobacteria showed no relationship
between primary productivity and richness.
Due to the high richness of these systems, it was
necessary to sample a subset of five mesocosms intensively
rather than sample additional mesocosms less thoroughly.
This limited number of mesocosms, of course, limits
statistical power. As the P values for the trends we report
range between 0.05 and 0.1, our results may be viewed more
as suggestive than definitive. Regardless, to our knowledge
these are the first observations that suggest that significant
nonlinear relationships between bacterial richness and
primary productivity may exist, and that these relationships
may vary by taxonomic group. Further studies are necessary
to demonstrate the generality of these patterns.
The CFBs, b-proteobacteria and a-proteobacteria are
broad taxonomic groups that each includes members with
very different metabolic lifestyles. It is thus remarkable that
significant patterns in richness would be evident at this
taxonomic scale. However, others have reported shifts in
the relative abundances of these three groups in response to
environmental change. For example, changes in the relative
abundances of these three groups has been observed in
response to increased predation (e.g. Jurgens et al. 1999) and
increased inorganic nutrients (e.g. Lebaron et al. 2001).
There is also evidence for differences at this taxonomic level
in important ecological traits. For example, a-proteobacteria
and b-proteobacteria have been observed to respond to
predation differently (Pernthaler et al. 1997). Differences in
competitive ability for resources have also been observed;
for example, members of the CFB group are distinctive in
their ability to degrade high molecular weight polymers,
although they can degrade low molecular weight com-
pounds with reduced efficiency (Kirchman 2002). Ecolog-
ical traits such as these (i.e. response to predators and
competitive ability for resources) have been suggested as
underlying the relationships between diversity and produc-
tivity in plants and animals (e.g. Leibold 1996) and could be
responsible for the patterns we observed for bacteria as well.
The hump shaped relationship observed for algae and
CFBs has also been observed for a number of other taxa.
This relationship appears to be especially common in plant
and animal studies that sample diversity across communities
(as opposed to within a single community) and studies that
use plant biomass as a measure of primary productivity
(Mittelbach et al. 2001). It is also the predominant pattern
observed in aquatic communities (Dodson et al. 2000;
Mittelbach et al. 2001). Explaining this pattern has been
the focus of a growing body of theory (e.g. Tilman 1982;
Abrams 1995; Rosenzweig 1995; Leibold 1999). For
example, theory predicts that hump-shaped relationships
between productivity and diversity can result from trade-
offs between competitive ability and resistance to predators
(Leibold 1999), trade-offs between competitive ability for
nitrogen and for phosphorus (Tilman 1982), from changes
in the spatial distribution of resources that occur as
productivity increases, and from a number of other
ecological processes (reviewed in Rosenzweig 1995). Fre-
quent observations of hump-shaped patterns have led some
to claim that this is the ÔÔtrueÕÕ or most fundamental
relationship between productivity and diversity (e.g. Tilman
& Pacala 1993; Rosenzweig 1995). However, recent surveys
have demonstrated that other patterns occur commonly as
well, although they are not as well studied or understood as
hump-shaped relationships (Waide et al. 1999; Mittelbach
et al. 2001). Our observations of bacteria are consistent with
these surveys; significant hump-shaped patterns were
observed for algae and the CFB group of bacteria, but not
for a- or b-proteobacteria.
The U-shaped relationship exhibited by the a-proteo-
bacteria in our study has also been observed in other taxa
and systems. A recent review of 171 published studies
found that U-shaped relationships comprised 36% of the
data with quadratic responses to productivity (Mittelbach
et al. 2001). However, to our knowledge, there is currently
no theory proposed to explain a U-shaped pattern (but see
Scheiner & Jones 2002). It is possible that competition
between a-proteobacteria and CFBs might result in the
observed respective U-shaped and hump-shaped patterns.
It would be possible to assess this hypothesis in future
work by measuring the concentration of different
resources (i.e. different carbon sources) as well as
predation intensity due to both viral and protistan grazers.
Our results also have implications for understanding how
aquatic systems respond to anthropogenic additions of
nitrogen and phosphorous (eutrophication). Inputs of
nitrogen and phosphorous, the growth limiting nutrients
for most aquatic primary producers, have increased in
aquatic systems due to such sources as domestic and
industrial wastes, and runoff from fertilized agricultural
areas. This anthropogenic influx of nutrients often results in
a decrease in plant and animal species diversity (Gough et al.
2000). The response of bacteria to eutrophication may be of
particular importance as bacteria play significant roles in
biogeochemical cycling (Torsvik et al. 2002). As suggested
here, eutrophication could have a significant influence on
bacterial taxonomic composition and richness, and changes
in composition and richness have been shown to result in
differences in the rates and controls of biogeochemical
processes in some studies (Bruns et al. 1999; Cavigelli &
Robertson 2000).
Finally, perhaps the most fundamental biotic attribute of
a region, ecosystem or community is the number of species
it supports. While many factors are likely to affect species
richness in a region, the supply of available energy (the
620 M. C. Horner-Devine et al.
Ó2003 Blackwell Publishing Ltd/CNRS
primary productivity of a region) has emerged as a major
determinant of observed variation in species richness
(Rosenzweig 1995). Our study is consistent with this
observation. Using culture-independent molecular methods
to characterize bacterial richness, we observed that overall
bacterial richness did not have a significant relationship with
primary productivity. However, when the three numerically
dominant taxonomic groups of bacteria were analysed
separately, patterns emerged. Understanding observed
variation in productivity-richness relationships is central to
understanding the underlying mechanisms responsible for
the generation and maintenance of biodiversity; such an
effort is in progress for plants and animals (Mittelbach et al.
2001) and is an important goal for future work on
microorganisms.
AC KNOWL E DGEMENTS
The authors are grateful to Adrian Barbrook, Joel Mefford,
and the staff of the Stanford Genome Technology Center
(especially Nancy Federspiel and Chris Webb) for technical
assistance. This work benefited from the insight and
technical assistance of the staff of the Center for Microbial
Ecology, especially Terry Marsh and James Tiedje, and the
Kellogg Biological Station, especially Sandy Marsh and
Michael Klug. The authors are also grateful to Michael
Hochberg, Peter Morin, Gary Mittlebach and three anony-
mous reviewers for helpful comments on a previous draft of
this manuscript. This work was funded by National Science
Foundation grants to BB (DEB9907797 and DEB0108556),
ML and VS (DEB9816192).
REFE R E NC E S
Abrams, P.A. (1995). Monotonic or unimodal diversity-produc-
tivity gradients: what does competition theory predict? Ecology,
76, 2019–2027.
Amann, R.I., Ludwig, W., Schleifer, K.H., Torsvik, V.L. & Gok-
soyr, J. (1995). Phylogenetic identification and in-situ detection
of individual microbial-cells without cultivation. Microbiolog. Rev.,
59, 143–169.
Benlloch, S., Rodriguez-Valera, F. & Martinez-Murcia, A.J. (1995).
Bacterial diversity in two coastal lagoons deduced from 16S
rDNA PCR amplification and partial sequencing. FEMS Micro-
biol. Ecol., 18, 267–279.
Bohannan, B.J.M. & Lenski, R.E. (2000). Linking genetic change to
community evolution: insights from studies of bacteria and
bacteriophage. Ecol. Lett., 3, 362–377.
Broughton, L.C. & Gross, K.L. (2000). Patterns of diversity in
plant and soil microbial communities along a productivity gra-
dient in a Michigan old-field. Oecologia, 125, 420–427.
Bruns, M.A., Stephen, J.R., Kowalchuk, G.A., Prosser, J.I. & Paul,
E.A. (1999). Comparative diversity of ammonia oxidizer 16S
rRNA gene sequences in native, tilled, and successional soils.
Appl. Environ. Microbiol., 65, 2994–3000.
Carr, M.R. (1997). PRIMER user manual (Plymouth Routines in Mul-
tivariate Ecological Research). Plymouth Marine Laboratory, Ply-
mouth, UK.
Cavigelli, M.A. & Robertson, G.P. (2000). The functional sig-
nificance of denitrifier community composition in a terrestrial
ecosystem. Ecology, 81, 1402–1414.
Chase, J.M. & Leibold, M.A. (2002). Spatial scale dictates the
productivity-biodiversity relationship. Nature, 416, 427–430.
Colwell, R.K. (1997). EstimateS: Statistical estimation of species
richness and shared species from samples. User’s guide and
application published at: http://viceroy.eeb.uconn.edu/estimates.
Devereux, R. & Willis, S.G. (1995). Amplification of ribosomal
RNA sequences. In: Molecular Microbial Ecology Manual (eds
Akkermans, A.D.L., Van Elsas, J.D. & De Bruijn, F.J.). Kluwer
Academic Publishers, Dordrecht, Netherlands.
Dodson, S.I., Arnott, S.E. & Cottingham, K.L. (2000). The
relationship in lake communities between primary productivity
and species richness. Ecology, 81, 2662–2679.
Downing, A.L. & Leibold, M.A. (2002). Ecosystem consequences
or species richness and composition in pond food webs. Nature,
25, 837–841.
Dunn, G. & Everitt, B.S. (1982). An Introduction to Mathematical
Taxonomy. Cambridge University Press, Cambridge, UK.
Fisher, M.M., Klug, J.L., Lauster, G., Newton, M. & Triplett, E.W.
(2000). Effects of resources and trophic interactions on fresh-
water bacterioplankton diversity. Microbial Ecol., 40, 125–138.
Garrity, G.M. (2001). Bergey’s manual of systematic bacteriology, 2nd edn.
Springer, New York.
Gasol, J.M. & Duarte, C.M. (2000). Comparative analyses in
aquatic microbial ecology: How far do they go? FEMS Microbiol
Ecol., 31, 99–106.
Gill, J.L. (1978). Design and Analysis of Experiments. Iowa State
University Press, Ames, IA.
Goodfellow, M. & O’Donnell, A.G. (1993). Roots of bacterial
systematics. In: Handbook of New Bacterial Systematics (eds Good-
fellow, M. & O’Donnell, A.G.). Academic Press, London,
pp. 2–54.
Gough, L., Osenberg, C.W., Gross, K.L. & Collins, S.L. (2000).
Fertilization effects on species density and primary productivity
in herbaceous plant communities. Oikos, 89, 428–439.
Gross, K.L., Willig, M.R., Gough, L., Inouye, R. & Cox, S.B. (2000).
Patterns of species density and productivity at different spatial
scales in herbaceous plant communities. Oikos, 89, 417–427.
Haddad, N.M., Haarstad, J. & Tilman, D. (2000). The effects of
long-term nitrogen loading on grassland insect communities.
Oecologia, 124, 73–84.
Hughes, J.B., Hellmann, J.J., Ricketts, T.H. & Bohannan, B.J.M.
(2001). Counting the uncountable: statistical approaches to
estimating microbial diversity. Appl. Environ. Microbiol., 67, 4399–
4406.
Jurgens, K., Pernthaler, J., Schalla, S. & Amann, R. (1999). Mor-
phological and compositional changes in a planktonic bacterial
community in response to enhanced protozoan grazing. Appl.
Environ. Microbiol., 65, 1241–1250.
Kassen, R., Buckling, A., Bell, G. & Rainey, P.B. (2000). Diversity
peaks at intermediate productivity in a laboratory microcosm.
Nature, 406, 508–512.
Kaunzinger, C.M.K. & Morin, P.J. (1998). Productivity controls
food-chain properties in microbial communities. Nature, 395,
495–497.
Bacterial diversity and primary productivity 621
Ó2003 Blackwell Publishing Ltd/CNRS
Kirchman, D.L. (2002). The ecology of Cytophaga-Flavobacteria in
aquatic enviroments. FEMS Microbiol. Ecol., 39, 91–100.
Kroes, I., Lepp, P.W. & Relman, D.A. (1999). Bacterial diversity
within the human subgingival crevice. Proceedings of the National
Academy of Sciences of the United States of America, 96, 14547–14552.
Lambou, V.W., Hern, S.C., Taylor, W.D. & Williams, L.R. (1982).
Chlorophyll, phosphorus, secchi disk, and trophic state. Wat.
Resour. Bull., 807–813.
Lebaron, P., Servais, P., Troussellier, M., Courties, C., Muyzer, G.,
Bernard, L. et al. (2001). Microbial community dynamics in
Mediterranean nutrient-enriched seawater mesocosms: changes
in abundances, activity and composition. FEMS Microbiol. Ecol.,
34, 255–266.
Leibold, M.A. (1996). A graphical model of keystone predators
in food webs: trophic regulation of abundance, incidence, and
diversity patterns in communities. Am. Natural., 147, 784–812.
Leibold, M.A. (1999). Biodiversity and nutrient enrichment in pond
plankton communities. Evolutionary Ecol. Res., 1, 73–95.
Lindstrom, E.S. (2000). Bacterioplankton community composition
in five lakes differing in trophic status and humic content.
Microbial Ecol., 40, 104–113.
Lubchenco, J., Olson, A.M., Brubaker, L.B., Carpenter, S.R.,
Holland, M.M., Hubbell, S.P. et al. (1991). The Sustainable
Biosphere Initiative: an ecological research agenda: a report from
the Ecological-Society-of-America. Ecology, 72, 371–412.
Ludwig, W. & Strunk, O. (1999). ARB: a software environment for
sequence data. Technische Universitat Munchen, Munchen,
Germany.
Magurran, A.E. (1988). Ecological Diversity and Its Measurement.
Princeton University Press, Princeton, NJ.
Maidak, B.L., Cole, J.R., Lilburn, T.G., Parker, C.T.J., Saxman,
P.R., Farris, R.J. et al. (2001). The RDP-II (Ribosomal Database
Project). Nucleic Acids Res., 29, 173–174.
Mitchell-Olds, T. & Shaw, R.G. (1997). Regression-analysis of
natural-selection: statistical-inference and biological interpreta-
tion. Evolution, 1149–1161.
Mittelbach, G.G., Steiner, C.F., Scheiner, S.M., Gross, K.L.,
Reynolds, H.L., Waide, R.B. et al. (2001). What is the observed
relationship between species richness and productivity? Ecology,
82, 2381–2396.
O’Donnell, A.G., Goodfellow, M. & Hawksworth, D.L. (1994).
Theoretical and practical aspects of the quantification of
biodiversity among microorganisms. Philosophical Transactions of
The Royal Society of London Series B – Biological Sciences, 345,
65–73.
Ovreas, L. (2000). Population and community level approaches for
analysing microbial diversity in natural environments. Ecol. Lett.,
3, 236–251.
Ovreas, L., Bourne, D., Sandaa, R.A., Casamayor, E.O., Benlloch,
S., Goddard, V. et al. (2003). Response of bacterial and viral
communities to nutrient manipulations in seawater mesocosms.
Aquatic Microbial Ecol., 31, 109–121.
Peet, R.K. & Christensen, N.L. (1988). Changes in Species Diversity
During Secondary Forest Succession on the North Carolina Piedmont.
Academic Publishing, The Hague, The Netherlands.
Pernthaler, J., Posch, T., Simek, K., Vrba, J., Amann, R. & Psenner,
R. (1997). Contrasting bacterial strategies to coexist with a
flagellate predator in an experimental microbial assemblage.
Appl. Environ. Microbiol., 63, 596–601.
Qiu, X., Wu, L., Huang, H., McDonel, P.E., Palumbo, A.V., Tiedje,
J.M. et al. (2001). Evaluation of PCR-generated chimeras,
mutations, and heteroduplexes with 16S rRNA gene-based clo-
ning. Appl. Environ. Microbiol., 67, 880–887.
Rosenzweig, M.L. (1995). Species Diversity in Space and Time. Cam-
bridge University Press, Cambridge, England.
Schafer, H., Bernard, L., Courties, C., Lebaron, P., Servais, P.,
Pukall, R. et al. (2001). Microbial community dynamics in
Mediterranean nutrient-enriched seawater mesocosms: changes
in the genetic diversity of bacterial populations. FEMS Microbiol.
Ecol., 34, 243–253.
Scheiner, S.M. & Jones, S. (2002). Diversity, productivity and scale
in Wisconsin vegetation. Evolutionary Ecol. Res., 4, 1097–1117.
Sokal, R.R. & Rohlf, F.J. (1995). Biometry: The Principles and Practice of
Statistics in Biological Research, 3rd edn. W. H. Freeman and Com-
pany, New York.
Somerville, C.C., Knight, I.T., Straube, W.L. & Colwell, R.R.
(1989). Simple, rapid method for direct isolation of nucleic acids
from aquatic environments. Appl. Environ. Microbiol., 55, 548–
554.
Speksnijder, A., Kowalchuk, G.A., De Jong, S., Kline, E., Stephen,
J.R. & Laanbroek, H.J. (2001). Microvariation artifacts intro-
duced by PCR and cloning of closely related 16S rRNA gene
sequences. Appl. Environ. Microbiol., 67, 469–472.
Stackebrandt, E. & Rainey, F.A. (1995). Partial and complete 16S
rDNA sequences, their use in generation of 16S rDNA phylo-
genetic trees and their implications in molecular ecological
studies. In: Molecular Microbial Ecology Manual (eds Akkermans,
A.D.L., Van Elsas, J.D. & De Bruijn, F.J.). Kluwer Academic
Publishers, Dordrecht, Netherlands.
Tilman, D. (1982). Resource Competition and Community Structure.
Princeton University Press, Princeton, NJ.
Tilman, D. & Pacala, S. (1993). The maintenance of species rich-
ness in plant communities. In: Species Diversity in Ecological Com-
munities: Historical and Geographical Perspectives (eds Ricklefs, R.E. &
Schluter, D. ). University of Chicago Press, Chicago, pp. 13–25.
Torsvik, V., Daae, F.L., Sandaa, R.A. & Ovreas, L. (1998). Novel
techniques for analysing microbial diversity in natural and per-
turbed environments. J. Biotechnol., 64, 53–62.
Torsvik, V., Ovreas, L. & Thingstad, T.F. (2002). Prokaryotic
diversity – magnitude, dynamics, and controlling factors. Science,
296, 1064–1065.
Waide, R.B., Willig, M.R., Steiner, C.F., Mittelbach, G., Gough, L.,
Dodson, S.I. et al. (1999). The relationship between productivity
and species richness. Annu. Rev. Ecol. Systemat., 30, 257–300.
Wilbur, H.M. (1997). Experimental ecology of food webs: complex
systems in temporary ponds. Ecology, 78, 2279–2302.
Wintzingerode, F.V., Goebel, U.B. & Stackebrandt, E. (1997).
Determination of microbial diversity in environmental samples:
pitfalls of PCR-based rRNA analysis. FEMS Microbiol. Rev., 21,
213–229.
Editor, P. J. Morin
Manuscript received 27 January 2003
First decision made 3 March 2003
Manuscript accepted 31 March 2003
622 M. C. Horner-Devine et al.
Ó2003 Blackwell Publishing Ltd/CNRS

More Related Content

What's hot

Do pitcher plants control the assembly of pitcher microbiomes?
Do pitcher plants control the assembly of pitcher microbiomes?Do pitcher plants control the assembly of pitcher microbiomes?
Do pitcher plants control the assembly of pitcher microbiomes?
Leonora Bittleston
 
ENV107 - Lecture 12
ENV107 - Lecture 12ENV107 - Lecture 12
ENV107 - Lecture 12
Md Jahirul Islam Sojib
 
Exploring the Temperate Leaf Microbiome: From Natural Forests to Controlled E...
Exploring the Temperate Leaf Microbiome: From Natural Forests to Controlled E...Exploring the Temperate Leaf Microbiome: From Natural Forests to Controlled E...
Exploring the Temperate Leaf Microbiome: From Natural Forests to Controlled E...
QIAGEN
 
SM Horizontal Gene Transfer Paper
SM Horizontal Gene Transfer PaperSM Horizontal Gene Transfer Paper
SM Horizontal Gene Transfer PaperSarah Maciorowski
 
Neodarwinism or synthetic theory of evolution
Neodarwinism or synthetic theory of evolutionNeodarwinism or synthetic theory of evolution
Neodarwinism or synthetic theory of evolution
bhavnesthakur
 
Santos et al 2013 J Gen
Santos et al 2013 J GenSantos et al 2013 J Gen
Santos et al 2013 J GenJosiane Santos
 
مشروووووع الوراثه
مشروووووع الوراثهمشروووووع الوراثه
مشروووووع الوراثه
ALaa Al-Assaf
 
Glossary Patterns Of Evolution4 Lois
Glossary Patterns Of Evolution4 LoisGlossary Patterns Of Evolution4 Lois
Glossary Patterns Of Evolution4 Lois
allyjer
 
Is microbial ecology driven by roaming genes?
Is microbial ecology driven by roaming genes?Is microbial ecology driven by roaming genes?
Is microbial ecology driven by roaming genes?
beiko
 
04 phenotypic plasticity
04 phenotypic plasticity04 phenotypic plasticity
04 phenotypic plasticity
Indranil Bhattacharjee
 
Gene sharing in microbes: good for the individual, good for the community?
Gene sharing in microbes: good for the individual, good for the community?Gene sharing in microbes: good for the individual, good for the community?
Gene sharing in microbes: good for the individual, good for the community?
beiko
 
Paper id 21201481
Paper id 21201481Paper id 21201481
Paper id 21201481IJRAT
 
the others our biased perspective
the others our biased perspectivethe others our biased perspective
the others our biased perspective
João Soares
 
Variation & evolution
Variation & evolutionVariation & evolution
Variation & evolution
Ruba Salah
 
Abstract_Xmeeting_Laux
Abstract_Xmeeting_LauxAbstract_Xmeeting_Laux
Abstract_Xmeeting_LauxMarcele Laux
 
Natural selection script and answer key
Natural selection   script and answer keyNatural selection   script and answer key
Natural selection script and answer key
Adam Simpson
 

What's hot (20)

Do pitcher plants control the assembly of pitcher microbiomes?
Do pitcher plants control the assembly of pitcher microbiomes?Do pitcher plants control the assembly of pitcher microbiomes?
Do pitcher plants control the assembly of pitcher microbiomes?
 
ENV107 - Lecture 12
ENV107 - Lecture 12ENV107 - Lecture 12
ENV107 - Lecture 12
 
Exploring the Temperate Leaf Microbiome: From Natural Forests to Controlled E...
Exploring the Temperate Leaf Microbiome: From Natural Forests to Controlled E...Exploring the Temperate Leaf Microbiome: From Natural Forests to Controlled E...
Exploring the Temperate Leaf Microbiome: From Natural Forests to Controlled E...
 
SM Horizontal Gene Transfer Paper
SM Horizontal Gene Transfer PaperSM Horizontal Gene Transfer Paper
SM Horizontal Gene Transfer Paper
 
Evolution
EvolutionEvolution
Evolution
 
REUpsoter
REUpsoterREUpsoter
REUpsoter
 
Neodarwinism or synthetic theory of evolution
Neodarwinism or synthetic theory of evolutionNeodarwinism or synthetic theory of evolution
Neodarwinism or synthetic theory of evolution
 
Santos et al 2013 J Gen
Santos et al 2013 J GenSantos et al 2013 J Gen
Santos et al 2013 J Gen
 
مشروووووع الوراثه
مشروووووع الوراثهمشروووووع الوراثه
مشروووووع الوراثه
 
Glossary Patterns Of Evolution4 Lois
Glossary Patterns Of Evolution4 LoisGlossary Patterns Of Evolution4 Lois
Glossary Patterns Of Evolution4 Lois
 
Is microbial ecology driven by roaming genes?
Is microbial ecology driven by roaming genes?Is microbial ecology driven by roaming genes?
Is microbial ecology driven by roaming genes?
 
04 phenotypic plasticity
04 phenotypic plasticity04 phenotypic plasticity
04 phenotypic plasticity
 
Gene sharing in microbes: good for the individual, good for the community?
Gene sharing in microbes: good for the individual, good for the community?Gene sharing in microbes: good for the individual, good for the community?
Gene sharing in microbes: good for the individual, good for the community?
 
Paper id 21201481
Paper id 21201481Paper id 21201481
Paper id 21201481
 
1-s2.0-S0923250811001872-main
1-s2.0-S0923250811001872-main1-s2.0-S0923250811001872-main
1-s2.0-S0923250811001872-main
 
CAMP Symposium Poster 2015
CAMP Symposium Poster 2015CAMP Symposium Poster 2015
CAMP Symposium Poster 2015
 
the others our biased perspective
the others our biased perspectivethe others our biased perspective
the others our biased perspective
 
Variation & evolution
Variation & evolutionVariation & evolution
Variation & evolution
 
Abstract_Xmeeting_Laux
Abstract_Xmeeting_LauxAbstract_Xmeeting_Laux
Abstract_Xmeeting_Laux
 
Natural selection script and answer key
Natural selection   script and answer keyNatural selection   script and answer key
Natural selection script and answer key
 

Similar to Seminário 6 horner-devineetal 2003_bacteria (1)

The body of your paper addresses all of the required components, e.docx
The body of your paper addresses all of the required components, e.docxThe body of your paper addresses all of the required components, e.docx
The body of your paper addresses all of the required components, e.docx
mehek4
 
Soil microbial diversity
Soil microbial diversitySoil microbial diversity
Soil microbial diversity
Joice Mara Zanini
 
Relationship Between Sampling Area, Sampling Size Vs...
Relationship Between Sampling Area, Sampling Size Vs...Relationship Between Sampling Area, Sampling Size Vs...
Relationship Between Sampling Area, Sampling Size Vs...
Jessica Deakin
 
LEVELS OF BIO-DIVERSITY 52,53,54 final (1).pptx
LEVELS OF BIO-DIVERSITY 52,53,54 final (1).pptxLEVELS OF BIO-DIVERSITY 52,53,54 final (1).pptx
LEVELS OF BIO-DIVERSITY 52,53,54 final (1).pptx
PushkarChidrawar
 
ficha tecnica presentación artículos 4 seminario.docx
ficha tecnica presentación artículos 4 seminario.docxficha tecnica presentación artículos 4 seminario.docx
ficha tecnica presentación artículos 4 seminario.docx
LEIDYJULIETHESCARPET
 
FOOD WEBS 31INTRODUCTIONThe classic marine food chain.docx
FOOD WEBS 31INTRODUCTIONThe classic marine food chain.docxFOOD WEBS 31INTRODUCTIONThe classic marine food chain.docx
FOOD WEBS 31INTRODUCTIONThe classic marine food chain.docx
budbarber38650
 
PGPR
PGPRPGPR
Levin Microbial Ecology Exemplifies Building Ecology
Levin Microbial Ecology Exemplifies Building EcologyLevin Microbial Ecology Exemplifies Building Ecology
Levin Microbial Ecology Exemplifies Building Ecology
hlevin
 
10.1007@978-981-13-8315-1.pdf
10.1007@978-981-13-8315-1.pdf10.1007@978-981-13-8315-1.pdf
10.1007@978-981-13-8315-1.pdf
ssuseree8731
 
Role of fungi in biomethanation process
Role of fungi in biomethanation processRole of fungi in biomethanation process
Role of fungi in biomethanation process
Dr. sreeremya S
 
Artigo para seminario de ecologia de ecossistemas
Artigo para seminario de ecologia de ecossistemasArtigo para seminario de ecologia de ecossistemas
Artigo para seminario de ecologia de ecossistemasFabiano Capato
 
Tritrophic relationships
Tritrophic relationshipsTritrophic relationships
Tritrophic relationshipsmayank_aau
 
PNAS-2013-Barr-10771-6
PNAS-2013-Barr-10771-6PNAS-2013-Barr-10771-6
PNAS-2013-Barr-10771-6Rita Auro
 
La Biodiversidad
La BiodiversidadLa Biodiversidad
Discussion of "Caterpillars lack a resident gut microbiome"
Discussion of "Caterpillars lack a resident gut microbiome"Discussion of "Caterpillars lack a resident gut microbiome"
Discussion of "Caterpillars lack a resident gut microbiome"
Jonathan Eisen
 
The measurement of biodiversity
 The measurement of biodiversity The measurement of biodiversity
The measurement of biodiversity
Muhammed sadiq
 
Wurzbacher, Grimmett, Bärlocher, 2016. Metabarcoding fungal diversity
Wurzbacher, Grimmett, Bärlocher, 2016. Metabarcoding fungal diversity Wurzbacher, Grimmett, Bärlocher, 2016. Metabarcoding fungal diversity
Wurzbacher, Grimmett, Bärlocher, 2016. Metabarcoding fungal diversity Ivan Grimmett
 
Biodiversity in Motion .docx
Biodiversity in Motion                                          .docxBiodiversity in Motion                                          .docx
Biodiversity in Motion .docx
hartrobert670
 
Pieces of the phytobiome: multitrophic and environmental influences on plant ...
Pieces of the phytobiome: multitrophic and environmental influences on plant ...Pieces of the phytobiome: multitrophic and environmental influences on plant ...
Pieces of the phytobiome: multitrophic and environmental influences on plant ...
CIAT
 

Similar to Seminário 6 horner-devineetal 2003_bacteria (1) (20)

Biofilms
BiofilmsBiofilms
Biofilms
 
The body of your paper addresses all of the required components, e.docx
The body of your paper addresses all of the required components, e.docxThe body of your paper addresses all of the required components, e.docx
The body of your paper addresses all of the required components, e.docx
 
Soil microbial diversity
Soil microbial diversitySoil microbial diversity
Soil microbial diversity
 
Relationship Between Sampling Area, Sampling Size Vs...
Relationship Between Sampling Area, Sampling Size Vs...Relationship Between Sampling Area, Sampling Size Vs...
Relationship Between Sampling Area, Sampling Size Vs...
 
LEVELS OF BIO-DIVERSITY 52,53,54 final (1).pptx
LEVELS OF BIO-DIVERSITY 52,53,54 final (1).pptxLEVELS OF BIO-DIVERSITY 52,53,54 final (1).pptx
LEVELS OF BIO-DIVERSITY 52,53,54 final (1).pptx
 
ficha tecnica presentación artículos 4 seminario.docx
ficha tecnica presentación artículos 4 seminario.docxficha tecnica presentación artículos 4 seminario.docx
ficha tecnica presentación artículos 4 seminario.docx
 
FOOD WEBS 31INTRODUCTIONThe classic marine food chain.docx
FOOD WEBS 31INTRODUCTIONThe classic marine food chain.docxFOOD WEBS 31INTRODUCTIONThe classic marine food chain.docx
FOOD WEBS 31INTRODUCTIONThe classic marine food chain.docx
 
PGPR
PGPRPGPR
PGPR
 
Levin Microbial Ecology Exemplifies Building Ecology
Levin Microbial Ecology Exemplifies Building EcologyLevin Microbial Ecology Exemplifies Building Ecology
Levin Microbial Ecology Exemplifies Building Ecology
 
10.1007@978-981-13-8315-1.pdf
10.1007@978-981-13-8315-1.pdf10.1007@978-981-13-8315-1.pdf
10.1007@978-981-13-8315-1.pdf
 
Role of fungi in biomethanation process
Role of fungi in biomethanation processRole of fungi in biomethanation process
Role of fungi in biomethanation process
 
Artigo para seminario de ecologia de ecossistemas
Artigo para seminario de ecologia de ecossistemasArtigo para seminario de ecologia de ecossistemas
Artigo para seminario de ecologia de ecossistemas
 
Tritrophic relationships
Tritrophic relationshipsTritrophic relationships
Tritrophic relationships
 
PNAS-2013-Barr-10771-6
PNAS-2013-Barr-10771-6PNAS-2013-Barr-10771-6
PNAS-2013-Barr-10771-6
 
La Biodiversidad
La BiodiversidadLa Biodiversidad
La Biodiversidad
 
Discussion of "Caterpillars lack a resident gut microbiome"
Discussion of "Caterpillars lack a resident gut microbiome"Discussion of "Caterpillars lack a resident gut microbiome"
Discussion of "Caterpillars lack a resident gut microbiome"
 
The measurement of biodiversity
 The measurement of biodiversity The measurement of biodiversity
The measurement of biodiversity
 
Wurzbacher, Grimmett, Bärlocher, 2016. Metabarcoding fungal diversity
Wurzbacher, Grimmett, Bärlocher, 2016. Metabarcoding fungal diversity Wurzbacher, Grimmett, Bärlocher, 2016. Metabarcoding fungal diversity
Wurzbacher, Grimmett, Bärlocher, 2016. Metabarcoding fungal diversity
 
Biodiversity in Motion .docx
Biodiversity in Motion                                          .docxBiodiversity in Motion                                          .docx
Biodiversity in Motion .docx
 
Pieces of the phytobiome: multitrophic and environmental influences on plant ...
Pieces of the phytobiome: multitrophic and environmental influences on plant ...Pieces of the phytobiome: multitrophic and environmental influences on plant ...
Pieces of the phytobiome: multitrophic and environmental influences on plant ...
 

More from Carlos Alberto Monteiro

Diversidade de Scolitynae (Coleoptera, Curculionidae) em Fragmentos de Flores...
Diversidade de Scolitynae (Coleoptera, Curculionidae) em Fragmentos de Flores...Diversidade de Scolitynae (Coleoptera, Curculionidae) em Fragmentos de Flores...
Diversidade de Scolitynae (Coleoptera, Curculionidae) em Fragmentos de Flores...
Carlos Alberto Monteiro
 
Revisão ARTIGO APP
Revisão ARTIGO APPRevisão ARTIGO APP
Revisão ARTIGO APP
Carlos Alberto Monteiro
 
Roteiro para elaboração de aplano RPPN
Roteiro para elaboração de aplano RPPNRoteiro para elaboração de aplano RPPN
Roteiro para elaboração de aplano RPPN
Carlos Alberto Monteiro
 
Pacto2009 restauração florestal
Pacto2009 restauração florestalPacto2009 restauração florestal
Pacto2009 restauração florestal
Carlos Alberto Monteiro
 
Dissertação sobre chuva de sementes na recuperação de áreas
Dissertação sobre chuva de sementes na recuperação de áreasDissertação sobre chuva de sementes na recuperação de áreas
Dissertação sobre chuva de sementes na recuperação de áreas
Carlos Alberto Monteiro
 
Flavio Monteiro Santos dissertação restauração
Flavio Monteiro Santos dissertação restauraçãoFlavio Monteiro Santos dissertação restauração
Flavio Monteiro Santos dissertação restauração
Carlos Alberto Monteiro
 
Resenha Crítica - Aula
Resenha Crítica - AulaResenha Crítica - Aula
Resenha Crítica - Aula
Carlos Alberto Monteiro
 
Ecossistemologia - Slides usados em aula 04/04/2016
Ecossistemologia - Slides usados em aula 04/04/2016Ecossistemologia - Slides usados em aula 04/04/2016
Ecossistemologia - Slides usados em aula 04/04/2016
Carlos Alberto Monteiro
 
Ecossistemologia Biodiversidade 2016
Ecossistemologia Biodiversidade 2016Ecossistemologia Biodiversidade 2016
Ecossistemologia Biodiversidade 2016
Carlos Alberto Monteiro
 
Fragmentos Florestais - Ecossistemologia
Fragmentos Florestais - EcossistemologiaFragmentos Florestais - Ecossistemologia
Fragmentos Florestais - Ecossistemologia
Carlos Alberto Monteiro
 
Caos em uma comunidade
Caos em uma comunidadeCaos em uma comunidade
Caos em uma comunidade
Carlos Alberto Monteiro
 
O justo e a justica politica
O justo e a justica politicaO justo e a justica politica
O justo e a justica politica
Carlos Alberto Monteiro
 
O acaso na biologia evolutiva
O acaso na biologia evolutivaO acaso na biologia evolutiva
O acaso na biologia evolutiva
Carlos Alberto Monteiro
 
General ecology
General ecologyGeneral ecology
General ecology
Carlos Alberto Monteiro
 
Design Fernanda de Souza Quintao
Design Fernanda de Souza QuintaoDesign Fernanda de Souza Quintao
Design Fernanda de Souza Quintao
Carlos Alberto Monteiro
 
Terry Eagleton - Marx e a critica literária
Terry Eagleton -  Marx e a critica literáriaTerry Eagleton -  Marx e a critica literária
Terry Eagleton - Marx e a critica literária
Carlos Alberto Monteiro
 
Dialogos - Estudos de Revisão
Dialogos - Estudos de RevisãoDialogos - Estudos de Revisão
Dialogos - Estudos de Revisão
Carlos Alberto Monteiro
 
Terry eagleton cultura
Terry eagleton   culturaTerry eagleton   cultura
Terry eagleton cultura
Carlos Alberto Monteiro
 
Reforma ortografica
Reforma ortograficaReforma ortografica
Reforma ortografica
Carlos Alberto Monteiro
 

More from Carlos Alberto Monteiro (20)

Diversidade de Scolitynae (Coleoptera, Curculionidae) em Fragmentos de Flores...
Diversidade de Scolitynae (Coleoptera, Curculionidae) em Fragmentos de Flores...Diversidade de Scolitynae (Coleoptera, Curculionidae) em Fragmentos de Flores...
Diversidade de Scolitynae (Coleoptera, Curculionidae) em Fragmentos de Flores...
 
Revisão ARTIGO APP
Revisão ARTIGO APPRevisão ARTIGO APP
Revisão ARTIGO APP
 
Roteiro para elaboração de aplano RPPN
Roteiro para elaboração de aplano RPPNRoteiro para elaboração de aplano RPPN
Roteiro para elaboração de aplano RPPN
 
Pacto2009 restauração florestal
Pacto2009 restauração florestalPacto2009 restauração florestal
Pacto2009 restauração florestal
 
Dissertação sobre chuva de sementes na recuperação de áreas
Dissertação sobre chuva de sementes na recuperação de áreasDissertação sobre chuva de sementes na recuperação de áreas
Dissertação sobre chuva de sementes na recuperação de áreas
 
Flavio Monteiro Santos dissertação restauração
Flavio Monteiro Santos dissertação restauraçãoFlavio Monteiro Santos dissertação restauração
Flavio Monteiro Santos dissertação restauração
 
Resenha Crítica - Aula
Resenha Crítica - AulaResenha Crítica - Aula
Resenha Crítica - Aula
 
Ecossistemologia - Slides usados em aula 04/04/2016
Ecossistemologia - Slides usados em aula 04/04/2016Ecossistemologia - Slides usados em aula 04/04/2016
Ecossistemologia - Slides usados em aula 04/04/2016
 
Ecossistemologia Biodiversidade 2016
Ecossistemologia Biodiversidade 2016Ecossistemologia Biodiversidade 2016
Ecossistemologia Biodiversidade 2016
 
Fragmentos Florestais - Ecossistemologia
Fragmentos Florestais - EcossistemologiaFragmentos Florestais - Ecossistemologia
Fragmentos Florestais - Ecossistemologia
 
Caos em uma comunidade
Caos em uma comunidadeCaos em uma comunidade
Caos em uma comunidade
 
O justo e a justica politica
O justo e a justica politicaO justo e a justica politica
O justo e a justica politica
 
O acaso na biologia evolutiva
O acaso na biologia evolutivaO acaso na biologia evolutiva
O acaso na biologia evolutiva
 
General ecology
General ecologyGeneral ecology
General ecology
 
Design Fernanda de Souza Quintao
Design Fernanda de Souza QuintaoDesign Fernanda de Souza Quintao
Design Fernanda de Souza Quintao
 
Causalidade e acaso
Causalidade e acasoCausalidade e acaso
Causalidade e acaso
 
Terry Eagleton - Marx e a critica literária
Terry Eagleton -  Marx e a critica literáriaTerry Eagleton -  Marx e a critica literária
Terry Eagleton - Marx e a critica literária
 
Dialogos - Estudos de Revisão
Dialogos - Estudos de RevisãoDialogos - Estudos de Revisão
Dialogos - Estudos de Revisão
 
Terry eagleton cultura
Terry eagleton   culturaTerry eagleton   cultura
Terry eagleton cultura
 
Reforma ortografica
Reforma ortograficaReforma ortografica
Reforma ortografica
 

Recently uploaded

International+e-Commerce+Platform-www.cfye-commerce.shop
International+e-Commerce+Platform-www.cfye-commerce.shopInternational+e-Commerce+Platform-www.cfye-commerce.shop
International+e-Commerce+Platform-www.cfye-commerce.shop
laozhuseo02
 
Celebrating World-environment-day-2024.pdf
Celebrating  World-environment-day-2024.pdfCelebrating  World-environment-day-2024.pdf
Celebrating World-environment-day-2024.pdf
rohankumarsinghrore1
 
growbilliontrees.com-Trees for Granddaughter (1).pdf
growbilliontrees.com-Trees for Granddaughter (1).pdfgrowbilliontrees.com-Trees for Granddaughter (1).pdf
growbilliontrees.com-Trees for Granddaughter (1).pdf
yadavakashagra
 
Q&A with the Experts: The Food Service Playbook
Q&A with the Experts: The Food Service PlaybookQ&A with the Experts: The Food Service Playbook
Q&A with the Experts: The Food Service Playbook
World Resources Institute (WRI)
 
Sustainable Rain water harvesting in india.ppt
Sustainable Rain water harvesting in india.pptSustainable Rain water harvesting in india.ppt
Sustainable Rain water harvesting in india.ppt
chaitaliambole
 
Prevalence of Toxoplasma gondii infection in domestic animals in District Ban...
Prevalence of Toxoplasma gondii infection in domestic animals in District Ban...Prevalence of Toxoplasma gondii infection in domestic animals in District Ban...
Prevalence of Toxoplasma gondii infection in domestic animals in District Ban...
Open Access Research Paper
 
一比一原版(UMTC毕业证书)明尼苏达大学双城分校毕业证如何办理
一比一原版(UMTC毕业证书)明尼苏达大学双城分校毕业证如何办理一比一原版(UMTC毕业证书)明尼苏达大学双城分校毕业证如何办理
一比一原版(UMTC毕业证书)明尼苏达大学双城分校毕业证如何办理
zm9ajxup
 
Daan Park Hydrangea flower season I like it
Daan Park Hydrangea flower season I like itDaan Park Hydrangea flower season I like it
Daan Park Hydrangea flower season I like it
a0966109726
 
alhambra case study Islamic gardens part-2.pptx
alhambra case study Islamic gardens part-2.pptxalhambra case study Islamic gardens part-2.pptx
alhambra case study Islamic gardens part-2.pptx
CECOS University Peshawar, Pakistan
 
Climate Change All over the World .pptx
Climate Change All over the World  .pptxClimate Change All over the World  .pptx
Climate Change All over the World .pptx
sairaanwer024
 
Scope of political science habaushS.pptx
Scope of political science habaushS.pptxScope of political science habaushS.pptx
Scope of political science habaushS.pptx
Ni Ca
 
"Understanding the Carbon Cycle: Processes, Human Impacts, and Strategies for...
"Understanding the Carbon Cycle: Processes, Human Impacts, and Strategies for..."Understanding the Carbon Cycle: Processes, Human Impacts, and Strategies for...
"Understanding the Carbon Cycle: Processes, Human Impacts, and Strategies for...
MMariSelvam4
 
AGRICULTURE Hydrophonic FERTILISER PPT.pptx
AGRICULTURE Hydrophonic FERTILISER PPT.pptxAGRICULTURE Hydrophonic FERTILISER PPT.pptx
AGRICULTURE Hydrophonic FERTILISER PPT.pptx
BanitaDsouza
 
Artificial Reefs by Kuddle Life Foundation - May 2024
Artificial Reefs by Kuddle Life Foundation - May 2024Artificial Reefs by Kuddle Life Foundation - May 2024
Artificial Reefs by Kuddle Life Foundation - May 2024
punit537210
 
UNDERSTANDING WHAT GREEN WASHING IS!.pdf
UNDERSTANDING WHAT GREEN WASHING IS!.pdfUNDERSTANDING WHAT GREEN WASHING IS!.pdf
UNDERSTANDING WHAT GREEN WASHING IS!.pdf
JulietMogola
 
Alert-driven Community-based Forest monitoring: A case of the Peruvian Amazon
Alert-driven Community-based Forest monitoring: A case of the Peruvian AmazonAlert-driven Community-based Forest monitoring: A case of the Peruvian Amazon
Alert-driven Community-based Forest monitoring: A case of the Peruvian Amazon
CIFOR-ICRAF
 
Navigating the complex landscape of AI governance
Navigating the complex landscape of AI governanceNavigating the complex landscape of AI governance
Navigating the complex landscape of AI governance
Piermenotti Mauro
 
Sustainable farming practices in India .pptx
Sustainable farming  practices in India .pptxSustainable farming  practices in India .pptx
Sustainable farming practices in India .pptx
chaitaliambole
 
Characterization and the Kinetics of drying at the drying oven and with micro...
Characterization and the Kinetics of drying at the drying oven and with micro...Characterization and the Kinetics of drying at the drying oven and with micro...
Characterization and the Kinetics of drying at the drying oven and with micro...
Open Access Research Paper
 
Presentación Giulio Quaggiotto-Diálogo improbable .pptx.pdf
Presentación Giulio Quaggiotto-Diálogo improbable .pptx.pdfPresentación Giulio Quaggiotto-Diálogo improbable .pptx.pdf
Presentación Giulio Quaggiotto-Diálogo improbable .pptx.pdf
Innovation and Technology for Development Centre
 

Recently uploaded (20)

International+e-Commerce+Platform-www.cfye-commerce.shop
International+e-Commerce+Platform-www.cfye-commerce.shopInternational+e-Commerce+Platform-www.cfye-commerce.shop
International+e-Commerce+Platform-www.cfye-commerce.shop
 
Celebrating World-environment-day-2024.pdf
Celebrating  World-environment-day-2024.pdfCelebrating  World-environment-day-2024.pdf
Celebrating World-environment-day-2024.pdf
 
growbilliontrees.com-Trees for Granddaughter (1).pdf
growbilliontrees.com-Trees for Granddaughter (1).pdfgrowbilliontrees.com-Trees for Granddaughter (1).pdf
growbilliontrees.com-Trees for Granddaughter (1).pdf
 
Q&A with the Experts: The Food Service Playbook
Q&A with the Experts: The Food Service PlaybookQ&A with the Experts: The Food Service Playbook
Q&A with the Experts: The Food Service Playbook
 
Sustainable Rain water harvesting in india.ppt
Sustainable Rain water harvesting in india.pptSustainable Rain water harvesting in india.ppt
Sustainable Rain water harvesting in india.ppt
 
Prevalence of Toxoplasma gondii infection in domestic animals in District Ban...
Prevalence of Toxoplasma gondii infection in domestic animals in District Ban...Prevalence of Toxoplasma gondii infection in domestic animals in District Ban...
Prevalence of Toxoplasma gondii infection in domestic animals in District Ban...
 
一比一原版(UMTC毕业证书)明尼苏达大学双城分校毕业证如何办理
一比一原版(UMTC毕业证书)明尼苏达大学双城分校毕业证如何办理一比一原版(UMTC毕业证书)明尼苏达大学双城分校毕业证如何办理
一比一原版(UMTC毕业证书)明尼苏达大学双城分校毕业证如何办理
 
Daan Park Hydrangea flower season I like it
Daan Park Hydrangea flower season I like itDaan Park Hydrangea flower season I like it
Daan Park Hydrangea flower season I like it
 
alhambra case study Islamic gardens part-2.pptx
alhambra case study Islamic gardens part-2.pptxalhambra case study Islamic gardens part-2.pptx
alhambra case study Islamic gardens part-2.pptx
 
Climate Change All over the World .pptx
Climate Change All over the World  .pptxClimate Change All over the World  .pptx
Climate Change All over the World .pptx
 
Scope of political science habaushS.pptx
Scope of political science habaushS.pptxScope of political science habaushS.pptx
Scope of political science habaushS.pptx
 
"Understanding the Carbon Cycle: Processes, Human Impacts, and Strategies for...
"Understanding the Carbon Cycle: Processes, Human Impacts, and Strategies for..."Understanding the Carbon Cycle: Processes, Human Impacts, and Strategies for...
"Understanding the Carbon Cycle: Processes, Human Impacts, and Strategies for...
 
AGRICULTURE Hydrophonic FERTILISER PPT.pptx
AGRICULTURE Hydrophonic FERTILISER PPT.pptxAGRICULTURE Hydrophonic FERTILISER PPT.pptx
AGRICULTURE Hydrophonic FERTILISER PPT.pptx
 
Artificial Reefs by Kuddle Life Foundation - May 2024
Artificial Reefs by Kuddle Life Foundation - May 2024Artificial Reefs by Kuddle Life Foundation - May 2024
Artificial Reefs by Kuddle Life Foundation - May 2024
 
UNDERSTANDING WHAT GREEN WASHING IS!.pdf
UNDERSTANDING WHAT GREEN WASHING IS!.pdfUNDERSTANDING WHAT GREEN WASHING IS!.pdf
UNDERSTANDING WHAT GREEN WASHING IS!.pdf
 
Alert-driven Community-based Forest monitoring: A case of the Peruvian Amazon
Alert-driven Community-based Forest monitoring: A case of the Peruvian AmazonAlert-driven Community-based Forest monitoring: A case of the Peruvian Amazon
Alert-driven Community-based Forest monitoring: A case of the Peruvian Amazon
 
Navigating the complex landscape of AI governance
Navigating the complex landscape of AI governanceNavigating the complex landscape of AI governance
Navigating the complex landscape of AI governance
 
Sustainable farming practices in India .pptx
Sustainable farming  practices in India .pptxSustainable farming  practices in India .pptx
Sustainable farming practices in India .pptx
 
Characterization and the Kinetics of drying at the drying oven and with micro...
Characterization and the Kinetics of drying at the drying oven and with micro...Characterization and the Kinetics of drying at the drying oven and with micro...
Characterization and the Kinetics of drying at the drying oven and with micro...
 
Presentación Giulio Quaggiotto-Diálogo improbable .pptx.pdf
Presentación Giulio Quaggiotto-Diálogo improbable .pptx.pdfPresentación Giulio Quaggiotto-Diálogo improbable .pptx.pdf
Presentación Giulio Quaggiotto-Diálogo improbable .pptx.pdf
 

Seminário 6 horner-devineetal 2003_bacteria (1)

  • 1. REPORT Bacterial diversity patterns along a gradient of primary productivity M. Claire Horner-Devine1 *, Mathew A. Leibold2 , Val H. Smith3 and Brendan J. M. Bohannan1 1 Department of Biological Sciences, Stanford University, Stanford, CA 94305, USA 2 Department of Ecology and Evolution, University of Chicago, Chicago, IL 6063, USA 3 Department of Ecology and Evolutionary Biology, University of Kansas, Lawrence, KS 6604, USA *Correspondence: E-mail: mcdevine@stanford.edu Abstract Primary productivity is a key determinant of biodiversity patterns in plants and animals but has not previously been shown to affect bacterial diversity. We examined the relationship between productivity and bacterial richness in aquatic mesocosms designed to mimic small ponds. We observed that productivity could influence the composition and richness of bacterial communities. We showed that, even within the same system, different bacterial taxonomic groups could exhibit different responses to changes in productivity. The richness of members of the Cytophaga-Flavobacteria-Bacteroides group exhibited a significant hump-shaped relationship with productivity, as is often observed for plant and animal richness in aquatic systems. In contrast, we observed a significant U-shaped relationship between richness and productivity for a-proteobacteria and no discernable relationship for b-proteobacteria. We show, for the first time, that bacterial diversity varies along a gradient of primary productivity and thus make an important step towards understanding processes responsible for the maintenance of bacterial biodiversity. Keywords Bacterial diversity, biodiversity, community composition, eutrophication, freshwater ecology, microbial ecology, primary productivity, ribosomal DNA, taxonomic diversity. Ecology Letters (2003) 6: 613–622 IN T ROD U CTI ON A primary goal of ecology is to understand the distribution of organisms. Investigating patterns of biodiversity is a crucial step towards achieving this goal (Lubchenco et al. 1991). While many factors likely affect the biodiversity of a region, primary productivity (the rate of energy capture and carbon fixation by primary producers) is emerging as a key determinant of plant and animal biodiversity, especially species richness (i.e. the number of species present; Rosenzweig 1995; Mittelbach et al. 2001). However, it is unknown how, or even if, bacterial diversity varies with primary productivity. Understanding patterns of bacterial diversity is of particular importance because bacteria may well comprise the majority of the earth’s biodiversity and they mediate critical ecosystem processes (Cavigelli & Robertson 2000; Torsvik et al. 2002). The relationship between productivity and diversity has been of long-standing interest to ecologists. Many studies of plants and animals have reported a hump-shaped relationship between productivity and diversity, where diversity peaks at intermediate productivity (Rosenzweig 1995; Leibold 1999; Dodson et al. 2000; Mittelbach et al. 2001). Other studies have reported a monotonic increase of diversity with productivity, a decrease, a U-shaped relationship or no discernible pattern (Abrams 1995; Mittelbach et al. 2001). Variation in observed productivity–diversity patterns may result both from differences in study design and differential responses of organisms at various spatial and temporal scales (Mittelbach et al. 2001). For example, the geographical scale (e.g. local vs. regional) and ecological scale (e.g. within vs. among communities) of studies often influences patterns even within the same taxonomic group (Waide et al. 1999; Gross et al. 2000). It is also possible that some studies lump taxa or guilds that differ in their responses to productivity and thus mask patterns at different taxonomic scales (e.g. Haddad et al. 2000; Torsvik et al. 2002). In addition, our understanding of productivity–diversity relationships is influenced strongly by particular well-studied taxonomic groups such as terrestrial plants and, therefore, may be biased by these taxa (Mittelbach et al. 2001). Other taxa (especially microorganisms) remain relatively unstudied. Our ignorance regarding patterns of bacterial diversity is primarily due to significant theoretical and practical problems Ecology Letters, (2003) 6: 613–622 Ó2003 Blackwell Publishing Ltd/CNRS
  • 2. that have, until recently, hindered the quantification of bacterial diversity. These problems include the very small proportion of microbial species that can be cultured (Amann et al. 1995), the very large number of individuals that may be present per sample, the high diversity that may be present at a small scale and the difficulty of defining a microbial species (Goodfellow & O’Donnell 1993). However, solutions to many of these problems have recently been developed (O’Donnell et al. 1994; Ovreas 2000; Hughes et al. 2001). For example, a number of techniques have been developed that assess bacterial diversity without requiring growth. The most promising of these techniques use ribosomal gene sequences (obtained from DNA isolated from the environ- ment) as the indicators of bacterial phylogenetic richness (O’Donnell et al. 1994; Stackebrandt & Rainey 1995). Evidence from laboratory studies suggests that produc- tivity may influence microbial diversity, and such studies offer insight into possible mechanisms responsible for observed productivity–diversity relationships (Kaunzinger & Morin 1998; Bohannan & Lenski 2000; Kassen et al. 2000). For example, Kassen et al. (2000) found that bacterial diversity peaked at intermediate productivity in heterogene- ous lab microcosms. They suggested that this was likely due to niche specialization in a heterogeneous environment. This work, however, considered only strains of one bacterial species and, like most terrestrial plant studies, contained only one trophic level. In contrast, Kaunzinger & Morin (1998) used multi-trophic level laboratory microcosms comprised of aquatic bacteria and protists, to demonstrate that increasing productivity resulted in increased food chain length. Furthermore, they observed that food chain length determined the numerical response of a given trophic level to productivity; for example, bacteria increased in abun- dance in response to productivity only in food chains with an odd number of trophic levels. Finally, Bohannan & Lenski (2000) observed that increasing productivity resulted in an increase in the relative importance of competition (ÔÔbottom–upÕÕ effects) and predation (ÔÔtop–downÕÕ effects) as determinants of bacterial community composition in laboratory microcosms. At low productivity levels, superior competitors were favoured, while at high levels of produc- tivity more predator-resistant types were favoured. These observations are consistent with the keystone-predation model (Leibold 1996), which predicts a unimodal relation- ship between productivity and diversity. Observations from several field studies suggest that increased nutrients (and associated increased primary productivity) can alter bacterial community composition (Broughton & Gross 2000; Fisher et al. 2000; Lindstrom 2000; Schafer et al. 2001; Ovreas et al. 2003). For example, Fisher et al. (2000) assessed the composition of microbial communities in aquatic mesocosms that varied in nutrient inputs. They observed that community composition, assessed by using length heterogeneities in the intergenic region between 16S and 23S ribosomal genes, changed in response to additions of nitrogen and phosphorous. We know of only three field studies that have attempted to document the relationship between primary productivity and bacterial diversity (Benlloch et al. 1995; Torsvik et al. 1998; Schafer et al. 2001). Over a period of 13 days, Schafer et al. (2001) found that nutrient addition first decreased bacterial diversity (measured as the number of DNA derived DGGE bands). A subsequent increase in the abundance of protists, and thus possible increased grazing, was accom- panied by increased bacterial diversity. In the post-grazing stage, bacterial diversity once again decreased. These results suggest that both bottom–up and top–down processes might control bacterial diversity. They also observed that community composition varied with nutrient addition. Benlloch et al. (1995) used the richness of 16S rDNA sequences as an estimate of bacterial diversity in two coastal lagoons that differed in primary productivity. They observed a greater number of unique ribosomal gene sequences in the more productive lagoon than in the less productive lagoon, suggesting that bacterial richness may increase with primary productivity. In addition, the sample from the more productive lagoon contained individuals related to 10 major phylogenetic groups while the less productive lagoon contained representatives from only five. However, due to the time and effort necessary to clone and sequence, only 50 clones per lagoon were assessed, and 70% of these clones were unique. This suggests that the lagoons were likely very undersampled (Benlloch et al. 1995; Hughes et al. 2001). Torsvik et al. (1998) observed that pristine aquatic sediments had much higher prokaryotic diversity than sediments below fish farms (which receive a substantial input of nutrients via fish feed), suggesting that increased nutrients may decrease diversity. In all three studies discussed above, only two productivity levels were sampled, and thus the authors could not differentiate between a linear and quadratic trend. To determine the relationship between both bacterial and algal richness and primary productivity, we estimated bacterial taxonomic richness along a gradient of primary productivity in freshwater mesocosms. Small ponds and, similarly, mesocosms that mimic small ponds have proven to be excellent model systems with which to study productivity–diversity relationships (Wilbur 1997; Leibold 1999; Chase & Leibold 2002; Downing & Leibold 2002). In particular, small, fishless ponds represent a relatively simple natural system comprised of viruses, bacteria, algae and zooplankton. Productivity is easily manipulated via the addition of inorganic nutrients, and eukaryotic organisms in such systems tend to have short generation times and thus can respond quickly to such manipulations. In addition, substances (such as humic acids) that interfere with 614 M. C. Horner-Devine et al. Ó2003 Blackwell Publishing Ltd/CNRS
  • 3. molecular techniques used to estimate bacterial diversity are usually found in low concentrations. Both natural ponds (e.g. Dodson et al. 2000; Leibold 1999) and mesocosm studies (e.g. Leibold unpublished) have shown unimodal relationships between primary productivity and richness of planktonic plants. We manipulated the primary productivity of aquatic mesocosms by altering the input of inorganic nutrients. We used culture-independent techniques coupled with statistical extrapolation methods to estimate bacterial taxonomic richness as a measure of bacterial diversity in the water column of mesocosms that varied in primary productivity. We compare these bacterial results with patterns observed for algal richness from the same system. Our results suggest that, like algal richness, bacterial richness can vary with primary productivity and that the nature of this relationship may vary among taxonomic groups of bacteria. M A T ER I A L A N D ME T H O D S Mesocosms We established 16 mesocosms at the Kellogg Biological Station (KBS) in southern Michigan as part of a larger experiment to assess the relationships among productivity, diversity and food web structure. Each mesocosm consis- ted of a 2 m-diameter polyethylene cattle tank with a screen cover, filled with well water. Mesocosms were evenly spaced in a random block design in a field at KBS (Downing & Leibold 2002). Each mesocosm was inocu- lated from the same pooled sample collected from six ponds in southern Michigan that spanned a natural gradient in primary productivity. The samples were filtered through a 30 lm mesh and flushed with CO2 to kill macro-zooplankton. A gradient of primary productivity was established across the mesocosms by maintaining otherwise identical mesocosms with different input con- centrations of nitrogen and phosphorus. Four levels of nutrient input were used: high (27 · baseline), intermediate (9 · baseline and 3 · baseline) and low (1 · baseline) with four replicates at each level. We added sand to each mesocosm as a bottom substrate and maintained a constant water level by adding nutrient-poor well water when necessary. Although microorganisms could enter the mesocosms through the well water or through the air, we have no reason to believe that microbes from these sources differentially colonized the mesocosms. The mesocosms were sampled at the end of the 4-month summer growing season. Fourteen samples were collected from the water column of each mesocosm, from just below the pond surface and to a depth of one foot. To minimize sampling effects due to spatial heterogeneity within the mesocosms, samples were pooled to form one large sample for each mesocosm. Replicate subsamples were taken from the pooled sample for analysis. Productivity and nutrients We estimated primary productivity as chlorophyll a. Chlorophyll a has been shown to be a highly significant correlate of primary productivity in aquatic systems (Lam- bou et al. 1982) and especially in aquatic mesocosms (Downing & Leibold 2002). Samples from 16 mesocosms were analysed for total nitrogen, phosphorous and chlorophyll a within an hour of sampling. We measured chlorophyll a using fluorometric methods, and total nitrogen and phosphorous using spectrophotometry after persulfate digestion at the end of the growing season. Algae Algal richness was determined morphologically to genus by microscopic inspection of subsamples preserved in 5% gluteraldehyde immediately after sampling. We examined similarity in algal composition among ponds by calculating Jaccard similarity coefficients for each pair of ponds (Magurran 1988). The Jaccard index is the ratio of species or unique types shared by two sites to the total number of species or types in the two sites combined. We then used a multidimensional scaling algorithm (MDS with a Kruskal loss function, SYSTAT 8.0, Chicago, IL, USA) to reveal clustering by treatment. We tested the significance of this clustering with a two-way analysis of similarity (ANOSIM; Carr 1997). ANOSIM is a permutation-based test, i.e. an analogue of the commonly used univariate ANOVA, and tests for differences between groups of multivariate samples from different treatments. Bacteria In order to maximize the proportion of bacterial diversity represented in our samples, we chose to sample intensively a subset of five of 16 mesocosms for bacterial diversity. The five mesocosms were selected to represent the range of primary productivity available. These five samples represent, to date, the largest collection of bacterial sequences ever sampled along an environmental gradient (760 individual sequences) and thus offer a fuller picture of bacterial diversity than currently exists. Of these mesocosms, two received low inputs of nitrogen and phosphorus, one received intermediate inputs, and two received high. Bacter- ial abundance was determined by direct microbial counts of DAPI (4¢,6-Diamidino-2-phenylindole) stained subsamples preserved in 5% gluteraldehyde immediately after sampling. Samples for bacterial richness analysis were pre-filtered through a 45 lm filter and then concentrated on a 0.2 lm Bacterial diversity and primary productivity 615 Ó2003 Blackwell Publishing Ltd/CNRS
  • 4. cylindrical filter (Somerville et al. 1989). We flushed the filters with SET buffer and stored them at )20 °C until analysis. Extraction, amplification, cloning and sequencing of bacterial rDNA We used cloning and sequencing of 16S rDNA to assess bacterial richness in the five mesocosms. Community DNA was extracted from the concentrated cells using a combi- nation of chemical lysis and physical disruption (cycles of freezing and thawing). Bacterial rDNA was amplified using the PCR, with primer sequences corresponding to Escherichia coli nucleotides 1392–1406 (1392r) and 8–26 (8f). This primer set is known to amplify only sequences within the domain Bacteria (Amann et al. 1995). Twenty PCR cycles were used, with each cycle consisting of 30 s at 94 °C, 30 s at 57 °C, and 90 s at 72 °C. The amplicons were ligated into plasmid pCR2.1 and cloned using the TOPO-TA cloning system (Invitrogen, Carlsbad, CA, USA). We used an ABI 377 automated DNA sequencer to determine the sequence of the 5¢ terminal 500 nucleotides of 760 of the cloned rDNA amplicons (Stackebrandt & Rainey 1995). PCR-based methods for assessing bacterial diversity are less biased than culture-based techniques, but potential sources of bias remain (Wintzingerode et al. 1997; Speksnij- der et al. 2001). We selected PCR conditions to reduce these potential biases. For example, we limited the PCR to 20 cycles, we used DMSO in our PCR reactions to reduce biases due to GC content, and we pooled five replicate PCR reactions prior to cloning (Devereux & Willis 1995; Stackebrandt & Rainey 1995; Qiu et al. 2001; Speksnijder et al. 2001). In addition, we minimized changes in the relative abundance of bacteria in the samples by chilling immediately after sampling and storing the samples at )20 °C within an hour of sampling. We also used both chemical lysis and physical disruption to extract nucleic acids from a broad array of possible cell types. Phylogenetic analysis of rDNA We used the RDP database (Maidak et al. 2001) and ARB software (Ludwig & Strunk 1999) to initially align the rDNA sequences from our five clone libraries. Ambiguously and incorrectly aligned positions were aligned manually based on conserved primary sequence and secondary structure. We identified and excluded potential chimeras by using the Chimera_Check program (Maidak et al. 2001) and by using ARB to create and compare trees generated from the 5¢-end vs. the 3¢-end sequences separated at the break point suggested by Chimera_Check. We repeated this process for a break point in the middle of the sequence. Clones were identified as chimeric if their two ends showed affiliation with different reference species. Similarity matrices were generated using 334–450 unam- biguously aligned positions. We used the Felsenstein correction and the neighbor joining method to build a phylogenetic tree using the ARB software program (Ludwig & Strunk 1999). We grouped sequences into operational taxonomic units (OTUs) based on rDNA sequence similarity (Stackebrandt & Rainey 1995). There is no common standard for defining operational taxonomic units (OTUs) based on rDNA sequences. Therefore we used the three most commonly used definitions to group our sequences into OTUs: 95% sequence similarity (Speksnijder et al. 2001), 97% sequence similarity (Stackebrandt & Rainey 1995) and 99% sequence similarity (Kroes et al. 1999). When it was not possible to separate sequences into OTUs unambiguously, we used complete-linkage clustering to resolve the OTUs, starting with the largest group of most closely related sequences (Dunn & Everitt 1982). Bacterial diversity estimation We used OTU richness as our estimate of bacterial phylogenetic richness. OTU richness was estimated via extrapolation from observed OTU richness patterns using the Chao1 approach (Hughes et al. 2001). These calculations were performed using EstimateS software (Colwell 1997). In addition to richness, we examined similarity in bacterial composition among mesocosms in two ways. First, we used the Jaccard index to examine clustering in OTU composi- tion (as described above for algae). Second, we used a Mantel test (MANTEL 2.0) to test whether the composition of algae and bacteria were correlated by determining the significance between similarity matrices for the two groups (Sokal & Rohlf 1995). We tested the correlation between Jaccard similarity coefficients for bacteria and algae for pairs of ponds to examine similarity in species turnover or associations among algal and bacterial types. We used the RDP (Maidak et al. 2001) and Bergey’s Manual of System- atic Bacteriology (Garrity 2001) to determine the putative taxonomic affiliation of each clone. We focused additional analyses on the three most commonly observed taxo- nomic groups in our study: the Cytophaga-Flavobacterium- Bacteroides (CFB) group, the a-proteobacteria, and the b-proteobacteria. Statistical analysis We used a generalized linear model and quadratic regression models (GLM regression, SYSTAT 8.0) to examine the relationship between productivity and richness (Mittelbach et al. 2001). Values were log-transformed when necessary. We applied the test of Mitchell-Olds and Shaw (hereafter, MOS test; Mitchell-Olds & Shaw 1997; Leibold 1999; Mittelbach et al. 2001) to determine if a curvilinear 616 M. C. Horner-Devine et al. Ó2003 Blackwell Publishing Ltd/CNRS
  • 5. Table 2 The effect of productivity on bacterial richness. GLM results in conjunction with the test of Mitchell-Olds and Shaw (1997) show that a-proteobacterial richness exhibits a unimodal relationship with productivity as measured by chlorophyll a. CFB richness shows a significant U-shaped relationship with productivity. Abbreviations are as in Table 1 Coeff. SE (Coeff.) t P Multiple r2 d.f. a-proteobacteria Overall linear model 0.469 0.186 1 Constant 4.966 9.828 0.505 0.648 Prod 4.255 5.146 0.827 0.469 Overall quadratic model 0.090 0.910 2 Constant 88.308 21.091 4.187 0.053 Prod )87.409 22.873 )3.821 0.062 Prod2 24.123 5.994 4.024 0.057 Prod* < Prodmax 4.420 0.048 Prod* < Prodmin )3.466 0.074 CFBs Overall linear model 0.712 0.052 1 Constant 17.838 11.372 1.569 0.215 Prod )2.413 5.954 )0.405 0.712 Overall quadratic model 0.095 0.905 2 Constant )79.118 23.311 )3.394 0.077 Prod 104.224 25.282 4.123 0.054 Prod2 )28.064 6.626 )4.236 0.051 Prod* < Prodmax )4.361 0.049 Prod* < Prodmin 3.894 0.060 b-proteobacteria Overall model 0.172 0.515 1 Constant 12.023 3.500 3.435 0.041 Prod )3.271 1.832 )1.785 0.172 Table 1 The effect of productivity on algal and bacterial richness. GLM results in conjunction with the test of Mitchell-Olds and Shaw (1997) show that algal richness exhibits a unimodal trend with productivity as measured by chlorophyll a. Overall bacterial richness does not show a significant relationship with productivity Coeff. SE (Coeff.) t P Multiple r2 d.f. Algae Overall linear model 0.136 0.152 1 Constant 24.763 6.528 3.793 0.002 Prod )5.737 3.622 )1.584 0.136 Overall quadratic model 0.079 0.323 2 Constant )25.156 28.228 )0.891 0.389 Prod 51.262 31.661 3.483 1.619 Prod2 )15.450 8.534 )1.811 0.093 Prod* < Prodmax )2.209 0.046 Prod* < Prodmin 1.283 0.222 Overall bacteria Overall linear model 0.190 0.487 1 Constant 26.497 17.387 1.524 0.225 Prod 15.371 9.104 1.688 0.190 Abbreviations: Prod ¼ Log chlorophyll a, Prod* ¼ observed Log chlorophyll a, Coeff. ¼ regression coefficient of each term, SE (Coeff.) ¼ standard error of the coefficient, t ¼ value of the t-test, P ¼ probability value for each term and d.f. ¼ degrees of freedom for the overall model. Also shown are P-values for the MOS-test of the hypothesis that the function maximum or minimum is located at productivity levels less than the greatest (Prod* < Prodmax) and greater than the least (Prod* < Prodmin) observed productivity level. Significant terms for both denote an internal minimum or maximum. The MOS test for algae shows that the internal maximum is significantly less than the observed maximum productivity. We are less confident that an extreme minimum value of productivity does not possess maximum species richness. Thus we characterize the productivity–diversity relationship for algae only as a unimodal trend. Bacterial diversity and primary productivity 617 Ó2003 Blackwell Publishing Ltd/CNRS
  • 6. relationship reaches a maximum or minimum with the observed range of productivities. Curvilinear relationships that show an internal maximum or minimum are considered unimodal or U-shaped, respectively. Values for the MOS test are reported in Tables 1 and 2. Due to the constraints inherent in sampling and analysing bacterial richness, the number of mesocosms sampled was low (5), thus limiting statistical power. We assumed a priori a 10% probability of Type I error in our statistical analyses (as discussed by Gill 1978), rather than the more common assumption of 5%. We thus deemed relationships as significant trends if P £ 0.10. R E S U L T S Increasing inorganic nutrients increased primary productiv- ity, estimated as chlorophyll a, as anticipated. In addition, bacterial abundance increased with increasing primary productivity (r2 ¼ 0.709, P ¼ 0.07; Fig. 1). The 760 bacterial 16S sequences sampled grouped into 150 OTUs, using the broadest OTU definition (95% similarity). Almost half the OTUs were singletons (n ¼ 74), and 15 OTUS were represented by more than 10 sequences. The most abundant OTU across all mesocosms contained 112 clones and was most similar to a member of the b-proteobacteria belonging to the family Alcaligenaceae. The number of OTUs and the number of singletons tended to increase as the OTU definition was narrowed. Both bacterial and algal taxonomic composition differed according to productivity level (ANOSIM: P ¼ 0.067 for both; Fig. 2). Algal composition was more similar between pairs of high and low productivity ponds than it was between the intermediate productivity pond and others. All three productivity levels clustered independently for bacteria. Mantel tests showed that pairs of sites that were similar for algae were also similar for b-proteobacteria (r ¼ 0.73, 100 permutations, P < 0.025) but not for CFBs (r ¼ 0.42, 100 permutations, P > 0.10) or a-proteobacteria (r ¼ 0.18, 100 permutations, P > 0.10). Overall bacterial and algal richness exhibited different trends with productivity. Algal richness exhibited a hump- shaped trend with increasing productivity (r2 ¼ 0.323, P ¼ 0.079; Fig. 3a, Table 1). In contrast, overall bacterial richness showed no trend with increasing productivity (r2 ¼ 0.487, P ¼ 0.190, Fig. 3b, Table 1), although bacterial richness did decrease significantly with increasing algal richness (r2 ¼ 0.713, P ¼ 0.072). Changing the OTU definition from 95% similarity to 97 or 99% did not qualitatively alter these results. Our estimates of overall bacterial richness included sequences from many different phylogenetic groups. Log chlorophyll a Abundance(millions) 25 20 15 10 5 0 1.2 1.4 1.6 1.8 2.0 2.2 2.4 2.6 Figure 1 Total bacterial abundance increased with primary pro- ductivity (r2 ¼ 0.709, P ¼ 0.07). 1.5 1 0.5 0 0.5 1 1.5 1 0.5 0 0.5 1 1.5 (a) Algae Dimension2 (b) Bacteria 1.5 1 0.5 0 0.5 1 1.5 Dimension2 1 0.5 0 0.5 1 1.5 Dimension 1 Figure 2 The relationship between species composition and nutrient input level for both (a) algae and (b) bacteria. These multidimensional scaling algorithm plots show values of Jaccard similarity coefficients among productivity levels. Distance between two points is inversely proportional to the Jaccard similarity value for a given pair such that sites positioned close together share more species than sites further apart. The triangle represents the intermediate productivity mesocosm, the squares represent the high productivity mesocosms, and the circles represent the low productivity treatments. Both algal and bacterial composition differs significantly with primary productivity (ANOSIM, P ¼ 0.067 for both). 618 M. C. Horner-Devine et al. Ó2003 Blackwell Publishing Ltd/CNRS
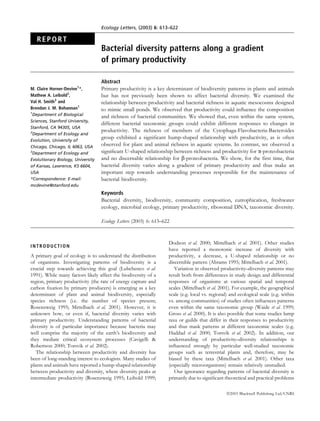
  • 7. Combining diverse groups can potentially mask patterns pre- sent in individual groups (Peet & Christensen 1988; Haddad et al. 2000). In an attempt to increase the resolution of our analysis, we reanalysed our data, focusing on the three most numerically dominant taxonomic groups in our sample: the CFB group (representing 20.1% of sequences sampled), the a-proteobacteria (29.9%), and the b-proteobacteria (29.7%). We observed that these three groups exhibited very different responses to primary productivity (Fig. 4, Table 2). a-pro- teobacterial richness exhibited a significant U-shaped relationship with productivity (r2 ¼ 0.91, P ¼ 0.09), and CFB richness exhibited a significant hump-shaped relation- ship with productivity (r2 ¼ 0.90, P ¼ 0.095). In contrast, b-proteobacterial richness showed no discernable response to increasing productivity (r2 ¼ 0.533, P ¼ 0.172). Again, changing the OTU definition from 95 to 97 or 99% did not qualitatively alter these relationships. D I SCU S S I O N We observed that bacterial abundance increased with increasing primary productivity in our system, as reported in studies of other aquatic systems (Kaunzinger & Morin 1998, and reviewed in Gasol & Duarte 2000). These observations suggest that, despite the presence of bacter- iovores, top–down effects are, in general, less important than bottom–up effects in determining the overall abun- dance of bacteria in aquatic systems. Previous studies also observed an effect of primary productivity or nutrient status on bacterial community composition (e.g. Broughton & Gross 2000; Fisher et al. 2000; Lindstrom 2000; Schafer et al. 2001; Ovreas et al. 2003). Our results are consistent with these observations. The communities at each productivity level were more similar to each other in species composition than to communities at either of the other two productivity levels. Furthermore, we found a statistical association between particular b-proteobac- teria and algae but not between algae and other bacterial types. Bacterial and algal diversity had different responses to primary productivity. Our observation that algal diversity exhibited a hump-shaped relationship with increasing productivity is consistent with observations in other aquatic ecosystems (e.g. Leibold 1999; Waide et al. 1999; Dodson et al. 2000; Mittelbach et al. 2001; Chase & Leibold 2002). In contrast, overall bacterial richness showed no trend. However, when we examined the most common taxonomic groups within the broad group of bacteria sampled by our methods, we found that different taxonomic groups of bacteria exhibited different responses to changes in primary 1.2 1.4 1.6 1.8 2.0 2.2 2.4 2.6 Log chlorophyll a 1.2 1.4 1.6 1.8 2.0 2.2 2.4 2.6 Bacterialrichness (b) Bacteria 75 70 65 60 55 50 45 (a) Algae 30 25 20 15 10 5 0 Algalrichness Figure 3 The relationship between primary productivity and taxonomic richness. (a) Algal richness and primary productivity. Large symbols represent mesocosms sampled for bacteria across a productivity gradient. Algal richness exhibits a unimodal trend with productivity (r2 ¼ 0.323, P ¼ 0.079). (b) Overall bacterial richness and primary productivity. There is no significant trend between bacterial richness and productivity (r2 ¼ 0.487, P ¼ 0.190). Log chlorophyll a 1.2 1.4 1.6 1.8 2.0 2.2 2.4 2.6 20 18 16 14 12 10 8 6 4 2 0 Estimatedrichness CFB β proteo α proteo Figure 4 Richness of three major groups of bacteria and primary productivity. a-proteobacterial richness exhibited a significant U-shaped relationship with productivity (r2 ¼ 0.91, P ¼ 0.090). CFB richness has a unimodal relationship with productivity (r2 ¼ 0.905, P ¼ 0.095), and b-proteobacterial richness shows no discernible response to increasing productivity (r2 ¼ 0.515, P ¼ 0.172). Bacterial diversity and primary productivity 619 Ó2003 Blackwell Publishing Ltd/CNRS
  • 8. productivity. The CFBs exhibited a hump-shaped relation- ship, the a-proteobacteria exhibited a U-shaped relation- ship, and the b-proteobacteria showed no relationship between primary productivity and richness. Due to the high richness of these systems, it was necessary to sample a subset of five mesocosms intensively rather than sample additional mesocosms less thoroughly. This limited number of mesocosms, of course, limits statistical power. As the P values for the trends we report range between 0.05 and 0.1, our results may be viewed more as suggestive than definitive. Regardless, to our knowledge these are the first observations that suggest that significant nonlinear relationships between bacterial richness and primary productivity may exist, and that these relationships may vary by taxonomic group. Further studies are necessary to demonstrate the generality of these patterns. The CFBs, b-proteobacteria and a-proteobacteria are broad taxonomic groups that each includes members with very different metabolic lifestyles. It is thus remarkable that significant patterns in richness would be evident at this taxonomic scale. However, others have reported shifts in the relative abundances of these three groups in response to environmental change. For example, changes in the relative abundances of these three groups has been observed in response to increased predation (e.g. Jurgens et al. 1999) and increased inorganic nutrients (e.g. Lebaron et al. 2001). There is also evidence for differences at this taxonomic level in important ecological traits. For example, a-proteobacteria and b-proteobacteria have been observed to respond to predation differently (Pernthaler et al. 1997). Differences in competitive ability for resources have also been observed; for example, members of the CFB group are distinctive in their ability to degrade high molecular weight polymers, although they can degrade low molecular weight com- pounds with reduced efficiency (Kirchman 2002). Ecolog- ical traits such as these (i.e. response to predators and competitive ability for resources) have been suggested as underlying the relationships between diversity and produc- tivity in plants and animals (e.g. Leibold 1996) and could be responsible for the patterns we observed for bacteria as well. The hump shaped relationship observed for algae and CFBs has also been observed for a number of other taxa. This relationship appears to be especially common in plant and animal studies that sample diversity across communities (as opposed to within a single community) and studies that use plant biomass as a measure of primary productivity (Mittelbach et al. 2001). It is also the predominant pattern observed in aquatic communities (Dodson et al. 2000; Mittelbach et al. 2001). Explaining this pattern has been the focus of a growing body of theory (e.g. Tilman 1982; Abrams 1995; Rosenzweig 1995; Leibold 1999). For example, theory predicts that hump-shaped relationships between productivity and diversity can result from trade- offs between competitive ability and resistance to predators (Leibold 1999), trade-offs between competitive ability for nitrogen and for phosphorus (Tilman 1982), from changes in the spatial distribution of resources that occur as productivity increases, and from a number of other ecological processes (reviewed in Rosenzweig 1995). Fre- quent observations of hump-shaped patterns have led some to claim that this is the ÔÔtrueÕÕ or most fundamental relationship between productivity and diversity (e.g. Tilman & Pacala 1993; Rosenzweig 1995). However, recent surveys have demonstrated that other patterns occur commonly as well, although they are not as well studied or understood as hump-shaped relationships (Waide et al. 1999; Mittelbach et al. 2001). Our observations of bacteria are consistent with these surveys; significant hump-shaped patterns were observed for algae and the CFB group of bacteria, but not for a- or b-proteobacteria. The U-shaped relationship exhibited by the a-proteo- bacteria in our study has also been observed in other taxa and systems. A recent review of 171 published studies found that U-shaped relationships comprised 36% of the data with quadratic responses to productivity (Mittelbach et al. 2001). However, to our knowledge, there is currently no theory proposed to explain a U-shaped pattern (but see Scheiner & Jones 2002). It is possible that competition between a-proteobacteria and CFBs might result in the observed respective U-shaped and hump-shaped patterns. It would be possible to assess this hypothesis in future work by measuring the concentration of different resources (i.e. different carbon sources) as well as predation intensity due to both viral and protistan grazers. Our results also have implications for understanding how aquatic systems respond to anthropogenic additions of nitrogen and phosphorous (eutrophication). Inputs of nitrogen and phosphorous, the growth limiting nutrients for most aquatic primary producers, have increased in aquatic systems due to such sources as domestic and industrial wastes, and runoff from fertilized agricultural areas. This anthropogenic influx of nutrients often results in a decrease in plant and animal species diversity (Gough et al. 2000). The response of bacteria to eutrophication may be of particular importance as bacteria play significant roles in biogeochemical cycling (Torsvik et al. 2002). As suggested here, eutrophication could have a significant influence on bacterial taxonomic composition and richness, and changes in composition and richness have been shown to result in differences in the rates and controls of biogeochemical processes in some studies (Bruns et al. 1999; Cavigelli & Robertson 2000). Finally, perhaps the most fundamental biotic attribute of a region, ecosystem or community is the number of species it supports. While many factors are likely to affect species richness in a region, the supply of available energy (the 620 M. C. Horner-Devine et al. Ó2003 Blackwell Publishing Ltd/CNRS
  • 9. primary productivity of a region) has emerged as a major determinant of observed variation in species richness (Rosenzweig 1995). Our study is consistent with this observation. Using culture-independent molecular methods to characterize bacterial richness, we observed that overall bacterial richness did not have a significant relationship with primary productivity. However, when the three numerically dominant taxonomic groups of bacteria were analysed separately, patterns emerged. Understanding observed variation in productivity-richness relationships is central to understanding the underlying mechanisms responsible for the generation and maintenance of biodiversity; such an effort is in progress for plants and animals (Mittelbach et al. 2001) and is an important goal for future work on microorganisms. AC KNOWL E DGEMENTS The authors are grateful to Adrian Barbrook, Joel Mefford, and the staff of the Stanford Genome Technology Center (especially Nancy Federspiel and Chris Webb) for technical assistance. This work benefited from the insight and technical assistance of the staff of the Center for Microbial Ecology, especially Terry Marsh and James Tiedje, and the Kellogg Biological Station, especially Sandy Marsh and Michael Klug. The authors are also grateful to Michael Hochberg, Peter Morin, Gary Mittlebach and three anony- mous reviewers for helpful comments on a previous draft of this manuscript. This work was funded by National Science Foundation grants to BB (DEB9907797 and DEB0108556), ML and VS (DEB9816192). REFE R E NC E S Abrams, P.A. (1995). Monotonic or unimodal diversity-produc- tivity gradients: what does competition theory predict? Ecology, 76, 2019–2027. Amann, R.I., Ludwig, W., Schleifer, K.H., Torsvik, V.L. & Gok- soyr, J. (1995). Phylogenetic identification and in-situ detection of individual microbial-cells without cultivation. Microbiolog. Rev., 59, 143–169. Benlloch, S., Rodriguez-Valera, F. & Martinez-Murcia, A.J. (1995). Bacterial diversity in two coastal lagoons deduced from 16S rDNA PCR amplification and partial sequencing. FEMS Micro- biol. Ecol., 18, 267–279. Bohannan, B.J.M. & Lenski, R.E. (2000). Linking genetic change to community evolution: insights from studies of bacteria and bacteriophage. Ecol. Lett., 3, 362–377. Broughton, L.C. & Gross, K.L. (2000). Patterns of diversity in plant and soil microbial communities along a productivity gra- dient in a Michigan old-field. Oecologia, 125, 420–427. Bruns, M.A., Stephen, J.R., Kowalchuk, G.A., Prosser, J.I. & Paul, E.A. (1999). Comparative diversity of ammonia oxidizer 16S rRNA gene sequences in native, tilled, and successional soils. Appl. Environ. Microbiol., 65, 2994–3000. Carr, M.R. (1997). PRIMER user manual (Plymouth Routines in Mul- tivariate Ecological Research). Plymouth Marine Laboratory, Ply- mouth, UK. Cavigelli, M.A. & Robertson, G.P. (2000). The functional sig- nificance of denitrifier community composition in a terrestrial ecosystem. Ecology, 81, 1402–1414. Chase, J.M. & Leibold, M.A. (2002). Spatial scale dictates the productivity-biodiversity relationship. Nature, 416, 427–430. Colwell, R.K. (1997). EstimateS: Statistical estimation of species richness and shared species from samples. User’s guide and application published at: http://viceroy.eeb.uconn.edu/estimates. Devereux, R. & Willis, S.G. (1995). Amplification of ribosomal RNA sequences. In: Molecular Microbial Ecology Manual (eds Akkermans, A.D.L., Van Elsas, J.D. & De Bruijn, F.J.). Kluwer Academic Publishers, Dordrecht, Netherlands. Dodson, S.I., Arnott, S.E. & Cottingham, K.L. (2000). The relationship in lake communities between primary productivity and species richness. Ecology, 81, 2662–2679. Downing, A.L. & Leibold, M.A. (2002). Ecosystem consequences or species richness and composition in pond food webs. Nature, 25, 837–841. Dunn, G. & Everitt, B.S. (1982). An Introduction to Mathematical Taxonomy. Cambridge University Press, Cambridge, UK. Fisher, M.M., Klug, J.L., Lauster, G., Newton, M. & Triplett, E.W. (2000). Effects of resources and trophic interactions on fresh- water bacterioplankton diversity. Microbial Ecol., 40, 125–138. Garrity, G.M. (2001). Bergey’s manual of systematic bacteriology, 2nd edn. Springer, New York. Gasol, J.M. & Duarte, C.M. (2000). Comparative analyses in aquatic microbial ecology: How far do they go? FEMS Microbiol Ecol., 31, 99–106. Gill, J.L. (1978). Design and Analysis of Experiments. Iowa State University Press, Ames, IA. Goodfellow, M. & O’Donnell, A.G. (1993). Roots of bacterial systematics. In: Handbook of New Bacterial Systematics (eds Good- fellow, M. & O’Donnell, A.G.). Academic Press, London, pp. 2–54. Gough, L., Osenberg, C.W., Gross, K.L. & Collins, S.L. (2000). Fertilization effects on species density and primary productivity in herbaceous plant communities. Oikos, 89, 428–439. Gross, K.L., Willig, M.R., Gough, L., Inouye, R. & Cox, S.B. (2000). Patterns of species density and productivity at different spatial scales in herbaceous plant communities. Oikos, 89, 417–427. Haddad, N.M., Haarstad, J. & Tilman, D. (2000). The effects of long-term nitrogen loading on grassland insect communities. Oecologia, 124, 73–84. Hughes, J.B., Hellmann, J.J., Ricketts, T.H. & Bohannan, B.J.M. (2001). Counting the uncountable: statistical approaches to estimating microbial diversity. Appl. Environ. Microbiol., 67, 4399– 4406. Jurgens, K., Pernthaler, J., Schalla, S. & Amann, R. (1999). Mor- phological and compositional changes in a planktonic bacterial community in response to enhanced protozoan grazing. Appl. Environ. Microbiol., 65, 1241–1250. Kassen, R., Buckling, A., Bell, G. & Rainey, P.B. (2000). Diversity peaks at intermediate productivity in a laboratory microcosm. Nature, 406, 508–512. Kaunzinger, C.M.K. & Morin, P.J. (1998). Productivity controls food-chain properties in microbial communities. Nature, 395, 495–497. Bacterial diversity and primary productivity 621 Ó2003 Blackwell Publishing Ltd/CNRS
  • 10. Kirchman, D.L. (2002). The ecology of Cytophaga-Flavobacteria in aquatic enviroments. FEMS Microbiol. Ecol., 39, 91–100. Kroes, I., Lepp, P.W. & Relman, D.A. (1999). Bacterial diversity within the human subgingival crevice. Proceedings of the National Academy of Sciences of the United States of America, 96, 14547–14552. Lambou, V.W., Hern, S.C., Taylor, W.D. & Williams, L.R. (1982). Chlorophyll, phosphorus, secchi disk, and trophic state. Wat. Resour. Bull., 807–813. Lebaron, P., Servais, P., Troussellier, M., Courties, C., Muyzer, G., Bernard, L. et al. (2001). Microbial community dynamics in Mediterranean nutrient-enriched seawater mesocosms: changes in abundances, activity and composition. FEMS Microbiol. Ecol., 34, 255–266. Leibold, M.A. (1996). A graphical model of keystone predators in food webs: trophic regulation of abundance, incidence, and diversity patterns in communities. Am. Natural., 147, 784–812. Leibold, M.A. (1999). Biodiversity and nutrient enrichment in pond plankton communities. Evolutionary Ecol. Res., 1, 73–95. Lindstrom, E.S. (2000). Bacterioplankton community composition in five lakes differing in trophic status and humic content. Microbial Ecol., 40, 104–113. Lubchenco, J., Olson, A.M., Brubaker, L.B., Carpenter, S.R., Holland, M.M., Hubbell, S.P. et al. (1991). The Sustainable Biosphere Initiative: an ecological research agenda: a report from the Ecological-Society-of-America. Ecology, 72, 371–412. Ludwig, W. & Strunk, O. (1999). ARB: a software environment for sequence data. Technische Universitat Munchen, Munchen, Germany. Magurran, A.E. (1988). Ecological Diversity and Its Measurement. Princeton University Press, Princeton, NJ. Maidak, B.L., Cole, J.R., Lilburn, T.G., Parker, C.T.J., Saxman, P.R., Farris, R.J. et al. (2001). The RDP-II (Ribosomal Database Project). Nucleic Acids Res., 29, 173–174. Mitchell-Olds, T. & Shaw, R.G. (1997). Regression-analysis of natural-selection: statistical-inference and biological interpreta- tion. Evolution, 1149–1161. Mittelbach, G.G., Steiner, C.F., Scheiner, S.M., Gross, K.L., Reynolds, H.L., Waide, R.B. et al. (2001). What is the observed relationship between species richness and productivity? Ecology, 82, 2381–2396. O’Donnell, A.G., Goodfellow, M. & Hawksworth, D.L. (1994). Theoretical and practical aspects of the quantification of biodiversity among microorganisms. Philosophical Transactions of The Royal Society of London Series B – Biological Sciences, 345, 65–73. Ovreas, L. (2000). Population and community level approaches for analysing microbial diversity in natural environments. Ecol. Lett., 3, 236–251. Ovreas, L., Bourne, D., Sandaa, R.A., Casamayor, E.O., Benlloch, S., Goddard, V. et al. (2003). Response of bacterial and viral communities to nutrient manipulations in seawater mesocosms. Aquatic Microbial Ecol., 31, 109–121. Peet, R.K. & Christensen, N.L. (1988). Changes in Species Diversity During Secondary Forest Succession on the North Carolina Piedmont. Academic Publishing, The Hague, The Netherlands. Pernthaler, J., Posch, T., Simek, K., Vrba, J., Amann, R. & Psenner, R. (1997). Contrasting bacterial strategies to coexist with a flagellate predator in an experimental microbial assemblage. Appl. Environ. Microbiol., 63, 596–601. Qiu, X., Wu, L., Huang, H., McDonel, P.E., Palumbo, A.V., Tiedje, J.M. et al. (2001). Evaluation of PCR-generated chimeras, mutations, and heteroduplexes with 16S rRNA gene-based clo- ning. Appl. Environ. Microbiol., 67, 880–887. Rosenzweig, M.L. (1995). Species Diversity in Space and Time. Cam- bridge University Press, Cambridge, England. Schafer, H., Bernard, L., Courties, C., Lebaron, P., Servais, P., Pukall, R. et al. (2001). Microbial community dynamics in Mediterranean nutrient-enriched seawater mesocosms: changes in the genetic diversity of bacterial populations. FEMS Microbiol. Ecol., 34, 243–253. Scheiner, S.M. & Jones, S. (2002). Diversity, productivity and scale in Wisconsin vegetation. Evolutionary Ecol. Res., 4, 1097–1117. Sokal, R.R. & Rohlf, F.J. (1995). Biometry: The Principles and Practice of Statistics in Biological Research, 3rd edn. W. H. Freeman and Com- pany, New York. Somerville, C.C., Knight, I.T., Straube, W.L. & Colwell, R.R. (1989). Simple, rapid method for direct isolation of nucleic acids from aquatic environments. Appl. Environ. Microbiol., 55, 548– 554. Speksnijder, A., Kowalchuk, G.A., De Jong, S., Kline, E., Stephen, J.R. & Laanbroek, H.J. (2001). Microvariation artifacts intro- duced by PCR and cloning of closely related 16S rRNA gene sequences. Appl. Environ. Microbiol., 67, 469–472. Stackebrandt, E. & Rainey, F.A. (1995). Partial and complete 16S rDNA sequences, their use in generation of 16S rDNA phylo- genetic trees and their implications in molecular ecological studies. In: Molecular Microbial Ecology Manual (eds Akkermans, A.D.L., Van Elsas, J.D. & De Bruijn, F.J.). Kluwer Academic Publishers, Dordrecht, Netherlands. Tilman, D. (1982). Resource Competition and Community Structure. Princeton University Press, Princeton, NJ. Tilman, D. & Pacala, S. (1993). The maintenance of species rich- ness in plant communities. In: Species Diversity in Ecological Com- munities: Historical and Geographical Perspectives (eds Ricklefs, R.E. & Schluter, D. ). University of Chicago Press, Chicago, pp. 13–25. Torsvik, V., Daae, F.L., Sandaa, R.A. & Ovreas, L. (1998). Novel techniques for analysing microbial diversity in natural and per- turbed environments. J. Biotechnol., 64, 53–62. Torsvik, V., Ovreas, L. & Thingstad, T.F. (2002). Prokaryotic diversity – magnitude, dynamics, and controlling factors. Science, 296, 1064–1065. Waide, R.B., Willig, M.R., Steiner, C.F., Mittelbach, G., Gough, L., Dodson, S.I. et al. (1999). The relationship between productivity and species richness. Annu. Rev. Ecol. Systemat., 30, 257–300. Wilbur, H.M. (1997). Experimental ecology of food webs: complex systems in temporary ponds. Ecology, 78, 2279–2302. Wintzingerode, F.V., Goebel, U.B. & Stackebrandt, E. (1997). Determination of microbial diversity in environmental samples: pitfalls of PCR-based rRNA analysis. FEMS Microbiol. Rev., 21, 213–229. Editor, P. J. Morin Manuscript received 27 January 2003 First decision made 3 March 2003 Manuscript accepted 31 March 2003 622 M. C. Horner-Devine et al. Ó2003 Blackwell Publishing Ltd/CNRS