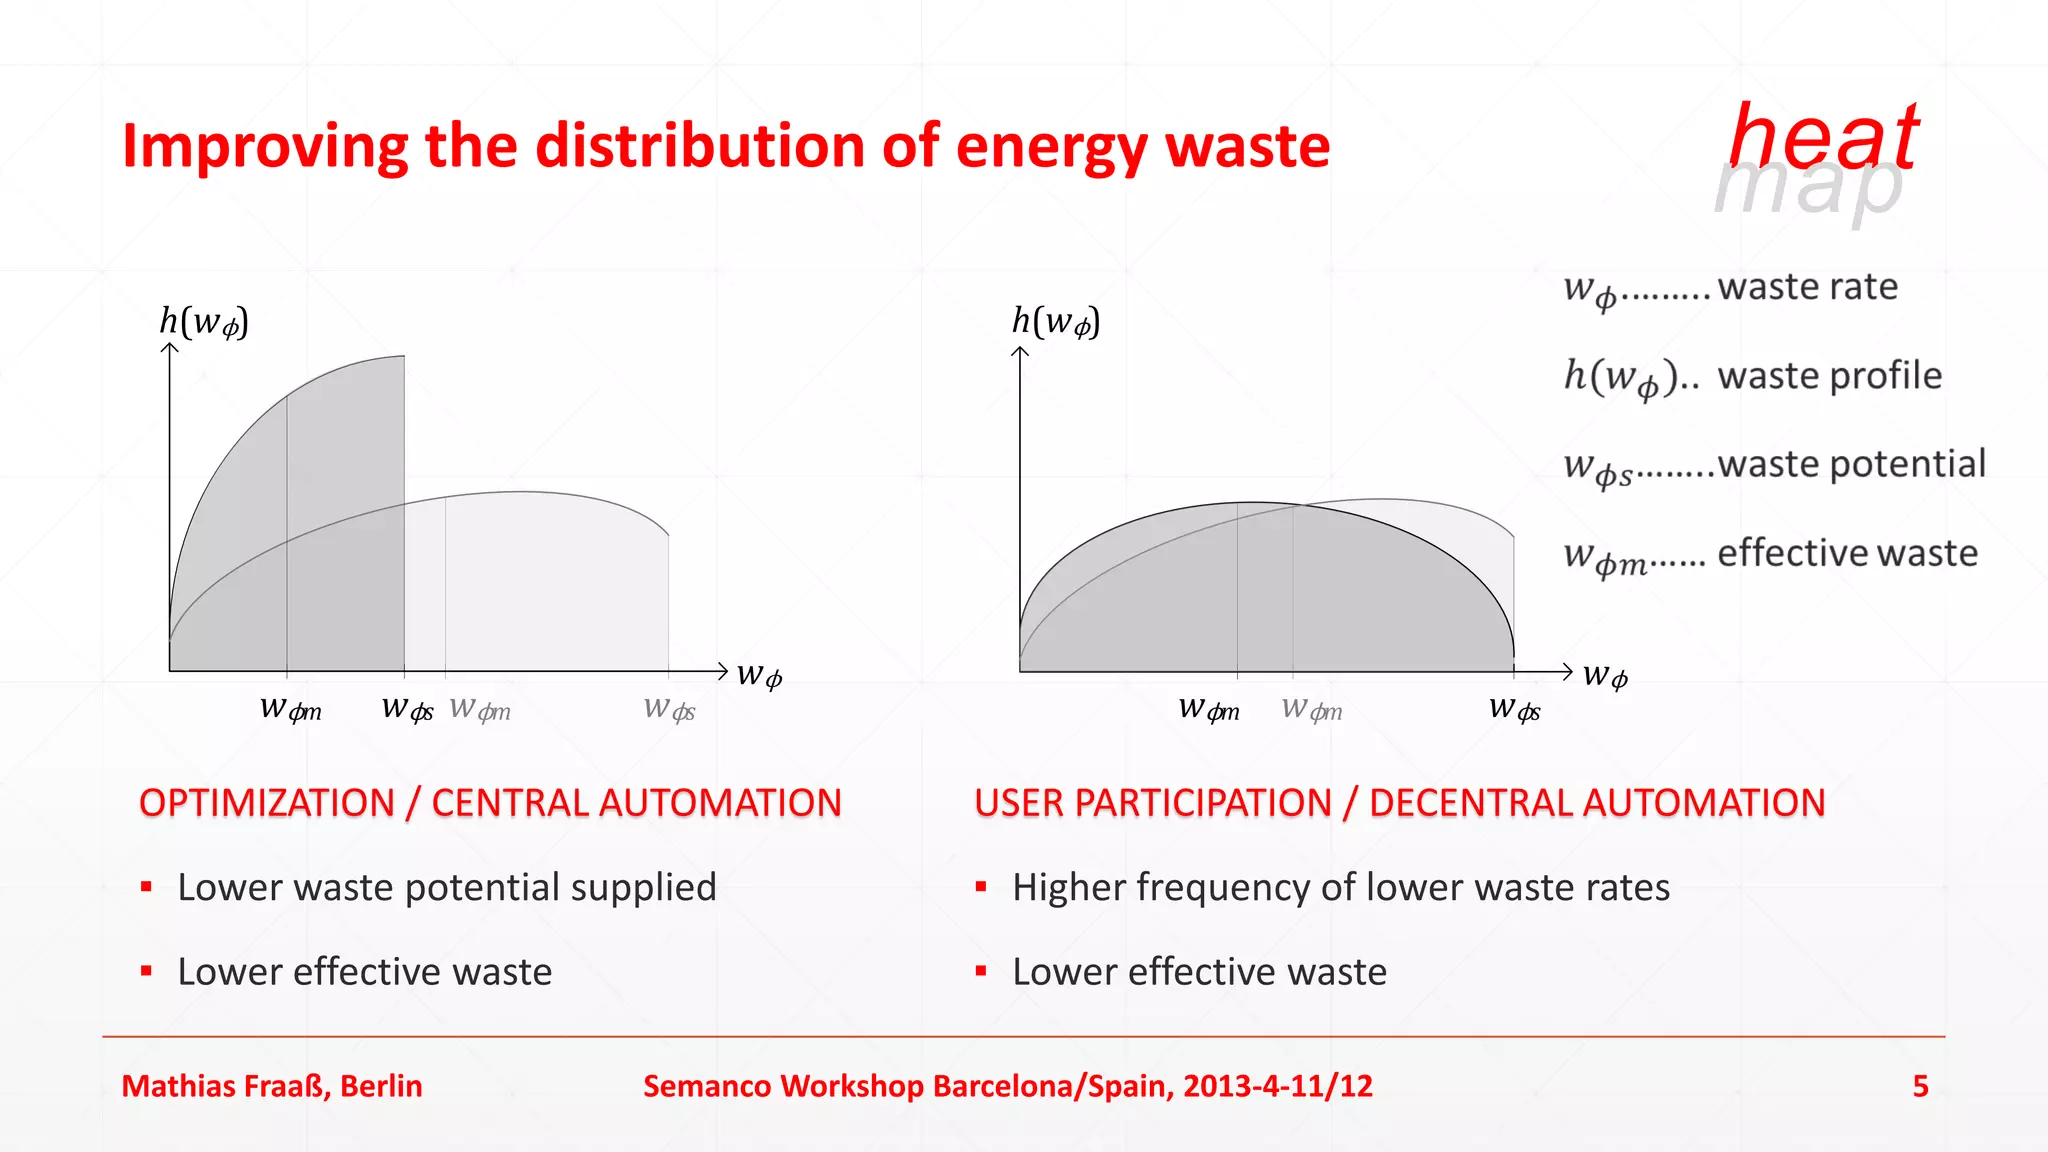
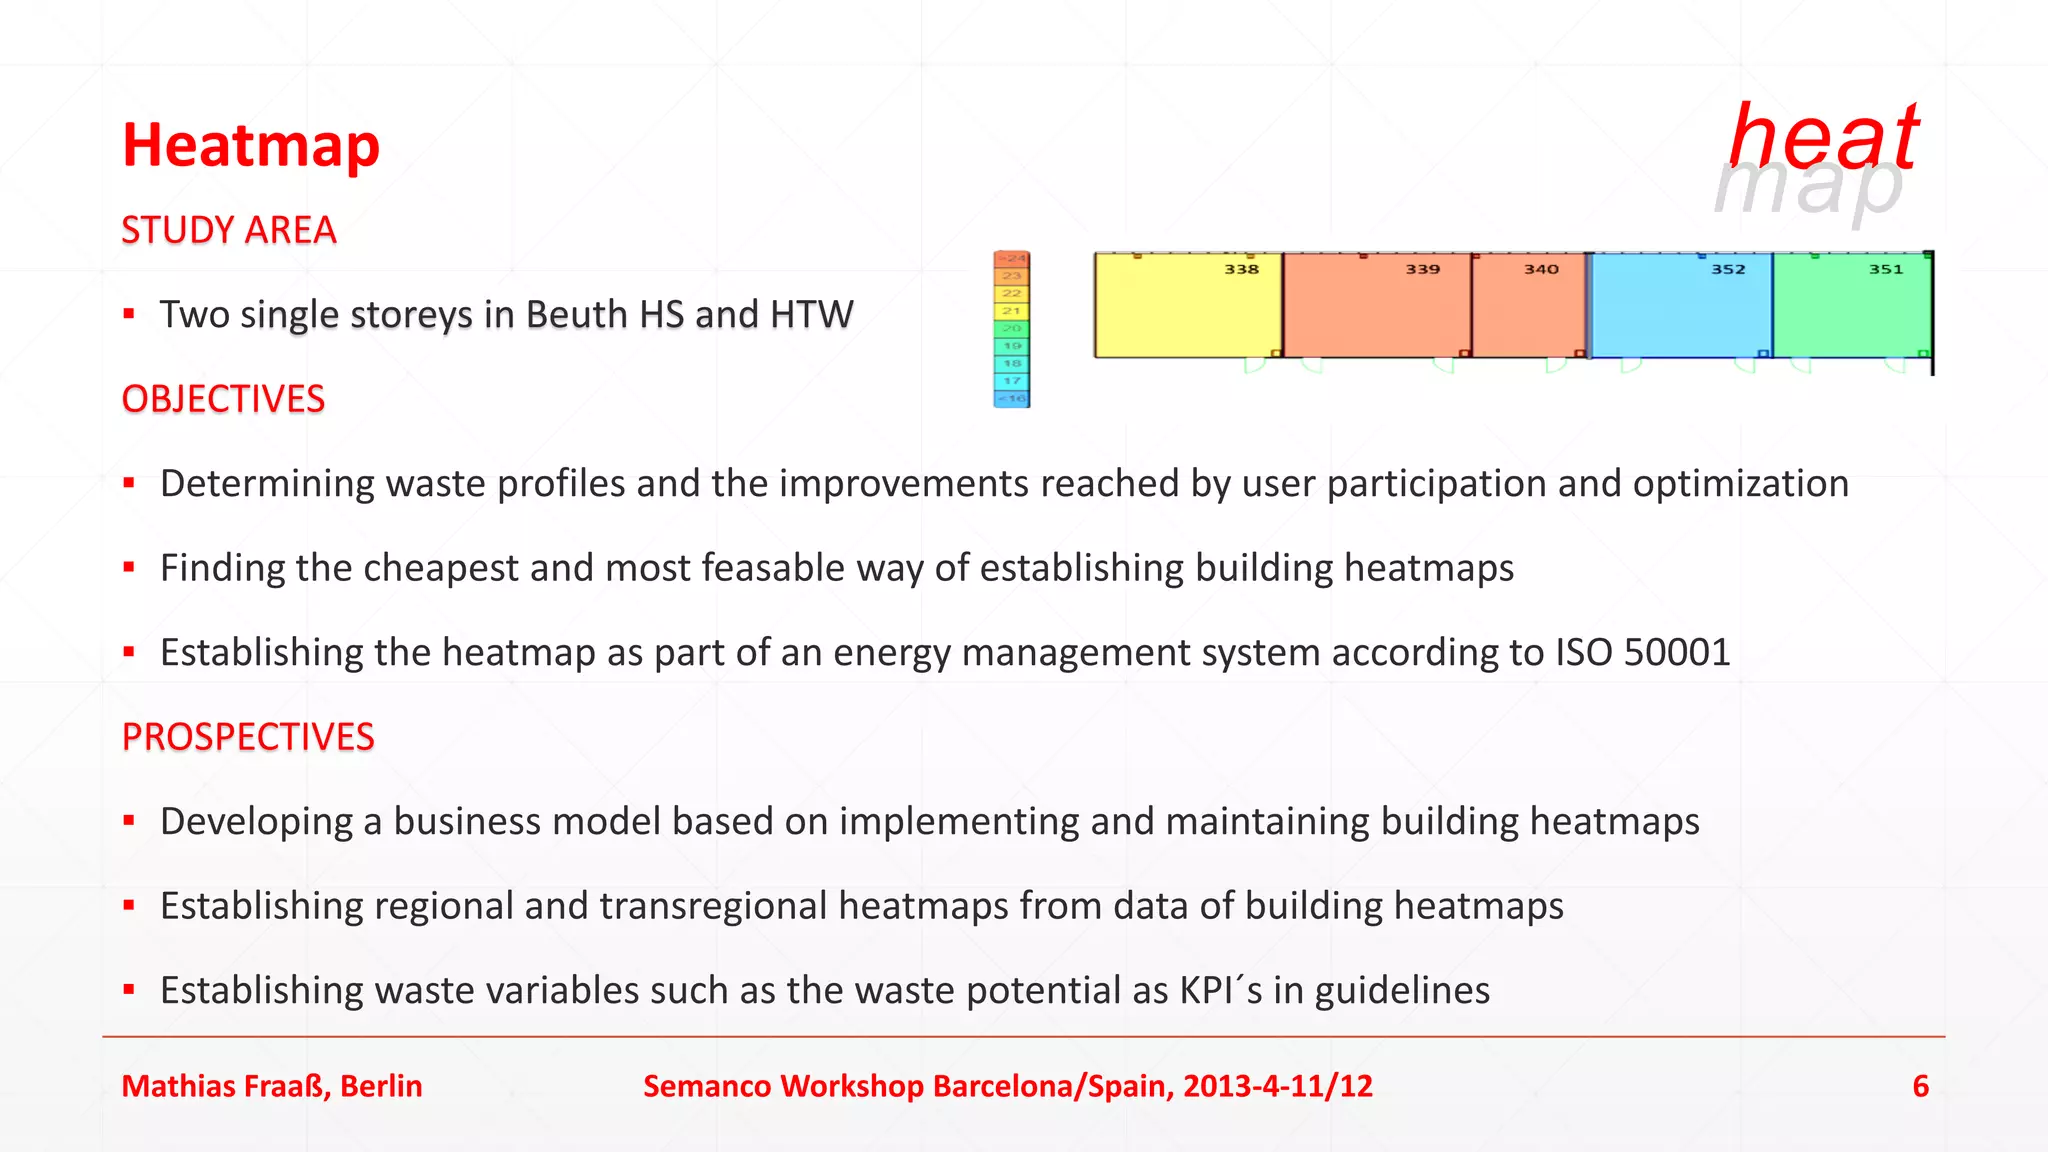
SEMANCO Workshop: Analysing and Visualising energy related data in our buildings, towns, and cities.
http://semanco-visualization-workshop.blogspot.com.es/
La Salle Campus Barcelona, Spain, 11-12 April 2013.
Bajaj Allianz Life Insurance Company - Insurer Innovation Award 2024
Semanco workshop Theme3 - Heatmap
1. Beuth Hochschule Hochschule für Technik Deos Inhouse Engineering Royal Institute of Technical Research
Berlin und Wirtschaft, Berlin Rheine/Berlin Berlin Technology Stockholm Center, Helsinki
THEMATIC LINE 1: URBAN ENERGY DATA
▪ Sourcing energy data from consumers
▪ Energy performance indicators
THEMATIC LINE 2: INTERACTIVE INTERFACES
▪ Visualizing energy data
▪ Developing tools and platforms
HeatMap THEMATIC LINE 3: BUSINESS MODELS
▪ Strategies for CO2 reduction
Visualizing Waste of Heating Energy
▪ Business models
Semanco Workshop Barcelona/Spain, 2013-4-11/12 Mathias Fraaß, Berlin
2. Energy savings in bad insulated buildings heat
map
ENERGY CONSUMPTION IN BUILDINGS
15 % electric, 85 % thermal energy
Germany: ≈ 30% of PE consumption in room heating
Transportations
Buildings
31% DISTRIBUTION OF BUILDINGS (GERMANY)
41%
≈ 20 % with good, 80 % with bad insulation standard
Industrial Sector SAVINGS IN BAD INSULATED BUILDINGS
28%
≈ 20 % average saving by optimization (Optimus 2004)
> 30 % savings by performance contractings
Distribution of Site Energy EU 2010 (BDH)
Mathias Fraaß, Berlin Semanco Workshop Barcelona/Spain, 2013-4-11/12 2
3. Theoretical savings after optimization heat
map
Qg Qs Qd Qce
(generation) (storage) (distribution) (control and emission)
Primary
Energy Heating Energy QH (Site Energy) Heating Energy Demand Qh
QP
Change of air β0
Temperature ti0
OPTMIZATION MEASUREMENTS THEORETICAL SAVINGS
▪ Adjustment of hydraulic balance including radiators (red. Qg + red. Qs + red. Qd + red. Qce) / QP
▪ Adjustment of supply temperature characteristic < 5% in bad insulated buildings (high Qh)
Mathias Fraaß, Berlin Semanco Workshop Barcelona/Spain, 2013-4-11/12 3
4. Practical savings after optimization heat
map
Qg0 + ΔQg Qs0 + ΔQs Qd0 + ΔQd Qce0 + ΔQce
Primär-
energie Heizenergie QH (Endenergie)
Qp
QP0 QH0
Qh0
ΔQP ΔQH
ΔQh
β0 + Δβ
ti0 + Δti
REAL LIVE SITUATION PRACTICAL SAVINGS
▪ Overheated rooms due to inappropriate set points red. ΔQP / (QP0 + ΔQP )
▪ Additional losses due to window opening 20..35 % in public buildings
Mathias Fraaß, Berlin Semanco Workshop Barcelona/Spain, 2013-4-11/12 4
5. Improving the distribution of energy waste heat
map
h(wϕ) h(wϕ)
wϕ wϕ
wϕm wϕs wϕm wϕs wϕm wϕm wϕs
OPTIMIZATION / CENTRAL AUTOMATION USER PARTICIPATION / DECENTRAL AUTOMATION
▪ Lower waste potential supplied ▪ Higher frequency of lower waste rates
▪ Lower effective waste ▪ Lower effective waste
Mathias Fraaß, Berlin Semanco Workshop Barcelona/Spain, 2013-4-11/12 5
6. Heatmap heat
map
STUDY AREA
▪ Two single storeys in Beuth HS and HTW
OBJECTIVES
▪ Determining waste profiles and the improvements reached by user participation and optimization
▪ Finding the cheapest and most feasable way of establishing building heatmaps
▪ Establishing the heatmap as part of an energy management system according to ISO 50001
PROSPECTIVES
▪ Developing a business model based on implementing and maintaining building heatmaps
▪ Establishing regional and transregional heatmaps from data of building heatmaps
▪ Establishing waste variables such as the waste potential as KPI´s in guidelines
Mathias Fraaß, Berlin Semanco Workshop Barcelona/Spain, 2013-4-11/12 6