The document discusses selection bias and its correction methods using linear probability models (LPM), focusing on two popular approaches: two-step methods and matching methods. It contrasts Heckman and Olsen's methodologies, highlighting their strengths and weaknesses for both continuous and binary outcomes. Additionally, it presents simulation studies and outlines ongoing research questions regarding sample size and model consistency.


![Two step methods: Heckman vs Olsen
Stage 1:
Selection
model (T)
Adjustment
Stage 2:
Outcome
model (Y)
𝐸[𝑇|𝑋] = Φ(𝑋𝛾) 𝐼𝑀𝑅 =
𝜙(𝑋𝛾)
Φ(𝑋𝛾) 𝑌 = 𝑋𝜷 + 𝛿 𝐼𝑀𝑅 + 𝜀
Heckman
(1977)
𝐸[𝑇|𝑋] = 𝑋𝛾 𝜆 = 𝑋𝛾 − 1 𝑌 = 𝑋𝜷 + 𝛿 𝜆 + 𝜀
Olsen
(1980)
Probit
LPM](https://image.slidesharecdn.com/dmdaselectionbiaswithlpm1-161115102649/75/Selection-Bias-with-Linear-Probability-Models-7-2048.jpg)


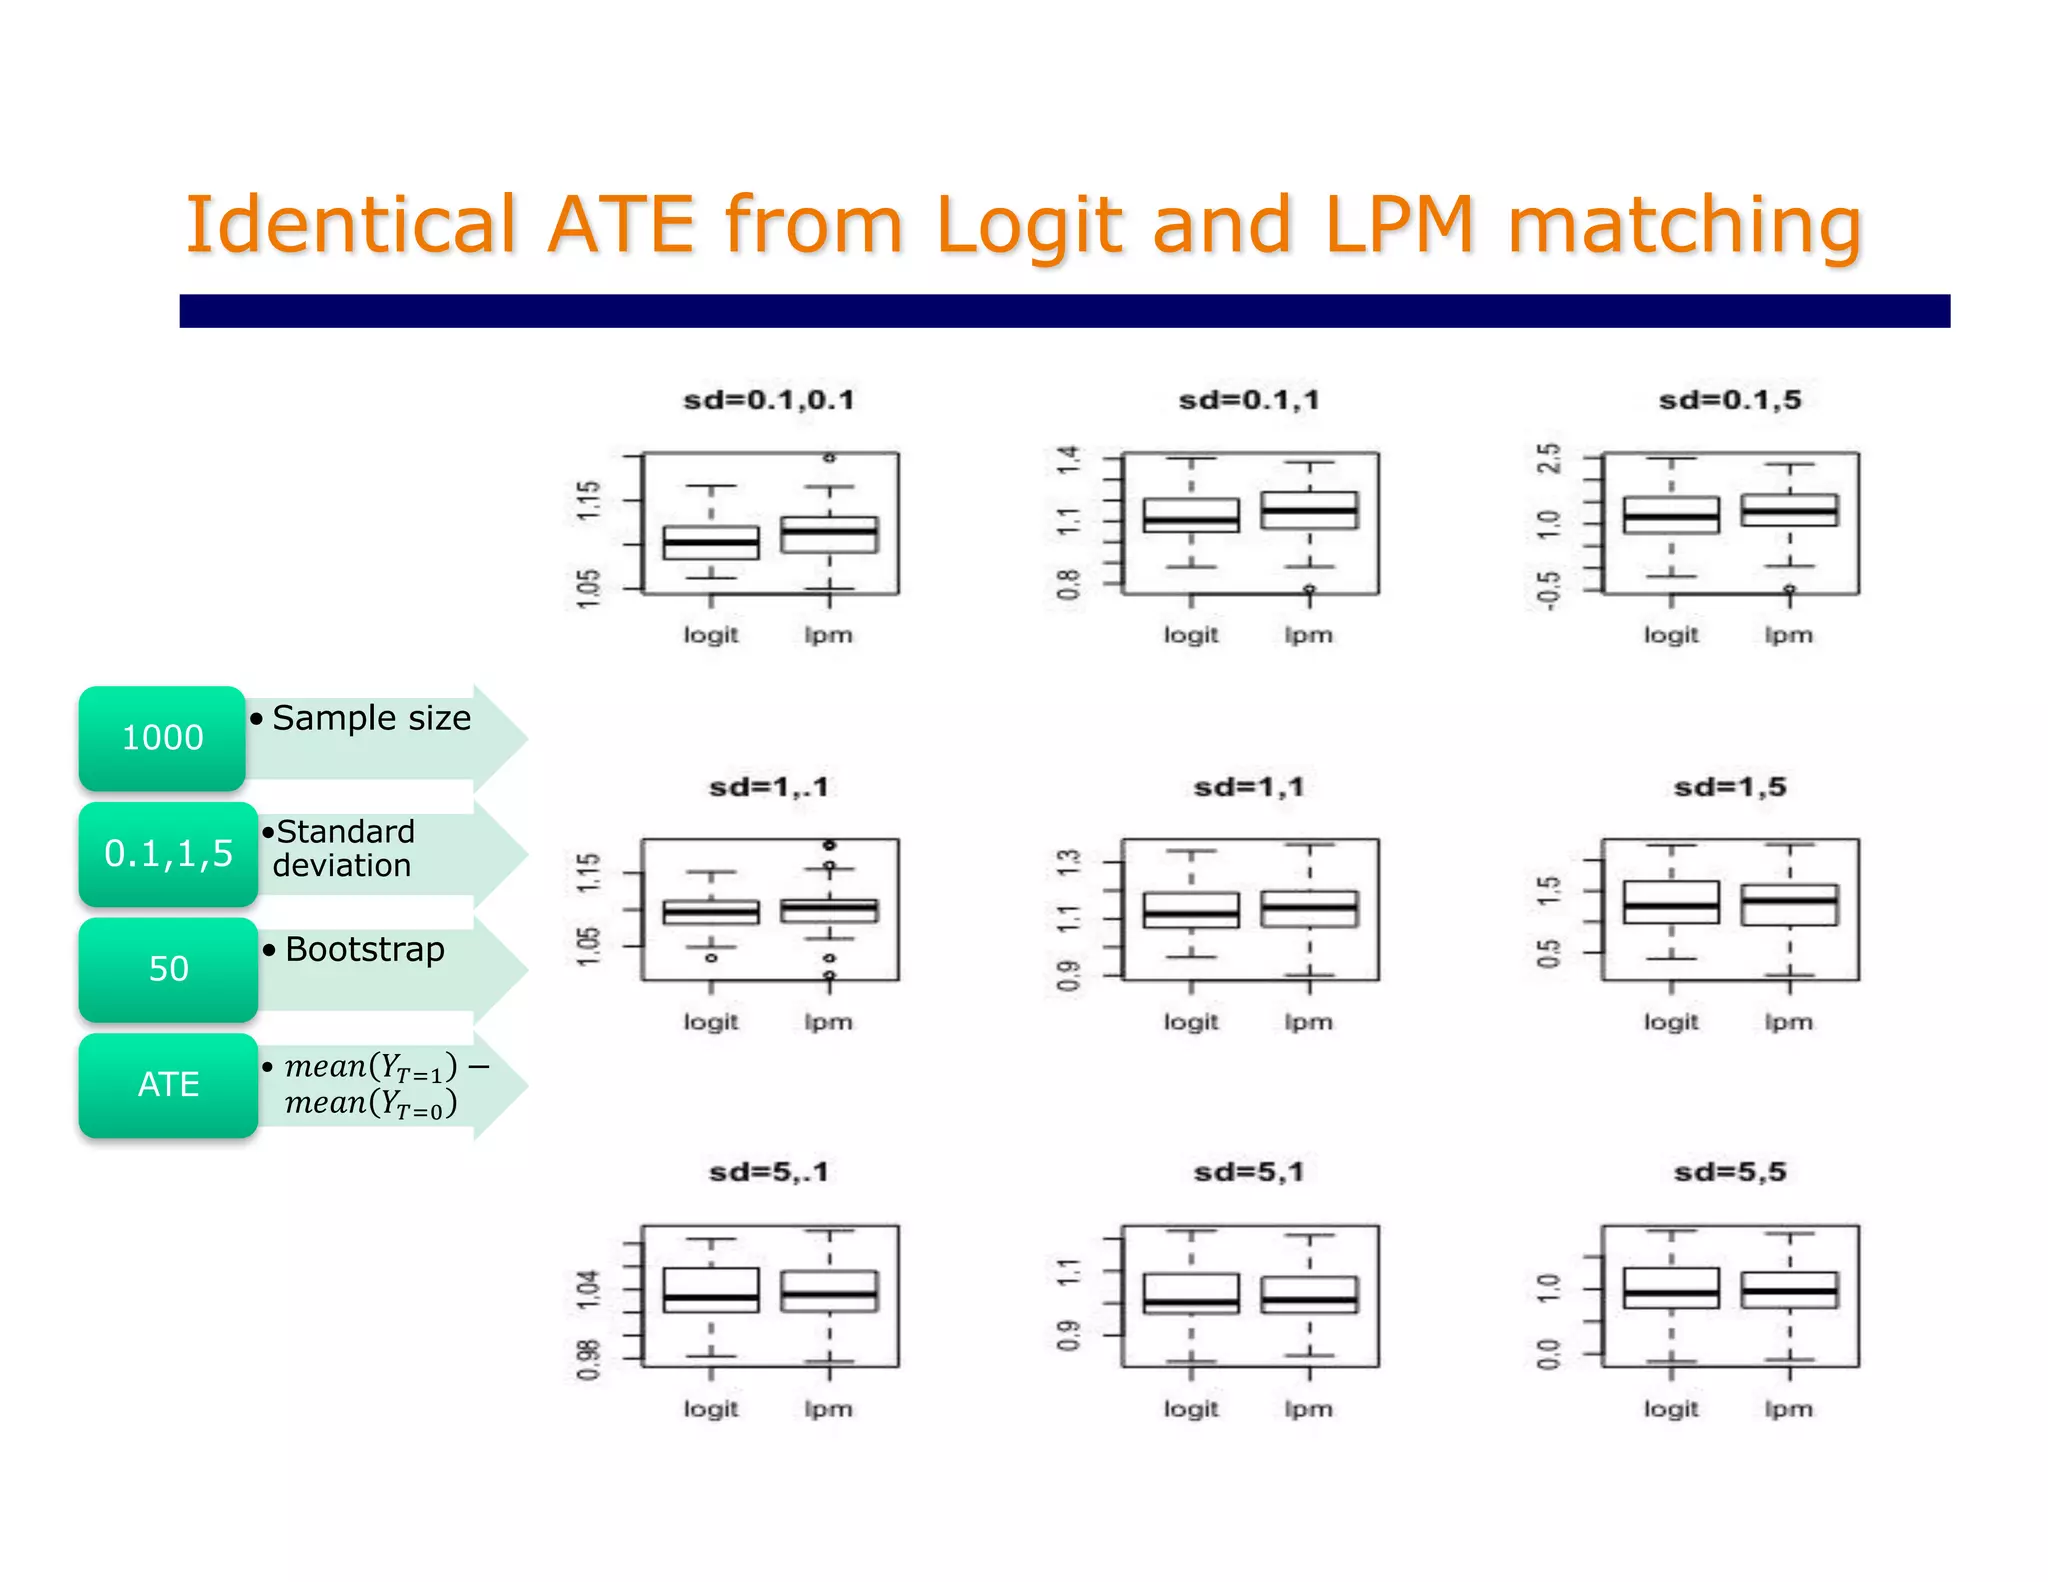
)
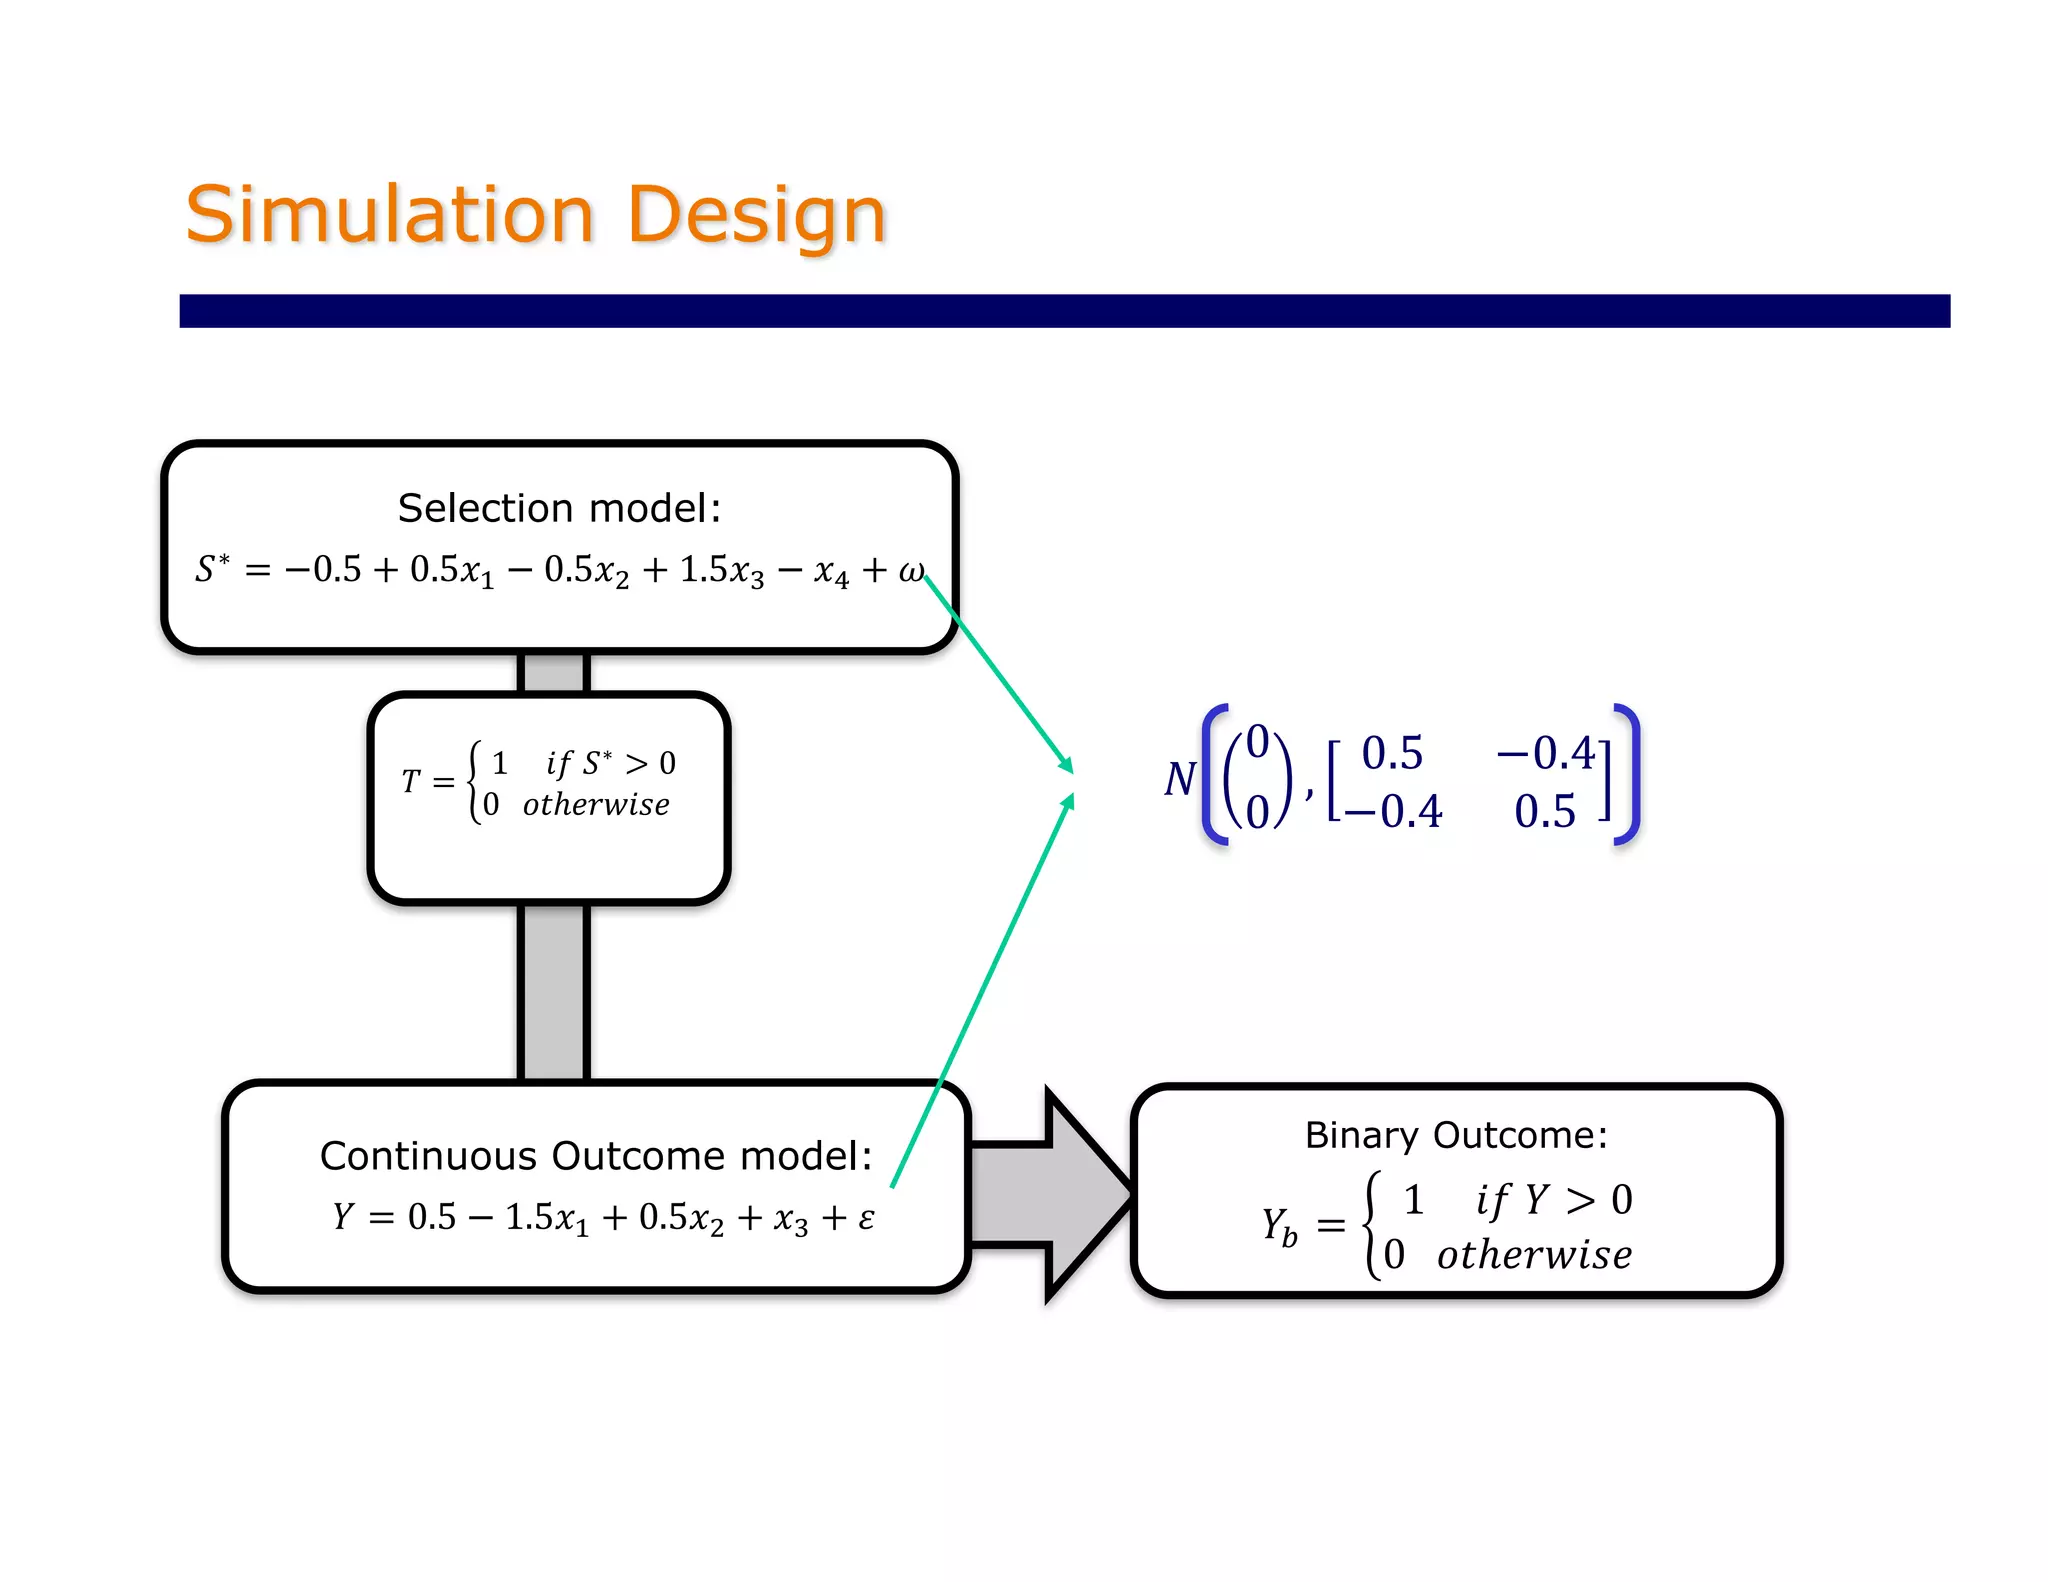
Outcome model :
𝑌 = 𝑇 + 𝑋𝛽 + 𝜀
𝑁(0, {0.1,1,5})
𝑋 ~ 𝑁 0,1 and 𝛽 = 1](https://image.slidesharecdn.com/dmdaselectionbiaswithlpm1-161115102649/75/Selection-Bias-with-Linear-Probability-Models-18-2048.jpg)