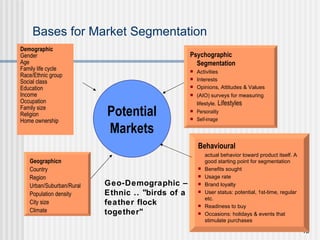
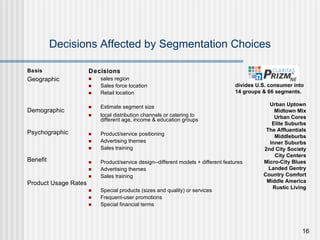
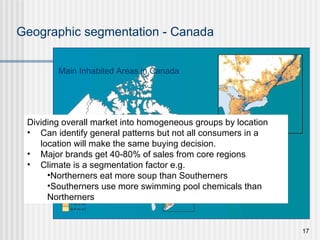
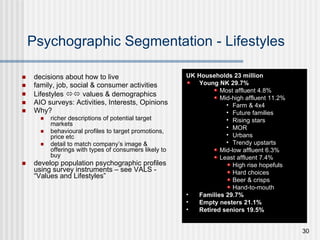
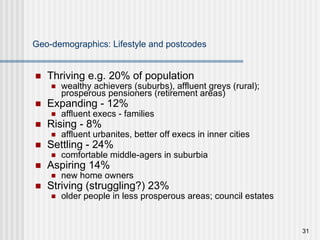
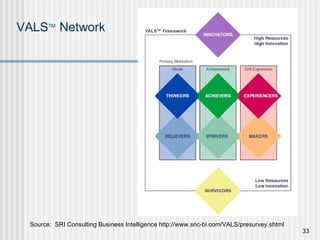
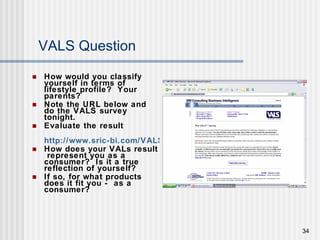
Market  Segmentation
Consider the role of segmentation in marketing strategy types of market segmentation in  consumer markets B2C industrial B2B criteria & bases for segmenting consumer markets. the segmentation process & basic strategies positioning & repositioning factors behind segmentation strategy choices.
Overview discover needs/wants of consumer groups to develop specialised products to satisfy group needs  identify the best media for advertising related concepts (STP) Segmentation  (subsets with similar needs) Targeting  (which segment to aim for) Positioning  (the product in the mind of the customer)
Target Market Analysis What market segments are we choosing to serve Why? How are these segments evolving? What new segments are emerging? Mass marketing? econ of scale Micromarketing  clear segment a Niche  a Locality an Individual
Concentrated (niche) & micro-marketing Niche commit all marketing resources to serve a single market segment Attractive to small firms with limited resources and to firms offering highly specialized goods and services Micro-marketing target potential customers at a very basic level, such as by ZIP code, specific occupation, lifestyle, or individual household WWW & Internet makes micromarketing more effective
Trainers that meet the special needs of women and their feet.
Market Aggregation The market No segmentation heterogenous customers homogenous product no differentiation
Segmentation S-1 S-2 S-3 ...based on  customer -based characteristics or  product  attributes Segments must be Identifiable Measurable Accessible, reachable Substantial enough Unique enough Durable/stable Good market segmentation  has internally homogenous members and  is externally heterogeneous
Targeting S-1 S-2 S-3 Focus on segment(s) providing most value Pareto Principle the 20% who  provide 80% of sales value Group e.g. by age sex income lifestyle  Choice criteria?
Value segmentation – Pareto - illustrations Brand User Loyal Switchers 20% 20% Revenue/Profits . 80% The 80/20 rule 20% 40% 20% Semi-Loyal Source: Garth Hallberg Competitive Brand User Non User of Category
Tasks in Strategic Marketing Plans Before implementing a marketing mix strategy (7Ps), identify, evaluate & select a target market. Who has the purchasing power, authority & willingness to buy?  What specific consumer segment is most likely to buy the product? Now target the market, design a programme to fit, implement it
Positioning Low Price Consistent quality Not accessible convenient accessible Brand conscious premium A B D C
Positioning shaping the product & developing a marketing programme so that product is perceived to be (and is) different from competitors’ products. Positioning map:  to show differences in consumers’ perceptions of competing products Reposition:  marketing strategy to change a product’s position in consumers’ minds relative to positions of rival product
B2C and B2B Goods identify the purchaser + reasons for buying the goods Consumer goods (B2C) products & services bought by the end consumer for personal use. Business goods (B2B) Products/services bought to be used, directly or indirectly, to produce or supply other goods/services or for resale e.g. 5 litre tomato sauce containers for food service operators
Bases for Market Segmentation Demographic Gender Age Family life cycle Race/Ethnic group Social class Education Income Occupation Family size Religion Home ownership Potential Markets Geographicn Country Region Urban/Suburban/Rural Population density City size Climate Psychographic Segmentation Activities Interests Opinions, Attitudes & Values (AIO) surveys for measuring lifestyle.  Lifestyles Personality Self-image Behavioural actual behavior toward product itself. A good starting point for segmentation Benefits sought Usage rate Brand loyalty User status: potential, 1st-time, regular etc. Readiness to buy Occasions: holidays & events that stimulate purchases Geo-Demographic – Ethnic .. "birds of a feather flock together"
Decisions Affected by Segmentation Choices Basis Geographic Demographic Psychographic Benefit Product Usage Rates Decisions sales region Sales force location Retail location Estimate segment size local distribution channels or catering to  different age, income & education groups Product/service positioning Advertising themes Sales training Product/service design--different models + different features Advertising themes Sales training Special products (sizes and quality) or services Frequent-user promotions Special financial terms divides U.S. consumer into 14 groups & 66 segments.  Urban Uptown Midtown Mix Urban Cores Elite Suburbs The Affluentials Middleburbs Inner Suburbs 2nd City Society City Centers Micro-City Blues Landed Gentry Country Comfort Middle America Rustic Living
Main Inhabited Areas in Canada Geographic segmentation - Canada Dividing overall market into homogeneous groups by location Can identify general patterns but not all consumers in a location will make the same buying decision. Major brands get 40-80% of sales from core regions Climate is a segmentation factor e.g. Northerners eat more soup than Southerners Southerners use more swimming pool chemicals than Northerners
% Distribution of  Canadian Population by Province 2001
Provincial and Territorial Populations, 1981, 1991, 2001 POPULATION  (THOUSANDS) Source:  Statistics Canada Website http://geodepot.ca/English/Pgdb/People/Population/demo05.htm.  Region 1981 1991 2001 Newfoundland 568 568 513 Prince Edward Island 123 130 135 Nova Scotia 847 900 908 New Brunswick 696 724 729 Quebec 6 438 6 896 7 237 Ontario 8 625 10 085 11 410 Manitoba 1 026 1 092 1 120 Saskatchewan 968 989 979 Alberta 2 238 2 546 2 975 British Columbia 2 744 3 282  3 908 Yukon 23 28 29 Northwest Territories 46 36 37 Nunavut n/a 21 27 Canada 24 343 27 297 30 007
Urban - Rural Population Distribution, 1871-2001
Canada's 25 Largest Metropolitan Areas Toronto Montreal Vancouver Ottawa-Hull Calgary Edmonton Quebec Winnipeg Hamilton London Kitchener St. Catharines-Niagara Halifax Victoria Windsor Oshawa Saskatoon Regina St. John’s Chicoutimi-Jonquière Sudbury Sherbrooke Trois-Rivières Saint John Thunder Bay 1996 Population (Thousands) 4881 3512 2079 1107 972 935 693 685 681 426 432 393 359 319 314 305 231 198 176 159 157 155 142 128 125 2001 Population (Thousands) Area 4445 3359 1891 1031 852 392 698 677 650 416 403 390 347 313 292 281 222 199 178 167 166 150 144 129 131 Source:  http:www.statcan.ca/english/Pgdb/People/Population/demo05.htm
Population Projections by Age Group Demographic segmentation : dividing consumer groups by e.g. sex, age, income, occupation, education, household size & stage in family life cycle
Family Life Cycle young singles young married couples who remain childless, single parenthood parenthood (full nest) post-parenthood (empty nest) dissolution (separated, widowed, or divorced) retirees with children still at home able elderly
Buying Patterns for Different Age Groups Age Name of Age Group   Merchandise bought 0 - 5  Young children Baby food, toys, nursery, furniture,  children’s wear 6 - 19 School children Clothing, sports equipment, records,  (including teenagers) school supplies, food, cosmetics, used cars 20 - 34 Young adults Cars, furniture, houses, clothing,  recreational equipment, purchases  for younger age groups. 35 - 49 Younger middle-aged Larger homes, better cars, second adults cars, new furniture, recreational equipment 50 - 64 Older middle-aged  Recreational items, presents for  adults young marrieds & infants 65+ Senior adults Medical services, travel, medicines,  purchases for younger age groups
Segmenting by age many firms identify market segments by age design products  to meet specific needs of certain age groups e.g. baby food, toothpaste, fashion garments, walking aids sociologists attribute different consumer needs & wants across age groups to a  cohort effect tendency among members of a generation to be influenced & drawn together by significant events occurring in formative years e.g. age 17-22
Demographic: The Grey Market 40% of UK income, 70-80% of wealth UK population split 16% 50-64 years old 16% 64 + Grey market wealth 20% well off (twice average income) 40% property-rich; income poor 40% poor 1% in UK (15% in US) on incomes 40% lower than national average income Grey market lifestyle groups  WOOPIES (Well off older persons) married in two person households, <75yrs, well off, 86% Investment income high home & car ownership OPALS (Old people with affluent lifestyles) JOLLIES - Jet-setting oldies with lots of loot
Ethnic Group Segmentation USA Census Bureau by 2050, nearly 50% of US population will belong to nonwhite minority groups three largest & fastest-growing racial/ethnic groups African Americans, Hispanics, Asian Americans.
Generalisation …  based on studying the impact of household income changes on consumer spending behaviour As family income increases 1. a smaller %  goes on food 2. the % spend on housing & household operations & clothing stays constant  3. % spend on other items (such as recreation & education) increases
Percentage Annual Expenditures by Income Groups, 1999
Psychographic Segmentation - Lifestyles decisions about how to live family, job, social & consumer activities  Lifestyles    values & demographics AIO surveys: Activities, Interests, Opinions Why? richer descriptions of potential target markets behavioural profiles to target promotions, price etc detail to match company’s image &  offerings with types of consumers likely to buy develop population psychographic profiles using survey instruments – see VALS - “Values and Lifestyles” UK Households 23 million Young NK 29.7% Most affluent 4.8% Mid-high affluent 11.2% Farm & 4x4 Future families Rising stars MOR Urbans Trendy upstarts Mid-low affluent 6.3% Least affluent 7.4% High rise hopefuls Hard choices Beer & crisps Hand-to-mouth Families 29.7% Empty nesters 21.1% Retired seniors 19.5%
Geo-demographics: Lifestyle and postcodes Thriving e.g. 20% of population wealthy achievers (suburbs), affluent greys (rural); prosperous pensioners (retirement areas) Expanding - 12% affluent execs - families Rising - 8% affluent urbanites, better off execs in inner cities Settling - 24% comfortable middle-agers in suburbia Aspiring 14% new home owners Striving (struggling?) 23% older people in less prosperous areas; council estates
Lifestyle-VALS Values and Lifestyles (1978)  based on the idea that  social class, although  significant , does not determine  all  of our values.  there are important value differences  within  a class Fulfilled’s, Achievers, Experiencers all have the same level of resources. Why are they different? see  http://www.sric-bi.com/VALS/
VALS TM   Network Source:  SRI Consulting Business Intelligence http://www.sric-bi.com/VALS/presurvey.shtml
VALS Question How would you classify yourself in terms of lifestyle profile?  Your parents? Note the URL below and do the VALS survey tonight.  Evaluate the result  http://www.sric-bi.com/VALS/presurvey.shtml How does your VALs result  represent you as a consumer?  Is it a true reflection of yourself?  If so, for what products does it fit you -  as a consumer?
High-end watches for which life-style segments?
Other lifestyle descriptors: McCann-Erickson Men Avant Guardians concerned with well-being of others rather than possessions. Well educated, self-righteous. Pontificators strongly held, traditional opinions. Very British and concerned with keeping others on the right path. Chameleons want to be contemporary to win approval. Copiers not leaders. Self-Admirers High self-image, young, intolerant of others, motivated by success. Self-Exploiters the “doers” and “self-starters”, competitive, pressured, pessimistic Token Triers always willing to improve their luck, but tend to try and fail. Sleepwalkers actively opt out, contented under achievers.
Behaviour/product-related segmentation segmentation  according to the different benefits that consumers seek from the product focus on ‘why’ a customer purchases rather than ‘what’ Benefits that we seek when we buy attributes we seek in a good or service benefits we expect to receive from that good or service Usage rates for a product e.g. heavy-, moderate-, light-user segments 80/20 principle (“Pareto’s Law”) 80% of a product’s revenues comes from a relative small, loyal % of total customers Consumer brand loyalty toward product e.g. AirMiles, ClubCard points
Band-Aid offers “flex” as a  benefit to consumers.
Benefit Segmentation Applied to Yogurt   Attributes of Yogurt Source:  Adapted from Marco Vriens and Ter Hofseted, “Linking Attributes, Benefits, and Consumer Values,” Marketing Research, Chicago, Fall 2000, V. 12(3) pp. 4-10.  Reprinted with permission by the American Marketing Association. Provides choice for family members X   X     Convenient to use X Tastes good   X X Good quality   X   X X X Healthy   X X X X Helps digestion X Helps diet X Spend less money X BENEFITS  SOUGHT FROM YOGURT Individually packaged With  fruit High- priced Mild Organic Contains  bio-bifidus Low fat Low- priced
Other segmentation categories Buyer-readiness segmentation:  ignorance, awareness, knowledge, preference and conviction Interaction segmentation:  different channels, payment methods, promotions & communications Occasion segmentation:  time of day, festivals,  births, marriages, deaths  etc. examples: Whenever our daughter Jamie gets a raise, we always take her out to dinner. When I’m away on business, I try to stay at a suites hotel. I always buy my wife flowers on Valentine’s Day. Internet usage
Market Matching Strategies  (1 of 2) 1908 Early 2000s 1955 Early 2000 Market Single-Offer Multi-Offer Single-Offer Multi-Offer Segment Strategy Strategy Strategy Strategy General-Purpose Cars Small Model T Focus Beetle Polo Medium Model T Taurus Golf Large Crown Victoria Passat Sporty Cars Low-Priced ZX2 Escort new Beetle GTI Medium-Priced Cougar Cabrio Mustang Audi TT Boxster  High-priced Jaguar XK8 Porsche Aston Martin DB7 911 PRODUCT OFFERINGS Ford Motor Company  Audio/Volkswagen/Porsche
Market Matching Strategies  (2 of 2) 1908 Early 2000s 1955 Early 2000s Market Single-Offer Multi-Offer Single-Offer Multi-Offer Segment Strategy Strategy Strategy Strategy Luxury Cars Medium-priced Lincoln Continental Audi A4 Lincoln Town Car High-priced Jaguar S-Type Audi A6 Audi A8 Vans Windstar EuroVan Econoline Trucks Small Model T (Truck) Ford Ranger Medium Ford “F” series Sport Utility Vehicles Explorer (SUVs) Expedition Excursion Lincoln Navigator Ford Motor Company  Audio/Volkswagen/Porsche
Segmentation for Industrial Markets Organizational Demographics industry size, location, company age Operating Variables Technology, process Purchasing Approach Organization & DMU structure Situational Variables Order size, routine vs. customized, urgency of order Personal Characteristics of Buyers attitude to risk, champions End-Use  Application  Segmentation Product  Segmentation Account Size  and Potential  Segmentation Geographic Segmentation Potential  Industrial Markets
Radio Broadcast segmentation The Total Market for Radio The Market Segment for Radio by Age & Benefit Age Benefit Teens Middle  Adults Senior Young  Adult Information Entertainment Companionship This matrix is too simple.  How would we classify today?
Hypothetical  Middle Adult  Segment for Radio Early  Retiree Hourly  Employee Business  Owner Professional Information X X X Entertainment X X Companionship X Desired Benefit Middle Adults
Hypothetical  Middle Adult  Segment for  Information  Radio Early  Retiree Hourly  Employee Business  Owner Professional Breaking news X X Political  commentary X X Financial market commentary X X X Desired Information Focus Advice X X Weather X X Call-in X Gossip X Middle Adults
Hypothetical Positioning Map: CBC versus Commercial Radio Informational Music Challenging Entertaining Commercial  Talk Radio Commercial  Talk Radio *As it Happens  CBC local*  *This Morning  After Hours*  *CBC News  *Ideas  Disc Drive* Take 5*
Positioning of Soap “ Product Space”   Representing Consumers’ Perception for Different Brands of Bar Soap Deodorant High  moisturizing Nondeodorant Low  moisturizing 1 2 4 5 7 8 6 3 Zest Lever 2000 Safeguard Dial Lifebuoy Lava Lux Dove Tone
Plot these cars on this Positioning Map  Honda Accord Jaguar Toyota Yaris VW Golf BMW 300 series  Skoda Fabia Porche Place other cars on the map What other criteria would we add to improve the map's usefulness? Expensive  Inexpensive  Conservative  Sporty Expensive  Inexpensive  Conservative  Sporty
Construct a Competitive Positioning Map  for the clothing areas of the following retailers Next Marks and Spencer Primark Miss Selfridge Asda (George) H&M La Senza Coast
Non-profit market segmentation Is segmentation for nonprofit marketers of more, less, or the same importance than for profit-oriented marketers?  Examples ?

Segment

  • 1.
  • 2.
    Consider the roleof segmentation in marketing strategy types of market segmentation in consumer markets B2C industrial B2B criteria & bases for segmenting consumer markets. the segmentation process & basic strategies positioning & repositioning factors behind segmentation strategy choices.
  • 3.
    Overview discover needs/wantsof consumer groups to develop specialised products to satisfy group needs identify the best media for advertising related concepts (STP) Segmentation (subsets with similar needs) Targeting (which segment to aim for) Positioning (the product in the mind of the customer)
  • 4.
    Target Market AnalysisWhat market segments are we choosing to serve Why? How are these segments evolving? What new segments are emerging? Mass marketing? econ of scale Micromarketing clear segment a Niche a Locality an Individual
  • 5.
    Concentrated (niche) &micro-marketing Niche commit all marketing resources to serve a single market segment Attractive to small firms with limited resources and to firms offering highly specialized goods and services Micro-marketing target potential customers at a very basic level, such as by ZIP code, specific occupation, lifestyle, or individual household WWW & Internet makes micromarketing more effective
  • 6.
    Trainers that meetthe special needs of women and their feet.
  • 7.
    Market Aggregation Themarket No segmentation heterogenous customers homogenous product no differentiation
  • 8.
    Segmentation S-1 S-2S-3 ...based on customer -based characteristics or product attributes Segments must be Identifiable Measurable Accessible, reachable Substantial enough Unique enough Durable/stable Good market segmentation has internally homogenous members and is externally heterogeneous
  • 9.
    Targeting S-1 S-2S-3 Focus on segment(s) providing most value Pareto Principle the 20% who provide 80% of sales value Group e.g. by age sex income lifestyle Choice criteria?
  • 10.
    Value segmentation –Pareto - illustrations Brand User Loyal Switchers 20% 20% Revenue/Profits . 80% The 80/20 rule 20% 40% 20% Semi-Loyal Source: Garth Hallberg Competitive Brand User Non User of Category
  • 11.
    Tasks in StrategicMarketing Plans Before implementing a marketing mix strategy (7Ps), identify, evaluate & select a target market. Who has the purchasing power, authority & willingness to buy? What specific consumer segment is most likely to buy the product? Now target the market, design a programme to fit, implement it
  • 12.
    Positioning Low PriceConsistent quality Not accessible convenient accessible Brand conscious premium A B D C
  • 13.
    Positioning shaping theproduct & developing a marketing programme so that product is perceived to be (and is) different from competitors’ products. Positioning map: to show differences in consumers’ perceptions of competing products Reposition: marketing strategy to change a product’s position in consumers’ minds relative to positions of rival product
  • 14.
    B2C and B2BGoods identify the purchaser + reasons for buying the goods Consumer goods (B2C) products & services bought by the end consumer for personal use. Business goods (B2B) Products/services bought to be used, directly or indirectly, to produce or supply other goods/services or for resale e.g. 5 litre tomato sauce containers for food service operators
  • 15.
    Bases for MarketSegmentation Demographic Gender Age Family life cycle Race/Ethnic group Social class Education Income Occupation Family size Religion Home ownership Potential Markets Geographicn Country Region Urban/Suburban/Rural Population density City size Climate Psychographic Segmentation Activities Interests Opinions, Attitudes & Values (AIO) surveys for measuring lifestyle. Lifestyles Personality Self-image Behavioural actual behavior toward product itself. A good starting point for segmentation Benefits sought Usage rate Brand loyalty User status: potential, 1st-time, regular etc. Readiness to buy Occasions: holidays & events that stimulate purchases Geo-Demographic – Ethnic .. &quot;birds of a feather flock together&quot;
  • 16.
    Decisions Affected bySegmentation Choices Basis Geographic Demographic Psychographic Benefit Product Usage Rates Decisions sales region Sales force location Retail location Estimate segment size local distribution channels or catering to different age, income & education groups Product/service positioning Advertising themes Sales training Product/service design--different models + different features Advertising themes Sales training Special products (sizes and quality) or services Frequent-user promotions Special financial terms divides U.S. consumer into 14 groups & 66 segments. Urban Uptown Midtown Mix Urban Cores Elite Suburbs The Affluentials Middleburbs Inner Suburbs 2nd City Society City Centers Micro-City Blues Landed Gentry Country Comfort Middle America Rustic Living
  • 17.
    Main Inhabited Areasin Canada Geographic segmentation - Canada Dividing overall market into homogeneous groups by location Can identify general patterns but not all consumers in a location will make the same buying decision. Major brands get 40-80% of sales from core regions Climate is a segmentation factor e.g. Northerners eat more soup than Southerners Southerners use more swimming pool chemicals than Northerners
  • 18.
    % Distribution of Canadian Population by Province 2001
  • 19.
    Provincial and TerritorialPopulations, 1981, 1991, 2001 POPULATION (THOUSANDS) Source: Statistics Canada Website http://geodepot.ca/English/Pgdb/People/Population/demo05.htm. Region 1981 1991 2001 Newfoundland 568 568 513 Prince Edward Island 123 130 135 Nova Scotia 847 900 908 New Brunswick 696 724 729 Quebec 6 438 6 896 7 237 Ontario 8 625 10 085 11 410 Manitoba 1 026 1 092 1 120 Saskatchewan 968 989 979 Alberta 2 238 2 546 2 975 British Columbia 2 744 3 282 3 908 Yukon 23 28 29 Northwest Territories 46 36 37 Nunavut n/a 21 27 Canada 24 343 27 297 30 007
  • 20.
    Urban - RuralPopulation Distribution, 1871-2001
  • 21.
    Canada's 25 LargestMetropolitan Areas Toronto Montreal Vancouver Ottawa-Hull Calgary Edmonton Quebec Winnipeg Hamilton London Kitchener St. Catharines-Niagara Halifax Victoria Windsor Oshawa Saskatoon Regina St. John’s Chicoutimi-Jonquière Sudbury Sherbrooke Trois-Rivières Saint John Thunder Bay 1996 Population (Thousands) 4881 3512 2079 1107 972 935 693 685 681 426 432 393 359 319 314 305 231 198 176 159 157 155 142 128 125 2001 Population (Thousands) Area 4445 3359 1891 1031 852 392 698 677 650 416 403 390 347 313 292 281 222 199 178 167 166 150 144 129 131 Source: http:www.statcan.ca/english/Pgdb/People/Population/demo05.htm
  • 22.
    Population Projections byAge Group Demographic segmentation : dividing consumer groups by e.g. sex, age, income, occupation, education, household size & stage in family life cycle
  • 23.
    Family Life Cycleyoung singles young married couples who remain childless, single parenthood parenthood (full nest) post-parenthood (empty nest) dissolution (separated, widowed, or divorced) retirees with children still at home able elderly
  • 24.
    Buying Patterns forDifferent Age Groups Age Name of Age Group Merchandise bought 0 - 5 Young children Baby food, toys, nursery, furniture, children’s wear 6 - 19 School children Clothing, sports equipment, records, (including teenagers) school supplies, food, cosmetics, used cars 20 - 34 Young adults Cars, furniture, houses, clothing, recreational equipment, purchases for younger age groups. 35 - 49 Younger middle-aged Larger homes, better cars, second adults cars, new furniture, recreational equipment 50 - 64 Older middle-aged Recreational items, presents for adults young marrieds & infants 65+ Senior adults Medical services, travel, medicines, purchases for younger age groups
  • 25.
    Segmenting by agemany firms identify market segments by age design products to meet specific needs of certain age groups e.g. baby food, toothpaste, fashion garments, walking aids sociologists attribute different consumer needs & wants across age groups to a cohort effect tendency among members of a generation to be influenced & drawn together by significant events occurring in formative years e.g. age 17-22
  • 26.
    Demographic: The GreyMarket 40% of UK income, 70-80% of wealth UK population split 16% 50-64 years old 16% 64 + Grey market wealth 20% well off (twice average income) 40% property-rich; income poor 40% poor 1% in UK (15% in US) on incomes 40% lower than national average income Grey market lifestyle groups WOOPIES (Well off older persons) married in two person households, <75yrs, well off, 86% Investment income high home & car ownership OPALS (Old people with affluent lifestyles) JOLLIES - Jet-setting oldies with lots of loot
  • 27.
    Ethnic Group SegmentationUSA Census Bureau by 2050, nearly 50% of US population will belong to nonwhite minority groups three largest & fastest-growing racial/ethnic groups African Americans, Hispanics, Asian Americans.
  • 28.
    Generalisation … based on studying the impact of household income changes on consumer spending behaviour As family income increases 1. a smaller % goes on food 2. the % spend on housing & household operations & clothing stays constant 3. % spend on other items (such as recreation & education) increases
  • 29.
    Percentage Annual Expendituresby Income Groups, 1999
  • 30.
    Psychographic Segmentation -Lifestyles decisions about how to live family, job, social & consumer activities Lifestyles  values & demographics AIO surveys: Activities, Interests, Opinions Why? richer descriptions of potential target markets behavioural profiles to target promotions, price etc detail to match company’s image & offerings with types of consumers likely to buy develop population psychographic profiles using survey instruments – see VALS - “Values and Lifestyles” UK Households 23 million Young NK 29.7% Most affluent 4.8% Mid-high affluent 11.2% Farm & 4x4 Future families Rising stars MOR Urbans Trendy upstarts Mid-low affluent 6.3% Least affluent 7.4% High rise hopefuls Hard choices Beer & crisps Hand-to-mouth Families 29.7% Empty nesters 21.1% Retired seniors 19.5%
  • 31.
    Geo-demographics: Lifestyle andpostcodes Thriving e.g. 20% of population wealthy achievers (suburbs), affluent greys (rural); prosperous pensioners (retirement areas) Expanding - 12% affluent execs - families Rising - 8% affluent urbanites, better off execs in inner cities Settling - 24% comfortable middle-agers in suburbia Aspiring 14% new home owners Striving (struggling?) 23% older people in less prosperous areas; council estates
  • 32.
    Lifestyle-VALS Values andLifestyles (1978) based on the idea that social class, although significant , does not determine all of our values. there are important value differences within a class Fulfilled’s, Achievers, Experiencers all have the same level of resources. Why are they different? see http://www.sric-bi.com/VALS/
  • 33.
    VALS TM Network Source: SRI Consulting Business Intelligence http://www.sric-bi.com/VALS/presurvey.shtml
  • 34.
    VALS Question Howwould you classify yourself in terms of lifestyle profile? Your parents? Note the URL below and do the VALS survey tonight. Evaluate the result http://www.sric-bi.com/VALS/presurvey.shtml How does your VALs result represent you as a consumer? Is it a true reflection of yourself? If so, for what products does it fit you - as a consumer?
  • 35.
    High-end watches forwhich life-style segments?
  • 36.
    Other lifestyle descriptors:McCann-Erickson Men Avant Guardians concerned with well-being of others rather than possessions. Well educated, self-righteous. Pontificators strongly held, traditional opinions. Very British and concerned with keeping others on the right path. Chameleons want to be contemporary to win approval. Copiers not leaders. Self-Admirers High self-image, young, intolerant of others, motivated by success. Self-Exploiters the “doers” and “self-starters”, competitive, pressured, pessimistic Token Triers always willing to improve their luck, but tend to try and fail. Sleepwalkers actively opt out, contented under achievers.
  • 37.
    Behaviour/product-related segmentation segmentation according to the different benefits that consumers seek from the product focus on ‘why’ a customer purchases rather than ‘what’ Benefits that we seek when we buy attributes we seek in a good or service benefits we expect to receive from that good or service Usage rates for a product e.g. heavy-, moderate-, light-user segments 80/20 principle (“Pareto’s Law”) 80% of a product’s revenues comes from a relative small, loyal % of total customers Consumer brand loyalty toward product e.g. AirMiles, ClubCard points
  • 38.
    Band-Aid offers “flex”as a benefit to consumers.
  • 39.
    Benefit Segmentation Appliedto Yogurt Attributes of Yogurt Source: Adapted from Marco Vriens and Ter Hofseted, “Linking Attributes, Benefits, and Consumer Values,” Marketing Research, Chicago, Fall 2000, V. 12(3) pp. 4-10. Reprinted with permission by the American Marketing Association. Provides choice for family members X X Convenient to use X Tastes good X X Good quality X X X X Healthy X X X X Helps digestion X Helps diet X Spend less money X BENEFITS SOUGHT FROM YOGURT Individually packaged With fruit High- priced Mild Organic Contains bio-bifidus Low fat Low- priced
  • 40.
    Other segmentation categoriesBuyer-readiness segmentation: ignorance, awareness, knowledge, preference and conviction Interaction segmentation: different channels, payment methods, promotions & communications Occasion segmentation: time of day, festivals, births, marriages, deaths etc. examples: Whenever our daughter Jamie gets a raise, we always take her out to dinner. When I’m away on business, I try to stay at a suites hotel. I always buy my wife flowers on Valentine’s Day. Internet usage
  • 41.
    Market Matching Strategies (1 of 2) 1908 Early 2000s 1955 Early 2000 Market Single-Offer Multi-Offer Single-Offer Multi-Offer Segment Strategy Strategy Strategy Strategy General-Purpose Cars Small Model T Focus Beetle Polo Medium Model T Taurus Golf Large Crown Victoria Passat Sporty Cars Low-Priced ZX2 Escort new Beetle GTI Medium-Priced Cougar Cabrio Mustang Audi TT Boxster High-priced Jaguar XK8 Porsche Aston Martin DB7 911 PRODUCT OFFERINGS Ford Motor Company Audio/Volkswagen/Porsche
  • 42.
    Market Matching Strategies (2 of 2) 1908 Early 2000s 1955 Early 2000s Market Single-Offer Multi-Offer Single-Offer Multi-Offer Segment Strategy Strategy Strategy Strategy Luxury Cars Medium-priced Lincoln Continental Audi A4 Lincoln Town Car High-priced Jaguar S-Type Audi A6 Audi A8 Vans Windstar EuroVan Econoline Trucks Small Model T (Truck) Ford Ranger Medium Ford “F” series Sport Utility Vehicles Explorer (SUVs) Expedition Excursion Lincoln Navigator Ford Motor Company Audio/Volkswagen/Porsche
  • 43.
    Segmentation for IndustrialMarkets Organizational Demographics industry size, location, company age Operating Variables Technology, process Purchasing Approach Organization & DMU structure Situational Variables Order size, routine vs. customized, urgency of order Personal Characteristics of Buyers attitude to risk, champions End-Use Application Segmentation Product Segmentation Account Size and Potential Segmentation Geographic Segmentation Potential Industrial Markets
  • 44.
    Radio Broadcast segmentationThe Total Market for Radio The Market Segment for Radio by Age & Benefit Age Benefit Teens Middle Adults Senior Young Adult Information Entertainment Companionship This matrix is too simple. How would we classify today?
  • 45.
    Hypothetical MiddleAdult Segment for Radio Early Retiree Hourly Employee Business Owner Professional Information X X X Entertainment X X Companionship X Desired Benefit Middle Adults
  • 46.
    Hypothetical MiddleAdult Segment for Information Radio Early Retiree Hourly Employee Business Owner Professional Breaking news X X Political commentary X X Financial market commentary X X X Desired Information Focus Advice X X Weather X X Call-in X Gossip X Middle Adults
  • 47.
    Hypothetical Positioning Map:CBC versus Commercial Radio Informational Music Challenging Entertaining Commercial Talk Radio Commercial Talk Radio *As it Happens CBC local* *This Morning After Hours* *CBC News *Ideas Disc Drive* Take 5*
  • 48.
    Positioning of Soap“ Product Space” Representing Consumers’ Perception for Different Brands of Bar Soap Deodorant High moisturizing Nondeodorant Low moisturizing 1 2 4 5 7 8 6 3 Zest Lever 2000 Safeguard Dial Lifebuoy Lava Lux Dove Tone
  • 49.
    Plot these carson this Positioning Map Honda Accord Jaguar Toyota Yaris VW Golf BMW 300 series Skoda Fabia Porche Place other cars on the map What other criteria would we add to improve the map's usefulness? Expensive Inexpensive Conservative Sporty Expensive Inexpensive Conservative Sporty
  • 50.
    Construct a CompetitivePositioning Map for the clothing areas of the following retailers Next Marks and Spencer Primark Miss Selfridge Asda (George) H&M La Senza Coast
  • 51.
    Non-profit market segmentationIs segmentation for nonprofit marketers of more, less, or the same importance than for profit-oriented marketers? Examples ?

Editor's Notes

  • #11 Similar principle also applies to geographical area’s. Not every local market is valuable to a manufacturer. Not every local market holds the same potential for a product. The competition might not be as severe in every local market. So again , it really makes sense to be able to identify the most and least valuable geographical markets and to execute your sales and marketing strategy based on that.
  • #49 Summary Overview Computer-aided methods afford marketers additional help in segmenting markets. The ability of the computer to record, sort, recombine, and analyze a great many variables relating to consumer behaviour at the same time allows marketers to develop much more sophisticated market segments. More Sophisticated Techniques for Segmentation and Positioning Clustering . Clustering techniques try to find similar patterns within sets of data. Patterns of behaviour can be combined into new needs analysis and product design and marketing communications can focus on how these needs can be filled. Database Sorting . Past customer behaviour is often the source of information about new purchase opportunities or identification of cyclical buying habits. Teaching Tip: Database sorting is especially helpful in providing services. For example, a financial advisor enters a great deal of information about a client in a database. By contacting the client before key events, such as an wedding anniversary, the advisor demonstrates to the client the importance of their continuing relationship and how well the advisor has internalized what is important to the client. Differentiation . Differentiation refers to how the marketer tries to distinguish her or his offer in the marketplace -- how it is set off from the competition in hopefully meaningful ways. Positioning . Positioning refers to how customers think about proposed and/or present brands in a market. Marketing managers must always remember that it is the customer’s perception of where a product or brand is in relation to the other choices that is important.