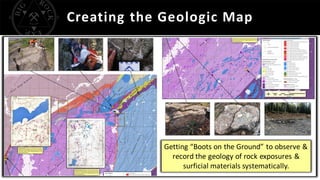
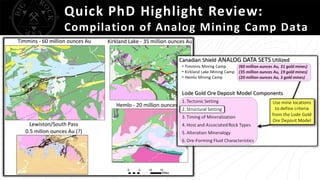
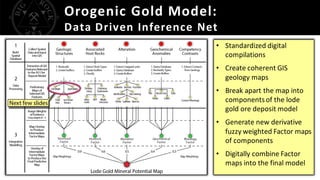
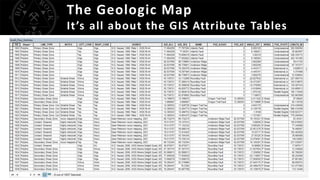
The document discusses the importance of creating coherent geologic maps for mineral exploration through field mapping and the use of geographic information systems (GIS). Key points include:
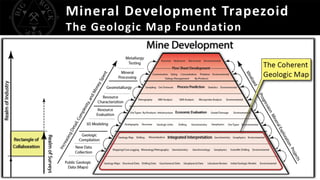
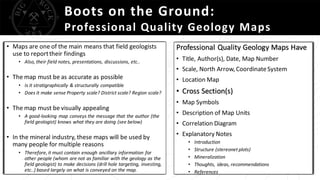
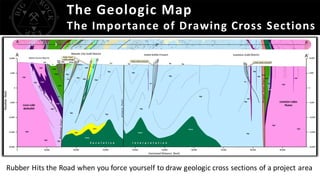
- Professional quality geologic maps produced by field mapping are important tools that contain information used to make exploration decisions.
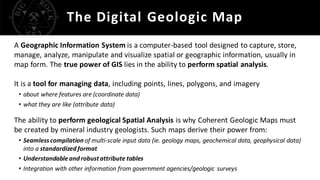
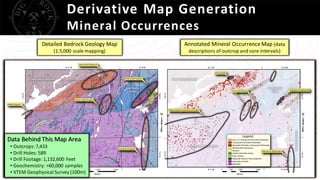
- GIS allows for integration of field data, geochemical data, geophysical surveys, and drill holes to perform spatial analysis and generate derivative maps useful for exploration.
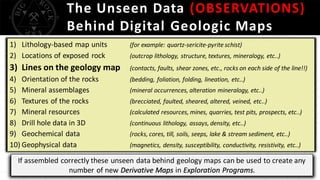
- Underlying unseen data that contributes to coherent digital geologic maps includes lithology, structures, mineralization, geochemistry, and geophysics.