This document discusses key findings from CEOs for Cities about the drivers of the new economy and implications for urban policy. It makes several points:
1) National policy is essentially urban policy as cities are disproportionate drivers of economic output and new economic activity.
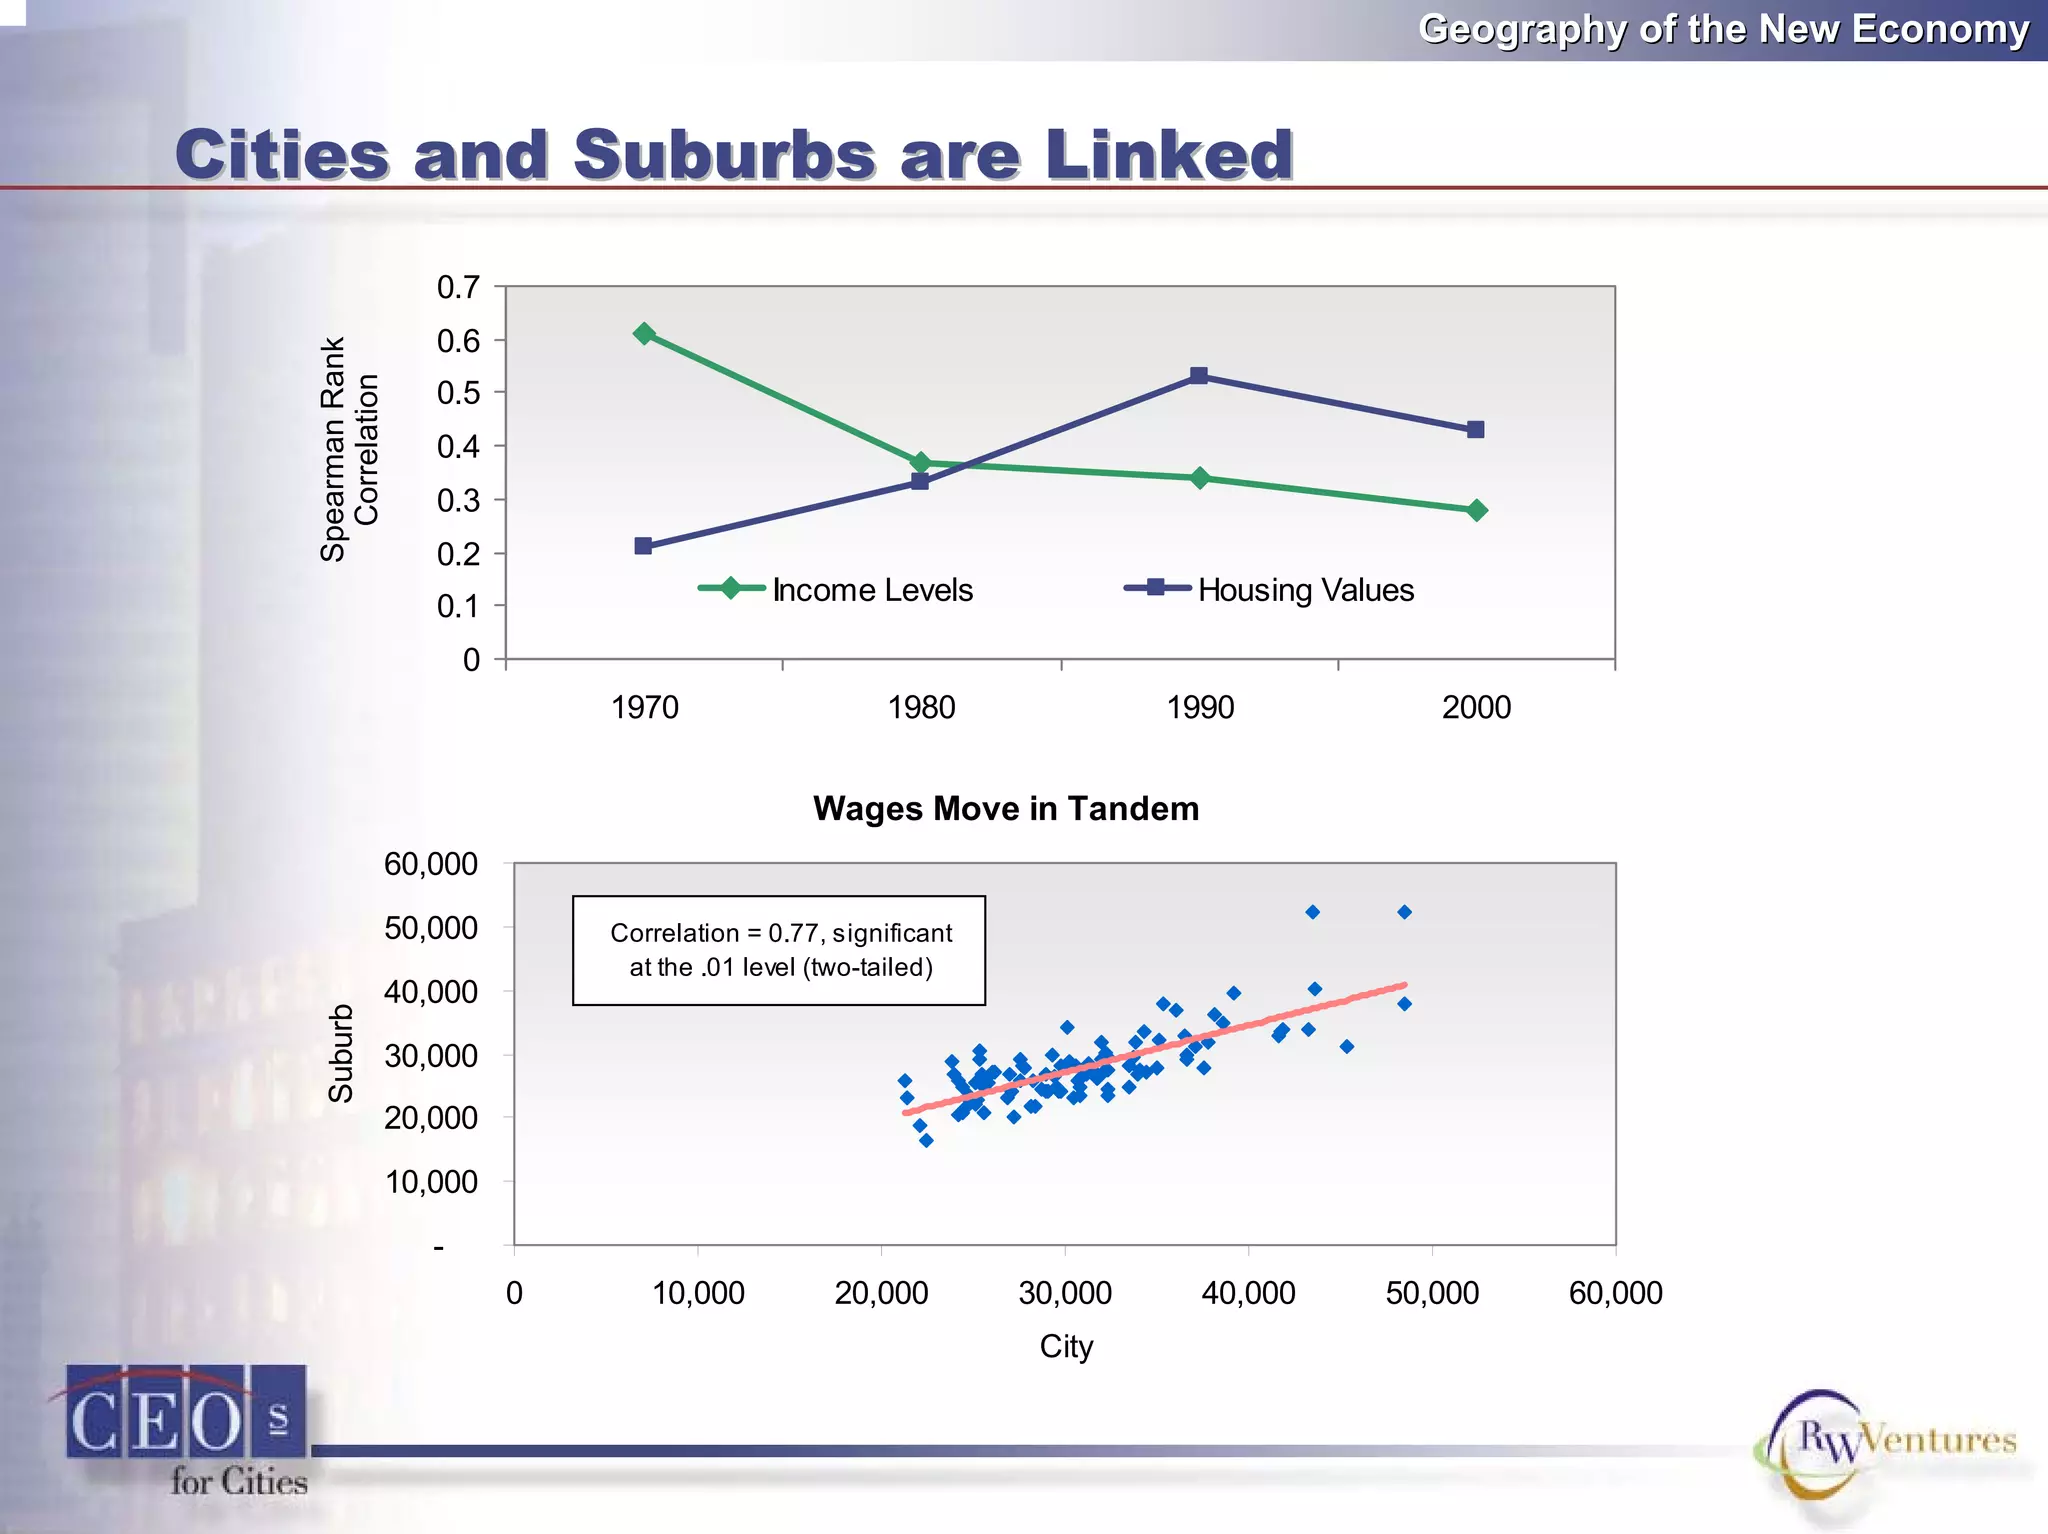
2) The economy is now global and regional in nature, so urban policy must consider these larger geographic scales.
3) An efficient regional economy uses all of its assets, including developing a knowledgeable workforce and reducing inequality.
It also examines how factors like education, functional specialization, and immigration contribute to economic growth and the need for cities to build on their unique strengths.


![3. Urban Policy Must Be Regional3. Urban Policy Must Be Regional
• Strategy 3.1: Support Regional Infrastructure,
Integration and Planning
• Policies and Programs:
– City-suburb partnerships, particularly aimed at managing growth
patterns (e.g. Metro regional government in Portland);
– States limiting government fragmentation and consolidating land
use and zoning powers;
– State and federal governments encouraging cooperation among
jurisdictions
[See Strategy 4 and related Policies and Programs as well.]](https://image.slidesharecdn.com/seeingtheforestandthetrees-170117141634/75/Seeing-the-Forest-and-the-Trees-34-2048.jpg)