SlideShare a Scribd company logo
1 of 71
Download to read offline
HDFC HUL ITC SBI TCS
1,073.90 0.47 % 741.25 0.91 % 355.15 0.79 % 2460.45 V - 1.70 % 2524.60
+ 5.05 + 6.65 + 2.80 -42.55
ANALYSIS OF
MARKET INDICES
AND
COMPONENT
STOCKS
1
Chapter
No.
Chapter Name Page
No.
1 Market Index- Meaning, Example 2
1.1 Importance of an Index 3
1.2 Essentials of an Index 4
2 BSE INDICES 5
2.1 BSE MID CAP 6
2.1 BSE MID CAP- SECTORIAL
WEIGHTAGE
7
2.3 BSE SMALL CAP 8
2.5 BSE SMALL CAP- SECTORIAL
WEIGHTAGE
9
2.6 THREE YEARLY COMPARISON
AGAINST SENSEX
10
Index
3 SECTORIAL INDICES 11
3.1 S&P BSE AUTO INDEX 12
3.2 S&P BSE BANEx INDEX 16
3.3 S&P BSE IT INDEX 20
3.4 S&P BSE CD INDEX 24
3.5 S&P BSE CG INDEX 28
3.6 S&P BSE OIL & GAS INDEX 32
3.7 S&P BSE FMCG INDEX 36
3.8 S&P BSE HEALTHCARE INDEX 40
3.9 S&P BSE METAL INDEX 44
3.10 S&P BSE POWER INDEX 47
3.11 S&P BSE REALTY INDEX 50
3.12 S&P BSE TECK INDEX 54
3.13 SECTORS WITH HIGEST & LOWEST
RETURN
57
4 BROAD INDICES 58
4.1 THEMATIC INDICES 59
4.2 S&P BSE PSU INDEX 60
4.3 VOLATILITY INDICES 61
4.4 STRATEGY INDICES 62
5 PERSONAL INTERVIEW 64
6 CONCLUSION (OBSERVATION) 67
Bibliography/Reference 68
Meaning: An aggregate value produced by combining several stocks or other investment vehicles
together and expressing their total values against a base value from a specific date.
Market indices are intended to represent an entire stock market and thus track the market's changes
over time.
An index is a sample of stocks that provide a glimpse at the broader market. When someone says
that market is up 100 points, they are actually referring to the index.
The market indices are classified as Global & National.
A 'world' or 'global' stock market index includes typically large
companies without regard for where they are domiciled or traded.
A 'national' index represents the performance of the stock market of a
given nation—and reflects the investor sentiment on the state of its
economy. The most regularly quoted market indices are national indices
composed of the stocks of large & heavily traded companies listed on
a nation's largest stock exchanges, such as the Sensex & Nifty.
Other indices may be regional such as the FTSE Developed Europe Index
or the FTSE Developed Asia Pacific Index.
A stock market index or just ‘index’ is a number that measures the
relative value of a group of stocks. As the stocks in this group change
value, the index also changes value. If an index goes up by 1% then that
means the total value of the securities which make up the index have
gone up by 1% in value.
The most common index such as the SENSEX, is made up of stocks but there are indices of bonds,
real estate and others. Usually the index value is in terms of ‘points’ – as in “the SENSEX dropped
500 points today”. This means that the index went from a value of perhaps 25000 points to a value
of 24500 points. The points don’t mean anything – the best way to look at an index number is to
compare it with a previous value such as the previous day’s number.
EXAMPLE
The ABC index is made up of four companies. As of the end of yesterday’s trading day the ABC index
was set at 4,123 points. Today, two of the companies went up in value, one company dropped in
price and the fourth company stayed the same – the total value of those stocks went up by 2% so
the ABC index is now 2% higher or 4205 point.
Chp.1Market Index
2
1.1 IMPORTANCE OF MARKET INDEX
Stock market indices are vital to macroeconomists, financial economists as well as actors in
financial world. Consistent indices are essential to assess long term regularities that help in
understanding the behaviour of financial actors, the evolution of the economy, and to make
international comparisons. Financial indices are also useful for traders and investors seeking for
summary, accurate, easily and rapidly available information on stock markets. History shows that
a great variety of indices has been created in order to measure the performance of stock markets.
This variety grew especially rapidly in the recent years.
Although the stock market is much more dynamic than the indexes suggest, along with the fact
that there are different ways to calculate the indexes, causing calculation bias, the stock market
indexes are useful in a number of ways to stock investors.
First, the market indexes provide an historical perspective of stock market performance, giving
investors more insight into their investment decisions. Investors who do not know which
individual stocks to invest in can use indexing as a method of choosing their stock investments.
By wanting to match the performance of the market, investors can invest in index mutual funds
or index exchange-traded funds (ETFs) that track the performance of the indexes with which they
are aligned. This form of investing gives investors the opportunity to do as well as the markets
and not significantly underperform the markets.
The second benefit of stock market indexes is that they provide a yardstick with which investors
can compare the performance of their individual stock portfolios. Individual investors with
professionally managed portfolios can use the indexes to determine how well their managers are
doing in managing their money.
The third major use of stock market indexes is as a forecasting tool. Studying the historical
performance of the stock market indexes, you can forecast trends in the market.
Stock indices are termed as leading economic indicators as they indicate what is going to happen
in the economy in the future. The returns generated in the stock market are based on future
expectations. The future streams of expected returns from the companies are discounted to arrive
at their present value known as market price.
Traditionally, indices have been used as information sources. By looking at an index we know
how the market is faring. This information aspect also figures in the applications of stock market
indices in economic research. This is particularly valuable when an index reflects highly updated
information and the index is a lead indicator of how the overall portfolio will fare. In recent
years, indices have shown direct applications in finance, in the form of index funds and index
derivatives.
Hedging using index derivatives has become a central part of risk management in the modern
economy. These applications are now a multi-trillion dollar industry worldwide, and they are
critically linked up to market indices.
3
A stock market index should capture the behaviour of the overall equity market.
Movements of the index should represent the returns obtained by “typical” portfolios in the
country. The ups & downs reflect the changing expectations of the stock market about future
dividends of India's corporate sector. When the index goes up, it is because the stock market
thinks that the prospective returns in the future will be better than previously thought.
When prospects of returns in the future become pessimistic, the index drops. The ideal index
gives us instant-to-instant readings about how the stock market perceives the future of India's
corporate sector.
The basic idea of an index is that every stock price moves for two possible reasons: news about
the company (e.g. a product launch, or the closure of a factory, etc.) or news about the country
(e.g. nuclear bombs, or a budget announcement, etc.). The job of an index is to purely capture the
second part, the movements of the stock market as a whole (i.e. news about the country). This is
achieved by averaging. Each stock contains a mixture of these two elements - stock news and
index news. When we take an average of returns on many stocks, the individual stock news tends
to cancel out. On any one day, there would be good stock specific news for a few companies and
bad stock-specific news for others. In a good index, these will cancel out, and the only thing left
will be news that is common to all stocks. The news that is common to all stocks is news about
India. That is what the index will capture.
The most important type of market index is the broad-market index, consisting of the large, liquid
stocks of the country. In most countries, a single major index dominates benchmarking, index
funds, index derivatives and research applications.
In addition, more specialised indices often find interesting applications. In India, we have seen
situations where a dedicated industry fund uses an industry index as a benchmark. In India, where
clear categories of groups exist, it becomes interesting to examine the performance of classes of
companies sorted by such group.
The indices are basically divided into the following types:
1. Benchmark Indices. For instance, Sensex & Nifty.
2. Indices based on Market Capitalization. Ex. Large Cap, Mid Cap & Small Cap.
3. Indices based on the different Sectors/Industries. Ex. Automobiles, Banks, etc.
4. Indices based on the stocks they hold. Ex. BSE 100, BSE 200 & BSE 500.
5. Indices based on the types of companies that form it. Ex. BSE PSU Index, CNX MNC index.
6. Benchmark Global Indices. Ex. MSCI Global Index.
Indices can also be differed based on the methodology by which they are calculated.
1.2 Essentials of an Index
1.3 Types of an Index
4
• THE ABOVE GIVEN FLOWCHART DESCRIBES THE SEGREGATION OF INDICES BY THE BSE. THESE INDICES ARE ACTIVELY
CALCULATED & COMPUTED.
BSE INDICES
BROAD
SENSEX
MID CAP
SMALL CAP
BSE 100
BSE 200
BSE 500
THEMATIC
BSE PSU
INFRASTRUCTURE
BSE CPSE
BSE 500 SHARIAH
SECTORAL
BSE AUTO
BSE BANKEX
BSE CD
BSE CG
BSE FMCG
BSE IT
BSE METAL
BSE POWER
BSE REALTY
BSE TECK
VOLATILITY
REAL VOL MTH 1
REAL VOL MTH 2
REAL VOL MTH 3
STRATEGY
BSE IPO
BSE SME IPO
BSE DOLLEX 30
BSE DOLLEX 100
BSE DOLLEX 200
BSE DOLLEX 100
FUTURES
BSE SENSEX FUTURES
TR
BSE SENSEX FUTURES
(USD)
5
Chp. 2
The constituent stocks of the S&P BSE MID CAP Index lie between large cap stocks and small cap
stocks. Mid cap stocks are those that generally have a market capitalization within the range of Rs.50
and Rs.200 billion.
These represent mid-sized companies that are relatively more risky than large cap as investment
options yet, they are not considered as risky as small cap companies.
They rank between the two extremes on all the important parameters like size, revenues, employee
and client base. .
When one invests in mid cap for the long term, he may be investing in companies that could become
tomorrow's runaway success stories.
*The above given chart shows the performance of the S&P BSE MID CAP Index over the period of
last one year. The following table shows the returns by the MID Cap Index over different tenures.
Duration Returns Duration Returns
1 Year 63.20% 3 Years 71.10%
2 Years 69.40% YTD 62.22%
• The Index has given considerably good returns over different tenures. The same can be
expected for the coming time.
No. Of Constituents 279 Launch Date April 11, 2005
S&P BSE MID CAP
7000
7500
8000
8500
9000
9500
10000
10500
11000
11500
12000
12500
13000
DATES
MID CAP
6
2.1
Banking & Finance, 19.54%,
Engineering, 11.21%
Chemicals, 8.41%
Pharmaceuticals, 7.21%,
Services, 6.79%
Automotive, 6.50%
Telecom, 5.66%
Manufacturing, 4.86%
Technology, 4.46%
Cement, 3.70%
Consumer Non Durables,
3.19%
Real Estate, 3.17%, 3%
Utilities, 2.56%, 3%
Media, 2.49%, 3%
Oil & Gas, 2.21%, 2%
Conglomorates, 1.94%, 2%
Food & Beverages, 1.70%, 2%
Miscellaneous, 1.69%, 2% Consumer Durables, 1.68%, 2%
Metaks & Mining, 0.24%, 0%
Tobaco, 0.29%, 0%
SECTORAL WEIGHTAGE
Banking & Finance Engineering Chemicals Pharmaceuticals
Services Automotive Telecom Manufacturing
Technology Cement Consumer Non Durables Real Estate
Utilities Media Oil & Gas Conglomorates
Food & Beverages Miscellaneous Consumer Durables Metaks & Mining
Tobaco
7
2.2
Small cap companies have smaller revenue and client bases, and usually include the start-ups or
companies in the early stage of development. Small cap stocks are potentially big gainers as they
are yet to be discovered within the sector and can show growth potential in large numbers once
unfurled in the market. However, as these enterprises are small ventures, these should be
researched properly.
This is considering that a lot of small companies do not have the financial strength to survive bad
times and some of them might be mismanaged businesses run by greedy promoter
*The above given chart shows the performance of the S&P BSE MID CAP Index over the
period of last one year.
The following table shows the returns by the MID Cap Index over different tenures.
Duration Returns Duration Returns
1 Year 70.80% 3 Years 67.50%
2 Years 80.20% YTD 73.79%
• This Index like the MID Cap Index has given considerably good or even returns over different
tenures. The same can be expected for the coming time.
No. Of Constituents 485 Launch Date April 11, 2005
S&P BSE SMALL CAP
6000
6500
7000
7500
8000
8500
9000
9500
10000
10500
11000
11500
12000
12500
DATES
SMALL CAP
8
2.3
Manufacturing, 12.68%
Banking & Finance, 9.47%,
Cement, 9.15%
Engineering, 8.53%
Chemicals, 7.83%
Technology, 7.12%
Pharmaceuticals, 6.13%,
Automotive, 6.05%
Metaks & Mining, 5.88%, 6%
Services, 5.44%
Miscellaneous, 5.22%, 5%
Food & Beverages, 4.07%, 4%
Real Estate, 3.25%, 3%
Media, 2.98%, 3%
Consumer Durables, 1.72%, 2%
Conglomorates, 1.44%, 1%
Telecom, 1.26%
Utilities, 0.78%, 1%
Consumer Non Durables, 0.57%Oil & Gas, 0.31%, 0%
Tobaco, 0.08%, 0%
SECTORAL WEIGHTAGE
Manufacturing Banking & Finance Cement Engineering
Chemicals Technology Pharmaceuticals Automotive
Metaks & Mining Services Miscellaneous Food & Beverages
Real Estate Media Consumer Durables Conglomorates
Telecom Utilities Consumer Non Durables Oil & Gas
Tobaco
9
2.4
75
95
115
135
155
175
3 Yearly Comparison against Sensex
SENSEX SMALL CAP MID CAP
10
2.5
Sector indices enable investors to benchmark the performance of stocks grouped by specific
market sectors or industries. It empowers investors to make more selective choices, and listed
companies to better track progress relative to their respective peer group.
SECTORIAL INDICES
AUTO
The Auto Index is designed to reflect the
behaviour and performance of the Automobiles
sector which includes manufacturers of cars &
motorcycles, heavy vehicles, auto ancillaries,
tyres, etc. The Index comprises of 13 stocks that
are listed on the Bombay Stock Exchange.
FMCG
FMCGs (Fast Moving Consumer Goods) are those
goods and products, which are non-durable,
mass consumption products and available off
the shelf. The S&P BSE FMCG Index comprises of
12 companies who manufacture such products
which are listed on the Bombay Stock Exchange.
BANKEX
The Bank Index is an index comprised of the
most liquid and large capitalised Indian Banking
stocks. It provides investors and market
intermediaries with a benchmark that captures
the capital market performance of Indian
Banks.The index will have 12 stocks from the
banking sector which trade on the Bombay Stock
Exchange.
REALTY
Real estate sector in India is witnessing
significant growth. Further necessitated, one can
witness plenty of opportunities in real estate
sector backed by favorable tax regime. IISL has
developed the CNX Realty Index to synergize
these emerging opportunities along with their
Index expertise creating new investment avenues
for investors.
METAL
The Metal Index is designed to reflect the
behavior and performance of the Metals
sector including mining. The Index
comprises of 15 stocks that are listed on
the Bombay Stock Exchange.
Pharmaceuticals sector is one of the key
sectors where Indian companies have
created a global brand for themselves
besides software. BSE has developed the
Healthcare Index to capture the
performance of the 17 companies in this
sector.
HEALTHCARE
IT
Companies in this index are those that
havemore than 50% of their turnover from
IT related activities like IT Infrastructure , IT
Education and Software Training ,
Telecommunication Services and
Networking Infrastructure, Software
Development, Hardware Manufacturer’s,
Vending, Support and Maintenance.
OIL&GAS
Oil & Gas sector is universally recognized
as one of the most significant inputs for
economic growth. The Index will include
companies belonging to Petroleum & Gas
production & processing.
The BSE Oil & Gas Index comprises of 10
such companies.
11
Chp.3
The Auto Index is designed to reflect the behaviour and performance of the Automobiles
sector which includes manufacturers of cars & motorcycles, heavy vehicles, auto
ancillaries, tyres, etc. The Index comprises of 13 stocks that are listed on the Bombay
Stock Exchange.
The BSE Auto Index is computed using free float market capitalization method with a
base date of February 1, 1999 indexed to a base value of 1000, wherein the level of
the index reflects the total free float market value of all the stocks in the index relative
to particular base market capitalization value. The method also takes into account
constituent changes in the index and importantly corporate actions such as stock splits,
right issue, new issue of shares etc. without affecting the index value.
Index Details
INDEX NAME AUTOMOTIVE
ESTABLISHMENT DATE FEBRUARY 1, 1999
LISTING DATE AUGUST 23, 2004
NO. OF CONSTITUENTS (COMPANIES) THIRTEEN (13)
The constituents of the S&P BSE Auto Index are as follows:
COMPANY WEIGHT MARKET CAP
TATA MOTORS 22.95% 170,953.60
MARUTI SUZUKI INDIA 14.94% 111,311.95
BOSCH 11.50% 85,679.45
MAHINDRA & MAHINDRA 10.37% 77,270.10
BAJAJ AUTO 8.07% 60,126.75
HERO MOTOCORP 7.08% 52,773.72
EICHER MOTORS 5.94% 44,229.33
MOTHERSON SUMI SYSTEMS 5.82% 43,358.61
BHARAT FORGE 4.17% 31,047.37
CUMMINS INDIA 3.39% 25,234.90
MRF 2.37% 17,640.71
EXIDE INDUSTRIES 2.19% 16,349.75
APOLLO TYRES 1.21% 8,933.38
*The above table indicates the constituents with their respective market capitalization & the weight
that they currently hold in the index.
S&P BSE AUTO INDEX
12
3.1
Auto Index Weightage
Auto Index Performance
*The above given chart indicates the performance of the Auto Index/Sector during the previous one year.
TATA MOTORS,
22.95%
MARUTI SUZUKI,
14.94%
BOSCH, 11.50%M&M, 10.37%BAJAJ AUTO, 8.07%
HERO MOTOCORP,
7.08%
EICHER, 5.94%
MOTHERSON SS,
5.82%
BHARAT FORGE, 4.17%
CUMMINS INDIA, 3.39% MRF, 2.37% EXIDE IND., 2.19%
APOLLO TYRES,
1.21%
WEIGHT
12000
13000
14000
15000
16000
17000
18000
19000
20000
21000
DATES
AUTO
13
Auto Index Sub Sectorial Weightage
Auto Index Performance (Returns) in comparison to SENSEX
*The above given chart indicates the performance of the Auto Index in comparison to BSE’s Benchmark
Index SENSEX.
2 & 3 WHEELER,
14.94%
CARS & JEEPS,
24.96%
LCVs & HCVs,
29.88%
TRACTORS, 7.46%
ANCILLARIES,
19.24%
TYRES, 3.52%
WEIGHT
100
110
120
130
140
150
160
170
DATES
AUTO (TR) SENSEX (TR)
14
*The values are in terms of Billion USD.
Growth Potential
By 2020, India's share in the global passenger vehicle market to double to 8 per cent from 4 per cent
over 2010–11.
Two–wheeler sales to rise from 15.9 million in FY2013 to 34.0 million by FY 2020.
Passenger vehicle sales to increase from 3.2 million in FY2013 to 8.6 million in FY 2021/
Cost Efficiency
India has significant cost advantages; auto firms save 10-25 per cent on operations vis-à-vis Europe
and Latin America.
A large pool of skilled manpower and a growing technology base would induce greater investments.
Opportunities
The large ultra low-cost car segment has opened up potentially. Innovation is likely to intensify
among engine technology and alternative fuels.
Policy Support
The government aims to develop India as a global manufacturing as well as R&D hub.
There has been a wide array of policy support in the form of sops, taxes and FDI encouragement.
Auto market in India
Key Factors
30.1
39.9 42.4 40.6
0
10
20
30
40
50
2010 2011 2012 2013
Revenue Of Auto Industry
REVENUE
1.8
2.4
3
3.1
3.2
2009
2010
2011
2012
2013
0 1 2 3 4
FDI Trends
15
The Indian banking Industry has been undergoing major changes, reflecting a number of underlying
developments. Advancement in communication and information technology has facilitated growth
in internet-banking, ATM Network, Electronic transfer of funds and quick dissemination of
information. Structural reforms in the banking sector have improved the health of the banking sector.
The reforms recently introduced include the enactment of the Securitization Act to step up loan
recoveries, establishment of asset reconstruction companies, initiatives on improving recoveries from
Non-performing Assets (NPAs) and change in the basis of income recognition has raised
transparency and efficiency in the banking system. Spurt in treasury income and improvement in
loan recoveries has helped Indian Banks to record better profitability. BSE BankEx Index is an index
comprised of the most liquid and large capitalised Indian Banking stocks. It provides investors and
market intermediaries with a benchmark that captures the capital market performance of Indian
Banks. The index comprises of 12 stocks from the banking sector which trade on the Bombay Stock
Exchange.
Index Details
INDEX NAME BANKEX
ESTABLISHMENT DATE JANUARY 1, 2002
LISTING DATE AUGUST 9, 2003
NO. OF CONSTITUENTS (COMPANIES) ELEVEN (11)
The constituents of the S&P BSE BANKEX Index are as follows:
COMPANY WEIGHT MARKET CAP
HDFC BANK LTD. 23.90% 261,265.37
STATE BANK OF INDIA LTD. 19.18% 209,674.18
ICICI BANK LTD. 17.51% 191,404.98
AXIS BANK LTD. 12.35% 134,996.19
KOTAK MAHINDRA BANK LTD. 9.48% 103,581.90
INDUSIND BANK LTD. 4.24% 46,318.60
BANK OF BARODA LTD. 3.52% 38,432.65
YES BANK LTD. 3.07% 33,552.56
PUNJAB NATIONAL BANK LTD. 2.75% 30,078.97
CANARA BANK LTD. 1.68% 18,385082
BANK OF INDIA LTD. 1.27% 13,879.24
FEDERAL BANK LTD. 1.06% 11,634.33
*The above table indicates the constituents with their respective market capitalization & the weight
that they currently hold in the index.
S&P BSE BANKEX INDEX
16
3.2
BankEx Index Weightage
BankEx Index Performance
*The above given chart indicates the performance of the BankEx Index/Sector during the previous one year.
HDFC BANK LTD.,
23.90%
SBI LTD., 19.18%
ICICI BANK, 17.51%
AXIS BANK, 12.35%
KOTAK MAHINDRA,
9.48%
INDUSIND BANK, 4.24%
BANK OF BARODA ,
3.52%
YES BANK, 3.07%
PNB LTD., 2.75%
CANARA BANK LTD., 1.68%
BOI LTD., 1.27%
FEDERAL BANK LTD.,
1.06%
WEIGHT
13000
14000
15000
16000
17000
18000
19000
20000
21000
22000
23000
24000
DATES
AUTO
17
BankEx Index Sub Sectorial Weightage
BankEx Index Performance (Returns) in comparison to SENSEX
*The above given chart indicates the performance of the BankEx Index in comparison to BSE’s Benchmark
Index SENSEX.
100
110
120
130
140
150
160
170
180
DATES
BANKEX (TR) SENSEX (TR)
PRIVATE SECTOR,
71.59%
PUBLIC SECTOR,
28.41%
WEIGHT
18
*The values are in terms of USD Billion.
Growing Demand
Increase in working population and growing disposable incomes will raise demand for banking and
related services.
Housing and personal finance are expected to remain key demand drivers.
Rural banking is expected to witness growth in the future.
Opportunities
Mobile, Internet banking and extension of facilities at ATM stations to improve operational efficiency.
Vast un-banked population highlights scope for innovation in delivery.
Policy Support
Healthy regulatory oversight and credible Monetary Policy by the Reserve Bank of India (RBI) have
lent strength and stability to the country’s banking.
Bank market in India
Key Factors
742
896
916
991
1029
0 500 1000 1500
FY 10
FY 11
FY 12
FY 13
FY 14
Growth In Credit Off- Take in India
489
665
822
763 1030
1180
1170
1274 1312
0
200
400
600
800
1000
1200
1400
2006 2007 2008 2009 2010 2011 2012 2013 2014
Growth In Deposits
GROWTH
19
Information Technology (IT) industry has played a major role in the Indian economy
during the last few years. A number of large, profitable Indian companies today belong
to the IT sector and a great deal of investment interest is now focused on the IT sector.
In order to have a good benchmark of the Indian IT sector, BSE has developed the BSE
IT sector index. BSE IT provides investors and market intermediaries with an
appropriate benchmark that captures the performance of the IT segment of the market.
Companies in this index are those that have more than 50% of their turnover from IT
related activities like IT Infrastructure , IT Education and Software Training ,
Telecommunication Services and Networking Infrastructure, Software Development,
Hardware Manufacturer’s, Vending, Support and Maintenance.
Index Details
INDEX NAME INFORMATION TECHNOLOGY
ESTABLISHMENT DATE (BASE YEAR) FEBRUARY 1, 1999
LISTING DATE AUGUST 9, 1999
NO. OF CONSTITUENTS (COMPANIES) SEVENTEEN (17)
The constituents of the S&P BSE IT Index are as follows:
COMPANY WEIGHT MARKET CAP
TATA CONSULTANCY SERVICES LTD. 42.62% 505,550.26
INFOSYS LTD. 21.46% 254.553.15
WIPRO LTD. 13.27% 157,398.89
HCL TECH. LTD. 11.93% 141,437.61
TECH MAHINDRA LTD. 5.71% 67,706.35
ORACLE FS SOFTWARE LTD. 2.34% 27,773.21
MINDTREE LTD. 0.98% 11,586.20
MPHASIS LTD. 0.69% 8,173.43
VAKRANGEE LTD. 0.51% 6,014.31
CMC LTD. 0.49% 5,855.48
*The above table indicates the constituents with their respective market capitalization & the weight
that they currently hold in the index.
The following table shows the returns by the IT Index over different tenures.
Duration Returns Duration Returns
1 Year 29.50% 3 Years 90.00%
2 Years 70.00% YTD 27.97%
S&P BSE IT INDEX
20
3.3
IT Index Weightage
Information Technology Index Performance
*The above given chart indicates the performance of the IT Index/Sector during the previous one year.
TCS, 42.62%
INFOSYS, 21.46%
WIPRO, 13.27%
HCL TECH., 11.93%
TECH MAHINDRA ,
5.71%
ORACLE FS SOFTWARE,
2.34%
MINDTREE, 0.98% MPHASIS, 0.69%
VAKRANGEE, 0.51%
CMC, 0.49%
WEIGHT
8000
8500
9000
9500
10000
10500
11000
11500
12000
12500
DATES
IT
21
IT Index Sub Sectorial Weightage
IT Index Performance (Returns) in comparison to SENSEX
*The above given chart indicates the performance of the IT Index in comparison to BSE’s Benchmark Index
SENSEX.
90
100
110
120
130
140
DATES
IT (TR) SENSEX (TR)
SOFTWARE, 99.00%
HARDWARE, 1.00%WEIGHT
22
*The values are in terms of Billion USD.
Growth Potential
The IT-BPM sector in India expanded at a CAGR of 25 per cent over 2000–13, which is 3–4 times
higher than the global IT-BPM spend, and is estimated to expand at a CAGR of 9.5 per cent to
USD300 billion by 2020
India is the world’s largest sourcing destination, accounting for approximately 52 per cent of the
USD124–130 billion market. The country’s cost competitiveness in providing IT services, which is
approximately 3-4 times cheaper than the US continues to be its USP in the global sourcing market.
India’s highly qualified talent pool of technical graduates is one of the largest in the world, facilitating
its emergence as a preferred destination for outsourcing, Computer science/information technology
accounts for the biggest chunk of India' fresh engineering talent pool, with more than 98 per cent
of the colleges offering this stream.
Cost Efficiency
Cost savings of 60–70 per cent over source countries.
A preferred destination for IT & ITeS in the world; continues to be a leader in the global sourcing
industry with 52 per cent market share.
Policy Support
Tax holidays extended to the IT sector
SEZ scheme since 2005 to benefit IT companies with single window approval mechanism, tax
benefits, etc.
Setting up Information Technology Investment Regions (ITIRs).
IT market in India
Key Factors
47 50 59 69 76
22
24
29
32
32
0
20
40
60
80
100
120
2010 2011 2012 2013 2014
Market Size Of IT Industry
Export Import
57.923.5
18.6
Sector Wise Break Up of Export
Revenue (%)
IT Services BPM Software & Engg.
23
India is expected to become the fifth largest consumer durables market in the world
by 2025. Also, the consumer electronics market is expected to increase to US$ 400
billion, while production could reach US$ 104 billion by 2016.
The expected market size of consumer durables in India by 2015 is US$ 12.5 billion.
Urban markets account for about 65 per cent of total revenues in the consumer
durables sector in the country. The rural and semi-urban markets are likely to
contribute a majority of consumer sales as the rural consumer durables market is
growing at the compound annual growth rate (CAGR) of 25 per cent.
The index comprises of 10 stocks from the banking sector which trade on the Bombay
Stock Exchange.
Index Details
INDEX NAME CD
ESTABLISHMENT DATE (BASE YEAR) FEBRUARY 1, 1999
LISTING DATE AUGUST 9, 1999
NO. OF CONSTITUENTS (COMPANIES) ELEVEN (11)
The constituents of the S&P BSE CD Index are as follows:
COMPANY WEIGHT MARKET CAP
TITAN COMPANY LTD. 44.65% 35,472.05
WHIRPOOL INDIA LTD. 11.21% 8908.18
SYMPHONY LTD. 9.65% 7663.44
RAJESH EXPORTS LTD. 7.10% 5643.18
PC JEWELLER LTD. 6.86% 5450.91
VIDEOCON INDUSTRIES LTD. 6.50% 5160.70
BLUE STAR LTD. 5.30% 4210.07
TTK PRESTIGE LTD. 3.67% 2913.93
BAJAJ ELECTRICALS LTD. 2.75% 2185.03
VIP INDUSTRIES LTD. 1.74% 1386.15
GITANJALI GEMS 0.58% 458.71
*The above table indicates the constituents with their respective market capitalization & the weight
that they currently hold in the index.
The following table shows the returns by the CD Index over different tenures.
Duration Returns Duration Returns
1 Year 69.00% 3 Years 52.80%
2 Years 49.90% YTD 77.99%
S&P BSE CD INDEX
24
3.4
CD Index Weightage
CD Index Performance
*The above given chart indicates the performance of the CDIndex/Sector during the previous one year.
TITAN, 44.65%
WHIRPOOL,
11.21%
SYMPHONY, 9.65%
RAJESH EXPORTS,
7.10%
PC JEWELLER, 6.86%
VIDEOCON, 6.50%
BLUE STAR, 5.30%
TTK PRESTIGE, 3.67%
BAJAJ ELECTRICALS, 2.75%
VIP INDUSTRIES, 1.74%
WEIGHT
6000
6500
7000
7500
8000
8500
9000
9500
10000
10500
11000
DATES
CD
25
CD Index Sub Sectorial Weightage
CD Index Performance (Returns) in comparison to SENSEX
*The above given chart indicates the performance of the CD Index in comparison to BSE’s Benchmark Index
SENSEX.
100
110
120
130
140
150
160
170
180
DATES
CD (TR) SENSEX (TR)
MISCELLANEOUS, 44.89%
CONSUMER GOODS, 24.66%
DIAMOND CUTTING &
JEWELLERY, 14.04%
DOMESTIC APPLIANCES, 8.12%
ELECTRONIC GOODS, 6.53% PLASTICS, 1.76%
WEIGHT
26
*The values are in terms of USD Billion.
Growth Potential & Growing Demand
By 2025, India would rise from the twelfth position to the fifth position in the consumer durables
market in the world. The market is expected to reach USD 12.5 billion by the end of FY 15.
India has become one of the largest growing electronics market in the world.
By 2020, the electronics market in India is expected to increase to USD 400 billion from USD 69.6
billion in 2012. The production is expected to reach USD 104 billion by 2016.
Demand growth is likely to accelerate with rising disposable incomes and easy access to credit.
Increasing electrification of rural areas and wide usability of online sales would also aid growth in
demand.
Opportunities
Huge untapped rural market; currently there is only 2 per cent penetration for refrigerators and 0.5
per cent for washing machines.
Rural and semi-urban markets currently contribute 35 per cent to total sales; their combined size is
set to post a CAGR of 25 per cent over 2010-15.
Policy Support
100 per cent FDI allowed in the electronics hardware-manufacturing sector under the automatic
route; Approval of 51 per cent in multi-brand would further fuel the growth in this sector.
National Electronic policy (2012) to boost investment in the sector.
15.7 17.8 21.3 24.2
30.2 34.8 36.8
47.3
103.7
0
20
40
60
80
100
120
2006 2007 2008 2009 2010 2011 2012 2015 2020
REVENUE
CD market in India
Key Factors
65%
35%
Share in the CD Market in India
Urban Rural
27
The Indian Capital Goods sector has witnessed a remarkable growth over the last few
years driven by increased investments in infrastructure and industrial production. The
engineering sector, being closely associated with the manufacturing and infrastructure
sectors of the economy, is of strategic importance to India’s economy.
The index comprises of 10 stocks from the banking sector which trade on the Bombay
Stock Exchange.
Index Details
INDEX NAME CG
ESTABLISHMENT DATE (BASE YEAR) FEBRUARY 1, 1999
LISTING DATE AUGUST 9, 1999
NO. OF CONSTITUENTS (COMPANIES) TWENTY ONE (21)
The constituents of the S&P BSE CG Index are as follows:
COMPANY WEIGHT MARKET CAP
LARSEN & TUBRO 34.90% 157,425.98
BHEL LTD. 13.81% 62,315.90
SIEMENS LTD. 11.33% 51,102.13
ABB INDIA LTD. 6.20% 27,978.22
BHARAT ELECTRONICS LTD. 5.90% 26,601.60
HAVELLS INDIA LTD. 4.06% 18,803.74
THERMAX LTD. 3.34% 15,065.33
AISTOM T&D INDIA LTD. 3.21% 14,493.71
OTHERS (12 Companies) 17.24% 77,821.19
*The above table indicates the constituents with their respective market capitalization & the weight
that they currently hold in the index.
The following table shows the returns by the CG Index over different tenures.
Duration Returns Duration Returns
1 Year 52.50% 3 Years 63.90%
2 Years 78.90% YTD 69.33%
S&P BSE CG INDEX
28
3.5
CG Index Weightage
CG Index Performance
*The above given chart indicates the performance of the CD Index/Sector during the previous one year.
L&T, 34.90%
BHEL, 13.81%SIEMENS, 11.33%
ABB INDIA, 6.20%
BHEL, 5.90%
HAVELLS, 4.06%
THERMAX, 3.34%
AISTOM T&D, 3.21%
OTHERS (12 Cos), 17.24%
WEIGHT
11000
11500
12000
12500
13000
13500
14000
14500
15000
15500
16000
16500
17000
17500
18000
18500
DATES
CG
29
CG Index Sub Sectorial Weightage
CG Index Performance (Returns) in comparison to SENSEX
*The above given chart indicates the performance of the CG Index in comparison to BSE’s Benchmark Index
SENSEX.
100
110
120
130
140
150
160
170
DATES
CG (TR) SENSEX (TR)
INFRASTRUCTURE, 72.76%
ELECTRIC
EQUIPMENT, 6.42%
ENGINE & ABRASIVES, 5.88%
BEARINGS, 3.21%
HEAVY ENGINEERING, 2.62%
ELECTRICALS, 2.30%
TUBES & PIPES, 1.36%
WEIGHT
30
*The values are in terms of Billion USD.
Growth Potential
Capital goods & engineering turnover expected to reach USD125.4 billion by 2017 from USD57.6
billion in 2012.
Electrical equipment market size forecasted to reach USD105 billion by 2022 from USD24.2 billion in
2011.
ER&D revenues projected to reach USD45 billion in 2020 from USD11.2 billion in 2012.
Construction equipment market projected to reach USD22.7 billion by 2020 from USD3 billion in
2012.
Telecom equipment market to reach USD37 billion by 2020 from USD16 billion in 2011.
Production of CPSE under DHI to aggregate USD10.7 billion by 2015 from USD9.3 billion in 2012-
13.
Opportunities
Nuclear capacity expansion to provide significant business opportunities to the electrical
machinery industry.
Rapid increase in infrastructure investment and industrial production to fuel further growth.
Policy Support
Cumulative FDI at USD19.4 billion over April 2000–March 2014 due to policy support.
De-licensed engineering sector; 100 per cent FDI permitted.
CG market in India
Key Factors
33.7
40.5
32.6
49.8
58.6
56.8
62.33
0 20 40 60 80
2008
2009
2010
2011
2012
2013
2014
India's Engineering Exports
Export
32.5
26.8
17.7
9
14.1
Sector Wise Break Up of Export
Revenue (%)
Transport Equipment
Machinery
Equipment
Maanufactures of
metals
Primary iron & steel
others
31
Oil & Gas sector is universally recognized as one of the most significant inputs for
economic growth. The Index will include companies belonging to Petroleum & Gas
production & processing. The BSE Oil & Gas Index comprises of 10 such companies.
Index Details
INDEX NAME OIL & GAS
ESTABLISHMENT DATE (BASE YEAR) FEBRUARY 1, 1999
LISTING DATE AUGUST 23, 2004
NO. OF CONSTITUENTS (COMPANIES) TEN (10)
The constituents of the S&P BSE OIL & GAS Index are as follows:
COMPANY WEIGHT MARKET CAP
RELIANCE INDUSTRIES LTD. 32.10% 275,082.08
OIL & NATURAL GAS CORP. LTD. 31.34% 268,513.74
INDIAN OIL CORP. LTD. 9.59% 82,186.11
BHARAT PETROLEUM CORP. LTD. 6.17% 56,540.46
GAIL INDIA LTD. 5.73% 49,115.55
CAIRN INDIA LTD. 4.94% 42,315.00
OIL INDIA LTD. 3.41% 29,211.91
CASTROL INDIA LTD. 2.74% 23,449.62
HINDUSTAN PETROLEUM CORP. LTD. 2.46% 21,062.79
PETRONET LNG LTD. 1.52% 13,053.75
*The above table indicates the constituents with their respective market capitalization & the weight
that they currently hold in the index.
The following table shows the returns by the OIL & GAS Index over different tenures.
Duration Returns Duration Returns
1 Year 2.50% 3 Years 8.80%
2 Years 6.10% YTD 6.66%
S&P BSE OIL & GAS INDEX
32
3.6
Oil & Gas Index Weightage
Oil & Gas Index Performance
*The above given chart indicates the performance of the OIL&GAS Index/Sector during the previous one
year.
RIL, 32.10%
ONGC, 31.34%INDIAN OIL, 9.59%
BPCL, 6.17%
GAIL, 5.73%
CAIRN INDIA, 4.94%
OIL INDIA, 3.41%
CASTROL INDIA, 2.74%
HPCL, 2.46%
PETRONET LNG, 1.52% WEIGHT
8500
9000
9500
10000
10500
11000
11500
12000
12500
DATES
OIL & GAS
33
Oil & Gas Index Sub Sectorial Weightage
Oil&Gas Index Performance (Returns) in comparison to SENSEX
*The above given chart indicates the performance of the Oil & Gas Index in comparison to BSE’s Benchmark
Index SENSEX.
100
110
120
130
140
DATES
OIL & GAS (TR) SENSEX (TR)
OIL DRILLING & EXPLORATION, 48.63%
REFINERIES, 51.37%
WEIGHT
34
*The values are in terms MBPD (Million Barrels
Per Day).
Growth Potential
India’s energy demand is expected to double to 1,464 MTOE by 2035 from 595 MTOE in 2013.
Moreover, the country’s share in global primary energy consumption is projected to increase two
fold by 2035.
Oil consumption is estimated to reach 4.0 mbpd by FY16, expanding at a CAGR of 3.2 per cent during
FY08–FY16F. By 2025, India is expected to overtake Japan to become the third-largest consumer of
oil.
LNG imports accounted for about one-fourth of total gas demand. India's gas demand is estimated
to more than double over the next five years.
Supply & Demand
Due to the expected strong growth in demand, India’s dependency on oil imports is likely to increase
further. With rising income levels, demand for automobile is estimated to increase.
In FY14, imports accounted for approximately 80 per cent of the country’s total oil demand.
Backed by new oil fields, domestic oil output is anticipated to grow to 1.0 mbpd by FY16.
Demand is not likely to simmer down any time soon, given strong economic growth and rising
urbanisation. Gas consumption is likely to expand at a CAGR of 21.0 per cent during FY 2008– 2017.
Policy Support
Government has enacted various policies such as the New Exploration Licensing Policy
(NELP) and Coal Bed Methane (CBM) policy to encourage investments across the industry’s value
chain.
Oil & Gas market in India
Key Factors
4
3.7
3.7
3.5
3.3
0 1 2 3 4 5
2016
2014
2013
2012
2011
Oil Consumption (MBPD)
REVENUE
3.5 3.6 3.8 4 4.1
2.9 3
1.1 1.2 0.8
1.7 1.8 1.2
1
0
2
4
6
8
2010 2011 2012 2013 2014 2015
Imports & Domestic Oil
Production
IMPORTS OIL PRODUCTION
35
FMCGs (Fast Moving Consumer Goods) are those goods and products, which are non-
durable, mass consumption products and available off the shelf. The S&P BSE FMCG
Index comprises of 12 companies who manufacture such products which are listed on
the Bombay Stock Exchange.
The index is computed using free float market capitalization method with the base
period as December, 1995 indexed to a base value of 1000 wherein the level of the
index reflects total free float market value of all the stocks in the index relative to a
particular base market capitalization value. The method also takes into account
constituent changes in the index and importantly corporate actions such as stock splits,
rights, new issue of shares etc. without affecting the index value.
Index Details
INDEX NAME FMCG
ESTABLISHMENT DATE FEBRUARY 1, 1999
LISTING DATE AUGUST 9, 1999
NO. OF CONSTITUENTS (COMPANIES) TWELVE (12)
The constituents of the S&P BSE FMCG Index are as follows:
COMPANY WEIGHT MARKET CAP
ITC 33.73% 271,592.95
HINDUSTAN UNILEVER LTD. 25.31% 203,805.32
NESTLE INDIA LTD. 8.73% 70,262.70
UNITED SPIRITS LTD. 6.39% 51,466.44
DABUR INDIA LTD. 5.93% 47,706.87
GODREJ CONSUMER PRODUCTS LTD. 4.75% 38,267.64
COLGATE PALMOLIVE LTD. 3.49% 28,122.76
BRITANNIA INDIA LTD. 3.21% 25,877.41
EMAMI LTD. 3.03% 24,385.48
MARICO LTD. 2.93% 23,609.57
JUBILANT FOODWORKS LTD. 1.29% 10,418.06
TATA GLOBAL BEVERAGES 1.19% 9,575.92
*The above table indicates the constituents with their respective market capitalization & the weight
that they currently hold in the index.
S&P BSE FMCG INDEX
36
3.7
FMCG Index Weightage
FMCG Index Performance
*The above given chart indicates the performance of the FMCG Index/Sector during the previous one year.
ITC, 33.73%
HUL, 25.31%NESTLE, 8.73%
UNITED SPIRITS,
6.39%
DABUR INDIA,
5.93%
GSPL, 4.75%
COLGATE
PALMOLIVE, 3.49%
BRITANNIA, 3.21%
EMAMI, 3.03%
MARICO, 2.93%
JUBILANT FOODWORKS,…
TATA GLOBAL
BEVERAGES, 1.19%
WEIGHT
6500
7000
7500
8000
8500
9000
DATES
FMCG
37
FMCG Index Sub Sectorial Weightage
FMCG Index Performance (Returns) in comparison to SENSEX
*The above given chart indicates the performance of the Auto Index in comparison to BSE’s Benchmark Index
SENSEX.
100
110
120
130
140
DATES
FMCG (TR) SENSEX (TR)
PERSONAL CARE,
45.47%
BREWERIES &
DISTELLERIES, 6.40%
TOBACCO, 33.73%
FOOD PROCESSING,
11.92%
PLANTATIONS, 1.19%
MISCELLANEOUS,
1.29%WEIGHT
38
*The values are in terms of Billion USD.
Growth Potential
Overall FMCG market expected to increase at a CAGR of 14.7 per cent to USD110.4 billion during
2012– 2020.
The rural FMCG market expected to increase at a CAGR of 17.7 per cent to USD100 billion during
2012–2025. The overall rural FMCG consumption continues to grow at 12.5 per cent during 2013-14.
Total consumption expenditure to reach nearly USD 3,600 billion by 2020 from USD 1,328 billion in
2012.
Organised retail share is expected to double to 14-18 per cent of the overall retail market by 2015.
Opportunities
Low penetration levels in rural market offers room for growth.
Growing demand for premium products.
Exports is another growth segment.
Policy Support
Investment approval of up to 10 percent foreign equity in Single brand retail & 51 percent in multi
brand retail.
Initiatives like Food Security Bill & Direct Cash Transfer subsidies reach about 10% of households in
India.
The minimum capitalisation for foreign FMCG companies to invest in India is USD 100 million.
FMCG market in India
Key Factors
647
824.9
544.1
1131.7
1176.7
774.3
829.6
827.7
1102
1011.9
0 200 400 600 800 1000 1200 1400
ITC(Foods)
HUL (F&B)
MARICO
DABUR
GCPL
Increasing Sales of Top FMCG Cos.
FY 13 FY 14
411
516
631
0
200
400
600
800
Annual Per Capita Disposable
Income level in Rural Region
(USD)
2010 2015 2020
Rise in rural consumption to drive
the FMCG market
39
Pharmaceuticals sector is one of the key sectors where Indian companies have created
a global brand for themselves besides software. Indian companies have taken
advantage of the opportunities in the regulated generics market in the western
countries and made deep inroads especially in providing low cost equivalents of
expensive drugs. Pharma outsourcing into India and low cost Healthcare services are
expected to be the key areas of growth in the near future. In addition, the inherent
potential of biotechnology has also attracted many new companies and this is also a
key growth area for Indian companies. BSE has developed BSE Healthcare Index to
capture the performance of the companies in this sector.
Index Details
INDEX NAME HEALTHCARE
ESTABLISHMENT DATE (BASE YEAR) FEBRUARY 1, 1999
LISTING DATE AUGUST 9, 1999
NO. OF CONSTITUENTS (COMPANIES) SEVENTEEN (17)
The constituents of the S&P BSE HEALTHCARE Index are as follows:
COMPANY WEIGHT MARKET CAP
SUN PHARMA LTD. 30.91% 209,636.51
CUPIN LTD. 12.44% 84,392.01
Dr. REDDY’s INDUSTRIES LTD. 8.48% 57,479.31
CIPLA LTD. 8.34% 56,540.46
RANBAXY LAB. LTD. 4.98% 33,770.01
AURBINDO PHARMA LTD. 4.94% 33,481.61
CARDILA HEALTHCARE LTD. 4.78% 32,391.92
GSK PHARMA LTD. 4.12% 27,975.14
DIVIS LAB. LTD. 3.47% 23,548.52
GLENMARK PHARMA LTD. 3.37% 22,832.15
WOCKHARDT LTD. 2.91% 19,709.65
APOLLO HOSPITALS LTD. 2.83% 19,172.82
TORRENT PHARMA LTD. 2.73% 18,484.75
PIRAMAL ENTERPRISES LTD. 2.16% 14,665.02
IPCA LABS. LTD. 1.36% 9,224.59
BIOCON LTD. 1.26% 8,529.00
STRIDES ACROLAB LTD. 0.94% 6,372.02
*The above table indicates the constituents with their respective market capitalization & the weight
that they currently hold in the index.
S&P BSE HEALTHCARE INDEX
40
3.8
Healthcare Index Weightage
Healthcare Index Performance
*The above given chart indicates the performance of the Health Index/Sector during the previous one year.
SUN PHARMA,
30.91%
CUPIN, 12.44%
Dr. REDDY’s Ind., 8.48%CIPLA, 8.34%
RANBAXY LAB., 4.98%
AURBINDO PHARMA,
4.94%
CARDILA
HEALTHCARE, 4.78%
GSK PHARMA, 4.12%
DIVIS LAB., 3.47%
GLENMARK PHARMA, 3.37%
WOCKHARDT, 2.91%
APOLLO HOSPITALS, 2.83%
TORRENT PHARMA, 2.73%
PIRAMAL ENT., 2.16%
IPCA LABS., 1.36%
BIOCON, 1.26%
STRIDES ACROLAB, 0.94%
WEIGHT
9000
9500
10000
10500
11000
11500
12000
12500
13000
13500
14000
14500
15000
15500
16000
16500
17000
17500
DATES
HEALTHCARAE
41
Healthcare Index Sub Sectorial Weightage
Healthcare Index Performance (Returns) in comparison to SENSEX
*The above given chart indicates the performance of the Healthcare Index in comparison to BSE’s Benchmark
Index SENSEX.
100
110
120
130
140
150
160
170
180
DATES
HEALTHCARE (TR)
PHARMACEUTICALS,
97.18%
MEDICAL SERVICES,
2.82%
WEIGHT
42
*The values are in terms of USD Billion.
Growth Potential
Indian pharmaceutical sector accounts for about 2.4 per cent of the global pharmaceutical industry
in value terms and 10 per cent in volume terms.
The country’s pharmaceutical industry is expected to expand at a CAGR of 14.5 per cent over to
reach USD55 billion by 2020.
The generics market is expected to grow to USD26.1 billion by 2016 from USD11.3 billion in 2011;
India’s generics market has immense potential for growth.
Indian healthcare sector, one of the fastest growing sectors, is expected to advance at a CAGR of 17
per cent to reach USD280 billion over 2011–20.
Cost Efficiency
India’s cost of production is approximately 60 per cent lower than that of the US and almost half of
that of Europe
Due to lower cost of treatment, India is emerging as a leading destination for medical tourism.
Policy Support
Government unveiled ‘Pharma Vision 2020’ aimed at making India a global leader in end-to-end
drug manufacture.
Reduced approval time for new facilities to boost investments.
In this sector, 100 per cent FDI is allowed under automatic route.
Healthcare market in India
Key Factors
6
14
55
0
10
20
30
40
50
60
2004 2014 2020
REVENUE GROWTH
REVENUE
5
7
9
10
8
1.1 1.2 1.7 1.8
1.2
0
2
4
6
8
10
12
2010 2011 2012 2013 2014
TRADE GROWTH
EXPORTS IMPORTS
43
The BSE Metal Index is designed to reflect the behavior and performance of the Metals
sector including mining. The Index comprises of 15 stocks that are listed on the Bombay
Stock Exchange.
Index Details
INDEX NAME METAL
ESTABLISHMENT DATE (BASE YEAR) FEBRUARY 1, 1999
LISTING DATE AUGUST 23, 2004
NO. OF CONSTITUENTS (COMPANIES) NINE (09)
The constituents of the S&P BSE METAL Index are as follows:
COMPANY WEIGHT MARKET CAP
COAL INDIA LTD. 41.83% 230,57.65
HINDUSTAN ZINC LTD. 12.94% 71,238.56
SESA STERLITE LTD. 10.53% 57,989.42
NMDC LTD. 9.45% 52,056.51
TATA STEEL LTD. 5.76% 31,715.04
SAIL LTD. 5.10% 28,108.22
HINDALCO INDUSTRIES LTD. 4.94% 27,195.79
JSW STEEL LTD. 4.13% 22,766.40
JINDAL STEEL & POWER 3.10% 17,044.66
NACL LTD. 2.21% 12,164.57
*The above table indicates the constituents with their respective market capitalization & the weight
that they currently hold in the index.
The following table shows the returns by the Metal Index over different tenures.
Duration Returns Duration Returns
1 Year 9.60% 3 Years -18.80%
2 Years 5.20% YTD -2.55%
S&P BSE METAL INDEX
44
3.9
Metal Index Weightage
Metal Index Performance
*The above given chart indicates the performance of the Metal Index/Sector during the previous one year.
COAL INDIA LTD., 41.83%
HINDUSTAN ZINC
LTD., 12.94%
SESA STERLITE LTD.,
10.53%
NMDC LTD., 9.45%
TATA STEEL LTD.,
5.76%
SAIL LTD., 5.10%
HINDALCO INDUSTRIES
LTD., 4.94%
JSW STEEL LTD., 4.13%
JINDAL STEEL & POWER, 3.10% NACL LTD., 2.21%WEIGHT
8500
9000
9500
10000
10500
11000
11500
12000
12500
13000
13500
14000
14500
DATES
METAL
45
Metal Index Sub Sectorial Weightage
Metal Index Performance (Returns) in comparison to SENSEX
*The above given chart indicates the performance of the Metal Index in comparison to BSE’s Benchmark Index
SENSEX.
100
110
120
130
140
150
160
170
DATES
METAL (TR) SENSEX (TR)
MINING & MINERALS,
61.92%
STEEL LARGE, 15.02%
NON FERROUS METAL,
12.80%
ALUMINIUM, 7.16%
SPONGE STEEL, 3.10%
WEIGHT
46
At Present in power sector nearly half i.e., 49.15% is under State electricity Boards, which is followed
by Public Sector Unit’s like NTPC, NHPC, etc. The role of private sector is about 19.85%, which is at
present least among the three sectors, but private sector is growing at a far greater pace than any
other sector, the latest advancements in this direction are allotment of UMPP’s to private sector.
Energy sector is universally recognized as one of the most significant inputs for economic growth.
The growth of a nation, encompassing all sectors of the economy and all sections of society, is
contingent on meeting its energy requirements adequately.
As a fast-growing economy, India has become one of the largest energy intensive countries in the
World. Energy is a crucial input for India's development process. The need of the hour, therefore, is
to meet the energy needs of all segments of India's population in the most efficient and cost-
effective manner while ensuring long-term sustainability.
Index Details
INDEX NAME POWER
ESTABLISHMENT DATE (BASE YEAR) JANUARY 3, 2005
LISTING DATE JANUARY 9, 2007
NO. OF CONSTITUENTS (COMPANIES) NINETEEN (29)
The constituents of the S&P BSE POWER Index are as follows:
COMPANY WEIGHT MARKET CAP
NTPC LTD. 24.75% 131,556.31
PGCI LTD. 14.43% 76,695.11
BHEL LTD. 11.72% 62,315.90
SIEMENS LTD. 9.61% 51,102.13
ABB INDIA LTD. 5.26% 27,978.22
NHPC LTD. 4.09% 21,753.87
TATA POWER LTD. 4.06% 21,555.86
JSW ENERGY LTD. 3.57% 18,958.98
RELIANCE POWER LTD. 3.06% 16,276.37
OTHERS (10 Companies) 19.45% 103,382.44
*The above table indicates the constituents with their respective market capitalization & the weight
that they currently hold in the index
The following table shows the returns by the POWER Index over different tenures.
Duration Returns Duration Returns
1 Year 37.40% 3 Years -2.20%
2 Years 26.20% YTD 30.35%
S&P BSE POWER INDEX
47
3.10
Power Index Weightage
Power Index Performance
*The above given chart indicates the performance of the Power Index/Sector during the previous one year.
NTPC, 24.75%
PGCI, 14.43%
BHEL, 11.72%SIEMENS, 9.61%
ABB INDIA, 5.26%
NHPC, 4.09%
TATA POWER, 4.06%
JSW ENERGY , 3.57%
RELIANCE POWER , 3.06%
OTHERS (10 Cos), 19.45% WEIGHT
1400
1600
1800
2000
2200
2400
2600
DATES
POWER
48
Power Index Sub Sectorial Weightage
Power Index Performance (Returns) in comparison to SENSEX
*The above given chart indicates the performance of the Power Index in comparison to BSE’s Benchmark
Index SENSEX.
100
110
120
130
140
150
DATES
POWER (TR) SENSEX (TR)
GENERATION & DISTRIBUTION, 63.92%
INFRASTRUCTURE,
30.92%
EQUIPMENT &
TRANSMISSION, 4.73%
WEIGHT
49
Real estate sector in India is witnessing significant growth. Recent dynamics of the
market reflected the opportunity of creating wealth across real estate companies, as
proven by recent listings of real estate companies resulting into prominent growth in
public funds and private equity.
The main growth thrust is coming due to favorable demographics, increasing purchasing
power, existence of customer friendly banks & housing finance companies,
professionalism in the real estate sector and favourable reforms initiated by the
government to attract global investors.
Further necessitated by the thrust of redevelopment of old buildings, building townships
and redeveloping mill lands, one can witness plenty of opportunities in real estate sector
backed by favourable tax regime. BSE has developed the BSE Realty Index to synergize
these emerging opportunities along with their Index expertise creating new investment
avenues for investors.
Index Details
INDEX NAME REALTY
ESTABLISHMENT DATE (BASE YEAR) FEBRUARY 2, 2005
LISTING DATE JULY 9, 2007
NO. OF CONSTITUENTS (COMPANIES) THIRTEEN (13)
The constituents of the S&P BSE BANKEX Index are as follows:
COMPANY WEIGHT MARKET CAP
DLF LTD. 30.28% 28,065.36
NBCC LTD. 13.03% 12,072.00
PRESTIGE ESTATE LTD. 10.63% 9,851.25
OBEROI REALTY LTD. 9.96% 9,230.05
GODREJ PROPERTIES LTD. 5.71% 5,287.72
PHOENIX MILLS LTD. 5.69% 5,271.66
UNITECH LTD. 5.49% 5,088.70
HDIL LTD. 5.02% 4,650.90
SOBHA LTD. 4.62% 4,279.34
INDIABULLS REAL ESTATE LTD. 3.39% 3,138.46
OMAXE LTD. 2.63% 2,438.06
MAHINDRA LIFESPACES LTD. 2.21% 2,049.58
ANANT RAJ LTD. 1.35% 1,248.27
*The above table indicates the constituents with their respective market capitalization & the weight
that they currently hold in the index.
S&P BSE REALTY INDEX
50
3.11
Realty Index Weightage
Realty Index Performance
*The above given chart indicates the performance of the REALTY Index/Sector during the previous one year.
DLF LTD., 30.28%
NBCC LTD.,
13.03%PRESTIGE ESTATE,
10.63%
OBEROI REALTY,
9.96%
GODREJ PROPERTIES,
5.71%
PHOENIX MILLS, 5.69%
UNITECH LTD., 5.49%
HDIL LTD., 5.02%
SOBHA LTD.,…
INDIABULLS RE LTD., 3.39%
OMAXE LTD., 2.63%
MAHINDRA
LIFESPACES, 2.21%
ANANT RAJ LTD., 1.35%
WEIGHT
1000
1100
1200
1300
1400
1500
1600
1700
1800
1900
2000
2100
2200
2300
DATES
REALTY
51
Realty Index Sub Sectorial Weightage
Realty Index Performance (Returns) in comparison to SENSEX
*The above given chart indicates the performance of the Realty Index in comparison to BSE’s Benchmark
Index SENSEX.
100
110
120
130
140
150
160
170
180
DATES
REALTY (TR) SENSEX (TR)
CONSTRUCTION &
CONTRACTING,
73.60%
CIVIL CONSTRUCTION,
7.70%
GENERAL INFRASTRUCTURE,
13.30%
WEIGHT
52
*The values are in terms MBPD (Million Barrels Per Day).
Growth Potential
FDI in the sector is estimated to grow to USD25 billion in 10 years.
The number of Indians living in urban areas will increase from the current 377 million to about 600
million by 2031.
India construction market is expected to more than double to USD649.5 billion by 2020 from USD360
billion in 2010.
Supply & Demand
Growing requirements of space from sectors such as education and healthcare.
Growth in tourism providing opportunities in the hospitality sector.
Policy Support
Allocation of USD1.3 billion for rural housing and USD0.7 billion for NHB to increase the flow of
cheaper credit for affordable housing for urban poor as per Budget 2014-15.
The government has allowed FDI of up to 100 per cent in development projects for townships and
settlements.
Realty market in India
Key Factors
230
165
400
775
105
245
270
315
0 500 1000
Ahemdabad
Pune
Bengaluru
NCR
Kolkata
Mumbai
Hydrebad
Chennai
Demand Analysis 2014- 2017 ('000 units)
5.9
9.2
8.6
0
2
4
6
8
10
FY 13FY 12FY 11
FDI in Realty Sector (%)
53
The decade of 1990s saw the emergence of the TMT sector as a major force in the
Indian economy. The remarkable growth of this sector was reflected in the financial
markets. Going by the trading pattern, around 19% of the turnover on the stock
exchanges is taking place in TMT sector stocks. These stocks collectively account for
15% of the total market capitalization. The investment interest in technology stocks
continues unabated. Recognizing the growing importance of the TMT sector, S&P BSE
TECk index was launched in 2001.
Index Details
INDEX NAME TECK
ESTABLISHMENT DATE (BASE YEAR) APRIL 2, 2001
LISTING DATE JULY 11, 2001
NO. OF CONSTITUENTS (COMPANIES) TWENTY NINE (29)
The constituents of the S&P BSE TECK Index are as follows:
COMPANY WEIGHT MARKET CAP
TATA CONSULTANCY SERVICES LTD. 31.33% 505,550.26
INFOSYS LTD. 15.78% 254.553.15
BHARTI AIRTEL LTD. 9.92% 160,035.91
WIPRO LTD. 9.76 157,398.89
HCL TECH. LTD. 8.77% 141,437.61
BHARTI INFRATEL LTD. 4.55% 42,315.00
TECH MAHINDRA LTD. 4.20% 67,706.35
IDEA CELLULAR LTD. 4.06% 23,449.62
ZEE ENTERTAINMENT ENTERPRISE LTD. 2.05% 21,062.79
OTHERS (20 Companies) 9.62% 153,224.96
*The above table indicates the constituents with their respective market capitalization & the weight
that they currently hold in the index.
The following table shows the returns by the TECK Index over different tenures.
Duration Returns Duration Returns
1 Year 28.70% 3 Years 76.90%
2 Years 62.20% YTD 26.10%
S&P BSE TECK INDEX
54
3.12
TECK Index Weightage
Teck Index Performance
*The above given chart indicates the performance of the Teck Index/Sector during the previous one year.
TCS, 31.33%
INFOSYS, 15.78%
BHARTI AIRTEL,
9.92%
WIPRO, 9.76%
OTHERS (20 Cos.),
9.62%
HCL TECH., 8.77%
BHARTI INFRATEL ,
4.55%
TECH MAHINDRA, 4.20%
IDEA CELLULAR, 4.06%
ZEE ENT., 2.05%
WEIGHT
4500
5000
5500
6000
6500
7000
DATES
TECK
55
TECK Index Sub Sectorial Weightage
TECK Index Performance (Returns) in comparison to SENSEX
*The above given chart indicates the performance of the TECK Index in comparison to BSE’s Benchmark Index
SENSEX.
90
100
110
120
130
140
DATES
TECK (TR) SENSEX (TR)
COMPUTER SOFTWARE, 73.26%
TELECOM SERVICE,
16.00%
MEDIA &
ETERTAINMENT,
5.27%
TELECOM EQUIPMENT, 4.70% CABLES, 0.28%
WEIGHT
56
#Figures in Percentage. # Data for past three years ending February, 2015.
HEALTHCARE, 66.5
AUTO, 53.4
IT, 29.5
CG, 52.5
BANKEx, 55.4
109.1
82.4
70
78.9
59.2
160.2
92.4
90
63.9
74.9
0 20 40 60 80 100 120 140 160 180
HEALTHCARE
AUTO
IT
CG
BANKEx
THREE YEARS
TWO YEARS
ONE YEAR
Sectors that gave the highest return
Sectors that lagged in the past years
Oil & Gas, 2.5
Metals, 9.6
Realty, 26.6
Power, 37.4
6.1
5.2
-15.7
26
8.8
-18.8
-8
-2.2
-20 -15 -10 -5 0 5 10 15 20 25 30 35 40
Oil & Gas
Metals
Realty
Power
Three Year
Two Year
One Year
57
3.13
S&P BSE 100 Index is a broad based Index. This Index has 1983-84 as the base year and was launched
in 1989. In line with the shift of the S&P BSE Indices to the globally accepted Free-Float
methodology, S&P BSE 100 was shifted to Free-Float methodology effective from April 5, 2004. The
method of computation of Free-Float index and determination of free-float factors is similar to the
methodology for S&P BSE SENSEX.
Over the years, the number of companies listed on BSE continued to register a phenomenal increase;
from 992 in to over 3,200 companies by March 1994, with combined market capitalization rising
from Rs.5,421 crore to Rs. 3,98,432 crore as on 31st March, 1994.
Though S&P BSE SENSEX (1978-79=100) was serving the purpose of quantifying the price
movements as also reflecting the sensitivity of the market in an effective manner, the rapid growth
of the market necessitated compilation of a new broad-based index series reflecting the market
trends in a more effective manner and providing a better representation of the increased equity
stocks, market capitalization as also to the new industry groups. As such, BSE launched on 27th May
1994, two new index series S&P BSE 200 and S&P Dollex 200.
The equity shares of 200 selected companies from the specified and non-specified lists of BSE were
considered for inclusion in the sample for `S&P BSE 200'. The selection of companies was primarily
been done on the basis of current market capitalization of the listed scrips. Moreover, the market
activity of the companies as reflected by the volumes of turnover and certain fundamental factors
were considered for the final selection of the 200 companies.
BSE Limited constructed a new index, christened S&P BSE-500, consisting of 500 scrips w.e.f.
August 9, 1999. The changing pattern of the economy and that of the market were kept in mind
while constructing this index.
S&P BSE 500 index represents nearly 93% of the total market capitalization on BSE. S&P BSE 500
covers all 20 major industries of the economy. In line with other S&P BSE indices, effective August
16, 2005 calculation methodology was shifted to the free-float methodology.
BSE 100 INDEX
BSE 200 INDEX
BSE 500 INDEX
BROAD INDICES
58
4.0
BSE PSU Index consists of major Public Sector Undertakings listed on Bombay Stock Exchange (BSE).
BSE PSU Index was launched on June 4, 2001 to track the performance of listed equity of PSU
companies. A benchmark for the Indian Central Government to monitor its wealth in PSUs.
The index uses base date of February 1, 1999 and a base value of 1000. The index consists of all
Public Sector Undertaking (PSUs) companies in BSE-500 index. BSE PSU Index shows change in the
wealth of Indian Central Government in PSUs.
Companies in which Indian Central Government has greater than or equal to 51% stake that are
listed in the BSE PSU Index and they should also be a part of BSE-500 Index.
The S&P BSE India Infrastructure Index is designed to measure the performance of the top 30
Indian infrastructure companies that meet benchmarking and investMENT ability requirements,
with the goal of providing liquid and tradable exposure to this sector comprising of five
infrastructure clusters:
• ENERGY
• TRANSPORTATION
• NON BANKING FINANCIAL INSTITUTIONS
• TELECOMMUNICATIONS
• UTILITIES
The CPSE Index tracks returns generated by the state-owned companies, barring public sector
banks. The CPSE Index will track returns generated by state-owned companies where the direct
holding of the government is 51 per cent or more. The indices were developed by Asia Index
Private Ltd, a joint venture between BSE and the S&P Dow Jones Indices.
BSE PSU
BSE INFRASTRUCTURE
BSE CPSE
THEMATIC INDICES
59
4.1
Different types of Public Enterprises
1. CPSEs (Central Public Sector Enterprises) – Companies where the direct holding of the Central
Government or of other CPSEs is 51% or more
2. PSBs (Public Sector Banks) – Banks where the direct holding of the Central/State Government or
other PSBs is 51% or more
3. SLPEs (State Level Public Enterprises) – Companies where the direct holding of the State
Government or other SLPEs is 51% or more
Background and History
In 1947, when India became independent, there were various socio-economic problems confronting
the country which needed to be dealt with in a planned and systematic manner. India at that time
was primarily an agrarian economy with a weak industrial base, low level of savings, inadequate
investments and lack of infrastructure facilities. There existed considerable inequalities in income
and levels of employment, glaring regional imbalances in economic development and lack of trained
manpower. As such, the State’s intervention in all the sectors of the economy was desirable and
inevitable since private sector neither had the resources, managerial and scientific skill, nor the will
to undertake the risks associated with large, long-gestation investments.
Given the type and range of problems faced by the country on the economic, social and strategic
fronts, it became a pragmatic compulsion to use the public sector as an instrument for self-reliant
economicgrowth.
The dominant consideration for the continued large investments in public sector enterprises was to
accelerate the growth of core sectors of economy; to serve the equipment needs of strategically
important sectors like Railways, Telecommunications, Nuclear Power, Defense etc. and to provide a
springboard for the economy to achieve a significant degree of self-sufficiency in the critical sectors.
The rationale for setting up public enterprises was to ensure easier availability of vital articles of mass
consumption, to introduce checks on prices of important products, help promote emerging areas
like tourism, etc. A large number of enterprises were created out of "Sick Units" taken over from the
private sector inter alia, to protect the interests of the workers. A number of public enterprises were
created to operate in national and international trade, consultancy, contract and construction
services.
INDEX NAME PSU
ESTABLISHMENT DATE (BASE YEAR) FEBRUARY 1, 1999
LISTING DATE JUNE 4, 2001
NO. OF CONSTITUENTS (COMPANIES) SIXTY (60)
The following table shows the returns by the PSU Index over different tenures.
Duration Returns Duration Returns
1 Year 31.10% 3 Years 0.90%
2 Years 13.50% YTD 31.95%
BSE PSU INDEX
60
4.2
The first of its kind in India, the SENSEX Realized Volatility (REALVOL) Index provides market
participants with an accurate measure of the historic volatility of the SENSEX over fixed 1-, 2-, and
3-month time horizons, which are synchronized with BSE’s 1-, 2-, and 3- month futures & options
expiration cycles. Each index is reset at the end of its respective cycle.
The SENSEX REALVOL will be a useful tool for option writers attempting to manage their risk, as their
P&L is driven by the difference between realized volatility and implied volatility over the life of
options written. Products based on the REALVOL family of indices will allow Indian traders to hedge
against sudden price movements (i.e. reducing Gamma exposure) and to take directional bets on the
realized volatility of the SENSEX.
Volatility modelling has traditionally relied on complex econometric procedures in order to
accommodate the inherent latent character of volatility. Realized volatility is an important metric that
provides market participants an accurate measure of the historical volatility of the underlying over
the life cycle of the derivative contract. Over the last decade, investors have extensively used volatility
as a trading asset. The negative correlation between equity market returns and volatility has been
well documented and thus volatility provides a significant diversification benefit to an investment
portfolio. The mechanics of the realized vol. index are simple – we compute daily realized variance
simply by summing squared returns. The theory of quadratic variation reveals that, under suitable
conditions, realized volatility is not only an unbiased ex-post estimator of daily return volatility, but
also asymptotically free of measurement error.
• RVI Is considered a useful complement to the VIX because RVI captures realized volatility while
the VIX measures implied volatility. • Derivative contracts on RVI can be used for hedging gamma
exposures and for directional bets on volatility. • The skew needed to price out-of-the-money
options can now be computed on a realized vs. implied basis • With the advent of volatility and
covariance swaps in the OTC market, realized volatility itself is now the underlying. Such swaps are
useful for, among others, holders of options who wish to hedge their holdings, i.e., offset the
impact of changes in volatility on the value of their positions. • Improved volatility and correlation
forecasts will also be useful for portfolio allocation and risk management. • Swap contracts on
realized variance have now been trading over the counter for some years with a fair degree of
liquidity. More recently, derivatives whose payoffs are nonlinear functions of realized variance have
also begun to trade over the counter. In particular, a natural outgrowth of the variance swap
market is an interest in volatility swaps, which are essentially forward contracts written on the
square root of realized variance.
BSE REAL VOL MTH 1,2,3
VOLATILITY INDICES
Applications of Realized Volatility Index
61
4.3
BSE introduced the new index series - S&P BSE IPO index to track the current primary market
conditions in the Indian capital market and measure the growth in investor’s wealth within a period
of two years after listing of a company subsequent to successful completion of initial public offering
(IPO). Robust growth of the Indian economy, 6.7% in 2008-09, and the expectation of higher growth
in the future are expected to boost the primary market. For this and other reasons, it was an
appropriate time to introduce to the market an indicator that will track primary market conditions in
the Indian capital market.
BSE on August 24, 2009 announced the launch of S&P BSE IPO index to track the value of companies
for two years after listing subsequent to successful completion of their initial public offering (IPO).
BSE continued to introduce index innovations with the launch of the IPO index, by introducing ceiling
(capping) on weightings of index constituents. Market capitalisation weightings of index constituents
is limited to 20%. If a constituent’s market capitalization results in a higher weighting, the company’s
weight is suitably adjusted to ensure that all constituents are restricted to 20% in the index. However,
between any rebalancing, weightage of any index constituent can exceed 20%.
The Micro, Small and Medium Enterprises (MSMEs) segment in India plays a pivotal role in the
overall growth and development of economy of the country. In recent years the MSME segment
has consistently registered higher growth rate compared to the overall industrial sector. With its
agility and dynamism, the segment has shown admirable innovativeness and adaptability to survive
the recent economic downturn and recession.
BSE has introduced BSE SME IPO index on December 14, 2012. It will enable investors to track
performance of the SME companies listed at BSE.
All BSE indices reflect the growth in the market value of the constituent stocks over the base period
in Rupee terms. A need was felt to design a yardstick by which these growth values are also
measured in Dollar terms. Such an index would reflect, in one value, the changes in both the stock
prices and the foreign exchange variation.
This was facilitated by the introduction of a dollar-linked index in which the formula for calculation
of the index is suitably modified to express the current and the base market values in dollar terms.
The scope for the dollar-linked index emerged from the background of the Indian equity markets
increasingly getting integrated with the global capital markets and the need to assess the market
movements in terms of international benchmarks.
BSE IPO
STRATEGY INDICES
BSE SME IPO
BSE DOLLEX 30, 100, 200, 500
62
4.4
The dollar-linked indices are useful to overseas investors, as it helps them measure their ‘real
returns’ after providing for the exchange rate fluctuations.
Dollex-30, a dollar linked version of SENSEX, was launched on July 25, 2001 whereas Dollex-200, a
dollar version of BSE 200 was launched on May 27, 1994. These indices were initially calculated at
the end of the trading session by taking into consideration day’s rupee/US$ reference rate as
announced by India’s Central Bank i.e. Reserve bank of India.
BSE introduced Dollex-100, a dollar linked version of BSE-100, on May 22, 2006.
Dollex-30, Dollex-100 and Dollex-200 are calculated and displayed through BSE On-line trading
terminals (BOLT) by taking into account real-time rupee/US$ Exchange rate. The formula for
calculating the index is:
Dollex = (Index Value (In local currency) X Base rupee-US$ rate) ÷ Current rupee-US$ rate
63
PERSONAL INTERVIEW
INTERVIEWEE
DETAILS:
NAME PANKAJ TUKARAM BAGAL
OCCUPATION STOCK BROKER, TRADER, TECHNICAL ANALYST
DESIGNATION FRANCHISEE OWNER
ORGANIZATION SHAREKHAN PVT. LTD.
CONTACT 97681 69958
ADDRESS S 07/ SHOP No. 31, SECOND FLOOR, HAWARE CENTURION MALL,
SECTOR 19 A, SEAWOODS, NERUL, NAVI MUMBAI- 400706.
1. SHOULD INDIVIDUAL STOCKS BE TRACKED ON THE BASIS OF THEIR INDICES?
Pankaj. You can’t track an individual stock based on the basis of their indices, because every single stock
moves based on the information/news that is available in the market and according to the price to volume
action in the market. However, a news about a particular sector/industry can definitely affect all or most
of the stocks in that sectors index.
2. PEOPLE CONSIDER SOME INDICES TO BE EFFECTIVE & OTHERS NOT. WHAT IS YOUR TAKE ON
IT?
Pankaj. Every index is effective. Each index, is basically, a group of companies which represent the entire
market.
So every index is important. Since they represent various segments of the market. Every index has its
process of calculation. I mean, not every stock can be considered according to the index movement
because if we take Sensex as an example, if suppose today, Sensex is up 290 points. You will still find some
companies closing with the negative mark. Which has got nothing to do with the index movement.
3. DOES AN INDEX PROVIDE AN ACCURATE BENCHMARK?
Pankaj. Absolutely. You can always compare your stocks with the index, considering it as the benchmark
to test your returns, your growth. There is something called as Beta or people call it High Beta stock. You
can compare the PE Ratio of the index, which is benchmark, to the PE Ratio of your stock and can take
your decisions accordingly. This will help you know whether the stock is valued right.
4. THERE ARE SEVERAL NUMBER OF INDICES IN THE MARKET. IS IT NECESSARY TO HAVE ALL OF
THEM?
Pankaj. Actually, no. You can only have Sensex & Nifty. These are two indices which are very effective for
you to judge the markets movement.
5. THERE ARE INDICES BASED ON THE NUMBER OF STOCKS THEY HOLD. SUCH AS, BSE 100, BSE 200.
WHAT DIFFERENCE DO THE NUMBERS MAKE?
Pankaj. It means, those number of stocks are part of that index. Like BSE Sensex has 30 stocks, same way,
BSE 100 has the top 100 stocks. They make these indices because what people find that if you have a
broader range of stocks then you can better track the markets movements. Since more companies are
involved in those indices, it will give you data from a broader perspective.
6. FOR BEGINNERS, ARE BENCHMARK INDICES THE RIGHT GROUND TO START WITH?
Pankaj. Yes, because the companies which are listed in the index are the safest for people to invest in the
market.
7. AN INDEX IS MORE OR LESS AN AVERAGE, OR IS THERE ANY OTHER RELEVANCE TO IT?
Pankaj. Its not an average, it is an altogether different & very complex set of calculations. From a lay man’s
eye, they could think it as an average. But it depends on the market cap of the company, the base year,
the base value & a lot of mathematical calculation.
64
5.0
8. CONSIDERING THE MARKET SENTIMENTS THIS YEAR, DO YOU THINK THAT THE SENSEX & NIFTY
COULD APPRECIATE FURTHER?
Pankaj. If you ask me, I have a personal target of 9500 for nifty and 30000 for Sensex.
9. ACCORDING TO YOU, WHICH OF THE TWO IS BETTER, SENSEX OR NIFTY?
Pankaj. I personally don’t follow Sensex much. Why nifty, that is because, since I m a trader, many of my
trades are in futures & options market, the trade on NSE is I feel better than that of BSE. In the end,
everyone has their own choice, own taste. Nothing anti- Sensex. And NSE was the first one to start the
online trade & other innovations on the trading grounds. BSE has just played the catch- up game. Earlier
BSE was just controlled by a dozen or handful of share brokers but adhering to the increased competition
they had to convert into a company be responsible to investors. NSE has really taken the initiative to take
things up.
10. ARE THE PRICES OF THE SAME COMPANY, QUOTED DIFFERENTLY ON NSE & BSE?
Pankaj. It doesn’t happen. Both places, the price moves in the same manner. Earlier there used to be some
difference in price. People used to enter into an arbitrage position in such situations. But I feel it’s a waste
of time. Hardly you get to earn anything except when the volumes are very high.
11. IT IS OBSERVED THAT DIVERSIFICATION YIELD DIMINISHING RETURNS & ILLIQUID STOCKS ARE BEST
KEPT OUT OF AN INDEX. WHAT IS THE MIDDLE ROAD FORWARD?
Pankaj. Illiquid stocks will never be a part of an index. Liquidity means that if I now placed the order, it got
executed. So definitely if it is illiquid it won’t be a part of an index. Whereas, diversification does help
reduce risk for those who want to stay invested for long.
12. WON’T SPECULATORS TRY TO PUSH A STOCK INTO THE INDEX OR REMOVE ONE WHEN THEY
ARE GOING SHORT ON IT?
Pankaj. No. Nobody can do that. Speculators cannot do such a thing to put a stock in or out of an index.
Like I’ll give you an example, L&T is a stock that is listed on both the stock exchanges, their indices. This
stock is currently trading at Rs. 1600 & it has huge volumes of trade around it. The free float equity
available in the market for investors to trade is huge. So for someone to remove it out from Sensex or
Nifty, they will need huge money to do so. In literal terms, it is not possible. The company will have to
itself erode its equity market cap to come out of the index. So no single person or a group of people can
do it.
13. WHAT MEASURES DO THE STOCK EXCHANGE TAKE WHEN THE INDICES BECOME VOLATILE?
Pankaj. They apply their measures called Circuit Breakers. But it has to really move that much for the
circuits to apply. As far as I remember, there has been only one occasion when this had happened, sone 7
years back in 2008, that the markets had crashed terribly & the circuit breakers were applied & the trading
was stopped. That was the time when Sensex had dropped from nearly 20,000 to 8,000.
14. ON WHAT GROUNDS ARE THE INDICES COMPARED WITH EACH OTHER?
Pankaj. For an investor like me, I will just add different sectors to my portal & see the chart movements
as to which one is moving with the Nifty. It is simple, that markets move with the cash flow. If money is
moving into a particular sector, then that sector is gaining. Even sectors have a stock cycle. In our markets
every cycle lasts for around 6 or 7 years, wherein they go through growth phase then they are at peak,
then they slow down & finally end up at lows. Then there are phases like they will move sideways, then
they will move up. These are cycles, so every company, every sector has to go through these cycles. When
you look at them, you can actually see which index the money is flowing to & which sector the money is
being taken out. Based on that you can select.
15. ANY TRIGGERS THAT YOU ARE LOOKING FOR, WHICH COULD GIVE THE MARKETS A BOOST?
Pankaj. There are two things that I’ll be looking for. The first is, the inflation rate & the rate cuts in the
lending rates. The logic is, that when inflation goes down, people money to spend, that is extra cash, this
cash is used for investing in some or the other thing like mutual funds or other instruments, which
ultimately comes to the markets. That will be one of the triggers. Secondly, the interest rates, RBI has
recently come up with rate cuts. They have reduced it to about 75 basis points. Now when the interest
65
rate is cut short, again the same thing happens, your EMIs go down, again you remain with excess cash.
This if you look at for the whole country, that gives you a lot of money, a lot of cash that is saved. When
you have cash in your pocket, you look for investments. When you don’t, you can’t even think about
investing. So these are basically two triggers that I would look for.
16. AT THIS POINT OF TIME, WHAT ADVICE WOULD YOU GIVE TO THE RETAIL INVESTORS?
Pankaj. At this point, the market looks very good. Two people who are driving this market, politically we
have a stable government in the centre & at the same time our RBI governor is a very aggressive man &
has taken some good decisions to boost this market. At the same time, the country’s GDP & other things
are expected to show very good numbers. I’m very confident that since it’s a stable government for four
more years, so we can expect four more financial budgets, which is the biggest event for any market &
the economy. This budget was good, we expect four better budgets to come. Reforms will certainly
happen & a better picture of our markets will be seen. So this market will be in a bull run for a longer
period of time.
17. NOW SINCE THE RALLY IS CONTINUING, ACCORDING TO YOUR EXPERIENCE & YOUR OUTLOOK,
TILL WHAT TIME WILL THE RALLY SUSTAIN?
Pankaj. No one can actually tell you the exact time period. As I understand it, everything has got a cycle.
Any business, any sector, any market has it. In Nifty, the cycle for five years from 2003 to 2008 has been
an uptrend, then for two years it was down, Nifty had an upward breakout again in 2014, so now four
more years are remaining. In the earlier rally, it has been three times up that is from 2200 to 6000. If you
calculate in terms of percentage, it is 300%. Consider 300% from 2014. I see nifty going at 18000 levels in
the next coming 5 to 6 years. I keep on telling my clients since last year but everyone tells me that this
market won’t grow more, it will slide. People kept on telling me 7000, or 7400 then 8000 is the end, but
they are the ones who are missing the bus.
The interview was a very knowledgeable experience. I want to thank Mr. Pankaj T. Bagal for all the
knowledge & experience that he shared & for the time he provided for this interview. Mr.Bagal not just
gave the answers but also showed how the trades are done, like a live trading session. He also suggested
few investment avenues like Nifty Bees & Gold Bees. In the end, knowledge is what I derived from it.
- Abhipray Kumbhare
66
CONCLUSION (OBSERVATION)
While it is time to rejoice at the booming Indian economy and the historical journey of the Sensex
& Nifty, the foremost question in the minds of all investors is whether it is the right time to buy,
hold sell stocks now.
The main things to keep in mind are:
1. Don't be greedy: Invest smartly, with some professional help and some study on your own.
2. Avoid 'hot tips': Use your own judgement.
3. Avoid trading/timing the market: 'timing' leads to huge monetary losses and mental tension.
4. Avoid actions based on sentiments: Don't be emotionally attached to stocks.
5. Don't panic if the market drops: Be patient and hold on to the scrip until some stability prevails
in the market. Consult a professional and then act accordingly.
6. Stay invested, possibly continue to invest more: It is natural to book profits with the markets at
higher levels. This should be done, but we suggest people should also stay invested in the equity
markets. Indian stocks do not appear overstretched at present.
7. Diversify: diversify a bit, looking at stocks, mutual funds, commodities and gold (for a longer-
term). If equities pick up some of these stocks again.
8. Sell when value is realized: Some stocks may rise sooner than you may have anticipated. In a
frenzied bull run, investors may see their target prices being met in a matter of days. Here time
should not be of any consequence.
9. Keep a watch on relative valuations: The real cost of a stock is not the price you pay for it, but
the opportunity cost of not putting your money in another stock with a greater potential to rise.
10. If you realize a mistake, exit: experts emphasize that if investors make mistakes, they should
exit immediately even at a loss.
67
6.0
Bibliography
The various sources of information that were used, are as follows:
Article/Study:
I. Benchmark Indices of Indian Economy; by Rouf Mohommed Mir & Arshad
Nabi Wani.
II. A survey of factors influencing investment decisions: The case of individual
investors at the BSE; by Dr. Vincent Mutswenje
III. Forecasting of Indian stock market index using artificial neural network; by
Manna Majumdar & MD Anwar Hussain.
IV. Analysis of stock indices & their impact on market index; by Piyush Kumar
Singh & Keyur Thaker.
Websites:
i. www.moneycontrol.com
ii. www.ndtvprofit.com
iii. www.bseindia.com
iv. www.edelweiss.in
v. www.asiaindex.co.in
Applications:
 Bing Finance
 Moneycontrol
 BSE India
Newspapers:
 Economic Times
 ET Wealth
News Channels:
 ET Now
Radio Channel:
 100.7 FM Gold (Money Mantra)
68

More Related Content

What's hot

Module iv fixed income securities final
Module iv  fixed income securities finalModule iv  fixed income securities final
Module iv fixed income securities finalSantu Mishra
 
bombay stock exchange by Zabihlucky
bombay stock exchange by Zabihlucky bombay stock exchange by Zabihlucky
bombay stock exchange by Zabihlucky Zabih Lucky
 
Security And Exchange Board (SEBI)
Security And Exchange Board (SEBI)Security And Exchange Board (SEBI)
Security And Exchange Board (SEBI)Anand Kumar
 
Basics of SAPM
Basics of SAPMBasics of SAPM
Basics of SAPMvinvns
 
1st chapter introduction to portfolio mgt
1st chapter introduction to portfolio mgt1st chapter introduction to portfolio mgt
1st chapter introduction to portfolio mgtDasrat goswami
 
1. introduction to securities market
1. introduction to securities market1. introduction to securities market
1. introduction to securities marketAkash Bakshi
 
Development Financial Insistution
Development Financial InsistutionDevelopment Financial Insistution
Development Financial InsistutionShekhar Purnendu
 
Exchange Traded Funds (ETFs)
 Exchange Traded Funds (ETFs) Exchange Traded Funds (ETFs)
Exchange Traded Funds (ETFs)mahadeva prasad
 
fundamental and technical analysis of banking sector in india
fundamental and technical analysis of banking sector in indiafundamental and technical analysis of banking sector in india
fundamental and technical analysis of banking sector in indiaKarthik Ezil
 
Amfi investor awareness programmed
Amfi investor awareness programmedAmfi investor awareness programmed
Amfi investor awareness programmedPrashant Padia
 
Money markets in_india_wcm
Money markets in_india_wcmMoney markets in_india_wcm
Money markets in_india_wcmKierteka Yadav
 
Fundamental analysis and technical analysis
Fundamental analysis and technical analysisFundamental analysis and technical analysis
Fundamental analysis and technical analysisMohammed Umair
 
Factors affecting the investors decision making
Factors affecting the investors decision makingFactors affecting the investors decision making
Factors affecting the investors decision makingAssad Rifat
 
1. introduction basics of investments.ppt
1. introduction   basics of investments.ppt1. introduction   basics of investments.ppt
1. introduction basics of investments.pptNavneet Jingar
 
Portfolio management process
Portfolio management processPortfolio management process
Portfolio management processNagarjuna Kalluru
 
Investment Analysis and Portfolio Management
Investment Analysis and Portfolio ManagementInvestment Analysis and Portfolio Management
Investment Analysis and Portfolio ManagementBabasab Patil
 

What's hot (20)

Module iv fixed income securities final
Module iv  fixed income securities finalModule iv  fixed income securities final
Module iv fixed income securities final
 
bombay stock exchange by Zabihlucky
bombay stock exchange by Zabihlucky bombay stock exchange by Zabihlucky
bombay stock exchange by Zabihlucky
 
Fundamental analysis
Fundamental analysisFundamental analysis
Fundamental analysis
 
Security And Exchange Board (SEBI)
Security And Exchange Board (SEBI)Security And Exchange Board (SEBI)
Security And Exchange Board (SEBI)
 
Basics of SAPM
Basics of SAPMBasics of SAPM
Basics of SAPM
 
Stock market
Stock marketStock market
Stock market
 
Portfolio theory
Portfolio theoryPortfolio theory
Portfolio theory
 
1st chapter introduction to portfolio mgt
1st chapter introduction to portfolio mgt1st chapter introduction to portfolio mgt
1st chapter introduction to portfolio mgt
 
1. introduction to securities market
1. introduction to securities market1. introduction to securities market
1. introduction to securities market
 
Development Financial Insistution
Development Financial InsistutionDevelopment Financial Insistution
Development Financial Insistution
 
Exchange Traded Funds (ETFs)
 Exchange Traded Funds (ETFs) Exchange Traded Funds (ETFs)
Exchange Traded Funds (ETFs)
 
fundamental and technical analysis of banking sector in india
fundamental and technical analysis of banking sector in indiafundamental and technical analysis of banking sector in india
fundamental and technical analysis of banking sector in india
 
Amfi investor awareness programmed
Amfi investor awareness programmedAmfi investor awareness programmed
Amfi investor awareness programmed
 
Money markets in_india_wcm
Money markets in_india_wcmMoney markets in_india_wcm
Money markets in_india_wcm
 
Fundamental analysis and technical analysis
Fundamental analysis and technical analysisFundamental analysis and technical analysis
Fundamental analysis and technical analysis
 
Factors affecting the investors decision making
Factors affecting the investors decision makingFactors affecting the investors decision making
Factors affecting the investors decision making
 
1. introduction basics of investments.ppt
1. introduction   basics of investments.ppt1. introduction   basics of investments.ppt
1. introduction basics of investments.ppt
 
MUTUAL FUND
MUTUAL FUNDMUTUAL FUND
MUTUAL FUND
 
Portfolio management process
Portfolio management processPortfolio management process
Portfolio management process
 
Investment Analysis and Portfolio Management
Investment Analysis and Portfolio ManagementInvestment Analysis and Portfolio Management
Investment Analysis and Portfolio Management
 

Similar to ANALYSIS OF MARKET INDICES AND COMPONENT STOCKS - PART 2

Analysis Of Market Indices & Component Stocks
Analysis Of Market Indices & Component StocksAnalysis Of Market Indices & Component Stocks
Analysis Of Market Indices & Component Stocksabhipray
 
Understanding Stock Returns as a Combination of Speculative and Fundamental G...
Understanding Stock Returns as a Combination of Speculative and Fundamental G...Understanding Stock Returns as a Combination of Speculative and Fundamental G...
Understanding Stock Returns as a Combination of Speculative and Fundamental G...ijtsrd
 
Why is it good to have a Crypto Index?
Why is it good to have a Crypto Index?Why is it good to have a Crypto Index?
Why is it good to have a Crypto Index?coingabbar
 
Fundamental and technical analysis @ kotak mahindra mba project report
Fundamental and technical analysis @ kotak mahindra mba project reportFundamental and technical analysis @ kotak mahindra mba project report
Fundamental and technical analysis @ kotak mahindra mba project reportBabasab Patil
 
Fundamental analysis and technical analysis of unitech project report
Fundamental analysis and technical analysis of unitech project reportFundamental analysis and technical analysis of unitech project report
Fundamental analysis and technical analysis of unitech project reportBabasab Patil
 
Performance of PE Ratio as an Technical Indicator
Performance of PE Ratio as an Technical IndicatorPerformance of PE Ratio as an Technical Indicator
Performance of PE Ratio as an Technical IndicatorSangamesh K.S
 
Project_on_Future_of_Derivatives_in_Indi (1).doc
Project_on_Future_of_Derivatives_in_Indi (1).docProject_on_Future_of_Derivatives_in_Indi (1).doc
Project_on_Future_of_Derivatives_in_Indi (1).docMuskan13129
 
What Are Stock Market Index_Indices_.pdf
What Are Stock Market Index_Indices_.pdfWhat Are Stock Market Index_Indices_.pdf
What Are Stock Market Index_Indices_.pdfZyloStar
 
Introduction - Technidex Stock Futures Index - April 2016
Introduction - Technidex Stock Futures Index - April 2016Introduction - Technidex Stock Futures Index - April 2016
Introduction - Technidex Stock Futures Index - April 2016Navin B. Agrawal
 
Technidex Stock Futures Index - An Introduction
Technidex Stock Futures Index - An IntroductionTechnidex Stock Futures Index - An Introduction
Technidex Stock Futures Index - An IntroductionNavin B. Agrawal
 
TRADING IN STOCK EXCHANGE FUNDAMENTAL AND TECHENICAL ANALYSIS
TRADING IN STOCK EXCHANGE  FUNDAMENTAL AND TECHENICAL ANALYSISTRADING IN STOCK EXCHANGE  FUNDAMENTAL AND TECHENICAL ANALYSIS
TRADING IN STOCK EXCHANGE FUNDAMENTAL AND TECHENICAL ANALYSISBiswajeet Samal
 
Affecting stock market in india
Affecting stock market in indiaAffecting stock market in india
Affecting stock market in indiaMohitAgarwal312
 
equity analysis of IT industry
equity analysis of IT industryequity analysis of IT industry
equity analysis of IT industrypooja kumari
 
final_copy_2015_dissertation
final_copy_2015_dissertationfinal_copy_2015_dissertation
final_copy_2015_dissertationchirag patwa
 
CHAPTER 2 - FUNDAMENTLA ANALYSIS.pptx
CHAPTER 2 - FUNDAMENTLA ANALYSIS.pptxCHAPTER 2 - FUNDAMENTLA ANALYSIS.pptx
CHAPTER 2 - FUNDAMENTLA ANALYSIS.pptxTheUnknown776370
 
S&P BSE Sensex
S&P BSE SensexS&P BSE Sensex
S&P BSE Sensexabhipray
 
Emutual funds sep-21-newsletter
Emutual funds sep-21-newsletterEmutual funds sep-21-newsletter
Emutual funds sep-21-newsletterBinod Shukla
 

Similar to ANALYSIS OF MARKET INDICES AND COMPONENT STOCKS - PART 2 (20)

Analysis Of Market Indices & Component Stocks
Analysis Of Market Indices & Component StocksAnalysis Of Market Indices & Component Stocks
Analysis Of Market Indices & Component Stocks
 
Understanding Stock Returns as a Combination of Speculative and Fundamental G...
Understanding Stock Returns as a Combination of Speculative and Fundamental G...Understanding Stock Returns as a Combination of Speculative and Fundamental G...
Understanding Stock Returns as a Combination of Speculative and Fundamental G...
 
Why is it good to have a Crypto Index?
Why is it good to have a Crypto Index?Why is it good to have a Crypto Index?
Why is it good to have a Crypto Index?
 
Fundamental and technical analysis @ kotak mahindra mba project report
Fundamental and technical analysis @ kotak mahindra mba project reportFundamental and technical analysis @ kotak mahindra mba project report
Fundamental and technical analysis @ kotak mahindra mba project report
 
Fundamental analysis and technical analysis of unitech project report
Fundamental analysis and technical analysis of unitech project reportFundamental analysis and technical analysis of unitech project report
Fundamental analysis and technical analysis of unitech project report
 
Performance of PE Ratio as an Technical Indicator
Performance of PE Ratio as an Technical IndicatorPerformance of PE Ratio as an Technical Indicator
Performance of PE Ratio as an Technical Indicator
 
Project_on_Future_of_Derivatives_in_Indi (1).doc
Project_on_Future_of_Derivatives_in_Indi (1).docProject_on_Future_of_Derivatives_in_Indi (1).doc
Project_on_Future_of_Derivatives_in_Indi (1).doc
 
What Are Stock Market Index_Indices_.pdf
What Are Stock Market Index_Indices_.pdfWhat Are Stock Market Index_Indices_.pdf
What Are Stock Market Index_Indices_.pdf
 
Introduction - Technidex Stock Futures Index - April 2016
Introduction - Technidex Stock Futures Index - April 2016Introduction - Technidex Stock Futures Index - April 2016
Introduction - Technidex Stock Futures Index - April 2016
 
Technidex Stock Futures Index - An Introduction
Technidex Stock Futures Index - An IntroductionTechnidex Stock Futures Index - An Introduction
Technidex Stock Futures Index - An Introduction
 
TRADING IN STOCK EXCHANGE FUNDAMENTAL AND TECHENICAL ANALYSIS
TRADING IN STOCK EXCHANGE  FUNDAMENTAL AND TECHENICAL ANALYSISTRADING IN STOCK EXCHANGE  FUNDAMENTAL AND TECHENICAL ANALYSIS
TRADING IN STOCK EXCHANGE FUNDAMENTAL AND TECHENICAL ANALYSIS
 
A PROJECT REPORT ON
A PROJECT REPORT ONA PROJECT REPORT ON
A PROJECT REPORT ON
 
Affecting stock market in india
Affecting stock market in indiaAffecting stock market in india
Affecting stock market in india
 
equity analysis of IT industry
equity analysis of IT industryequity analysis of IT industry
equity analysis of IT industry
 
Comprehensive Project
Comprehensive ProjectComprehensive Project
Comprehensive Project
 
final_copy_2015_dissertation
final_copy_2015_dissertationfinal_copy_2015_dissertation
final_copy_2015_dissertation
 
CHAPTER 2 - FUNDAMENTLA ANALYSIS.pptx
CHAPTER 2 - FUNDAMENTLA ANALYSIS.pptxCHAPTER 2 - FUNDAMENTLA ANALYSIS.pptx
CHAPTER 2 - FUNDAMENTLA ANALYSIS.pptx
 
S&P BSE Sensex
S&P BSE SensexS&P BSE Sensex
S&P BSE Sensex
 
Emutual funds sep-21-newsletter
Emutual funds sep-21-newsletterEmutual funds sep-21-newsletter
Emutual funds sep-21-newsletter
 
Hets
HetsHets
Hets
 

More from abhipray

Real Estate Sector in India & Foreign Investments in Real Estate
Real Estate Sector in India & Foreign Investments in Real EstateReal Estate Sector in India & Foreign Investments in Real Estate
Real Estate Sector in India & Foreign Investments in Real Estateabhipray
 
FDI FII DISINVESTMENT
FDI FII DISINVESTMENTFDI FII DISINVESTMENT
FDI FII DISINVESTMENTabhipray
 
PROSPECTUS OF A FINANCIAL CONSULTANCY FIRM (IMAGINARY)
PROSPECTUS OF A FINANCIAL CONSULTANCY FIRM (IMAGINARY)PROSPECTUS OF A FINANCIAL CONSULTANCY FIRM (IMAGINARY)
PROSPECTUS OF A FINANCIAL CONSULTANCY FIRM (IMAGINARY)abhipray
 
ICICI BANK BRANCH MANAGER INTERVIEW
ICICI BANK BRANCH MANAGER INTERVIEWICICI BANK BRANCH MANAGER INTERVIEW
ICICI BANK BRANCH MANAGER INTERVIEWabhipray
 
BSE FMCG INDEX
BSE FMCG INDEXBSE FMCG INDEX
BSE FMCG INDEXabhipray
 
Nanotechnology
NanotechnologyNanotechnology
Nanotechnologyabhipray
 

More from abhipray (6)

Real Estate Sector in India & Foreign Investments in Real Estate
Real Estate Sector in India & Foreign Investments in Real EstateReal Estate Sector in India & Foreign Investments in Real Estate
Real Estate Sector in India & Foreign Investments in Real Estate
 
FDI FII DISINVESTMENT
FDI FII DISINVESTMENTFDI FII DISINVESTMENT
FDI FII DISINVESTMENT
 
PROSPECTUS OF A FINANCIAL CONSULTANCY FIRM (IMAGINARY)
PROSPECTUS OF A FINANCIAL CONSULTANCY FIRM (IMAGINARY)PROSPECTUS OF A FINANCIAL CONSULTANCY FIRM (IMAGINARY)
PROSPECTUS OF A FINANCIAL CONSULTANCY FIRM (IMAGINARY)
 
ICICI BANK BRANCH MANAGER INTERVIEW
ICICI BANK BRANCH MANAGER INTERVIEWICICI BANK BRANCH MANAGER INTERVIEW
ICICI BANK BRANCH MANAGER INTERVIEW
 
BSE FMCG INDEX
BSE FMCG INDEXBSE FMCG INDEX
BSE FMCG INDEX
 
Nanotechnology
NanotechnologyNanotechnology
Nanotechnology
 

Recently uploaded

The Triple Threat | Article on Global Resession | Harsh Kumar
The Triple Threat | Article on Global Resession | Harsh KumarThe Triple Threat | Article on Global Resession | Harsh Kumar
The Triple Threat | Article on Global Resession | Harsh KumarHarsh Kumar
 
Independent Lucknow Call Girls 8923113531WhatsApp Lucknow Call Girls make you...
Independent Lucknow Call Girls 8923113531WhatsApp Lucknow Call Girls make you...Independent Lucknow Call Girls 8923113531WhatsApp Lucknow Call Girls make you...
Independent Lucknow Call Girls 8923113531WhatsApp Lucknow Call Girls make you...makika9823
 
chapter_2.ppt The labour market definitions and trends
chapter_2.ppt The labour market definitions and trendschapter_2.ppt The labour market definitions and trends
chapter_2.ppt The labour market definitions and trendslemlemtesfaye192
 
Call Girls Near Me WhatsApp:+91-9833363713
Call Girls Near Me WhatsApp:+91-9833363713Call Girls Near Me WhatsApp:+91-9833363713
Call Girls Near Me WhatsApp:+91-9833363713Sonam Pathan
 
NO1 WorldWide Love marriage specialist baba ji Amil Baba Kala ilam powerful v...
NO1 WorldWide Love marriage specialist baba ji Amil Baba Kala ilam powerful v...NO1 WorldWide Love marriage specialist baba ji Amil Baba Kala ilam powerful v...
NO1 WorldWide Love marriage specialist baba ji Amil Baba Kala ilam powerful v...Amil baba
 
Call Girls Near Golden Tulip Essential Hotel, New Delhi 9873777170
Call Girls Near Golden Tulip Essential Hotel, New Delhi 9873777170Call Girls Near Golden Tulip Essential Hotel, New Delhi 9873777170
Call Girls Near Golden Tulip Essential Hotel, New Delhi 9873777170Sonam Pathan
 
Monthly Market Risk Update: April 2024 [SlideShare]
Monthly Market Risk Update: April 2024 [SlideShare]Monthly Market Risk Update: April 2024 [SlideShare]
Monthly Market Risk Update: April 2024 [SlideShare]Commonwealth
 
call girls in Nand Nagri (DELHI) 🔝 >༒9953330565🔝 genuine Escort Service 🔝✔️✔️
call girls in  Nand Nagri (DELHI) 🔝 >༒9953330565🔝 genuine Escort Service 🔝✔️✔️call girls in  Nand Nagri (DELHI) 🔝 >༒9953330565🔝 genuine Escort Service 🔝✔️✔️
call girls in Nand Nagri (DELHI) 🔝 >༒9953330565🔝 genuine Escort Service 🔝✔️✔️9953056974 Low Rate Call Girls In Saket, Delhi NCR
 
Governor Olli Rehn: Dialling back monetary restraint
Governor Olli Rehn: Dialling back monetary restraintGovernor Olli Rehn: Dialling back monetary restraint
Governor Olli Rehn: Dialling back monetary restraintSuomen Pankki
 
Russian Call Girls In Gtb Nagar (Delhi) 9711199012 💋✔💕😘 Naughty Call Girls Se...
Russian Call Girls In Gtb Nagar (Delhi) 9711199012 💋✔💕😘 Naughty Call Girls Se...Russian Call Girls In Gtb Nagar (Delhi) 9711199012 💋✔💕😘 Naughty Call Girls Se...
Russian Call Girls In Gtb Nagar (Delhi) 9711199012 💋✔💕😘 Naughty Call Girls Se...shivangimorya083
 
AfRESFullPaper22018EmpiricalPerformanceofRealEstateInvestmentTrustsandShareho...
AfRESFullPaper22018EmpiricalPerformanceofRealEstateInvestmentTrustsandShareho...AfRESFullPaper22018EmpiricalPerformanceofRealEstateInvestmentTrustsandShareho...
AfRESFullPaper22018EmpiricalPerformanceofRealEstateInvestmentTrustsandShareho...yordanosyohannes2
 
VIP Kolkata Call Girl Serampore 👉 8250192130 Available With Room
VIP Kolkata Call Girl Serampore 👉 8250192130  Available With RoomVIP Kolkata Call Girl Serampore 👉 8250192130  Available With Room
VIP Kolkata Call Girl Serampore 👉 8250192130 Available With Roomdivyansh0kumar0
 
Call Girls In Yusuf Sarai Women Seeking Men 9654467111
Call Girls In Yusuf Sarai Women Seeking Men 9654467111Call Girls In Yusuf Sarai Women Seeking Men 9654467111
Call Girls In Yusuf Sarai Women Seeking Men 9654467111Sapana Sha
 
Bladex 1Q24 Earning Results Presentation
Bladex 1Q24 Earning Results PresentationBladex 1Q24 Earning Results Presentation
Bladex 1Q24 Earning Results PresentationBladex
 
Q3 2024 Earnings Conference Call and Webcast Slides
Q3 2024 Earnings Conference Call and Webcast SlidesQ3 2024 Earnings Conference Call and Webcast Slides
Q3 2024 Earnings Conference Call and Webcast SlidesMarketing847413
 
fca-bsps-decision-letter-redacted (1).pdf
fca-bsps-decision-letter-redacted (1).pdffca-bsps-decision-letter-redacted (1).pdf
fca-bsps-decision-letter-redacted (1).pdfHenry Tapper
 
Andheri Call Girls In 9825968104 Mumbai Hot Models
Andheri Call Girls In 9825968104 Mumbai Hot ModelsAndheri Call Girls In 9825968104 Mumbai Hot Models
Andheri Call Girls In 9825968104 Mumbai Hot Modelshematsharma006
 
Call Girls Near Delhi Pride Hotel, New Delhi|9873777170
Call Girls Near Delhi Pride Hotel, New Delhi|9873777170Call Girls Near Delhi Pride Hotel, New Delhi|9873777170
Call Girls Near Delhi Pride Hotel, New Delhi|9873777170Sonam Pathan
 
Vp Girls near me Delhi Call Now or WhatsApp
Vp Girls near me Delhi Call Now or WhatsAppVp Girls near me Delhi Call Now or WhatsApp
Vp Girls near me Delhi Call Now or WhatsAppmiss dipika
 

Recently uploaded (20)

The Triple Threat | Article on Global Resession | Harsh Kumar
The Triple Threat | Article on Global Resession | Harsh KumarThe Triple Threat | Article on Global Resession | Harsh Kumar
The Triple Threat | Article on Global Resession | Harsh Kumar
 
Independent Lucknow Call Girls 8923113531WhatsApp Lucknow Call Girls make you...
Independent Lucknow Call Girls 8923113531WhatsApp Lucknow Call Girls make you...Independent Lucknow Call Girls 8923113531WhatsApp Lucknow Call Girls make you...
Independent Lucknow Call Girls 8923113531WhatsApp Lucknow Call Girls make you...
 
chapter_2.ppt The labour market definitions and trends
chapter_2.ppt The labour market definitions and trendschapter_2.ppt The labour market definitions and trends
chapter_2.ppt The labour market definitions and trends
 
Monthly Economic Monitoring of Ukraine No 231, April 2024
Monthly Economic Monitoring of Ukraine No 231, April 2024Monthly Economic Monitoring of Ukraine No 231, April 2024
Monthly Economic Monitoring of Ukraine No 231, April 2024
 
Call Girls Near Me WhatsApp:+91-9833363713
Call Girls Near Me WhatsApp:+91-9833363713Call Girls Near Me WhatsApp:+91-9833363713
Call Girls Near Me WhatsApp:+91-9833363713
 
NO1 WorldWide Love marriage specialist baba ji Amil Baba Kala ilam powerful v...
NO1 WorldWide Love marriage specialist baba ji Amil Baba Kala ilam powerful v...NO1 WorldWide Love marriage specialist baba ji Amil Baba Kala ilam powerful v...
NO1 WorldWide Love marriage specialist baba ji Amil Baba Kala ilam powerful v...
 
Call Girls Near Golden Tulip Essential Hotel, New Delhi 9873777170
Call Girls Near Golden Tulip Essential Hotel, New Delhi 9873777170Call Girls Near Golden Tulip Essential Hotel, New Delhi 9873777170
Call Girls Near Golden Tulip Essential Hotel, New Delhi 9873777170
 
Monthly Market Risk Update: April 2024 [SlideShare]
Monthly Market Risk Update: April 2024 [SlideShare]Monthly Market Risk Update: April 2024 [SlideShare]
Monthly Market Risk Update: April 2024 [SlideShare]
 
call girls in Nand Nagri (DELHI) 🔝 >༒9953330565🔝 genuine Escort Service 🔝✔️✔️
call girls in  Nand Nagri (DELHI) 🔝 >༒9953330565🔝 genuine Escort Service 🔝✔️✔️call girls in  Nand Nagri (DELHI) 🔝 >༒9953330565🔝 genuine Escort Service 🔝✔️✔️
call girls in Nand Nagri (DELHI) 🔝 >༒9953330565🔝 genuine Escort Service 🔝✔️✔️
 
Governor Olli Rehn: Dialling back monetary restraint
Governor Olli Rehn: Dialling back monetary restraintGovernor Olli Rehn: Dialling back monetary restraint
Governor Olli Rehn: Dialling back monetary restraint
 
Russian Call Girls In Gtb Nagar (Delhi) 9711199012 💋✔💕😘 Naughty Call Girls Se...
Russian Call Girls In Gtb Nagar (Delhi) 9711199012 💋✔💕😘 Naughty Call Girls Se...Russian Call Girls In Gtb Nagar (Delhi) 9711199012 💋✔💕😘 Naughty Call Girls Se...
Russian Call Girls In Gtb Nagar (Delhi) 9711199012 💋✔💕😘 Naughty Call Girls Se...
 
AfRESFullPaper22018EmpiricalPerformanceofRealEstateInvestmentTrustsandShareho...
AfRESFullPaper22018EmpiricalPerformanceofRealEstateInvestmentTrustsandShareho...AfRESFullPaper22018EmpiricalPerformanceofRealEstateInvestmentTrustsandShareho...
AfRESFullPaper22018EmpiricalPerformanceofRealEstateInvestmentTrustsandShareho...
 
VIP Kolkata Call Girl Serampore 👉 8250192130 Available With Room
VIP Kolkata Call Girl Serampore 👉 8250192130  Available With RoomVIP Kolkata Call Girl Serampore 👉 8250192130  Available With Room
VIP Kolkata Call Girl Serampore 👉 8250192130 Available With Room
 
Call Girls In Yusuf Sarai Women Seeking Men 9654467111
Call Girls In Yusuf Sarai Women Seeking Men 9654467111Call Girls In Yusuf Sarai Women Seeking Men 9654467111
Call Girls In Yusuf Sarai Women Seeking Men 9654467111
 
Bladex 1Q24 Earning Results Presentation
Bladex 1Q24 Earning Results PresentationBladex 1Q24 Earning Results Presentation
Bladex 1Q24 Earning Results Presentation
 
Q3 2024 Earnings Conference Call and Webcast Slides
Q3 2024 Earnings Conference Call and Webcast SlidesQ3 2024 Earnings Conference Call and Webcast Slides
Q3 2024 Earnings Conference Call and Webcast Slides
 
fca-bsps-decision-letter-redacted (1).pdf
fca-bsps-decision-letter-redacted (1).pdffca-bsps-decision-letter-redacted (1).pdf
fca-bsps-decision-letter-redacted (1).pdf
 
Andheri Call Girls In 9825968104 Mumbai Hot Models
Andheri Call Girls In 9825968104 Mumbai Hot ModelsAndheri Call Girls In 9825968104 Mumbai Hot Models
Andheri Call Girls In 9825968104 Mumbai Hot Models
 
Call Girls Near Delhi Pride Hotel, New Delhi|9873777170
Call Girls Near Delhi Pride Hotel, New Delhi|9873777170Call Girls Near Delhi Pride Hotel, New Delhi|9873777170
Call Girls Near Delhi Pride Hotel, New Delhi|9873777170
 
Vp Girls near me Delhi Call Now or WhatsApp
Vp Girls near me Delhi Call Now or WhatsAppVp Girls near me Delhi Call Now or WhatsApp
Vp Girls near me Delhi Call Now or WhatsApp
 

ANALYSIS OF MARKET INDICES AND COMPONENT STOCKS - PART 2

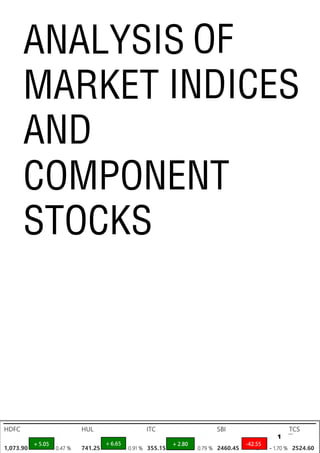
  • 1. HDFC HUL ITC SBI TCS 1,073.90 0.47 % 741.25 0.91 % 355.15 0.79 % 2460.45 V - 1.70 % 2524.60 + 5.05 + 6.65 + 2.80 -42.55 ANALYSIS OF MARKET INDICES AND COMPONENT STOCKS 1
  • 2. Chapter No. Chapter Name Page No. 1 Market Index- Meaning, Example 2 1.1 Importance of an Index 3 1.2 Essentials of an Index 4 2 BSE INDICES 5 2.1 BSE MID CAP 6 2.1 BSE MID CAP- SECTORIAL WEIGHTAGE 7 2.3 BSE SMALL CAP 8 2.5 BSE SMALL CAP- SECTORIAL WEIGHTAGE 9 2.6 THREE YEARLY COMPARISON AGAINST SENSEX 10 Index
  • 3. 3 SECTORIAL INDICES 11 3.1 S&P BSE AUTO INDEX 12 3.2 S&P BSE BANEx INDEX 16 3.3 S&P BSE IT INDEX 20 3.4 S&P BSE CD INDEX 24 3.5 S&P BSE CG INDEX 28 3.6 S&P BSE OIL & GAS INDEX 32 3.7 S&P BSE FMCG INDEX 36 3.8 S&P BSE HEALTHCARE INDEX 40 3.9 S&P BSE METAL INDEX 44 3.10 S&P BSE POWER INDEX 47
  • 4. 3.11 S&P BSE REALTY INDEX 50 3.12 S&P BSE TECK INDEX 54 3.13 SECTORS WITH HIGEST & LOWEST RETURN 57 4 BROAD INDICES 58 4.1 THEMATIC INDICES 59 4.2 S&P BSE PSU INDEX 60 4.3 VOLATILITY INDICES 61 4.4 STRATEGY INDICES 62 5 PERSONAL INTERVIEW 64 6 CONCLUSION (OBSERVATION) 67 Bibliography/Reference 68
  • 5. Meaning: An aggregate value produced by combining several stocks or other investment vehicles together and expressing their total values against a base value from a specific date. Market indices are intended to represent an entire stock market and thus track the market's changes over time. An index is a sample of stocks that provide a glimpse at the broader market. When someone says that market is up 100 points, they are actually referring to the index. The market indices are classified as Global & National. A 'world' or 'global' stock market index includes typically large companies without regard for where they are domiciled or traded. A 'national' index represents the performance of the stock market of a given nation—and reflects the investor sentiment on the state of its economy. The most regularly quoted market indices are national indices composed of the stocks of large & heavily traded companies listed on a nation's largest stock exchanges, such as the Sensex & Nifty. Other indices may be regional such as the FTSE Developed Europe Index or the FTSE Developed Asia Pacific Index. A stock market index or just ‘index’ is a number that measures the relative value of a group of stocks. As the stocks in this group change value, the index also changes value. If an index goes up by 1% then that means the total value of the securities which make up the index have gone up by 1% in value. The most common index such as the SENSEX, is made up of stocks but there are indices of bonds, real estate and others. Usually the index value is in terms of ‘points’ – as in “the SENSEX dropped 500 points today”. This means that the index went from a value of perhaps 25000 points to a value of 24500 points. The points don’t mean anything – the best way to look at an index number is to compare it with a previous value such as the previous day’s number. EXAMPLE The ABC index is made up of four companies. As of the end of yesterday’s trading day the ABC index was set at 4,123 points. Today, two of the companies went up in value, one company dropped in price and the fourth company stayed the same – the total value of those stocks went up by 2% so the ABC index is now 2% higher or 4205 point. Chp.1Market Index 2
  • 6. 1.1 IMPORTANCE OF MARKET INDEX Stock market indices are vital to macroeconomists, financial economists as well as actors in financial world. Consistent indices are essential to assess long term regularities that help in understanding the behaviour of financial actors, the evolution of the economy, and to make international comparisons. Financial indices are also useful for traders and investors seeking for summary, accurate, easily and rapidly available information on stock markets. History shows that a great variety of indices has been created in order to measure the performance of stock markets. This variety grew especially rapidly in the recent years. Although the stock market is much more dynamic than the indexes suggest, along with the fact that there are different ways to calculate the indexes, causing calculation bias, the stock market indexes are useful in a number of ways to stock investors. First, the market indexes provide an historical perspective of stock market performance, giving investors more insight into their investment decisions. Investors who do not know which individual stocks to invest in can use indexing as a method of choosing their stock investments. By wanting to match the performance of the market, investors can invest in index mutual funds or index exchange-traded funds (ETFs) that track the performance of the indexes with which they are aligned. This form of investing gives investors the opportunity to do as well as the markets and not significantly underperform the markets. The second benefit of stock market indexes is that they provide a yardstick with which investors can compare the performance of their individual stock portfolios. Individual investors with professionally managed portfolios can use the indexes to determine how well their managers are doing in managing their money. The third major use of stock market indexes is as a forecasting tool. Studying the historical performance of the stock market indexes, you can forecast trends in the market. Stock indices are termed as leading economic indicators as they indicate what is going to happen in the economy in the future. The returns generated in the stock market are based on future expectations. The future streams of expected returns from the companies are discounted to arrive at their present value known as market price. Traditionally, indices have been used as information sources. By looking at an index we know how the market is faring. This information aspect also figures in the applications of stock market indices in economic research. This is particularly valuable when an index reflects highly updated information and the index is a lead indicator of how the overall portfolio will fare. In recent years, indices have shown direct applications in finance, in the form of index funds and index derivatives. Hedging using index derivatives has become a central part of risk management in the modern economy. These applications are now a multi-trillion dollar industry worldwide, and they are critically linked up to market indices. 3
  • 7. A stock market index should capture the behaviour of the overall equity market. Movements of the index should represent the returns obtained by “typical” portfolios in the country. The ups & downs reflect the changing expectations of the stock market about future dividends of India's corporate sector. When the index goes up, it is because the stock market thinks that the prospective returns in the future will be better than previously thought. When prospects of returns in the future become pessimistic, the index drops. The ideal index gives us instant-to-instant readings about how the stock market perceives the future of India's corporate sector. The basic idea of an index is that every stock price moves for two possible reasons: news about the company (e.g. a product launch, or the closure of a factory, etc.) or news about the country (e.g. nuclear bombs, or a budget announcement, etc.). The job of an index is to purely capture the second part, the movements of the stock market as a whole (i.e. news about the country). This is achieved by averaging. Each stock contains a mixture of these two elements - stock news and index news. When we take an average of returns on many stocks, the individual stock news tends to cancel out. On any one day, there would be good stock specific news for a few companies and bad stock-specific news for others. In a good index, these will cancel out, and the only thing left will be news that is common to all stocks. The news that is common to all stocks is news about India. That is what the index will capture. The most important type of market index is the broad-market index, consisting of the large, liquid stocks of the country. In most countries, a single major index dominates benchmarking, index funds, index derivatives and research applications. In addition, more specialised indices often find interesting applications. In India, we have seen situations where a dedicated industry fund uses an industry index as a benchmark. In India, where clear categories of groups exist, it becomes interesting to examine the performance of classes of companies sorted by such group. The indices are basically divided into the following types: 1. Benchmark Indices. For instance, Sensex & Nifty. 2. Indices based on Market Capitalization. Ex. Large Cap, Mid Cap & Small Cap. 3. Indices based on the different Sectors/Industries. Ex. Automobiles, Banks, etc. 4. Indices based on the stocks they hold. Ex. BSE 100, BSE 200 & BSE 500. 5. Indices based on the types of companies that form it. Ex. BSE PSU Index, CNX MNC index. 6. Benchmark Global Indices. Ex. MSCI Global Index. Indices can also be differed based on the methodology by which they are calculated. 1.2 Essentials of an Index 1.3 Types of an Index 4
  • 8. • THE ABOVE GIVEN FLOWCHART DESCRIBES THE SEGREGATION OF INDICES BY THE BSE. THESE INDICES ARE ACTIVELY CALCULATED & COMPUTED. BSE INDICES BROAD SENSEX MID CAP SMALL CAP BSE 100 BSE 200 BSE 500 THEMATIC BSE PSU INFRASTRUCTURE BSE CPSE BSE 500 SHARIAH SECTORAL BSE AUTO BSE BANKEX BSE CD BSE CG BSE FMCG BSE IT BSE METAL BSE POWER BSE REALTY BSE TECK VOLATILITY REAL VOL MTH 1 REAL VOL MTH 2 REAL VOL MTH 3 STRATEGY BSE IPO BSE SME IPO BSE DOLLEX 30 BSE DOLLEX 100 BSE DOLLEX 200 BSE DOLLEX 100 FUTURES BSE SENSEX FUTURES TR BSE SENSEX FUTURES (USD) 5 Chp. 2
  • 9. The constituent stocks of the S&P BSE MID CAP Index lie between large cap stocks and small cap stocks. Mid cap stocks are those that generally have a market capitalization within the range of Rs.50 and Rs.200 billion. These represent mid-sized companies that are relatively more risky than large cap as investment options yet, they are not considered as risky as small cap companies. They rank between the two extremes on all the important parameters like size, revenues, employee and client base. . When one invests in mid cap for the long term, he may be investing in companies that could become tomorrow's runaway success stories. *The above given chart shows the performance of the S&P BSE MID CAP Index over the period of last one year. The following table shows the returns by the MID Cap Index over different tenures. Duration Returns Duration Returns 1 Year 63.20% 3 Years 71.10% 2 Years 69.40% YTD 62.22% • The Index has given considerably good returns over different tenures. The same can be expected for the coming time. No. Of Constituents 279 Launch Date April 11, 2005 S&P BSE MID CAP 7000 7500 8000 8500 9000 9500 10000 10500 11000 11500 12000 12500 13000 DATES MID CAP 6 2.1
  • 10. Banking & Finance, 19.54%, Engineering, 11.21% Chemicals, 8.41% Pharmaceuticals, 7.21%, Services, 6.79% Automotive, 6.50% Telecom, 5.66% Manufacturing, 4.86% Technology, 4.46% Cement, 3.70% Consumer Non Durables, 3.19% Real Estate, 3.17%, 3% Utilities, 2.56%, 3% Media, 2.49%, 3% Oil & Gas, 2.21%, 2% Conglomorates, 1.94%, 2% Food & Beverages, 1.70%, 2% Miscellaneous, 1.69%, 2% Consumer Durables, 1.68%, 2% Metaks & Mining, 0.24%, 0% Tobaco, 0.29%, 0% SECTORAL WEIGHTAGE Banking & Finance Engineering Chemicals Pharmaceuticals Services Automotive Telecom Manufacturing Technology Cement Consumer Non Durables Real Estate Utilities Media Oil & Gas Conglomorates Food & Beverages Miscellaneous Consumer Durables Metaks & Mining Tobaco 7 2.2
  • 11. Small cap companies have smaller revenue and client bases, and usually include the start-ups or companies in the early stage of development. Small cap stocks are potentially big gainers as they are yet to be discovered within the sector and can show growth potential in large numbers once unfurled in the market. However, as these enterprises are small ventures, these should be researched properly. This is considering that a lot of small companies do not have the financial strength to survive bad times and some of them might be mismanaged businesses run by greedy promoter *The above given chart shows the performance of the S&P BSE MID CAP Index over the period of last one year. The following table shows the returns by the MID Cap Index over different tenures. Duration Returns Duration Returns 1 Year 70.80% 3 Years 67.50% 2 Years 80.20% YTD 73.79% • This Index like the MID Cap Index has given considerably good or even returns over different tenures. The same can be expected for the coming time. No. Of Constituents 485 Launch Date April 11, 2005 S&P BSE SMALL CAP 6000 6500 7000 7500 8000 8500 9000 9500 10000 10500 11000 11500 12000 12500 DATES SMALL CAP 8 2.3
  • 12. Manufacturing, 12.68% Banking & Finance, 9.47%, Cement, 9.15% Engineering, 8.53% Chemicals, 7.83% Technology, 7.12% Pharmaceuticals, 6.13%, Automotive, 6.05% Metaks & Mining, 5.88%, 6% Services, 5.44% Miscellaneous, 5.22%, 5% Food & Beverages, 4.07%, 4% Real Estate, 3.25%, 3% Media, 2.98%, 3% Consumer Durables, 1.72%, 2% Conglomorates, 1.44%, 1% Telecom, 1.26% Utilities, 0.78%, 1% Consumer Non Durables, 0.57%Oil & Gas, 0.31%, 0% Tobaco, 0.08%, 0% SECTORAL WEIGHTAGE Manufacturing Banking & Finance Cement Engineering Chemicals Technology Pharmaceuticals Automotive Metaks & Mining Services Miscellaneous Food & Beverages Real Estate Media Consumer Durables Conglomorates Telecom Utilities Consumer Non Durables Oil & Gas Tobaco 9 2.4
  • 13. 75 95 115 135 155 175 3 Yearly Comparison against Sensex SENSEX SMALL CAP MID CAP 10 2.5
  • 14. Sector indices enable investors to benchmark the performance of stocks grouped by specific market sectors or industries. It empowers investors to make more selective choices, and listed companies to better track progress relative to their respective peer group. SECTORIAL INDICES AUTO The Auto Index is designed to reflect the behaviour and performance of the Automobiles sector which includes manufacturers of cars & motorcycles, heavy vehicles, auto ancillaries, tyres, etc. The Index comprises of 13 stocks that are listed on the Bombay Stock Exchange. FMCG FMCGs (Fast Moving Consumer Goods) are those goods and products, which are non-durable, mass consumption products and available off the shelf. The S&P BSE FMCG Index comprises of 12 companies who manufacture such products which are listed on the Bombay Stock Exchange. BANKEX The Bank Index is an index comprised of the most liquid and large capitalised Indian Banking stocks. It provides investors and market intermediaries with a benchmark that captures the capital market performance of Indian Banks.The index will have 12 stocks from the banking sector which trade on the Bombay Stock Exchange. REALTY Real estate sector in India is witnessing significant growth. Further necessitated, one can witness plenty of opportunities in real estate sector backed by favorable tax regime. IISL has developed the CNX Realty Index to synergize these emerging opportunities along with their Index expertise creating new investment avenues for investors. METAL The Metal Index is designed to reflect the behavior and performance of the Metals sector including mining. The Index comprises of 15 stocks that are listed on the Bombay Stock Exchange. Pharmaceuticals sector is one of the key sectors where Indian companies have created a global brand for themselves besides software. BSE has developed the Healthcare Index to capture the performance of the 17 companies in this sector. HEALTHCARE IT Companies in this index are those that havemore than 50% of their turnover from IT related activities like IT Infrastructure , IT Education and Software Training , Telecommunication Services and Networking Infrastructure, Software Development, Hardware Manufacturer’s, Vending, Support and Maintenance. OIL&GAS Oil & Gas sector is universally recognized as one of the most significant inputs for economic growth. The Index will include companies belonging to Petroleum & Gas production & processing. The BSE Oil & Gas Index comprises of 10 such companies. 11 Chp.3
  • 15. The Auto Index is designed to reflect the behaviour and performance of the Automobiles sector which includes manufacturers of cars & motorcycles, heavy vehicles, auto ancillaries, tyres, etc. The Index comprises of 13 stocks that are listed on the Bombay Stock Exchange. The BSE Auto Index is computed using free float market capitalization method with a base date of February 1, 1999 indexed to a base value of 1000, wherein the level of the index reflects the total free float market value of all the stocks in the index relative to particular base market capitalization value. The method also takes into account constituent changes in the index and importantly corporate actions such as stock splits, right issue, new issue of shares etc. without affecting the index value. Index Details INDEX NAME AUTOMOTIVE ESTABLISHMENT DATE FEBRUARY 1, 1999 LISTING DATE AUGUST 23, 2004 NO. OF CONSTITUENTS (COMPANIES) THIRTEEN (13) The constituents of the S&P BSE Auto Index are as follows: COMPANY WEIGHT MARKET CAP TATA MOTORS 22.95% 170,953.60 MARUTI SUZUKI INDIA 14.94% 111,311.95 BOSCH 11.50% 85,679.45 MAHINDRA & MAHINDRA 10.37% 77,270.10 BAJAJ AUTO 8.07% 60,126.75 HERO MOTOCORP 7.08% 52,773.72 EICHER MOTORS 5.94% 44,229.33 MOTHERSON SUMI SYSTEMS 5.82% 43,358.61 BHARAT FORGE 4.17% 31,047.37 CUMMINS INDIA 3.39% 25,234.90 MRF 2.37% 17,640.71 EXIDE INDUSTRIES 2.19% 16,349.75 APOLLO TYRES 1.21% 8,933.38 *The above table indicates the constituents with their respective market capitalization & the weight that they currently hold in the index. S&P BSE AUTO INDEX 12 3.1
  • 16. Auto Index Weightage Auto Index Performance *The above given chart indicates the performance of the Auto Index/Sector during the previous one year. TATA MOTORS, 22.95% MARUTI SUZUKI, 14.94% BOSCH, 11.50%M&M, 10.37%BAJAJ AUTO, 8.07% HERO MOTOCORP, 7.08% EICHER, 5.94% MOTHERSON SS, 5.82% BHARAT FORGE, 4.17% CUMMINS INDIA, 3.39% MRF, 2.37% EXIDE IND., 2.19% APOLLO TYRES, 1.21% WEIGHT 12000 13000 14000 15000 16000 17000 18000 19000 20000 21000 DATES AUTO 13
  • 17. Auto Index Sub Sectorial Weightage Auto Index Performance (Returns) in comparison to SENSEX *The above given chart indicates the performance of the Auto Index in comparison to BSE’s Benchmark Index SENSEX. 2 & 3 WHEELER, 14.94% CARS & JEEPS, 24.96% LCVs & HCVs, 29.88% TRACTORS, 7.46% ANCILLARIES, 19.24% TYRES, 3.52% WEIGHT 100 110 120 130 140 150 160 170 DATES AUTO (TR) SENSEX (TR) 14
  • 18. *The values are in terms of Billion USD. Growth Potential By 2020, India's share in the global passenger vehicle market to double to 8 per cent from 4 per cent over 2010–11. Two–wheeler sales to rise from 15.9 million in FY2013 to 34.0 million by FY 2020. Passenger vehicle sales to increase from 3.2 million in FY2013 to 8.6 million in FY 2021/ Cost Efficiency India has significant cost advantages; auto firms save 10-25 per cent on operations vis-à-vis Europe and Latin America. A large pool of skilled manpower and a growing technology base would induce greater investments. Opportunities The large ultra low-cost car segment has opened up potentially. Innovation is likely to intensify among engine technology and alternative fuels. Policy Support The government aims to develop India as a global manufacturing as well as R&D hub. There has been a wide array of policy support in the form of sops, taxes and FDI encouragement. Auto market in India Key Factors 30.1 39.9 42.4 40.6 0 10 20 30 40 50 2010 2011 2012 2013 Revenue Of Auto Industry REVENUE 1.8 2.4 3 3.1 3.2 2009 2010 2011 2012 2013 0 1 2 3 4 FDI Trends 15
  • 19. The Indian banking Industry has been undergoing major changes, reflecting a number of underlying developments. Advancement in communication and information technology has facilitated growth in internet-banking, ATM Network, Electronic transfer of funds and quick dissemination of information. Structural reforms in the banking sector have improved the health of the banking sector. The reforms recently introduced include the enactment of the Securitization Act to step up loan recoveries, establishment of asset reconstruction companies, initiatives on improving recoveries from Non-performing Assets (NPAs) and change in the basis of income recognition has raised transparency and efficiency in the banking system. Spurt in treasury income and improvement in loan recoveries has helped Indian Banks to record better profitability. BSE BankEx Index is an index comprised of the most liquid and large capitalised Indian Banking stocks. It provides investors and market intermediaries with a benchmark that captures the capital market performance of Indian Banks. The index comprises of 12 stocks from the banking sector which trade on the Bombay Stock Exchange. Index Details INDEX NAME BANKEX ESTABLISHMENT DATE JANUARY 1, 2002 LISTING DATE AUGUST 9, 2003 NO. OF CONSTITUENTS (COMPANIES) ELEVEN (11) The constituents of the S&P BSE BANKEX Index are as follows: COMPANY WEIGHT MARKET CAP HDFC BANK LTD. 23.90% 261,265.37 STATE BANK OF INDIA LTD. 19.18% 209,674.18 ICICI BANK LTD. 17.51% 191,404.98 AXIS BANK LTD. 12.35% 134,996.19 KOTAK MAHINDRA BANK LTD. 9.48% 103,581.90 INDUSIND BANK LTD. 4.24% 46,318.60 BANK OF BARODA LTD. 3.52% 38,432.65 YES BANK LTD. 3.07% 33,552.56 PUNJAB NATIONAL BANK LTD. 2.75% 30,078.97 CANARA BANK LTD. 1.68% 18,385082 BANK OF INDIA LTD. 1.27% 13,879.24 FEDERAL BANK LTD. 1.06% 11,634.33 *The above table indicates the constituents with their respective market capitalization & the weight that they currently hold in the index. S&P BSE BANKEX INDEX 16 3.2
  • 20. BankEx Index Weightage BankEx Index Performance *The above given chart indicates the performance of the BankEx Index/Sector during the previous one year. HDFC BANK LTD., 23.90% SBI LTD., 19.18% ICICI BANK, 17.51% AXIS BANK, 12.35% KOTAK MAHINDRA, 9.48% INDUSIND BANK, 4.24% BANK OF BARODA , 3.52% YES BANK, 3.07% PNB LTD., 2.75% CANARA BANK LTD., 1.68% BOI LTD., 1.27% FEDERAL BANK LTD., 1.06% WEIGHT 13000 14000 15000 16000 17000 18000 19000 20000 21000 22000 23000 24000 DATES AUTO 17
  • 21. BankEx Index Sub Sectorial Weightage BankEx Index Performance (Returns) in comparison to SENSEX *The above given chart indicates the performance of the BankEx Index in comparison to BSE’s Benchmark Index SENSEX. 100 110 120 130 140 150 160 170 180 DATES BANKEX (TR) SENSEX (TR) PRIVATE SECTOR, 71.59% PUBLIC SECTOR, 28.41% WEIGHT 18
  • 22. *The values are in terms of USD Billion. Growing Demand Increase in working population and growing disposable incomes will raise demand for banking and related services. Housing and personal finance are expected to remain key demand drivers. Rural banking is expected to witness growth in the future. Opportunities Mobile, Internet banking and extension of facilities at ATM stations to improve operational efficiency. Vast un-banked population highlights scope for innovation in delivery. Policy Support Healthy regulatory oversight and credible Monetary Policy by the Reserve Bank of India (RBI) have lent strength and stability to the country’s banking. Bank market in India Key Factors 742 896 916 991 1029 0 500 1000 1500 FY 10 FY 11 FY 12 FY 13 FY 14 Growth In Credit Off- Take in India 489 665 822 763 1030 1180 1170 1274 1312 0 200 400 600 800 1000 1200 1400 2006 2007 2008 2009 2010 2011 2012 2013 2014 Growth In Deposits GROWTH 19
  • 23. Information Technology (IT) industry has played a major role in the Indian economy during the last few years. A number of large, profitable Indian companies today belong to the IT sector and a great deal of investment interest is now focused on the IT sector. In order to have a good benchmark of the Indian IT sector, BSE has developed the BSE IT sector index. BSE IT provides investors and market intermediaries with an appropriate benchmark that captures the performance of the IT segment of the market. Companies in this index are those that have more than 50% of their turnover from IT related activities like IT Infrastructure , IT Education and Software Training , Telecommunication Services and Networking Infrastructure, Software Development, Hardware Manufacturer’s, Vending, Support and Maintenance. Index Details INDEX NAME INFORMATION TECHNOLOGY ESTABLISHMENT DATE (BASE YEAR) FEBRUARY 1, 1999 LISTING DATE AUGUST 9, 1999 NO. OF CONSTITUENTS (COMPANIES) SEVENTEEN (17) The constituents of the S&P BSE IT Index are as follows: COMPANY WEIGHT MARKET CAP TATA CONSULTANCY SERVICES LTD. 42.62% 505,550.26 INFOSYS LTD. 21.46% 254.553.15 WIPRO LTD. 13.27% 157,398.89 HCL TECH. LTD. 11.93% 141,437.61 TECH MAHINDRA LTD. 5.71% 67,706.35 ORACLE FS SOFTWARE LTD. 2.34% 27,773.21 MINDTREE LTD. 0.98% 11,586.20 MPHASIS LTD. 0.69% 8,173.43 VAKRANGEE LTD. 0.51% 6,014.31 CMC LTD. 0.49% 5,855.48 *The above table indicates the constituents with their respective market capitalization & the weight that they currently hold in the index. The following table shows the returns by the IT Index over different tenures. Duration Returns Duration Returns 1 Year 29.50% 3 Years 90.00% 2 Years 70.00% YTD 27.97% S&P BSE IT INDEX 20 3.3
  • 24. IT Index Weightage Information Technology Index Performance *The above given chart indicates the performance of the IT Index/Sector during the previous one year. TCS, 42.62% INFOSYS, 21.46% WIPRO, 13.27% HCL TECH., 11.93% TECH MAHINDRA , 5.71% ORACLE FS SOFTWARE, 2.34% MINDTREE, 0.98% MPHASIS, 0.69% VAKRANGEE, 0.51% CMC, 0.49% WEIGHT 8000 8500 9000 9500 10000 10500 11000 11500 12000 12500 DATES IT 21
  • 25. IT Index Sub Sectorial Weightage IT Index Performance (Returns) in comparison to SENSEX *The above given chart indicates the performance of the IT Index in comparison to BSE’s Benchmark Index SENSEX. 90 100 110 120 130 140 DATES IT (TR) SENSEX (TR) SOFTWARE, 99.00% HARDWARE, 1.00%WEIGHT 22
  • 26. *The values are in terms of Billion USD. Growth Potential The IT-BPM sector in India expanded at a CAGR of 25 per cent over 2000–13, which is 3–4 times higher than the global IT-BPM spend, and is estimated to expand at a CAGR of 9.5 per cent to USD300 billion by 2020 India is the world’s largest sourcing destination, accounting for approximately 52 per cent of the USD124–130 billion market. The country’s cost competitiveness in providing IT services, which is approximately 3-4 times cheaper than the US continues to be its USP in the global sourcing market. India’s highly qualified talent pool of technical graduates is one of the largest in the world, facilitating its emergence as a preferred destination for outsourcing, Computer science/information technology accounts for the biggest chunk of India' fresh engineering talent pool, with more than 98 per cent of the colleges offering this stream. Cost Efficiency Cost savings of 60–70 per cent over source countries. A preferred destination for IT & ITeS in the world; continues to be a leader in the global sourcing industry with 52 per cent market share. Policy Support Tax holidays extended to the IT sector SEZ scheme since 2005 to benefit IT companies with single window approval mechanism, tax benefits, etc. Setting up Information Technology Investment Regions (ITIRs). IT market in India Key Factors 47 50 59 69 76 22 24 29 32 32 0 20 40 60 80 100 120 2010 2011 2012 2013 2014 Market Size Of IT Industry Export Import 57.923.5 18.6 Sector Wise Break Up of Export Revenue (%) IT Services BPM Software & Engg. 23
  • 27. India is expected to become the fifth largest consumer durables market in the world by 2025. Also, the consumer electronics market is expected to increase to US$ 400 billion, while production could reach US$ 104 billion by 2016. The expected market size of consumer durables in India by 2015 is US$ 12.5 billion. Urban markets account for about 65 per cent of total revenues in the consumer durables sector in the country. The rural and semi-urban markets are likely to contribute a majority of consumer sales as the rural consumer durables market is growing at the compound annual growth rate (CAGR) of 25 per cent. The index comprises of 10 stocks from the banking sector which trade on the Bombay Stock Exchange. Index Details INDEX NAME CD ESTABLISHMENT DATE (BASE YEAR) FEBRUARY 1, 1999 LISTING DATE AUGUST 9, 1999 NO. OF CONSTITUENTS (COMPANIES) ELEVEN (11) The constituents of the S&P BSE CD Index are as follows: COMPANY WEIGHT MARKET CAP TITAN COMPANY LTD. 44.65% 35,472.05 WHIRPOOL INDIA LTD. 11.21% 8908.18 SYMPHONY LTD. 9.65% 7663.44 RAJESH EXPORTS LTD. 7.10% 5643.18 PC JEWELLER LTD. 6.86% 5450.91 VIDEOCON INDUSTRIES LTD. 6.50% 5160.70 BLUE STAR LTD. 5.30% 4210.07 TTK PRESTIGE LTD. 3.67% 2913.93 BAJAJ ELECTRICALS LTD. 2.75% 2185.03 VIP INDUSTRIES LTD. 1.74% 1386.15 GITANJALI GEMS 0.58% 458.71 *The above table indicates the constituents with their respective market capitalization & the weight that they currently hold in the index. The following table shows the returns by the CD Index over different tenures. Duration Returns Duration Returns 1 Year 69.00% 3 Years 52.80% 2 Years 49.90% YTD 77.99% S&P BSE CD INDEX 24 3.4
  • 28. CD Index Weightage CD Index Performance *The above given chart indicates the performance of the CDIndex/Sector during the previous one year. TITAN, 44.65% WHIRPOOL, 11.21% SYMPHONY, 9.65% RAJESH EXPORTS, 7.10% PC JEWELLER, 6.86% VIDEOCON, 6.50% BLUE STAR, 5.30% TTK PRESTIGE, 3.67% BAJAJ ELECTRICALS, 2.75% VIP INDUSTRIES, 1.74% WEIGHT 6000 6500 7000 7500 8000 8500 9000 9500 10000 10500 11000 DATES CD 25
  • 29. CD Index Sub Sectorial Weightage CD Index Performance (Returns) in comparison to SENSEX *The above given chart indicates the performance of the CD Index in comparison to BSE’s Benchmark Index SENSEX. 100 110 120 130 140 150 160 170 180 DATES CD (TR) SENSEX (TR) MISCELLANEOUS, 44.89% CONSUMER GOODS, 24.66% DIAMOND CUTTING & JEWELLERY, 14.04% DOMESTIC APPLIANCES, 8.12% ELECTRONIC GOODS, 6.53% PLASTICS, 1.76% WEIGHT 26
  • 30. *The values are in terms of USD Billion. Growth Potential & Growing Demand By 2025, India would rise from the twelfth position to the fifth position in the consumer durables market in the world. The market is expected to reach USD 12.5 billion by the end of FY 15. India has become one of the largest growing electronics market in the world. By 2020, the electronics market in India is expected to increase to USD 400 billion from USD 69.6 billion in 2012. The production is expected to reach USD 104 billion by 2016. Demand growth is likely to accelerate with rising disposable incomes and easy access to credit. Increasing electrification of rural areas and wide usability of online sales would also aid growth in demand. Opportunities Huge untapped rural market; currently there is only 2 per cent penetration for refrigerators and 0.5 per cent for washing machines. Rural and semi-urban markets currently contribute 35 per cent to total sales; their combined size is set to post a CAGR of 25 per cent over 2010-15. Policy Support 100 per cent FDI allowed in the electronics hardware-manufacturing sector under the automatic route; Approval of 51 per cent in multi-brand would further fuel the growth in this sector. National Electronic policy (2012) to boost investment in the sector. 15.7 17.8 21.3 24.2 30.2 34.8 36.8 47.3 103.7 0 20 40 60 80 100 120 2006 2007 2008 2009 2010 2011 2012 2015 2020 REVENUE CD market in India Key Factors 65% 35% Share in the CD Market in India Urban Rural 27
  • 31. The Indian Capital Goods sector has witnessed a remarkable growth over the last few years driven by increased investments in infrastructure and industrial production. The engineering sector, being closely associated with the manufacturing and infrastructure sectors of the economy, is of strategic importance to India’s economy. The index comprises of 10 stocks from the banking sector which trade on the Bombay Stock Exchange. Index Details INDEX NAME CG ESTABLISHMENT DATE (BASE YEAR) FEBRUARY 1, 1999 LISTING DATE AUGUST 9, 1999 NO. OF CONSTITUENTS (COMPANIES) TWENTY ONE (21) The constituents of the S&P BSE CG Index are as follows: COMPANY WEIGHT MARKET CAP LARSEN & TUBRO 34.90% 157,425.98 BHEL LTD. 13.81% 62,315.90 SIEMENS LTD. 11.33% 51,102.13 ABB INDIA LTD. 6.20% 27,978.22 BHARAT ELECTRONICS LTD. 5.90% 26,601.60 HAVELLS INDIA LTD. 4.06% 18,803.74 THERMAX LTD. 3.34% 15,065.33 AISTOM T&D INDIA LTD. 3.21% 14,493.71 OTHERS (12 Companies) 17.24% 77,821.19 *The above table indicates the constituents with their respective market capitalization & the weight that they currently hold in the index. The following table shows the returns by the CG Index over different tenures. Duration Returns Duration Returns 1 Year 52.50% 3 Years 63.90% 2 Years 78.90% YTD 69.33% S&P BSE CG INDEX 28 3.5
  • 32. CG Index Weightage CG Index Performance *The above given chart indicates the performance of the CD Index/Sector during the previous one year. L&T, 34.90% BHEL, 13.81%SIEMENS, 11.33% ABB INDIA, 6.20% BHEL, 5.90% HAVELLS, 4.06% THERMAX, 3.34% AISTOM T&D, 3.21% OTHERS (12 Cos), 17.24% WEIGHT 11000 11500 12000 12500 13000 13500 14000 14500 15000 15500 16000 16500 17000 17500 18000 18500 DATES CG 29
  • 33. CG Index Sub Sectorial Weightage CG Index Performance (Returns) in comparison to SENSEX *The above given chart indicates the performance of the CG Index in comparison to BSE’s Benchmark Index SENSEX. 100 110 120 130 140 150 160 170 DATES CG (TR) SENSEX (TR) INFRASTRUCTURE, 72.76% ELECTRIC EQUIPMENT, 6.42% ENGINE & ABRASIVES, 5.88% BEARINGS, 3.21% HEAVY ENGINEERING, 2.62% ELECTRICALS, 2.30% TUBES & PIPES, 1.36% WEIGHT 30
  • 34. *The values are in terms of Billion USD. Growth Potential Capital goods & engineering turnover expected to reach USD125.4 billion by 2017 from USD57.6 billion in 2012. Electrical equipment market size forecasted to reach USD105 billion by 2022 from USD24.2 billion in 2011. ER&D revenues projected to reach USD45 billion in 2020 from USD11.2 billion in 2012. Construction equipment market projected to reach USD22.7 billion by 2020 from USD3 billion in 2012. Telecom equipment market to reach USD37 billion by 2020 from USD16 billion in 2011. Production of CPSE under DHI to aggregate USD10.7 billion by 2015 from USD9.3 billion in 2012- 13. Opportunities Nuclear capacity expansion to provide significant business opportunities to the electrical machinery industry. Rapid increase in infrastructure investment and industrial production to fuel further growth. Policy Support Cumulative FDI at USD19.4 billion over April 2000–March 2014 due to policy support. De-licensed engineering sector; 100 per cent FDI permitted. CG market in India Key Factors 33.7 40.5 32.6 49.8 58.6 56.8 62.33 0 20 40 60 80 2008 2009 2010 2011 2012 2013 2014 India's Engineering Exports Export 32.5 26.8 17.7 9 14.1 Sector Wise Break Up of Export Revenue (%) Transport Equipment Machinery Equipment Maanufactures of metals Primary iron & steel others 31
  • 35. Oil & Gas sector is universally recognized as one of the most significant inputs for economic growth. The Index will include companies belonging to Petroleum & Gas production & processing. The BSE Oil & Gas Index comprises of 10 such companies. Index Details INDEX NAME OIL & GAS ESTABLISHMENT DATE (BASE YEAR) FEBRUARY 1, 1999 LISTING DATE AUGUST 23, 2004 NO. OF CONSTITUENTS (COMPANIES) TEN (10) The constituents of the S&P BSE OIL & GAS Index are as follows: COMPANY WEIGHT MARKET CAP RELIANCE INDUSTRIES LTD. 32.10% 275,082.08 OIL & NATURAL GAS CORP. LTD. 31.34% 268,513.74 INDIAN OIL CORP. LTD. 9.59% 82,186.11 BHARAT PETROLEUM CORP. LTD. 6.17% 56,540.46 GAIL INDIA LTD. 5.73% 49,115.55 CAIRN INDIA LTD. 4.94% 42,315.00 OIL INDIA LTD. 3.41% 29,211.91 CASTROL INDIA LTD. 2.74% 23,449.62 HINDUSTAN PETROLEUM CORP. LTD. 2.46% 21,062.79 PETRONET LNG LTD. 1.52% 13,053.75 *The above table indicates the constituents with their respective market capitalization & the weight that they currently hold in the index. The following table shows the returns by the OIL & GAS Index over different tenures. Duration Returns Duration Returns 1 Year 2.50% 3 Years 8.80% 2 Years 6.10% YTD 6.66% S&P BSE OIL & GAS INDEX 32 3.6
  • 36. Oil & Gas Index Weightage Oil & Gas Index Performance *The above given chart indicates the performance of the OIL&GAS Index/Sector during the previous one year. RIL, 32.10% ONGC, 31.34%INDIAN OIL, 9.59% BPCL, 6.17% GAIL, 5.73% CAIRN INDIA, 4.94% OIL INDIA, 3.41% CASTROL INDIA, 2.74% HPCL, 2.46% PETRONET LNG, 1.52% WEIGHT 8500 9000 9500 10000 10500 11000 11500 12000 12500 DATES OIL & GAS 33
  • 37. Oil & Gas Index Sub Sectorial Weightage Oil&Gas Index Performance (Returns) in comparison to SENSEX *The above given chart indicates the performance of the Oil & Gas Index in comparison to BSE’s Benchmark Index SENSEX. 100 110 120 130 140 DATES OIL & GAS (TR) SENSEX (TR) OIL DRILLING & EXPLORATION, 48.63% REFINERIES, 51.37% WEIGHT 34
  • 38. *The values are in terms MBPD (Million Barrels Per Day). Growth Potential India’s energy demand is expected to double to 1,464 MTOE by 2035 from 595 MTOE in 2013. Moreover, the country’s share in global primary energy consumption is projected to increase two fold by 2035. Oil consumption is estimated to reach 4.0 mbpd by FY16, expanding at a CAGR of 3.2 per cent during FY08–FY16F. By 2025, India is expected to overtake Japan to become the third-largest consumer of oil. LNG imports accounted for about one-fourth of total gas demand. India's gas demand is estimated to more than double over the next five years. Supply & Demand Due to the expected strong growth in demand, India’s dependency on oil imports is likely to increase further. With rising income levels, demand for automobile is estimated to increase. In FY14, imports accounted for approximately 80 per cent of the country’s total oil demand. Backed by new oil fields, domestic oil output is anticipated to grow to 1.0 mbpd by FY16. Demand is not likely to simmer down any time soon, given strong economic growth and rising urbanisation. Gas consumption is likely to expand at a CAGR of 21.0 per cent during FY 2008– 2017. Policy Support Government has enacted various policies such as the New Exploration Licensing Policy (NELP) and Coal Bed Methane (CBM) policy to encourage investments across the industry’s value chain. Oil & Gas market in India Key Factors 4 3.7 3.7 3.5 3.3 0 1 2 3 4 5 2016 2014 2013 2012 2011 Oil Consumption (MBPD) REVENUE 3.5 3.6 3.8 4 4.1 2.9 3 1.1 1.2 0.8 1.7 1.8 1.2 1 0 2 4 6 8 2010 2011 2012 2013 2014 2015 Imports & Domestic Oil Production IMPORTS OIL PRODUCTION 35
  • 39. FMCGs (Fast Moving Consumer Goods) are those goods and products, which are non- durable, mass consumption products and available off the shelf. The S&P BSE FMCG Index comprises of 12 companies who manufacture such products which are listed on the Bombay Stock Exchange. The index is computed using free float market capitalization method with the base period as December, 1995 indexed to a base value of 1000 wherein the level of the index reflects total free float market value of all the stocks in the index relative to a particular base market capitalization value. The method also takes into account constituent changes in the index and importantly corporate actions such as stock splits, rights, new issue of shares etc. without affecting the index value. Index Details INDEX NAME FMCG ESTABLISHMENT DATE FEBRUARY 1, 1999 LISTING DATE AUGUST 9, 1999 NO. OF CONSTITUENTS (COMPANIES) TWELVE (12) The constituents of the S&P BSE FMCG Index are as follows: COMPANY WEIGHT MARKET CAP ITC 33.73% 271,592.95 HINDUSTAN UNILEVER LTD. 25.31% 203,805.32 NESTLE INDIA LTD. 8.73% 70,262.70 UNITED SPIRITS LTD. 6.39% 51,466.44 DABUR INDIA LTD. 5.93% 47,706.87 GODREJ CONSUMER PRODUCTS LTD. 4.75% 38,267.64 COLGATE PALMOLIVE LTD. 3.49% 28,122.76 BRITANNIA INDIA LTD. 3.21% 25,877.41 EMAMI LTD. 3.03% 24,385.48 MARICO LTD. 2.93% 23,609.57 JUBILANT FOODWORKS LTD. 1.29% 10,418.06 TATA GLOBAL BEVERAGES 1.19% 9,575.92 *The above table indicates the constituents with their respective market capitalization & the weight that they currently hold in the index. S&P BSE FMCG INDEX 36 3.7
  • 40. FMCG Index Weightage FMCG Index Performance *The above given chart indicates the performance of the FMCG Index/Sector during the previous one year. ITC, 33.73% HUL, 25.31%NESTLE, 8.73% UNITED SPIRITS, 6.39% DABUR INDIA, 5.93% GSPL, 4.75% COLGATE PALMOLIVE, 3.49% BRITANNIA, 3.21% EMAMI, 3.03% MARICO, 2.93% JUBILANT FOODWORKS,… TATA GLOBAL BEVERAGES, 1.19% WEIGHT 6500 7000 7500 8000 8500 9000 DATES FMCG 37
  • 41. FMCG Index Sub Sectorial Weightage FMCG Index Performance (Returns) in comparison to SENSEX *The above given chart indicates the performance of the Auto Index in comparison to BSE’s Benchmark Index SENSEX. 100 110 120 130 140 DATES FMCG (TR) SENSEX (TR) PERSONAL CARE, 45.47% BREWERIES & DISTELLERIES, 6.40% TOBACCO, 33.73% FOOD PROCESSING, 11.92% PLANTATIONS, 1.19% MISCELLANEOUS, 1.29%WEIGHT 38
  • 42. *The values are in terms of Billion USD. Growth Potential Overall FMCG market expected to increase at a CAGR of 14.7 per cent to USD110.4 billion during 2012– 2020. The rural FMCG market expected to increase at a CAGR of 17.7 per cent to USD100 billion during 2012–2025. The overall rural FMCG consumption continues to grow at 12.5 per cent during 2013-14. Total consumption expenditure to reach nearly USD 3,600 billion by 2020 from USD 1,328 billion in 2012. Organised retail share is expected to double to 14-18 per cent of the overall retail market by 2015. Opportunities Low penetration levels in rural market offers room for growth. Growing demand for premium products. Exports is another growth segment. Policy Support Investment approval of up to 10 percent foreign equity in Single brand retail & 51 percent in multi brand retail. Initiatives like Food Security Bill & Direct Cash Transfer subsidies reach about 10% of households in India. The minimum capitalisation for foreign FMCG companies to invest in India is USD 100 million. FMCG market in India Key Factors 647 824.9 544.1 1131.7 1176.7 774.3 829.6 827.7 1102 1011.9 0 200 400 600 800 1000 1200 1400 ITC(Foods) HUL (F&B) MARICO DABUR GCPL Increasing Sales of Top FMCG Cos. FY 13 FY 14 411 516 631 0 200 400 600 800 Annual Per Capita Disposable Income level in Rural Region (USD) 2010 2015 2020 Rise in rural consumption to drive the FMCG market 39
  • 43. Pharmaceuticals sector is one of the key sectors where Indian companies have created a global brand for themselves besides software. Indian companies have taken advantage of the opportunities in the regulated generics market in the western countries and made deep inroads especially in providing low cost equivalents of expensive drugs. Pharma outsourcing into India and low cost Healthcare services are expected to be the key areas of growth in the near future. In addition, the inherent potential of biotechnology has also attracted many new companies and this is also a key growth area for Indian companies. BSE has developed BSE Healthcare Index to capture the performance of the companies in this sector. Index Details INDEX NAME HEALTHCARE ESTABLISHMENT DATE (BASE YEAR) FEBRUARY 1, 1999 LISTING DATE AUGUST 9, 1999 NO. OF CONSTITUENTS (COMPANIES) SEVENTEEN (17) The constituents of the S&P BSE HEALTHCARE Index are as follows: COMPANY WEIGHT MARKET CAP SUN PHARMA LTD. 30.91% 209,636.51 CUPIN LTD. 12.44% 84,392.01 Dr. REDDY’s INDUSTRIES LTD. 8.48% 57,479.31 CIPLA LTD. 8.34% 56,540.46 RANBAXY LAB. LTD. 4.98% 33,770.01 AURBINDO PHARMA LTD. 4.94% 33,481.61 CARDILA HEALTHCARE LTD. 4.78% 32,391.92 GSK PHARMA LTD. 4.12% 27,975.14 DIVIS LAB. LTD. 3.47% 23,548.52 GLENMARK PHARMA LTD. 3.37% 22,832.15 WOCKHARDT LTD. 2.91% 19,709.65 APOLLO HOSPITALS LTD. 2.83% 19,172.82 TORRENT PHARMA LTD. 2.73% 18,484.75 PIRAMAL ENTERPRISES LTD. 2.16% 14,665.02 IPCA LABS. LTD. 1.36% 9,224.59 BIOCON LTD. 1.26% 8,529.00 STRIDES ACROLAB LTD. 0.94% 6,372.02 *The above table indicates the constituents with their respective market capitalization & the weight that they currently hold in the index. S&P BSE HEALTHCARE INDEX 40 3.8
  • 44. Healthcare Index Weightage Healthcare Index Performance *The above given chart indicates the performance of the Health Index/Sector during the previous one year. SUN PHARMA, 30.91% CUPIN, 12.44% Dr. REDDY’s Ind., 8.48%CIPLA, 8.34% RANBAXY LAB., 4.98% AURBINDO PHARMA, 4.94% CARDILA HEALTHCARE, 4.78% GSK PHARMA, 4.12% DIVIS LAB., 3.47% GLENMARK PHARMA, 3.37% WOCKHARDT, 2.91% APOLLO HOSPITALS, 2.83% TORRENT PHARMA, 2.73% PIRAMAL ENT., 2.16% IPCA LABS., 1.36% BIOCON, 1.26% STRIDES ACROLAB, 0.94% WEIGHT 9000 9500 10000 10500 11000 11500 12000 12500 13000 13500 14000 14500 15000 15500 16000 16500 17000 17500 DATES HEALTHCARAE 41
  • 45. Healthcare Index Sub Sectorial Weightage Healthcare Index Performance (Returns) in comparison to SENSEX *The above given chart indicates the performance of the Healthcare Index in comparison to BSE’s Benchmark Index SENSEX. 100 110 120 130 140 150 160 170 180 DATES HEALTHCARE (TR) PHARMACEUTICALS, 97.18% MEDICAL SERVICES, 2.82% WEIGHT 42
  • 46. *The values are in terms of USD Billion. Growth Potential Indian pharmaceutical sector accounts for about 2.4 per cent of the global pharmaceutical industry in value terms and 10 per cent in volume terms. The country’s pharmaceutical industry is expected to expand at a CAGR of 14.5 per cent over to reach USD55 billion by 2020. The generics market is expected to grow to USD26.1 billion by 2016 from USD11.3 billion in 2011; India’s generics market has immense potential for growth. Indian healthcare sector, one of the fastest growing sectors, is expected to advance at a CAGR of 17 per cent to reach USD280 billion over 2011–20. Cost Efficiency India’s cost of production is approximately 60 per cent lower than that of the US and almost half of that of Europe Due to lower cost of treatment, India is emerging as a leading destination for medical tourism. Policy Support Government unveiled ‘Pharma Vision 2020’ aimed at making India a global leader in end-to-end drug manufacture. Reduced approval time for new facilities to boost investments. In this sector, 100 per cent FDI is allowed under automatic route. Healthcare market in India Key Factors 6 14 55 0 10 20 30 40 50 60 2004 2014 2020 REVENUE GROWTH REVENUE 5 7 9 10 8 1.1 1.2 1.7 1.8 1.2 0 2 4 6 8 10 12 2010 2011 2012 2013 2014 TRADE GROWTH EXPORTS IMPORTS 43
  • 47. The BSE Metal Index is designed to reflect the behavior and performance of the Metals sector including mining. The Index comprises of 15 stocks that are listed on the Bombay Stock Exchange. Index Details INDEX NAME METAL ESTABLISHMENT DATE (BASE YEAR) FEBRUARY 1, 1999 LISTING DATE AUGUST 23, 2004 NO. OF CONSTITUENTS (COMPANIES) NINE (09) The constituents of the S&P BSE METAL Index are as follows: COMPANY WEIGHT MARKET CAP COAL INDIA LTD. 41.83% 230,57.65 HINDUSTAN ZINC LTD. 12.94% 71,238.56 SESA STERLITE LTD. 10.53% 57,989.42 NMDC LTD. 9.45% 52,056.51 TATA STEEL LTD. 5.76% 31,715.04 SAIL LTD. 5.10% 28,108.22 HINDALCO INDUSTRIES LTD. 4.94% 27,195.79 JSW STEEL LTD. 4.13% 22,766.40 JINDAL STEEL & POWER 3.10% 17,044.66 NACL LTD. 2.21% 12,164.57 *The above table indicates the constituents with their respective market capitalization & the weight that they currently hold in the index. The following table shows the returns by the Metal Index over different tenures. Duration Returns Duration Returns 1 Year 9.60% 3 Years -18.80% 2 Years 5.20% YTD -2.55% S&P BSE METAL INDEX 44 3.9
  • 48. Metal Index Weightage Metal Index Performance *The above given chart indicates the performance of the Metal Index/Sector during the previous one year. COAL INDIA LTD., 41.83% HINDUSTAN ZINC LTD., 12.94% SESA STERLITE LTD., 10.53% NMDC LTD., 9.45% TATA STEEL LTD., 5.76% SAIL LTD., 5.10% HINDALCO INDUSTRIES LTD., 4.94% JSW STEEL LTD., 4.13% JINDAL STEEL & POWER, 3.10% NACL LTD., 2.21%WEIGHT 8500 9000 9500 10000 10500 11000 11500 12000 12500 13000 13500 14000 14500 DATES METAL 45
  • 49. Metal Index Sub Sectorial Weightage Metal Index Performance (Returns) in comparison to SENSEX *The above given chart indicates the performance of the Metal Index in comparison to BSE’s Benchmark Index SENSEX. 100 110 120 130 140 150 160 170 DATES METAL (TR) SENSEX (TR) MINING & MINERALS, 61.92% STEEL LARGE, 15.02% NON FERROUS METAL, 12.80% ALUMINIUM, 7.16% SPONGE STEEL, 3.10% WEIGHT 46
  • 50. At Present in power sector nearly half i.e., 49.15% is under State electricity Boards, which is followed by Public Sector Unit’s like NTPC, NHPC, etc. The role of private sector is about 19.85%, which is at present least among the three sectors, but private sector is growing at a far greater pace than any other sector, the latest advancements in this direction are allotment of UMPP’s to private sector. Energy sector is universally recognized as one of the most significant inputs for economic growth. The growth of a nation, encompassing all sectors of the economy and all sections of society, is contingent on meeting its energy requirements adequately. As a fast-growing economy, India has become one of the largest energy intensive countries in the World. Energy is a crucial input for India's development process. The need of the hour, therefore, is to meet the energy needs of all segments of India's population in the most efficient and cost- effective manner while ensuring long-term sustainability. Index Details INDEX NAME POWER ESTABLISHMENT DATE (BASE YEAR) JANUARY 3, 2005 LISTING DATE JANUARY 9, 2007 NO. OF CONSTITUENTS (COMPANIES) NINETEEN (29) The constituents of the S&P BSE POWER Index are as follows: COMPANY WEIGHT MARKET CAP NTPC LTD. 24.75% 131,556.31 PGCI LTD. 14.43% 76,695.11 BHEL LTD. 11.72% 62,315.90 SIEMENS LTD. 9.61% 51,102.13 ABB INDIA LTD. 5.26% 27,978.22 NHPC LTD. 4.09% 21,753.87 TATA POWER LTD. 4.06% 21,555.86 JSW ENERGY LTD. 3.57% 18,958.98 RELIANCE POWER LTD. 3.06% 16,276.37 OTHERS (10 Companies) 19.45% 103,382.44 *The above table indicates the constituents with their respective market capitalization & the weight that they currently hold in the index The following table shows the returns by the POWER Index over different tenures. Duration Returns Duration Returns 1 Year 37.40% 3 Years -2.20% 2 Years 26.20% YTD 30.35% S&P BSE POWER INDEX 47 3.10
  • 51. Power Index Weightage Power Index Performance *The above given chart indicates the performance of the Power Index/Sector during the previous one year. NTPC, 24.75% PGCI, 14.43% BHEL, 11.72%SIEMENS, 9.61% ABB INDIA, 5.26% NHPC, 4.09% TATA POWER, 4.06% JSW ENERGY , 3.57% RELIANCE POWER , 3.06% OTHERS (10 Cos), 19.45% WEIGHT 1400 1600 1800 2000 2200 2400 2600 DATES POWER 48
  • 52. Power Index Sub Sectorial Weightage Power Index Performance (Returns) in comparison to SENSEX *The above given chart indicates the performance of the Power Index in comparison to BSE’s Benchmark Index SENSEX. 100 110 120 130 140 150 DATES POWER (TR) SENSEX (TR) GENERATION & DISTRIBUTION, 63.92% INFRASTRUCTURE, 30.92% EQUIPMENT & TRANSMISSION, 4.73% WEIGHT 49
  • 53. Real estate sector in India is witnessing significant growth. Recent dynamics of the market reflected the opportunity of creating wealth across real estate companies, as proven by recent listings of real estate companies resulting into prominent growth in public funds and private equity. The main growth thrust is coming due to favorable demographics, increasing purchasing power, existence of customer friendly banks & housing finance companies, professionalism in the real estate sector and favourable reforms initiated by the government to attract global investors. Further necessitated by the thrust of redevelopment of old buildings, building townships and redeveloping mill lands, one can witness plenty of opportunities in real estate sector backed by favourable tax regime. BSE has developed the BSE Realty Index to synergize these emerging opportunities along with their Index expertise creating new investment avenues for investors. Index Details INDEX NAME REALTY ESTABLISHMENT DATE (BASE YEAR) FEBRUARY 2, 2005 LISTING DATE JULY 9, 2007 NO. OF CONSTITUENTS (COMPANIES) THIRTEEN (13) The constituents of the S&P BSE BANKEX Index are as follows: COMPANY WEIGHT MARKET CAP DLF LTD. 30.28% 28,065.36 NBCC LTD. 13.03% 12,072.00 PRESTIGE ESTATE LTD. 10.63% 9,851.25 OBEROI REALTY LTD. 9.96% 9,230.05 GODREJ PROPERTIES LTD. 5.71% 5,287.72 PHOENIX MILLS LTD. 5.69% 5,271.66 UNITECH LTD. 5.49% 5,088.70 HDIL LTD. 5.02% 4,650.90 SOBHA LTD. 4.62% 4,279.34 INDIABULLS REAL ESTATE LTD. 3.39% 3,138.46 OMAXE LTD. 2.63% 2,438.06 MAHINDRA LIFESPACES LTD. 2.21% 2,049.58 ANANT RAJ LTD. 1.35% 1,248.27 *The above table indicates the constituents with their respective market capitalization & the weight that they currently hold in the index. S&P BSE REALTY INDEX 50 3.11
  • 54. Realty Index Weightage Realty Index Performance *The above given chart indicates the performance of the REALTY Index/Sector during the previous one year. DLF LTD., 30.28% NBCC LTD., 13.03%PRESTIGE ESTATE, 10.63% OBEROI REALTY, 9.96% GODREJ PROPERTIES, 5.71% PHOENIX MILLS, 5.69% UNITECH LTD., 5.49% HDIL LTD., 5.02% SOBHA LTD.,… INDIABULLS RE LTD., 3.39% OMAXE LTD., 2.63% MAHINDRA LIFESPACES, 2.21% ANANT RAJ LTD., 1.35% WEIGHT 1000 1100 1200 1300 1400 1500 1600 1700 1800 1900 2000 2100 2200 2300 DATES REALTY 51
  • 55. Realty Index Sub Sectorial Weightage Realty Index Performance (Returns) in comparison to SENSEX *The above given chart indicates the performance of the Realty Index in comparison to BSE’s Benchmark Index SENSEX. 100 110 120 130 140 150 160 170 180 DATES REALTY (TR) SENSEX (TR) CONSTRUCTION & CONTRACTING, 73.60% CIVIL CONSTRUCTION, 7.70% GENERAL INFRASTRUCTURE, 13.30% WEIGHT 52
  • 56. *The values are in terms MBPD (Million Barrels Per Day). Growth Potential FDI in the sector is estimated to grow to USD25 billion in 10 years. The number of Indians living in urban areas will increase from the current 377 million to about 600 million by 2031. India construction market is expected to more than double to USD649.5 billion by 2020 from USD360 billion in 2010. Supply & Demand Growing requirements of space from sectors such as education and healthcare. Growth in tourism providing opportunities in the hospitality sector. Policy Support Allocation of USD1.3 billion for rural housing and USD0.7 billion for NHB to increase the flow of cheaper credit for affordable housing for urban poor as per Budget 2014-15. The government has allowed FDI of up to 100 per cent in development projects for townships and settlements. Realty market in India Key Factors 230 165 400 775 105 245 270 315 0 500 1000 Ahemdabad Pune Bengaluru NCR Kolkata Mumbai Hydrebad Chennai Demand Analysis 2014- 2017 ('000 units) 5.9 9.2 8.6 0 2 4 6 8 10 FY 13FY 12FY 11 FDI in Realty Sector (%) 53
  • 57. The decade of 1990s saw the emergence of the TMT sector as a major force in the Indian economy. The remarkable growth of this sector was reflected in the financial markets. Going by the trading pattern, around 19% of the turnover on the stock exchanges is taking place in TMT sector stocks. These stocks collectively account for 15% of the total market capitalization. The investment interest in technology stocks continues unabated. Recognizing the growing importance of the TMT sector, S&P BSE TECk index was launched in 2001. Index Details INDEX NAME TECK ESTABLISHMENT DATE (BASE YEAR) APRIL 2, 2001 LISTING DATE JULY 11, 2001 NO. OF CONSTITUENTS (COMPANIES) TWENTY NINE (29) The constituents of the S&P BSE TECK Index are as follows: COMPANY WEIGHT MARKET CAP TATA CONSULTANCY SERVICES LTD. 31.33% 505,550.26 INFOSYS LTD. 15.78% 254.553.15 BHARTI AIRTEL LTD. 9.92% 160,035.91 WIPRO LTD. 9.76 157,398.89 HCL TECH. LTD. 8.77% 141,437.61 BHARTI INFRATEL LTD. 4.55% 42,315.00 TECH MAHINDRA LTD. 4.20% 67,706.35 IDEA CELLULAR LTD. 4.06% 23,449.62 ZEE ENTERTAINMENT ENTERPRISE LTD. 2.05% 21,062.79 OTHERS (20 Companies) 9.62% 153,224.96 *The above table indicates the constituents with their respective market capitalization & the weight that they currently hold in the index. The following table shows the returns by the TECK Index over different tenures. Duration Returns Duration Returns 1 Year 28.70% 3 Years 76.90% 2 Years 62.20% YTD 26.10% S&P BSE TECK INDEX 54 3.12
  • 58. TECK Index Weightage Teck Index Performance *The above given chart indicates the performance of the Teck Index/Sector during the previous one year. TCS, 31.33% INFOSYS, 15.78% BHARTI AIRTEL, 9.92% WIPRO, 9.76% OTHERS (20 Cos.), 9.62% HCL TECH., 8.77% BHARTI INFRATEL , 4.55% TECH MAHINDRA, 4.20% IDEA CELLULAR, 4.06% ZEE ENT., 2.05% WEIGHT 4500 5000 5500 6000 6500 7000 DATES TECK 55
  • 59. TECK Index Sub Sectorial Weightage TECK Index Performance (Returns) in comparison to SENSEX *The above given chart indicates the performance of the TECK Index in comparison to BSE’s Benchmark Index SENSEX. 90 100 110 120 130 140 DATES TECK (TR) SENSEX (TR) COMPUTER SOFTWARE, 73.26% TELECOM SERVICE, 16.00% MEDIA & ETERTAINMENT, 5.27% TELECOM EQUIPMENT, 4.70% CABLES, 0.28% WEIGHT 56
  • 60. #Figures in Percentage. # Data for past three years ending February, 2015. #Figures in Percentage. # Data for past three years ending February, 2015. HEALTHCARE, 66.5 AUTO, 53.4 IT, 29.5 CG, 52.5 BANKEx, 55.4 109.1 82.4 70 78.9 59.2 160.2 92.4 90 63.9 74.9 0 20 40 60 80 100 120 140 160 180 HEALTHCARE AUTO IT CG BANKEx THREE YEARS TWO YEARS ONE YEAR Sectors that gave the highest return Sectors that lagged in the past years Oil & Gas, 2.5 Metals, 9.6 Realty, 26.6 Power, 37.4 6.1 5.2 -15.7 26 8.8 -18.8 -8 -2.2 -20 -15 -10 -5 0 5 10 15 20 25 30 35 40 Oil & Gas Metals Realty Power Three Year Two Year One Year 57 3.13
  • 61. S&P BSE 100 Index is a broad based Index. This Index has 1983-84 as the base year and was launched in 1989. In line with the shift of the S&P BSE Indices to the globally accepted Free-Float methodology, S&P BSE 100 was shifted to Free-Float methodology effective from April 5, 2004. The method of computation of Free-Float index and determination of free-float factors is similar to the methodology for S&P BSE SENSEX. Over the years, the number of companies listed on BSE continued to register a phenomenal increase; from 992 in to over 3,200 companies by March 1994, with combined market capitalization rising from Rs.5,421 crore to Rs. 3,98,432 crore as on 31st March, 1994. Though S&P BSE SENSEX (1978-79=100) was serving the purpose of quantifying the price movements as also reflecting the sensitivity of the market in an effective manner, the rapid growth of the market necessitated compilation of a new broad-based index series reflecting the market trends in a more effective manner and providing a better representation of the increased equity stocks, market capitalization as also to the new industry groups. As such, BSE launched on 27th May 1994, two new index series S&P BSE 200 and S&P Dollex 200. The equity shares of 200 selected companies from the specified and non-specified lists of BSE were considered for inclusion in the sample for `S&P BSE 200'. The selection of companies was primarily been done on the basis of current market capitalization of the listed scrips. Moreover, the market activity of the companies as reflected by the volumes of turnover and certain fundamental factors were considered for the final selection of the 200 companies. BSE Limited constructed a new index, christened S&P BSE-500, consisting of 500 scrips w.e.f. August 9, 1999. The changing pattern of the economy and that of the market were kept in mind while constructing this index. S&P BSE 500 index represents nearly 93% of the total market capitalization on BSE. S&P BSE 500 covers all 20 major industries of the economy. In line with other S&P BSE indices, effective August 16, 2005 calculation methodology was shifted to the free-float methodology. BSE 100 INDEX BSE 200 INDEX BSE 500 INDEX BROAD INDICES 58 4.0
  • 62. BSE PSU Index consists of major Public Sector Undertakings listed on Bombay Stock Exchange (BSE). BSE PSU Index was launched on June 4, 2001 to track the performance of listed equity of PSU companies. A benchmark for the Indian Central Government to monitor its wealth in PSUs. The index uses base date of February 1, 1999 and a base value of 1000. The index consists of all Public Sector Undertaking (PSUs) companies in BSE-500 index. BSE PSU Index shows change in the wealth of Indian Central Government in PSUs. Companies in which Indian Central Government has greater than or equal to 51% stake that are listed in the BSE PSU Index and they should also be a part of BSE-500 Index. The S&P BSE India Infrastructure Index is designed to measure the performance of the top 30 Indian infrastructure companies that meet benchmarking and investMENT ability requirements, with the goal of providing liquid and tradable exposure to this sector comprising of five infrastructure clusters: • ENERGY • TRANSPORTATION • NON BANKING FINANCIAL INSTITUTIONS • TELECOMMUNICATIONS • UTILITIES The CPSE Index tracks returns generated by the state-owned companies, barring public sector banks. The CPSE Index will track returns generated by state-owned companies where the direct holding of the government is 51 per cent or more. The indices were developed by Asia Index Private Ltd, a joint venture between BSE and the S&P Dow Jones Indices. BSE PSU BSE INFRASTRUCTURE BSE CPSE THEMATIC INDICES 59 4.1
  • 63. Different types of Public Enterprises 1. CPSEs (Central Public Sector Enterprises) – Companies where the direct holding of the Central Government or of other CPSEs is 51% or more 2. PSBs (Public Sector Banks) – Banks where the direct holding of the Central/State Government or other PSBs is 51% or more 3. SLPEs (State Level Public Enterprises) – Companies where the direct holding of the State Government or other SLPEs is 51% or more Background and History In 1947, when India became independent, there were various socio-economic problems confronting the country which needed to be dealt with in a planned and systematic manner. India at that time was primarily an agrarian economy with a weak industrial base, low level of savings, inadequate investments and lack of infrastructure facilities. There existed considerable inequalities in income and levels of employment, glaring regional imbalances in economic development and lack of trained manpower. As such, the State’s intervention in all the sectors of the economy was desirable and inevitable since private sector neither had the resources, managerial and scientific skill, nor the will to undertake the risks associated with large, long-gestation investments. Given the type and range of problems faced by the country on the economic, social and strategic fronts, it became a pragmatic compulsion to use the public sector as an instrument for self-reliant economicgrowth. The dominant consideration for the continued large investments in public sector enterprises was to accelerate the growth of core sectors of economy; to serve the equipment needs of strategically important sectors like Railways, Telecommunications, Nuclear Power, Defense etc. and to provide a springboard for the economy to achieve a significant degree of self-sufficiency in the critical sectors. The rationale for setting up public enterprises was to ensure easier availability of vital articles of mass consumption, to introduce checks on prices of important products, help promote emerging areas like tourism, etc. A large number of enterprises were created out of "Sick Units" taken over from the private sector inter alia, to protect the interests of the workers. A number of public enterprises were created to operate in national and international trade, consultancy, contract and construction services. INDEX NAME PSU ESTABLISHMENT DATE (BASE YEAR) FEBRUARY 1, 1999 LISTING DATE JUNE 4, 2001 NO. OF CONSTITUENTS (COMPANIES) SIXTY (60) The following table shows the returns by the PSU Index over different tenures. Duration Returns Duration Returns 1 Year 31.10% 3 Years 0.90% 2 Years 13.50% YTD 31.95% BSE PSU INDEX 60 4.2
  • 64. The first of its kind in India, the SENSEX Realized Volatility (REALVOL) Index provides market participants with an accurate measure of the historic volatility of the SENSEX over fixed 1-, 2-, and 3-month time horizons, which are synchronized with BSE’s 1-, 2-, and 3- month futures & options expiration cycles. Each index is reset at the end of its respective cycle. The SENSEX REALVOL will be a useful tool for option writers attempting to manage their risk, as their P&L is driven by the difference between realized volatility and implied volatility over the life of options written. Products based on the REALVOL family of indices will allow Indian traders to hedge against sudden price movements (i.e. reducing Gamma exposure) and to take directional bets on the realized volatility of the SENSEX. Volatility modelling has traditionally relied on complex econometric procedures in order to accommodate the inherent latent character of volatility. Realized volatility is an important metric that provides market participants an accurate measure of the historical volatility of the underlying over the life cycle of the derivative contract. Over the last decade, investors have extensively used volatility as a trading asset. The negative correlation between equity market returns and volatility has been well documented and thus volatility provides a significant diversification benefit to an investment portfolio. The mechanics of the realized vol. index are simple – we compute daily realized variance simply by summing squared returns. The theory of quadratic variation reveals that, under suitable conditions, realized volatility is not only an unbiased ex-post estimator of daily return volatility, but also asymptotically free of measurement error. • RVI Is considered a useful complement to the VIX because RVI captures realized volatility while the VIX measures implied volatility. • Derivative contracts on RVI can be used for hedging gamma exposures and for directional bets on volatility. • The skew needed to price out-of-the-money options can now be computed on a realized vs. implied basis • With the advent of volatility and covariance swaps in the OTC market, realized volatility itself is now the underlying. Such swaps are useful for, among others, holders of options who wish to hedge their holdings, i.e., offset the impact of changes in volatility on the value of their positions. • Improved volatility and correlation forecasts will also be useful for portfolio allocation and risk management. • Swap contracts on realized variance have now been trading over the counter for some years with a fair degree of liquidity. More recently, derivatives whose payoffs are nonlinear functions of realized variance have also begun to trade over the counter. In particular, a natural outgrowth of the variance swap market is an interest in volatility swaps, which are essentially forward contracts written on the square root of realized variance. BSE REAL VOL MTH 1,2,3 VOLATILITY INDICES Applications of Realized Volatility Index 61 4.3
  • 65. BSE introduced the new index series - S&P BSE IPO index to track the current primary market conditions in the Indian capital market and measure the growth in investor’s wealth within a period of two years after listing of a company subsequent to successful completion of initial public offering (IPO). Robust growth of the Indian economy, 6.7% in 2008-09, and the expectation of higher growth in the future are expected to boost the primary market. For this and other reasons, it was an appropriate time to introduce to the market an indicator that will track primary market conditions in the Indian capital market. BSE on August 24, 2009 announced the launch of S&P BSE IPO index to track the value of companies for two years after listing subsequent to successful completion of their initial public offering (IPO). BSE continued to introduce index innovations with the launch of the IPO index, by introducing ceiling (capping) on weightings of index constituents. Market capitalisation weightings of index constituents is limited to 20%. If a constituent’s market capitalization results in a higher weighting, the company’s weight is suitably adjusted to ensure that all constituents are restricted to 20% in the index. However, between any rebalancing, weightage of any index constituent can exceed 20%. The Micro, Small and Medium Enterprises (MSMEs) segment in India plays a pivotal role in the overall growth and development of economy of the country. In recent years the MSME segment has consistently registered higher growth rate compared to the overall industrial sector. With its agility and dynamism, the segment has shown admirable innovativeness and adaptability to survive the recent economic downturn and recession. BSE has introduced BSE SME IPO index on December 14, 2012. It will enable investors to track performance of the SME companies listed at BSE. All BSE indices reflect the growth in the market value of the constituent stocks over the base period in Rupee terms. A need was felt to design a yardstick by which these growth values are also measured in Dollar terms. Such an index would reflect, in one value, the changes in both the stock prices and the foreign exchange variation. This was facilitated by the introduction of a dollar-linked index in which the formula for calculation of the index is suitably modified to express the current and the base market values in dollar terms. The scope for the dollar-linked index emerged from the background of the Indian equity markets increasingly getting integrated with the global capital markets and the need to assess the market movements in terms of international benchmarks. BSE IPO STRATEGY INDICES BSE SME IPO BSE DOLLEX 30, 100, 200, 500 62 4.4
  • 66. The dollar-linked indices are useful to overseas investors, as it helps them measure their ‘real returns’ after providing for the exchange rate fluctuations. Dollex-30, a dollar linked version of SENSEX, was launched on July 25, 2001 whereas Dollex-200, a dollar version of BSE 200 was launched on May 27, 1994. These indices were initially calculated at the end of the trading session by taking into consideration day’s rupee/US$ reference rate as announced by India’s Central Bank i.e. Reserve bank of India. BSE introduced Dollex-100, a dollar linked version of BSE-100, on May 22, 2006. Dollex-30, Dollex-100 and Dollex-200 are calculated and displayed through BSE On-line trading terminals (BOLT) by taking into account real-time rupee/US$ Exchange rate. The formula for calculating the index is: Dollex = (Index Value (In local currency) X Base rupee-US$ rate) ÷ Current rupee-US$ rate 63
  • 67. PERSONAL INTERVIEW INTERVIEWEE DETAILS: NAME PANKAJ TUKARAM BAGAL OCCUPATION STOCK BROKER, TRADER, TECHNICAL ANALYST DESIGNATION FRANCHISEE OWNER ORGANIZATION SHAREKHAN PVT. LTD. CONTACT 97681 69958 ADDRESS S 07/ SHOP No. 31, SECOND FLOOR, HAWARE CENTURION MALL, SECTOR 19 A, SEAWOODS, NERUL, NAVI MUMBAI- 400706. 1. SHOULD INDIVIDUAL STOCKS BE TRACKED ON THE BASIS OF THEIR INDICES? Pankaj. You can’t track an individual stock based on the basis of their indices, because every single stock moves based on the information/news that is available in the market and according to the price to volume action in the market. However, a news about a particular sector/industry can definitely affect all or most of the stocks in that sectors index. 2. PEOPLE CONSIDER SOME INDICES TO BE EFFECTIVE & OTHERS NOT. WHAT IS YOUR TAKE ON IT? Pankaj. Every index is effective. Each index, is basically, a group of companies which represent the entire market. So every index is important. Since they represent various segments of the market. Every index has its process of calculation. I mean, not every stock can be considered according to the index movement because if we take Sensex as an example, if suppose today, Sensex is up 290 points. You will still find some companies closing with the negative mark. Which has got nothing to do with the index movement. 3. DOES AN INDEX PROVIDE AN ACCURATE BENCHMARK? Pankaj. Absolutely. You can always compare your stocks with the index, considering it as the benchmark to test your returns, your growth. There is something called as Beta or people call it High Beta stock. You can compare the PE Ratio of the index, which is benchmark, to the PE Ratio of your stock and can take your decisions accordingly. This will help you know whether the stock is valued right. 4. THERE ARE SEVERAL NUMBER OF INDICES IN THE MARKET. IS IT NECESSARY TO HAVE ALL OF THEM? Pankaj. Actually, no. You can only have Sensex & Nifty. These are two indices which are very effective for you to judge the markets movement. 5. THERE ARE INDICES BASED ON THE NUMBER OF STOCKS THEY HOLD. SUCH AS, BSE 100, BSE 200. WHAT DIFFERENCE DO THE NUMBERS MAKE? Pankaj. It means, those number of stocks are part of that index. Like BSE Sensex has 30 stocks, same way, BSE 100 has the top 100 stocks. They make these indices because what people find that if you have a broader range of stocks then you can better track the markets movements. Since more companies are involved in those indices, it will give you data from a broader perspective. 6. FOR BEGINNERS, ARE BENCHMARK INDICES THE RIGHT GROUND TO START WITH? Pankaj. Yes, because the companies which are listed in the index are the safest for people to invest in the market. 7. AN INDEX IS MORE OR LESS AN AVERAGE, OR IS THERE ANY OTHER RELEVANCE TO IT? Pankaj. Its not an average, it is an altogether different & very complex set of calculations. From a lay man’s eye, they could think it as an average. But it depends on the market cap of the company, the base year, the base value & a lot of mathematical calculation. 64 5.0
  • 68. 8. CONSIDERING THE MARKET SENTIMENTS THIS YEAR, DO YOU THINK THAT THE SENSEX & NIFTY COULD APPRECIATE FURTHER? Pankaj. If you ask me, I have a personal target of 9500 for nifty and 30000 for Sensex. 9. ACCORDING TO YOU, WHICH OF THE TWO IS BETTER, SENSEX OR NIFTY? Pankaj. I personally don’t follow Sensex much. Why nifty, that is because, since I m a trader, many of my trades are in futures & options market, the trade on NSE is I feel better than that of BSE. In the end, everyone has their own choice, own taste. Nothing anti- Sensex. And NSE was the first one to start the online trade & other innovations on the trading grounds. BSE has just played the catch- up game. Earlier BSE was just controlled by a dozen or handful of share brokers but adhering to the increased competition they had to convert into a company be responsible to investors. NSE has really taken the initiative to take things up. 10. ARE THE PRICES OF THE SAME COMPANY, QUOTED DIFFERENTLY ON NSE & BSE? Pankaj. It doesn’t happen. Both places, the price moves in the same manner. Earlier there used to be some difference in price. People used to enter into an arbitrage position in such situations. But I feel it’s a waste of time. Hardly you get to earn anything except when the volumes are very high. 11. IT IS OBSERVED THAT DIVERSIFICATION YIELD DIMINISHING RETURNS & ILLIQUID STOCKS ARE BEST KEPT OUT OF AN INDEX. WHAT IS THE MIDDLE ROAD FORWARD? Pankaj. Illiquid stocks will never be a part of an index. Liquidity means that if I now placed the order, it got executed. So definitely if it is illiquid it won’t be a part of an index. Whereas, diversification does help reduce risk for those who want to stay invested for long. 12. WON’T SPECULATORS TRY TO PUSH A STOCK INTO THE INDEX OR REMOVE ONE WHEN THEY ARE GOING SHORT ON IT? Pankaj. No. Nobody can do that. Speculators cannot do such a thing to put a stock in or out of an index. Like I’ll give you an example, L&T is a stock that is listed on both the stock exchanges, their indices. This stock is currently trading at Rs. 1600 & it has huge volumes of trade around it. The free float equity available in the market for investors to trade is huge. So for someone to remove it out from Sensex or Nifty, they will need huge money to do so. In literal terms, it is not possible. The company will have to itself erode its equity market cap to come out of the index. So no single person or a group of people can do it. 13. WHAT MEASURES DO THE STOCK EXCHANGE TAKE WHEN THE INDICES BECOME VOLATILE? Pankaj. They apply their measures called Circuit Breakers. But it has to really move that much for the circuits to apply. As far as I remember, there has been only one occasion when this had happened, sone 7 years back in 2008, that the markets had crashed terribly & the circuit breakers were applied & the trading was stopped. That was the time when Sensex had dropped from nearly 20,000 to 8,000. 14. ON WHAT GROUNDS ARE THE INDICES COMPARED WITH EACH OTHER? Pankaj. For an investor like me, I will just add different sectors to my portal & see the chart movements as to which one is moving with the Nifty. It is simple, that markets move with the cash flow. If money is moving into a particular sector, then that sector is gaining. Even sectors have a stock cycle. In our markets every cycle lasts for around 6 or 7 years, wherein they go through growth phase then they are at peak, then they slow down & finally end up at lows. Then there are phases like they will move sideways, then they will move up. These are cycles, so every company, every sector has to go through these cycles. When you look at them, you can actually see which index the money is flowing to & which sector the money is being taken out. Based on that you can select. 15. ANY TRIGGERS THAT YOU ARE LOOKING FOR, WHICH COULD GIVE THE MARKETS A BOOST? Pankaj. There are two things that I’ll be looking for. The first is, the inflation rate & the rate cuts in the lending rates. The logic is, that when inflation goes down, people money to spend, that is extra cash, this cash is used for investing in some or the other thing like mutual funds or other instruments, which ultimately comes to the markets. That will be one of the triggers. Secondly, the interest rates, RBI has recently come up with rate cuts. They have reduced it to about 75 basis points. Now when the interest 65
  • 69. rate is cut short, again the same thing happens, your EMIs go down, again you remain with excess cash. This if you look at for the whole country, that gives you a lot of money, a lot of cash that is saved. When you have cash in your pocket, you look for investments. When you don’t, you can’t even think about investing. So these are basically two triggers that I would look for. 16. AT THIS POINT OF TIME, WHAT ADVICE WOULD YOU GIVE TO THE RETAIL INVESTORS? Pankaj. At this point, the market looks very good. Two people who are driving this market, politically we have a stable government in the centre & at the same time our RBI governor is a very aggressive man & has taken some good decisions to boost this market. At the same time, the country’s GDP & other things are expected to show very good numbers. I’m very confident that since it’s a stable government for four more years, so we can expect four more financial budgets, which is the biggest event for any market & the economy. This budget was good, we expect four better budgets to come. Reforms will certainly happen & a better picture of our markets will be seen. So this market will be in a bull run for a longer period of time. 17. NOW SINCE THE RALLY IS CONTINUING, ACCORDING TO YOUR EXPERIENCE & YOUR OUTLOOK, TILL WHAT TIME WILL THE RALLY SUSTAIN? Pankaj. No one can actually tell you the exact time period. As I understand it, everything has got a cycle. Any business, any sector, any market has it. In Nifty, the cycle for five years from 2003 to 2008 has been an uptrend, then for two years it was down, Nifty had an upward breakout again in 2014, so now four more years are remaining. In the earlier rally, it has been three times up that is from 2200 to 6000. If you calculate in terms of percentage, it is 300%. Consider 300% from 2014. I see nifty going at 18000 levels in the next coming 5 to 6 years. I keep on telling my clients since last year but everyone tells me that this market won’t grow more, it will slide. People kept on telling me 7000, or 7400 then 8000 is the end, but they are the ones who are missing the bus. The interview was a very knowledgeable experience. I want to thank Mr. Pankaj T. Bagal for all the knowledge & experience that he shared & for the time he provided for this interview. Mr.Bagal not just gave the answers but also showed how the trades are done, like a live trading session. He also suggested few investment avenues like Nifty Bees & Gold Bees. In the end, knowledge is what I derived from it. - Abhipray Kumbhare 66
  • 70. CONCLUSION (OBSERVATION) While it is time to rejoice at the booming Indian economy and the historical journey of the Sensex & Nifty, the foremost question in the minds of all investors is whether it is the right time to buy, hold sell stocks now. The main things to keep in mind are: 1. Don't be greedy: Invest smartly, with some professional help and some study on your own. 2. Avoid 'hot tips': Use your own judgement. 3. Avoid trading/timing the market: 'timing' leads to huge monetary losses and mental tension. 4. Avoid actions based on sentiments: Don't be emotionally attached to stocks. 5. Don't panic if the market drops: Be patient and hold on to the scrip until some stability prevails in the market. Consult a professional and then act accordingly. 6. Stay invested, possibly continue to invest more: It is natural to book profits with the markets at higher levels. This should be done, but we suggest people should also stay invested in the equity markets. Indian stocks do not appear overstretched at present. 7. Diversify: diversify a bit, looking at stocks, mutual funds, commodities and gold (for a longer- term). If equities pick up some of these stocks again. 8. Sell when value is realized: Some stocks may rise sooner than you may have anticipated. In a frenzied bull run, investors may see their target prices being met in a matter of days. Here time should not be of any consequence. 9. Keep a watch on relative valuations: The real cost of a stock is not the price you pay for it, but the opportunity cost of not putting your money in another stock with a greater potential to rise. 10. If you realize a mistake, exit: experts emphasize that if investors make mistakes, they should exit immediately even at a loss. 67 6.0
  • 71. Bibliography The various sources of information that were used, are as follows: Article/Study: I. Benchmark Indices of Indian Economy; by Rouf Mohommed Mir & Arshad Nabi Wani. II. A survey of factors influencing investment decisions: The case of individual investors at the BSE; by Dr. Vincent Mutswenje III. Forecasting of Indian stock market index using artificial neural network; by Manna Majumdar & MD Anwar Hussain. IV. Analysis of stock indices & their impact on market index; by Piyush Kumar Singh & Keyur Thaker. Websites: i. www.moneycontrol.com ii. www.ndtvprofit.com iii. www.bseindia.com iv. www.edelweiss.in v. www.asiaindex.co.in Applications:  Bing Finance  Moneycontrol  BSE India Newspapers:  Economic Times  ET Wealth News Channels:  ET Now Radio Channel:  100.7 FM Gold (Money Mantra) 68